Logistical Redesign of the Seat Supplying Process for Volvo Trucks, Europe
120
Logistics and Transport Management Master Thesis No. 2004:47 Logistical Redesign of the Seat Supplying Process for Volvo Trucks, Europe Ying Wang & Andres Castellanos
Transcript of Logistical Redesign of the Seat Supplying Process for Volvo Trucks, Europe
Logistics and Transport Management Master Thesis No. 2004:47
Logistical Redesign of the Seat Supplying Process for Volvo Trucks, Europe
Ying Wang & Andres Castellanos

Graduate Business School School of Economics and Commercial Law Göteborg University ISSN 1403-851X Printed by: Elanders Novum AB

Abstract Emerging markets have gained importance in today’s global business. Numerous opportunities are offered for companies looking for cheaper supply sources; Volvo AB as a global business group has not been indifferent to this trend, and it has turned toward these markets for component sourcing of different types. Now, Volvo Trucks has started to investigate the possible advantages of sourcing from emerging markets in the case of the seats for its trucks. This thesis is an inbound-logistics research. It studies the possibility of sourcing seat-components from emerging markets, under a logistics perspective. Based in the current situation of the seat supplying process for Volvo Trucks in Europe, 3 different alternatives are formulated in which the seat-components are sourced at the tier-2 level from emerging markets. The purpose of the project is to show whether or not the proposed alternatives offer significant potential cost-savings at adequate service levels over the current situation for Volvo 3P. The purpose is achieved by confronting the current situation with the proposed alternatives in terms of potential cost-savings and service levels. Findings, conclusions and recommendations resulting from this thesis aim at supporting the organization’s purchasing strategy, providing a solid base for future decisions. Key words: emerging markets, sourcing, purchasing, seat components, cost-savings, service levels, logistics, supply chain management.

Acknowledgements The past 5 months at Volvo 3P have been a valuable and incomparable experience for both of us. We have learnt so much in the process of doing this Master Thesis that the only word that can possibly express our feelings is THANKS. Thanks specially to our supervisors:
Maria Karlsson from Volvo 3P, for her constant and priceless guidance along each step of this journey, for sharing all her experience with us and for answering every question that crossed our minds;
Professor Leif Enarsson, from Göteborg University, for his solid guidance and instruction and for providing us with valuable advice during this thesis work.
Thanks to Volvo 3P and Hans Rieck, European Cab Purchasing Director at Volvo 3P, for giving us the opportunity of doing this project, and for how much we learnt through it. Thanks to all of you who at some moment took some time from your daily tasks to answer our inquiries: David Gallo, Johan Kaiser and Lennart Holm from EMS Project, Volvo; Christer Volny, Anders Gustafsson and Ingegerd Cederqvist from Volvo Logistics Sweden; Brady Qian from Volvo Logistics China; Harald Holmström, from Volvo Trucks Cab Manufacuring Plant; Ahuja Neetika and Harikrishna Rao from Volvo Trucks India; Torbjörn Johansson and Zheng Quan from Volvo SQA; Caroline Jiang and David Blondel from Volvo 3P, Shanghai; Charlotta Bergmark, from Volvo 3P, engineering; Philippe Moindrot, Laurent Deleville and Maria Lafallisse from Renault trucks in France ; Dan Svensson from Volvo Buses ; Peter Norrman, Andreas Boden, Michael Eckardt, Michael Delker, Ewa Nordström, Manuela Pajewski, Vincent Schmitt and Larry Blankenship from Volvo’s partner companies. Thanks to all of you for helping us overcome every obstacle on the way, thus making the achievement of the objectives of this thesis possible.

Thanks to our families for their never-ending support and help. Ying Wang and Andres Castellanos. January 2005.

Table of Contents 1. Introduction ....................................................................................................1
1.1 General background....................................................................................1 1.2 Company’s Background .............................................................................2
1.2.1 Volvo AB .............................................................................................2 1.2.2 Volvo 3P...............................................................................................3
1.3 Purpose........................................................................................................5 1.4 Problem Definition .....................................................................................5
1.4.1 Research Questions ..............................................................................6 1.5 Delimitations...............................................................................................7
1.5.1 Geographical delimitation....................................................................7 1.5.2 Product Delimitation ............................................................................8 1.5.3 Supplier Delimitation ...........................................................................8
2. Methodology ..................................................................................................9 2.1 Qualitative vs. Quantitative Research ........................................................9 2.2 Data Collection: Primary data and secondary data ..................................12
2.2.1 Secondary data ...................................................................................12 2.2.2 Primary data .......................................................................................13 2.2.3 Collecting the evidence in a case study .............................................14
2.3 Induction and Deduction ..........................................................................18 2.3.1 Induction.............................................................................................19 2.3.2 Deduction ...........................................................................................19
2.4 Validity and Reliability ............................................................................19 2.4.1 Validity...............................................................................................20 2.4.2 Reliability ...........................................................................................21
3. Theoretical Framework...............................................................................23 3.1 Logistics and Supply Chain Management................................................23
3.1.1 Logistics in the Global Organization .................................................23 3.1.2 Inbound Logistics...............................................................................24 3.1.3 Logistics Costs and Cost Drivers .......................................................25 3.1.4 Supply Chain Management ................................................................28
3.2. Purchasing................................................................................................29 3.2.1 The Goals of Purchasing ....................................................................29 3.2.2 Purchasing Tasks................................................................................30 3.2.3 Buying internationally........................................................................31
3.3 International Logistics ..............................................................................32 3.4 Logistics Service Levels ...........................................................................35
4. Empirical Study: Case at Volvo 3P ............................................................42 4.1 Introduction to the empirical study...........................................................42 4.2 Current situation of the seat-supplying process in Europe.......................44
4.2.1 Actors Involved ..................................................................................45
4.2.2 Current Material Flow........................................................................49 4.2.3 Information Flow ...............................................................................52 4.2.4 Service Considerations.......................................................................53
4.3 New situation of the seat-supplying process in Europe ...........................57 4.3.1 Potential Alternative 1: Emerging markets sourcing from Asia with final assembly in Umeå...............................................................................60 4.3.2 Potential Alternative 2: Emerging Markets component sourcing from Asia, subassembly in Eastern Europe and final assembly in Umeå. ..........65 4.3.3 Potential Alternative 3: Emerging markets component sourcing through CURRENT SUPPLIER.................................................................71
5. Analysis .........................................................................................................75 5.1 Estimation of the Potential Cost Savings .................................................75
5.1.1 Estimation of the total potential cost savings for each component ...76 5.1.2 Estimation of the total potential cost savings for Alternative 1 ........82 5.1.3 Estimation of the total potential cost savings for Alternative 2 ........84 5.1.4 Estimation of the total potential cost savings for Alternative 3 ........86
5.2 Service Levels Analysis ...........................................................................89 5.2.1 Transit Time.......................................................................................91 5.2.2 Lead Time ..........................................................................................91 5.2.3 Reliability...........................................................................................92 5.2.4 Accuracy ............................................................................................92
6. Conclusions and Recommendations...........................................................93 6.1 Conclusions ..............................................................................................93 6.2 Recommendations ....................................................................................95
References .........................................................................................................97
List of Figures Figure 1.1 – The Volvo AB Organization Chart Figure 1.2: Volvo 3P global locations Figure 2.1: Quantitative and qualitative methods and techniques Figure 2.2: Sources of primary data Figure 2.3: Induction and Deduction Figure 3.1: Relationships in the Supply Chain Figure 4.1: Model of a seat and its main components Figure 4.2: Volvo 3P within the Volvo Group Figure 4.3: Volvo 3P’s Organization Figure 4.4: CURRENT SUPPLIER’s products Figure 4.5: Current Material Flow of the seat-supplying process Figure 4.6: Routes and modes used for transportation of CURRENT SUPPLIER´s components for further assembly in Umeå Figure 4.7: Locations involved in the transport process of components to Umeå. Figure 4.8: Information flow in the present situation. Figure 4.9: Relationships in the Supply Chain between Volvo and its first and second tier suppliers Figure 4.10: Material Flow for alternative 1 Figure 4.11: Information Flow for alternative 1 Figure 4.12: Material Flow for alternative 2 Figure 4.13: Information Flow for alternative 2 Figure 4.14: Material Flow for alternative 3 Figure 4.15: Information Flow for alternative 3

List of Tables Table 2.1: Difference in emphasis in qualitative vs. quantitative methods Table 2.2: Sources of evidence in a case study

1. Introduction In this chapter, introductory aspects of the project will be discussed. The company’s background, the nature of the problem, the purpose of the project and its delimitations are covered in this chapter.
1.1 General background The Volvo brand is known around the world. It has business in several fields, being Volvo Trucks one of the group’s companies dedicated to the production of trucks of diverse types and capacities. Its production began in 1928, making it one of the group’s oldest business units. The acquisition of Renault Trucks (France) and Mack Trucks (United States of America) in January 2001 brought to the Volvo group significant opportunities in the market, as well as the big challenge to maintain each brand’s distinction in order to keep their current customers as well as to gain new ones. In 2003, the significant improvement across the three truck brands, Mack Trucks, Renault Trucks and Volvo Trucks, was largely related to increased margins due to price realization and cost rationalization1, showing capitalized opportunities from the acquisition. The Volvo group gained a larger portion of the truck market around the world, and 154.000 Trucks were sold by the three companies in 20032. Volvo 3P, business unit of Volvo AB, was formed in 2001 in order to capitalize the new synergies related to the larger volumes managed now by the group in the truck sector, not only in the outbound but also in the inbound side. Among Volvo 3P’s functions is the purchasing for the three truck brands. Purchasing supplies for Volvo Trucks, Renault Trucks and Mack Trucks, represents numerous challenges for Volvo 3P. Each brand has a specific market segment, Volvo being the most luxurious option and Mack the most vocational one. Additionally, there exist specific brand-related requirements for different parts depending on which brand and model they will be installed in. Purchasing within Volvo 3P is divided in different departments, each one in charge of one specific group of components: Cab, Chassis, Vehicle Dynamics and Electrical.
1 From the Volvo Group website, at http://www.volvo.com/group/global/en-gb/Volvo+Group/our+companies/volvotrucks/keyfactstrucks.htm 2 From Volvo group’s website at http://www.volvo.com/NR/rdonlyres/EF08F790-C034-40C6-95C6-6F46513C296B/0/3p_presentation.pdf
1
Among the myriads of components that are needed to make a truck, the seats for both the driver and the passenger are the ones on which this project focuses its attention. Millions of EURO are yearly spent in the seats, therefore, attempts aiming to reduce the seats’ landed cost have an essential importance for the company. In the case of the present project, carried out in the form of a Master Thesis, the focus lies on reducing the landed cost of the seats by looking at the seats at the component level. By finding lower costs for the components, the final cost of the seats should be reduced. Following worldwide trends to look at emerging markets as an appealing option to source from, this project intends to show Volvo 3P management feasible options for sourcing seat components from such markets. This is a first attempt to evaluate such an option; therefore the expected outcomes of this study are shown in the form of 3 different alternatives for a future situation of the seat supplying process for Volvo Trucks in Europe, each one considering different origins for the main components of the seat. As mentioned before, strong emphasis is made in countries considered as emerging markets. Each of the different alternatives must be analyzed and compared to the present situation in terms of potential cost savings and its effects in the service levels, so that at the end a clear picture can be presented to Volvo 3P management, with the respective conclusions and recommendations that every formal research project must include. This is, therefore, an inbound study of the seat-supplying process for Volvo Trucks in Europe, with strong emphasis in the component level and in emerging markets.
1.2 Company’s Background This thesis is developed at the cab Purchasing Department of Volvo 3P, a business unit within the Volvo Group (Volvo AB).
1.2.1 Volvo AB Volvo AB’s (the Volvo Group) official foundation date is April 14th, 1927, day in which the first series-manufactured Volvo car was driven through the factory gates. In 1928 Volvo Trucks were introduced in the market, having immediate success. By 1930, trucks had given the company financial stability, and Volvo had already acquired the Penta Group. Today, the Volvo Group is one of the world’s leading manufacturers of trucks, buses, construction equipment, marine and industrial engines and aerospace components. Its business areas are Volvo Trucks, Mack Trucks, Renault Trucks, Volvo Buses, Volvo Construction Equipment, Volvo Penta, Volvo
2

Aero and Volvo Financial Services. Volvo Cars was part of the group until 1999, when it was sold to the Ford conglomerate pursuing the benefits of adding to a larger automotive group (Ford, Lincoln, Mercury, Mazda, Volvo, Jaguar, Land Rover and Aston Martin are part of Ford Motor Company). Several business units provide the group with additional manufacturing development or logistical support. The largest business units are: Volvo 3P, Volvo Power-train, Volvo IT, Volvo Logistics, Volvo Parts and Volvo Technology. Volvo AB has today approximately 76,000 employees, production in 25 countries and operates in more than 130 markets all over the world.
1.2.2 Volvo 3P Volvo 3P’s responsibility within the Volvo Group covers product planning, product development, purchasing and product range management for the three truck companies, Mack Trucks, Renault Trucks and Volvo Trucks. The following figure -- The Volvo AB Organization Chart-- illustrates the business organization of the Volvo group, and shows the coverage of Volvo 3P.
Volvo AB
Mack Trucks
Volvo Aero
Financial Services
VolvoPenta
VCE Buses
Volvo Trucks
Renault Trucks
Business unit Volvo 3P
Figure 1.1 – The Volvo AB Organization Chart. (Source: Volvo Group website).
Volvo 3P combines the resources of the three truck companies in the areas of Product Development, Product Planning, Purchasing and Product Range Management. Volvo 3P’s mission is "To propose and develop profitable products to ensure a strong competitive offer for each truck company based on common vehicle architecture and shared technology". Volvo 3P has global presence. Figure 1.2 shows the different locations of Volvo 3P around the world.
3

Figure 1.2: Volvo 3P global locations. (Source: Volvo Group website). Volvo 3P has 2.800 employees in charge of supporting the three truck companies. Volvo Trucks, Renault Trucks and Mack Trucks. Volvo’s truck production started in 1928 and today they are the world’s third largest producer of heavy trucks. Trucks of more than 16 tons account for over 95 % of the total production. Volvo Trucks’ (VT) products are marketed in more than 130 countries, with most sales in Western and Eastern Europe and North and South America and Asia. Volvo's market share for heavy trucks in year 2003 was 15.2 % in Western Europe (>16 tons) and 9.4 % in North America (>15 tons)3. Renault Trucks is one of the largest European manufacturers of commercial vehicles. Their product line goes from light trucks for urban distribution services to special vehicles and heavy trucks for long-haul operations. Renault Trucks’ (RT) market share in Western Europe is 13.2% for heavy trucks (>16 tons), and 11,0% in the 6-16 ton category (2002 figures). Renault has six production sites in Europe with its headquarters in Lyon, France4.
3 From Volvo group’s website at http://www.volvo.com/group/global/en-gb/Volvo+Group/our+companies/volvotrucks/ 4 From Volvo group’s website at http://www.volvo.com/group/global/en-gb/Volvo+Group/our+companies/Renaulttrucks/
4

Mack Trucks Inc is one of the largest manufacturers of heavy trucks in North America. It was founded in 1900 by Jack and Gus Mack, and focused on commercial vehicles from the beginning. Today, Mack is one of the strongest heavy-truck brands and the indisputable leader in the vocational segment of the North American market. Their product line includes heavy-duty trucks, which are sold and serviced in more than 45 countries worldwide, being especially strong in Latin America and Australia. In 2003, Mack Trucks delivered to the market 18.000 trucks, Renault Trucks 61.000 and Volvo Trucks 75.000, for a total of 154.0005 units sold by three companies.
1.3 Purpose The main purpose of this thesis is To determine whether or not the proposed alternatives for the seat supplying process bring significant advantages for Volvo 3P over the current situation. These advantages will be defined in terms of potential cost savings as well as some important considerations regarding the service levels. For this goal the new situation must be first understood and described. Additionally, the possible alternatives must be defined, and the potential costs-savings they offer must be estimated, so that a proper comparison can be made.
1.4 Problem Definition As mentioned in section 1.1, General Background, one of the most important and valuable parts in the cab is the seat. It is a comparatively expensive product compared to other parts in the cab and it is of great importance and value for the driver, considering that it is on the seat where the drivers spend most of their time. Some may even state that the driver’s seat is the most important truck component. Therefore, strong attention is put into attempts aiming at reducing the procurement cost of the seats. CURRENT SUPPLIER6 has for 28 years made seats for Volvo Trucks Europe (VTC), and they are today the company’s main seat supplier.
5 From Volvo group’s website at http://www.volvo.com/NR/rdonlyres/EF08F790-C034-40C6-95C6-6F46513C296B/0/3p_presentation.pdf 6 On this project, the term CURRENT SUPPLIER will replace Volvo’s main seat supplier’s name.
5

Global-sourcing trends have made companies look at emerging markets when looking for cheaper supplies, due in part to the lower labor costs, and therefore lower total costs that can be achieved by producers located there. Among the emerging markets, Asian countries like India and China, as well as Eastern European countries are main actors, among many more countries. Volvo, as a global company, is not indifferent to these trends and has started to investigate the possible advantages of sourcing from Emerging markets in the case of the seats to be installed in the trucks produced in Europe (Volvo Trucks). Thus, this research will study the possibility to source seats or seat-components from emerging markets like Eastern Europe, India and China. Furthermore, Volvo 3P needs to research on the costs and implications of bringing the seats or components produced in emerging-market countries into the European market. For this end, a few detailed alternatives of the possible flows must be designed and its potential cost savings estimated, with the intention that they can be compared against the current situation with the seats supplied by CURRENT SUPPLIER, so that further action can be taken. If there is enough evidence that sourcing components or seats from emerging markets can bring the cost of the seats lower than that offered by CURRENT SUPPLIER, the situation of Volvo 3P would improve significantly.
1.4.1 Research Questions In order to achieve the purpose of the project, several research questions are formulated. Main Research Question According to the problem background and the purpose of this thesis, the main research question is: Do the proposed alternatives offer significant potential cost savings, at adequate service levels, over the current situation for Volvo 3P regarding the seat supplying process for Volvo Trucks in Europe? In order to answer the main research question, some research sub-questions must be first responded.
6

Research Sub-question A As a first part of this work, the present situation for the seat supplying process for VTC must be fully understood and described. In the current situation only seats supplied by CURRENT SUPPLIER are considered. Basic aspects like the physical flow of the seat-components along the whole pipeline, as well as the flow of information and the service levels, shall be explained in detail. Sub-question A is What is the present situation of the seat supplying process for Volvo Trucks Europe? Research Sub-question B Once the current situation is fully described, the potential alternatives must be designed following similar parameters. Basic aspects like the physical flow of the seat-components, as well as the information flows and service levels will be explained in detail. The main task in this case will be to design these alternatives in order to be able to describe them in detail. In addition, the potential cost savings must be estimated for the same seats used in the current situation. Sub-question B is What will be the situation of the seat supplying process for Volvo Trucks in Europe in each of the potential alternatives?
1.5 Delimitations Some delimitations must be defined so that the scope of this project is clear for the reader.
1.5.1 Geographical delimitation This research will only focus on Volvo’s European operations. Only Volvo Trucks Europe will be considered in this thesis, although its findings and methods are applicable to the other brands served by Volvo 3P (Renault Trucks and Mack Trucks).
7

1.5.2 Product Delimitation Volvo 3P buys numerous types of seats for VTC (more than 200 part numbers in total), divided in families; each family consisting on several part numbers for the customer to choose from. Since the purpose of this study is to establish a comparative approach, some specific seats will be defined (one or two best sale seats in EU market) so that a proper comparison can be made. Additionally, of all the components that make a seat, special attention will be given to those few components with a comparatively high price and savings potential for the component analysis. These components will are referred to as Main Components throughout this document.
1.5.3 Supplier Delimitation Even though there are several suppliers providing seats to Volvo Trucks Europe, CURRENT SUPPLIER is the main seat supplier for Volvo Trucks in the EU market in the present situation. Therefore, in the current situation this study will consider only this supplier. Additionally, suppliers in emerging markets such as China and India are considered during this study, keeping in mind that not all the potential suppliers can be considered due to the restrictions in time and resources.
8

2. Methodology In this chapter the research-methodology used to reach the purposes set for this thesis is described.
2.1 Qualitative vs. Quantitative Research The Qualitative approach is the approach of finding a totality; personal experiences form a more comprehensive understanding. Qualitative research has the purpose of understanding and analyzing an overall picture. Qualitative research explores attitudes, behavior and experiences through methods such as interviews or focus groups. It attempts to get an in-depth opinion from participants. Fewer people take part in the research, and the contact with these people tends to last longer than in quantitative research7. The Quantitative method means that the object can be studied on a broad base. Questionnaires are most commonly used within quantitative research, which are sent out to selected groups within a general population. Quantitative research provides the possibility of drawing up general conclusions about a population. It is used when conducting statistical conclusions is necessary to achieve the objective. Quantitative research generates statistics through the use of large-scale survey research, using methods such as questionnaires and structured interviews. This type of research reaches more people, but the contact with those people is much quicker than in the qualitative research8. The main difference between qualitative and quantitative research is not quality but procedure. In qualitative research, findings are not arrived at by statistical methods or other procedures of quantification. The difference is not simply a question of quantification either. It is also a reflection of different perspectives on knowledge and research objectives. In some studies, data may be quantified, but the analysis itself is qualitative, such as census reports. Similarly, it is quite common for researchers to collect their data through observations and interviews, methods that are normally related to qualitative research. But their research may code the data collected in a way that would allow statistical 7 Dawson, Catherine, “Practical research Methods, a user friendly guide to mastering research techniques and projects”, How to Books, 2002. 8 Dawson, Catherine, “Practical research Methods, a user friendly guide to mastering research techniques and projects”, How to Books, 2002.
9
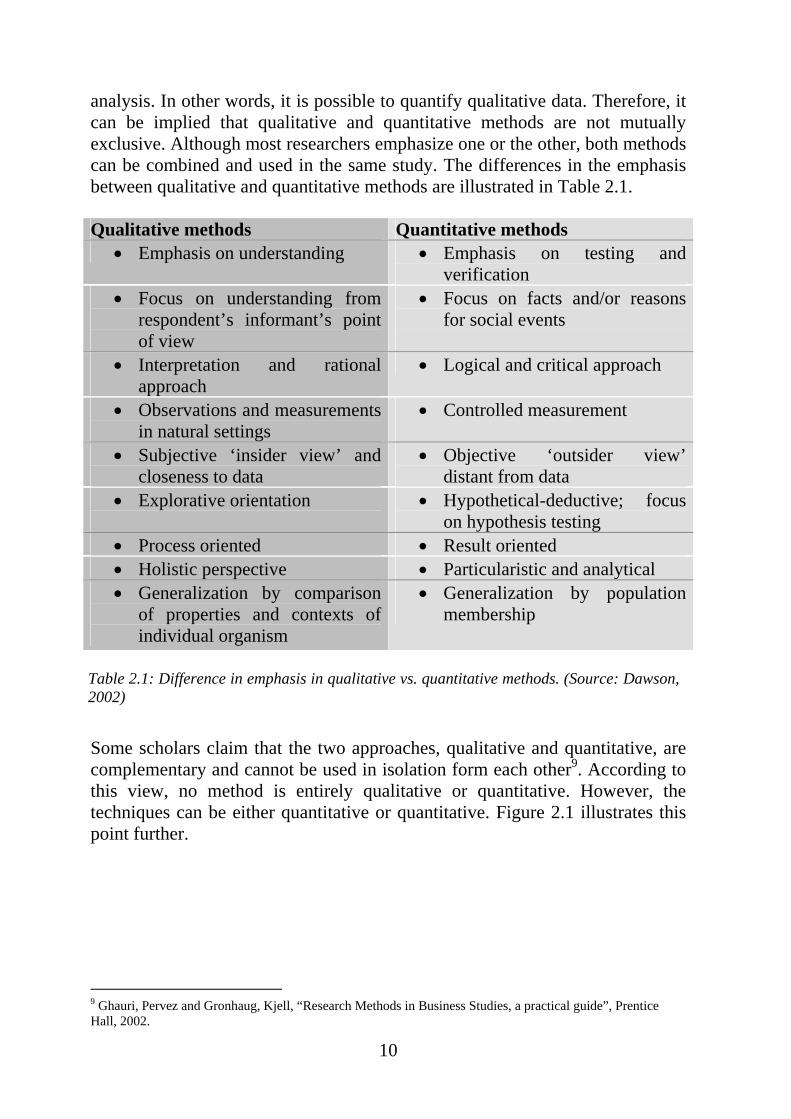
analysis. In other words, it is possible to quantify qualitative data. Therefore, it can be implied that qualitative and quantitative methods are not mutually exclusive. Although most researchers emphasize one or the other, both methods can be combined and used in the same study. The differences in the emphasis between qualitative and quantitative methods are illustrated in Table 2.1. Qualitative methods Quantitative methods
• Emphasis on understanding • Emphasis on testing and verification
• Focus on understanding from respondent’s informant’s point of view
• Focus on facts and/or reasons for social events
• Interpretation and rational
approach • Logical and critical approach
• Observations and measurements in natural settings
• Controlled measurement
• Subjective ‘insider view’ and closeness to data
• Objective ‘outsider view’ distant from data
• Explorative orientation
• Hypothetical-deductive; focus on hypothesis testing
• Process oriented • Result oriented • Holistic perspective • Particularistic and analytical • Generalization by comparison
of properties and contexts of individual organism
• Generalization by population membership
Table 2.1: Difference in emphasis in qualitative vs. quantitative methods. (Source: Dawson, 2002)
Some scholars claim that the two approaches, qualitative and quantitative, are complementary and cannot be used in isolation form each other9. According to this view, no method is entirely qualitative or quantitative. However, the techniques can be either quantitative or quantitative. Figure 2.1 illustrates this point further. 9 Ghauri, Pervez and Gronhaug, Kjell, “Research Methods in Business Studies, a practical guide”, Prentice Hall, 2002.
10

Qualitative
Quantitative
TECHNIQUES
red and mi-structured
s,etc.
TECHNIQUES
• Structured observation
• Structured interviews
• Structured surveys
• Attitude scaling
• Field equipment
METHODS
Historical review
Group Discussion
Case Study
Survey Experiment
In the light of theoretical definitions, it can be said that in this project mainly qualitative methodology will be applied, through interviews, although quantitative research will also be used to the extent that some cost calculations are necessary in order to achieve the purpose of this thesis. Neither the use of large-scale surveys nor the generation of statistics about this subject of study10 is expected. Instead, it is expected to fully understand the current situation of a process, as well as all the factors that determine it, so that a new situation for such process can be defined and further compared to the present one. Furthermore, it can be stated that this thesis should be considered as a case study. Case study refers to the collection and presentation of detailed information about a particular participant or small group. A form of qualitative descriptive research, the case study looks intensely at an individual or small participant pool, drawing conclusions only about that participant or group and only in that specific context. The present case study includes a collection and presentation of detailed information about the seat supplying process for VTC, a small group within the big structure of Volvo AB. The conclusions drawn from this thesis apply only to the specific process and under the delimitations previously explained, although the methods and findings of this project can be applied to Renault Trucks and Mack Trucks.
10 Dawson, Catherine, “Practical research Methods, a user friendly guide to mastering research techniques and projects”, How to Books, 2002.
•Conversation
•Unstructuseinterview
Qualitative
Quantitative
NIQUES
red and mi-structured
s,etc.
TECHNIQUES
• Structured observation
• Structured interviews
• Structured surveys
• Attitude scaling
• Field equipment
METHODS
Historical review
Group Discussion
Case Study
Survey Experiment
TECH
•Conversation
•Unstructuseinterview
Figure 2.1: Quantitative and qualitative methods and techniques. (Source: Pervez and Gronhaugh, based on Jankowicz (1991: 159)).
11
2.2 Data Collection: Primary data and secondary data According to Pervez Ghauri and Kjell Gronhaug, there are more relevant data available than most researchers would believe. Researchers need to look at several sources for data availability on the topic/area of study in question. Once these sources have been located, they need to look for data on their specific research problem and make a judgment whether the information available can be used or not. Many research students underestimate the amount of data available from secondary sources. Therefore, researchers need first to look for secondary sources relevant to their research problem before going out to collect their own data.
2.2.1 Secondary data Data previously gathered by someone other than the researcher and/or for some other purpose than the research project at hand are called secondary data. Secondary data for this project come from:
• Internet sites and web pages of different companies and organizations. • Rules on international trade regarding imports and exports, and policies
on foreign direct investment (for example, http://www.acheteur.cn/inconterms_2000.htm)
• Academic as well as organizational journals and newsletters relevant to the problem area;
• Historical studies regarding the development of a particular discipline or problem area;
• Textbooks and other published material directly or indirectly related to the problem area;
• Companies’ sales data; • Reports written by other students from different academic institutions.
Advantages of secondary data The most obvious advantage of secondary data is the enormous savings in time and money. The researcher needs only go to the library and locate and utilize the sources. The verification process is more rapid and the reliability of the information and conclusions is greatly enhanced. Another advantage of consulting secondary data is that it can suggest suitable methods or data to handle a particular research problem. Moreover, it provides
12

a comparison instrument with which we can easily interpret and understand our primary data. Considering all these advantages, many scholars recommend that all researchers should, in fact, start with secondary data sources. As Churchill (1999:215) put it, “ Do not bypass secondary data. Begin with secondary data, and only when the secondary data are exhausted or show diminishing returns, proceed to primary data.” Disadvantages of secondary data Apparently, there are some drawbacks in working with secondary data. One of them is that these data are collected for another study with different objectives and may not completely fit “our” problem. It is therefore of utmost important to identify what is being studied, what is already known about the topic, and what needs to be known about it. Another problem is that it is the responsibility of the researcher that data are accurate. The researcher has to consult and refer to the original source and not to what has been collected from an intermediate or third-hand report.
2.2.2 Primary data When secondary data are not available or are unable to help answer the given research questions, the researcher him/herself must collect the data relevant to his/her particular study and research problem. These data are called primary data. There are several choices as regards the means of collecting primary data. Normally, this includes observations, experiments, surveys (questionnaires) and interviews as illustrated by Figure 2.2).
Primary data
Experiment Communication
Natural
Settings
Contrived
settingsMails Phone,
emailPersonal
ObservationHuman Mechanical
Primary data
Experiment Communication
Natural
Settings
Contrived
settingsMails Phone,
emailPersonal
ObservationHuman Mechanical
ObservationHuman Mechanical
Figure 2.2: Sources of primary data. (Source: Pervez and Gronhaugh, 2002).
13

Advantages of primary data The main advantage of primary data is that they are collected for the particular project at hand. This means that they are more consistent with the specific research questions and research objectives. It can be hardly learnt about opinions and behavior without asking questions directly to the people involved. Data/information on past events or experience can only be gathered by asking people who have been involved or have observed and can remember the particular event. In the case where data can be collected trough surveys or telephone interviews, a large geographic area can be covered with relatively little cost. Disadvantages of primary data The main disadvantage is that primary data can take a long time and can cost a lot to collect. Moreover, it is difficult to get access: to find consumers or other target groups who are willing to cooperate and answer the necessary questions. This is particularly difficult when dealing with sensitive issues or research questions. In this specific project, for instance, the suppliers are commonly reluctant to give information about the cost of the components, which is necessary for this research. Thus, the quality and scope of the information gathered through primary sources are fully dependent on the willingness and ability of the respondents.
2.2.3 Collecting the evidence in a case study11
Data collection for case studies can rely on many sources of evidence. Six important ones are documentation, archival records, interviews, direct observation, participant-observation and physical artifacts. Table 2.2 shows their comparative weaknesses and strengths; however, it must be clear that no single source has a complete advantage over all the others. In fact, these sources are complementary and the researcher should use as many sources as possible in order to make the study more thorough. Source of evidence Strengths Weaknesses Documentation Stable – can be reviewed
repeatedly. Unobtrusive – not created as a result of the case study. Exact – contains exact names, references and details of an event
Retrievability – can be low. Biased selectivity – if collection is incomplete. Reporting bias – reflects unknown bias of the author. Access – may be deliberately blocked.
11 Yin, Robert, ”Case Study Research, Design and Methods”, second edition, SAGE Publications, 1994.
14

Broad coverage – long span of time, many events, many settings
Archival records [Same as for documentation] Precise and quantitative
[Same as for documentation] Accessibility due to privacy reasons
Interviews Targeted – focuses directly on the case study topic Insightful – provides perceived causal inferences
Bias due to poorly constructed questions Response bias Inaccuracies due to poor recall Reflexivity – Interviewee gives what interviewers want to hear Cost – hours needed by human observers.
Direct Observations Reality – covers events in real time Contextual – covers context event
Time-consuming Selectivity –unless broad coverage Reflexivity – event may proceed differently because it is being observed Cost – hours needed by human observers.
Participant observation [Same as for direct observations] Insightful into interpersonal behaviour and motives
[Same as for direct observations] Bias due to investigator’s manipulation of events
Physical artefacts Insightful into cultural features Insightful into technical operations
Selectivity Availability
Table 2.2: Sources of evidence in a case study, (Source Yin (1994)).
Documentation Documentary information is likely to be relevant to every case study topic. Documentary evidence can take many forms: • Letters, memoranda and other communications. • Agendas, announcements and minutes from meetings, as well as other
written reports of events. • Administrative documents – proposals, progress reports and other internal
documents. • Formal studies or evaluations of the same “site” under study • Newspaper clippings and other articles appearing in the mass media Documents often play a significant role in any data collection during case studies, although the researcher in charge must be careful in order not to be misled by documents. He must consider that a specific document was written for some specific purpose and audience, other than those of the particular case study. Documentation can, in fact, be catalogued as secondary data.
15

In this thesis the authors turn to several documents like former studies done for Volvo 3P and informative bulletins posted in both electronic and written format, when establishing the current situation of the seat-supplying process. Additionally, several texts are used for the theoretical framework and introductory chapter. Archival records Archival records can take the following forms: • Service records – such as number of clients served over a given period of
time. • Organizational records – such as organizational charts. • Maps and charts of the geographic characteristics of a place. • Lists of names and other relevant data. • Survey data, such as census records or data previously collected about a site. • Personal records such as calendars and telephone listings. Archival records’ relevance is not always as important and relevant for all case studies. For some case studies, records can be of significant importance, while for others can be of reduced significance and mainly of supportive relevance. Similarly, the conditions under which archival evidence was collected must be considered when deciding on its relevance. The accuracy of the source, as well as the purpose and audience for which the data were collected, must be weighted during the study. Archival data, in the form of sales volumes, organizational charts, maps and lists of relevant items, are often used for description and decision matters in this project. Interviews Interviews are one of the most important sources of information for case studies. Interviews can take several forms. Usually they are of an open-ended nature, in which respondents can be asked about facts of a matter as well as about their opinions about events. In cases, respondents can even be asked to propose their own insights into certain aspects. The more than a respondent provides its own insights, the more they can be considered as informants. Key informants can be vital for the success of a case study. At the same time, the investigator must be careful not to rely solely on one key informant, because of the potential interpersonal influence that can occur, often unnoticed. This can be prevented
16
by relying on other sources of evidence to corroborate the insights provided by a key informant. Other types of interviews are: Focused interview, in which a respondent is interviewed for a short period of time. These interviews can remain open ended, although usually a certain set of questions is followed during these interviews. Survey interviews, in which more structured questions are used, more in line with formal survey procedures. Overall, interviews are essential sources for case studies because most case studies deal with human affairs. In this thesis interviews are extensively used, as main information sources. Key respondents are interviewed from all the companies involved in the seat-supplying process for Volvo in Europe, both in the current situation description and the formulation of the new alternatives. They are considered vital since the information provided by them is the base for the final analyses and formulations of this thesis. Direct Observations Mainly possible through field visits to the study site. These observations can range from strictly formal to casual. Observational evidence can be invaluable for a case study, providing a more clear picture of a given process or activity, maybe even of a behavior. In this thesis direct observations will not be extensively used, due to the impossibility to travel to the locations of all the actors involved, most of them companies outside the Volvo Group. However, some direct observation might take place at the Volvo Truck Assembly Plant in Gothenburg, where the cabs, and more precisely the seats, could be observed in detail. Participant-Observation In this modality of observation, the researcher is not a merely a passive spectator, but may assume a variety of roles within the case study and may actually participate in the events being studied. Participant observation brings a trade off between the potential benefits (better understanding of the situation, active role in the research) and the potential
17

threats (loss of impartiality, lack of time to raise the right questions), which has to be considered when undertaking this participant-observation study. In this thesis, participant-observations are used to great extent. The authors spend a lot of time at Volvo 3P’s offices as interns. This allows having first-hand information as well as a complete picture of the activities and details related to the process object of study. This situation is regarded as one that brings great benefits to the present study, enabling the authors to count on reliable and direct information at all times. Physical artifacts A physical or cultural artifact is a technological device, a tool, a work of art or some other type of physical evidence. These may be collected as part of a field visit and are usually used extensively in anthropological research. In this thesis, physical artifacts are not expected to be of great use, if any at all.
2.3 Induction and Deduction There are two ways of establishing what is true or false and to draw conclusions: induction and deduction. Induction is based on empirical evidence, while deduction is based on logic.
Laws and Theories
Facts acquired through observation
Explanations and predictions
INDUCTIO
N DEDCTION
Laws and Theories
Facts acquired through observation
Explanations and predictions
INDUCTIO
N DEDCTION
Figure 2.3: Induction and Deduction (Source: Ghauri, P., Gronhaug, K., Research Methods in Business Studies)
Figure 2.3 shows that induction and deduction present two alternative ways or stages of building theories.
18

2.3.1 Induction12
Through induction people draw general conclusions from their empirical observations. This process goes from assumption to conclusions. It is important to keep in mind that since conclusions are based on some empirical observations, conclusion could not be hundred percent true. Sometimes, conclusions based on hundreds of observations can also be wrong. When people utilize observed facts in generating a theory, which is consistent with these facts, they are doing induction. In other words, induction is the process of observing facts to generate a theory and is perhaps the first step in scientific methods.
2.3.2 Deduction13
Deduction means people draw conclusions through logical reasoning, which means it need not be true in reality, but it is logical. In deduction, people look at the consequences of a theory. Deduction involves gathering of facts to confirm or disprove hypothesized relationships among variables that have been deduced from propositions. Discussion on induction and deduction presents two alternative ways or stages of building theories. Most researchers and scientists believe that they have been using both of these in their research. In this project, both approaches, induction and deduction, will also be implemented as methods to reach the purpose. The comparison between present situation and three alternatives will be reached based on the observation on current supplier and potential second-tier suppliers. Using the quotations given by those potential second-tier suppliers, conclusion will come and show whether the three new alternatives will bring significant advantage over current situation or not. By this way, induction is implemented. At the meantime, it is well known that savings could come from those emerging markets because of their lower labor cost, and this case will show the possibility of bringing seat components from different emerging markets, like China, India and Eastern Europe. So, logically, savings will be expected to come out. Here, deduction is also implemented.
2.4 Validity and Reliability When something is being measured, we want valid measures, i.e. measures capturing what they are supposed to. Validity refers to what extent the
12 Ghauri, P., Gronhaug, K., Research Methods in Business Studies 13 Ghauri, P., Gronhaug, K., Research Methods in Business Studies
19

researcher measures that which was the objective of the study; reliability refers to the measure of the authenticity of the instrument of measurement.14
2.4.1 Validity Before going to the forms of validity, some words should be dedicated to the construct validity. Construct validity is crucial and can be defined as “…the extent to which an operationalization measures the concept which it purports to measure”15. Construct validity is necessary for meaningful and interpretable research findings and can be assessed in various ways.
• Face validity tells us to what extent the measure used seems to be a reasonable measure for what it purports to measure. A simple test for face validity is to ask for the opinion of others acquainted with the actual topic.
• Convergent validity tells us to what extent multiple measures of and/or multiple methods for measuring the same yield similar (comparable) results. Co-relational techniques are often used to assess convergent validity.
• Divergent validity tells us to what extent a construct is distinguishable from another construct. If a researcher measures, say, “ innovativeness”, he or she should be confident of not measuring another construct, e.g. “organizational resources”.
There are three forms of validity. These are Internal Validity, Statistical conclusion validity and external validity. Internal Validity Internal validity refers to the extent to which we can infer that a causal relationship exists between two (or more) variables. A correlation between two variables does not as such indicate that there is a causal relationship, as the correlation coefficient does not tell us anything about direction, nor whether it is influenced by other factors. However, even in co-relational research we might be interested in knowing whether a correlation coefficient between two variables is “true” without being concerned whether a causal relationship is present. Then, we need to control for and rule out the impact of other possible factors. 16
14 Winter, J. (1987), Problemformulering, undersökning och rapport, Stockholm: Liber AB 15 Zaltman et al., 1997:44 16 Ghauri, Pervez and Gronhaug, Kjell, “Research Methods in Business Studies, a practical guide”, Prentice Hall, 2002.
20

Statistical conclusion validity In order to prove a casual relationship (or a co-variation) it must also be statistically significant. Thus, statistical conclusion validity is a prerequisite for making inferences about causal relationships (and covariance) at all. To prove statistical conclusion validity, the study must be sufficiently sensitive to do so. External Validity External validity relates to what extent the findings can be generalized to particular persons, settings and times, as well as across types of persons, settings and times. For example, when conducting an election poll, external validity is usually used as a basis for generalizing the population of voters. It should also be noted that if the study lacks construct validity the findings are meaningless, destroying also the internal and external validity of the findings! Internal validity is achieved in this study through the use of valid and relevant criteria for the comparison of the current situation and the new alternative, such as costs and service levels. External validity is not too relevant, since all outcomes of this study concern mainly Volvo’s interests, and their generalization could be possible to similar products or supplies within the company, maybe not so much for another company. After the potential new alternatives are designed, they will be compared with the present situation. The comparison is mainly based on estimated cost savings and service level. If it is found that Volvo can obtain significant savings with any new alternative, there will be several variables that may be casual for those savings (also a variable). Those variables could be labor costs, transportation costs, etc. Then, internal validity can be sought in order to see the extent to which it can be inferred that a casual relationship exits between those variables.
2.4.2 Reliability Reliability means consistency. Applied to educational settings, this means that if we use a test or other data collection process to evaluate a person's performance with regard to a research variable, our evaluation of that person's performance should be the same on different occasions - unless, of course, something happened between the occasions which would legitimately cause our evaluation to be different on the second occasion17. Reliability is an indicator of score consistency over time or across multiple evaluators. Reliable assessment is one in which the same answers receive the
17 From the Internet, at http://education.calumet.purdue.edu/vockell/research/workbook/workbook5.htm#Unit1
21

same score regardless of who performs the scoring or how or where the scoring takes place18. In simple words, reliability is the extent to which an experiment, test, or measuring procedure yields the same results on repeated trials19. According to the theory, if an evaluation or research project is to be considered as a reliable one, its results should be the same, or fairly similar, to the results obtained by a different evaluator or researcher performing a similar study. Applying these concepts to this project, it can be stated that reliability is achieved. As the purpose of this thesis is to formulate a new alternative or a few for a process in order to compare it to the present situation, the outcome of this study will be an objective comparison between the two cases. Cost savings and service levels are expected to be decisive factors in the comparison. Under this perspective, if some other researcher were to make the same comparison, his/her conclusions should be fairly similar to the ones shown on this project. Things would be different if another researcher were to carry out the totality of this study on his/her own. Since this project includes the design and formulation of a new situation for a current process, different researchers, given the same limitations and conditions encountered during this thesis, would most likely formulate many different new alternatives. However, the authors of this thesis strongly believe that different researchers would still use similar parameters to the ones used on this project when comparing the two situations: cost savings and service levels.
18 From the Internet, at http://www.ncrel.org/sdrs/areas/misc/glossary.htm#reliab 19 From the Internet, at http://www.m-w.com/cgi-bin/dictionary?book=Dictionary&va=reliability
22
3. Theoretical Framework The theoretical framework chapter contains the theory that will support this research. This research is aimed to redesign the supplying process of seats for VT from a logistics perspective, responsibility that relies upon the purchasing department at Volvo 3P. Since the process includes close interaction with suppliers, supply chain management basics, purchasing, international logistics and service levels are included in this chapter.
3.1 Logistics and Supply Chain Management Logistics and supply chain management principles constitute the natural underlying base for the development of this project, as well as for the analysis that will further allow the achievement of the purpose previously set. A first view to the logistics in the global organization is aimed at setting a basic understanding for the reader, so that the importance of business logistics, or logistics in an organization, can be fully understood. Given the inbound nature of this thesis a deep view at the inbound side of business logistics is presented next; inbound logistics have similarities as well as differences in its nature in relation to outbound logistics. A discussion regarding logistics costs and cost drivers follows, in an attempt to understand the impact of logistics costs within the total costs of any organization. Finally, supply chain management basics are discussed in order to set the way of thinking that needs to be followed in today’s business environment, in which companies no longer compete against companies, but instead, in which supply chains compete against supply chains.
3.1.1 Logistics in the Global Organization As the world’s markets become more open, managers are finding that new ways of doing business are necessary both to fully exploit the opportunities available as well as to guard against emerging threats to corporate success. The traditional international or multinational approach to business concentrates largely on geographic markets, developing a distinct marketing mix for each one. Global organizations look at the whole world as one potential market sourcing, manufacturing, researching, raising capital, and selling wherever the job can be done best. Logistics is a particularly powerful management tool in a global organization because it is an approach to doing business that works anywhere. By understanding the basic of logistics management and how to put together a logistics system responsive to customer requirements, managers will be better able to deal with the unique challenges inherent in doing business outside the confines of their own country.
23
The logistics system provides the means for moving goods from their point of origin to their point of consumption. The various activities---Material management, Inventory, Warehouse, Information systems, Transportation, Customer service must be performed together in order to meet customers’ needs at the lowest cost.
3.1.2 Inbound Logistics20 The objective of logistics management on the inbound side of the production line is the same as it is on the outbound side: to provide a given level of customer service at the lowest total cost. Nowadays, the changing nature of global competition is forcing firms to dedicate more attention to materials management than ever before. Despite the generally similar nature of inbound and outbound logistics operations, there are some significant activities that could comprise a firm’s inbound logistics system. a. Purchasing/ Receiving Customer service Customer service is somewhat multi-dimensional because, in one sense, the firm is the customer. That is, the company is purchasing raw materials, component parts, etc. for transformation into finished goods. Thus, the organization is receiving customer service rather than providing it. However, management must keep in mind that decisions made regarding flows into the production process also impact the final customer in terms of the cost, quality, and availability of the finished product. b. Transportation There are several significant differences between the movement of raw materials, component parts, and subassemblies inbound and finished goods outbound. The first, the basic differences in the nature of the items moved often require the use of different equipment at inbound as opposed to outbound. Second, firms often exercise less control over their inbound transport because delivery is included in the price of the goods and is under the control of the sellers. Finally, the demand for inbound transportation tends to be more stable than the requirement for finished goods movement because production rather than inherently variable market forces dictate the need for raw materials. c. Inventory Management
20 Gourdin, Kent, “Global Logistics Management, a competitive advantage for the new millennium”, Blackwell Business, 2001.
24

Inventory concerns are virtually the same whether dealing with raw materials or finished goods. Managers want to meet customer needs while minimizing the cost of holding inventory. Essentially, the expenses incurred in stopping production are the costs that result when a stock-out occurs. And these costs can be very high. d. Warehousing and storage Raw materials must be stored on, or very close to, the manufacturing site whereas finished goods can often be positioned closer to the market. As was mentioned earlier, handling and storage requirement for raw materials tend to be quite different from those of finished goods. And costs are still a concern on the inbound side because the products themselves are often of little value. e. Maintenance Maintenance refers to all of the actives associated with the servicing and repair of equipment. In a manufacturing firm, the assembly lines must be serviced and maintained, although maintenance here tends to be a much smaller part of the organizations’ overall logistics effort. f. Information management In the former instance, managers collect and utilize information to smooth the flow of raw material into the production process. And normally, much of the data that is initially captured on the inbound side will be repeatedly utilized throughout the organization as various analyses, forecasts, and other unforeseen problems are dealt with. Thus, the quality of the data coming in has a profound and lasting effect on the entire logistics system. g. Production Production turns raw materials into the finished goods customers’ desire. Thus it has a direct impact on not only the organization’s demand for raw material and component parts, but also the level of customer satisfaction the firm is able to deliver. However, managers are realizing that customer needs should drive the organization’s efforts, not production.
3.1.3 Logistics Costs and Cost Drivers Because logistics costs can account for such a large proportion of total costs in the business it is critical that they be carefully managed. However, it is not always the case that the true costs of logistics are fully understood. Traditional approaches to accounting based upon full-cost allocation can be misleading and dangerous. Activity-based costing methods provide some
25

significant advantages in identifying the real costs of serving different types of customers or different channels of distribution. Logistics management impacts not only upon the profit and loss account of the business but also upon the balance sheet. Logistics is also increasingly being recognized as having a significant impact upon Economic Value Added. It is likely that in the future, decisions on logistics strategies will be made based upon a thorough understanding of the impact they will have upon the financial performance of the business. Logistics costs 21 encompass transportation, warehousing, and inventory carrying costs. It's a significant expense item for organizations that manufacture, distribute, or offer products at retail. Depending on the industry and type of services used, the following approximate expenses can be expected: 7%-10% of net sales for all logistics, 4%-7% of sales for transportation services, and 2%-4% of sales for warehousing. Sourcing abroad increases logistics cost In this case, Volvo 3P intends to develop second-tier suppliers in emerging markets, like China, India and Eastern Europe. Many manufacturing firms today are realizing the benefits of buying products from suppliers in low-cost countries, but evaluating those moves may be more difficult than it appears, while simply buying from a lower-cost supplier in these markets will not automatically bring savings. Moving to a supplier in another country often means increased transportation, customs, taxes and handling fees added on to the purchased price, which could put the total cost back to its original level. First, people involved in these decisions would need visibility into all of the additional factors and data beyond materials costs that contribute to total acquisition cost from a variety of different markets. Second, decision-makers would need the tools to run calculations and optimizations on the data once they have access to it. Third, the right people with the proper training and qualifications to use these tools would be needed to make the best evaluations and sourcing decisions.
21 Bley, Doug, Strategic Finance; Oct2004, Vol. 86 Issue 4, p38, 4p, 2bw
26
And last, the users needed to realize that the results of any optimization study are subject to fluctuations of duty rates, transportation rates, or preferential trade agreements with other countries that change22. So, it is important for manufacturing, when outsourcing from aboard, try to find ways to reduce logistics cost. The way to reduce logistics cost Although transport costs are rising, there are ways to keep these down. The following are some of those ways. 1. Avoid overkill on shipper requirements A critical look at the shipper's requirements often results in streamlining. Cost savings are possible without affecting levels of service. 2. A sharp look at additional costs Neglecting additional costs during the invoice check can be costly. Extra costs for waiting hours, cleaning, special equipment, rush orders, fuel surcharges and so on appear on many transport invoices. 3. Improve payload of truck shipments There are plenty of opportunities to improve payloads, through order sizes, equipment weight, loading procedure and choice of modality. 4. Flexible contracting Dedicating a fixed proportion of total transport to one carrier for an entire contract period puts competitive pricing at risk. To ensure transport is carried out at market prices, capacity management clauses can be incorporated in transport contracts. 5. Reduce interaction costs by using IT Strong IT tools can substantially reduce administrative complexity. Transport orders can be communicated, where possible at an early stage, by electronic data interchange or the Internet to the selected transport providers. 6. Sharing the benefits of improvements Shipper and carrier should develop joint actions that benefit both parties. A common improvement agenda increases mutual trust and makes benefit-sharing easier. 22 Hannon, David, Purchasing, 2/6/2003, Vol. 132 Issue 2, p12, 2p, 1c
27

7. Benefit from changing market conditions Both the liberalization of rail transport and EU expansion offer promising opportunities. Private railway operators are increasingly able to offer competitive solutions -- both in price and service -- especially for bulk products on long-haul transport. Moreover, the possibility of using qualified Eastern European drivers should make costs more competitive. 8. Reduce the number of rush orders Costly rush orders can be caused by the customer and the supplier. But, if customers require an express service they could be served at an express price23. Even though in this case, Volvo will not be in charge of arranging transportation, each one of the cost drivers within this supply chain will affect the benefit of Volvo in the end. So, it is quite important for each actor within the flow to keep in mind that buying from some far-away, low-cost countries will involve higher logistics cost and finding ways to reduce logistics cost is highly recommended.
3.1.4 Supply Chain Management Supply Chain integration implies process integration, both upstream and downstream. By process integration we mean collaborative working between buyers and suppliers, joint product development, common systems and shared information. To achieve market leadership in the world of network competition necessitates a focus on network management as well as upon internal processes. Managing the Supply Chain as a network
• Collective strategy development. For network competition to be truly effective requires a significantly higher level of joint strategy development. This means that network members collectively agree strategic goals for the network and the means of attaining them.
• Win-win thinking. There is now a growing realization that co-operation
between network partners usually leads to improved performance generally. “Win-win” need not mean 50/50, but at a minimum all partners should benefit and be better off as a result of co-operation.
23 Den Breejen, Erwin, van den Hurk, Joris, European Chemical News; 10/25/2004, Vol. 81 Issue 2121, following p16, 1p.
28

• Open communication. For network marketing to work to its fullest potential, visibility and transparency of relevant information throughout the supply chain is essential. Electronic Data Interchange (EDI) was one solution. Open-book accounting is another manifestation of this move towards transparency by which cost data is shared upstream and downstream and hence each partner’s profit is visible to the others.
3.2. Purchasing24 As this project intends to present solutions to the cab purchasing department of Volvo 3P, understanding the role of purchasing within an organization in crucial. Purchasing has increasingly assumed a pivotal strategic role in supply-chain management. Over the past three decades, increasing global competition has caused a dramatic increase in the outsourcing of materials. Firms are demanding the best value for all components used in the finished product. For a typical manufacturing firm, the share of finished product cost that is represented by purchased parts (as opposed to those made in-house) can range from 40 to 60 percent25. As a result, purchasing is becoming a key success factor and the current movement towards even greater trade internationally will only increase its importance.
3.2.1 The Goals of Purchasing Purchasing must ensure that raw material, supplies, and services come into the firm so that finished goods can go out. However, that flow must be maintained while addressing the flowing issues as well. a. Excess inventory Large quantities of goods bought at a discount may lead to inventory carrying cost increases that are greater than the amount saved.
b. Quality standards The products/services purchased must adhere to some quality standards as defined by top management.
24 Gourdin, Kent N, “Global Logistics Management: a competitive advantage for the new millenium”. 25 Gourdin, Kent N, “Global Logistics Management: a competitive advantage for the new millenium”.
29

c. Cost Items should be obtained at the lowest cost possible consistent with quality needs. d. Systems view Regarding the logistics system in general and how buying decisions have an impact on other functions within that system.
3.2.2 Purchasing Tasks There are a number of different facets to the purchasing activity, some of which are discussed below. a. Supplier selection Indeed, cost has historically been the most important parameter when selecting the vendors that the firm will patronize. However, other factors are now crucial also, like product quality and conformance to specifications, delivery reliability and product availability were all ranked higher than cost in a recent survey of purchasing mangers. Sophisticated buyers now seek suppliers that will work very closely with customers to raise performance levels, contain costs, and develop leading edge technologies. They also want vendors who will share data, resources, and people to overcome obstacles that stand in the way of mutually agree-up goals. And smart managers value suppliers that can identify aspects of the buyer’s operations that can be improved and that are willing and able to respond quickly to problems and emergencies. b. Quality management Purchasing wants to provide the organization with as much value as possible. And that needs the constant balancing act between price and quality. Today, purchasing managers realize that buying inexpensive, but poor-quality items often leads to production disruptions, more rework and a higher percentage of defective finished goods, all of which increase costs. On the other hand, buying material of higher quality than customers’ need is wasteful because it fails to add value in the buyer’s mind. c. Forward buying Forward buying refer to obtaining materials well before they are needed to satisfy customer demand. Mangers may fear that a commodity may not be available at some future data or in sufficient quantities to meet production needs or a future price increase is anticipated. Also, purchasing and/or transportation discounts offered in exchange for a large-volume order may provide an incentive to forward-buy. There are, however, some risks associated
30

with forward buying. Like, events may not occur as anticipated; extra items will increase the inventory costs. d. Integration with other corporate departments Once viewed as largely a subunit of inbound logistics, purchasing now finds itself interacting with many diverse parts of the organization. As purchasing has become a more visible and important activity, mangers must deal with their counterparts from marketing, finance, operations and production. Purchasing must understand the needs of ultimate consumer satisfaction, so that supplier relationships can be developed that do, in fact, enhance end-buyer satisfaction.
3.2.3 Buying internationally Most purchasers would prefer to buy from suppliers located nearby, who speak the same language, belong to a similar culture, do business in the same legal system, work to the same standards and have no currency exchange problems. But still, international trade is increasing. a. Reasons for buying from abroad
• The buyer may be compelled to go abroad to get what is required. • The buyer may prefer to buy from a foreign source which offers features
not available on domestically produced goods. • Although goods of the type required are produced domestically,
domestic capacity may not be enough to meet demand, so the gap has to be filled from abroad.
• It may be possible to buy equivalent goods more cheaply abroad,
because of larger quantities, lower wages, better productivity, better plant, or the rate of exchange.
b. Problems in buying abroad
• Communication problems. Language, time difference, interpretation and complicate foreign trade.
• Currency differences. Exchange rate fluctuations can be dealt with by
making a forward purchase of the amount needed in the same way as a commodity.
• Payment. Within the European Community, payment will involve the
transfer of funds by telegraphic means, mail, bankers draft or international money orders. Outside of the EC, Bills of Exchange or Letters of Credit, which require an intermediary, are used.
31

• Incoterms. When buying from overseas it is important to establish and be
aware of the obligations of both parties in respect of “terms of delivery”. Both buyer and seller will have obligations concerning the transportation, insurance and shipment of the goods under their contract for the sale and supply of the goods.
• Transport. All five basic modes of freight transport-road, rail, air, water
and pipeline- are used in international transactions. Several delays occur in the transport arrangements for some international transactions. One way to counteract these delays is to hold stocks in the country of import. This can be expensive. A big selling point of airfreight is that buffer stocks can be low because of the “lead time economics” of air travel: fast delivery, in effect.
• Customs. Import and export procedures between countries, which are
members of the EC, are being considerably simplified, with the single market and the abolition of import taxes. For purchases from countries outside the EC, however, careful administration is needed to avoid unnecessary expense. It is important to reduce the length of time goods are in Customs. Every day’s delay can add to costs. Inaccurate, incomplete or incorrect information on documents such as invoices, waybills, import licenses and letters of credit causes delay.
3.3 International Logistics26
As this thesis deals with second-tier suppliers in geographically distant countries, a view at international logistics seems necessary as a framework that will enable the analysis section of the project. The term “Globalization” is commonly used when talking about modern business, to refer to today’s situation in which customers and suppliers are no longer limited by geographic boundaries. Its origins can be traced back to the expanding trade routes of early civilizations; discoveries made in excavations from Europe, Asia, Africa and the Americas reveal artifacts made hundreds of even thousands of miles away from the site, at the edges of their respective known worlds. Measured in transport time and costs the world has shrunk to the dimensions of a “global village”. People take for granted the availability products from around 26 Harrison, Alan and Van Hoek, Remko, Logistics Management and Strategy, Pearson Education Limited, 2002, pages 79-97.
32

the world, as well as the safe, fast inter-continental travel in container carriers and aircraft. It is in this context that that the link between logistics and economic development shows itself; the connectivity of all regions of the world is essential for international trade. The logistics dimension of globalization conjures up a vision of parts flowing seamlessly from suppliers to customers located anywhere in the world, and a supply network that truly spans the entire globe. However, global supply chains are made more complicated by uncertainty and difficulty of control. Uncertainty arises from longer lead times and lack of knowledge over risks and local market conditions. Coordination becomes more complex because of additional language and currency transactions, more stages in the distribution process and local government intervention through customs and trade barriers. Moreover, there are instances in which a truly global logistics system is not necessary, and where internationalization is a more accurate description. Internationalization is certainly an increasing feature of the majority of supply chains. International sourcing of component parts and international markets for finished products are extending as world trade increases. At a company level, generic drivers for internationalization include: • A search for low factor and supply costs (land, labor, materials) • The need to follow customers internationally in order to be able to supply
locally and fast • A search for new geographical market areas • A search for new learning opportunities and exposure to knowledge. Logistical implications of internationalization Internationalizing logistics networks brings consequences for inventory, handling and transport policies. Inventory Centralizing inventories across multiple countries can hold advantages in terms of inventory-holding costs and inventory levels that are especially relevant for high-value products. On the other hand, internationalization may lead to product proliferation due to the need for localization of products and the need to respond to specific product/market opportunities.
33
Handling Logistics service practices may differ across countries as well as regulation on storage and transport. Adjusting handling practices accordingly is a prerequisite for internationalization. Transport Due to internationalization, logistics pipelines are extended and have to cope with differences in infrastructure across countries, while needing to realize delivery within the time to market. In general, transport costs have continued to decline over time as a relative cost item because of innovations in transport technology, the commoditization of transport (such as container ships) and the oversupply of transport capacity for basic transport. These factors themselves contribute to the increasing internationalization of logistics: physical distribution becomes less important, even for bulky products. The challenges of international logistics International logistics is complex, and different from localized logistics pipelines. The main differences that need to be taken into consideration are: • Extended lead-time of supply. • Extended and unreliable transit times. • Multiple consolidation and break points. • Multiple freight modes and cost options. Information technologies can help to avoid these challenges in general, and the proper location of international operations in particular can help to resolve some of these challenges. Extended lead time of supply In an internationally organized business most products produced in a particular factory will be sold in a number of different countries. In order to manage the interface between the production and the sales teams in each territory, long lead times may be quoted. This buffers the factory, allowing them to respond to the local variations required in the different markets. Extended and unreliable transit times Owing to the length and increased uncertainty of international logistics pipelines, both planned and unplanned inventories may be higher than optimal. Variation in the time taken to undertake international transport will inevitably lead to increased holding of inventory with the aim of providing safety cover.
34
Multiple consolidation and break points Consolidation is one of the ways in which costs in pipelines can be lowered. Economies of scale are achieved when goods produced in a number of different facilities are batched together for transport to a common market. Once in the country of destination, the shipment must be broken down at various break points, so that the products can be distributed to market via hubs. Multiple freight modes and cost options Each leg of a journey between manufacture and the market will have a number of freight mode options. In simplistic terms, these can be broken down into air, sea, rail and road. Within each of these categories lies a further range of alternative options. Each of them can be assessed for their advantages and disadvantages in terms of cost, availability and speed. When the journey across the supply chain involves multiple modes, the interface between them provides further complications. In a more general way, the logistics of internationalization involves four significant differences in comparison to national or even regional operations. First, the distance of typical order-to-delivery operations is significantly longer in international as contrasted to domestic business. Second, to accommodate the laws and regulations of all governing bodies, the required documentation of business transactions is significantly more complex. Third, international logistics operations must be designed to deal with significant diversity in work practices and local operating environment. Finally, accommodation of cultural variations in how customers demand products and services is essential for successful logistical operations27.
3.4 Logistics Service Levels28
Customer service is often referred to as a decisive element when talking of today’s business environment whether the organization deals with services or products. Logistic activities also apply the concept of customer service, since at the end of the pipeline, as well as in the links of the network, there are customers whose expectations must be fulfilled. These customers can be either business customers or final customers. Customer Service has become an increasingly important aspect in competitiveness. Two main aspects in the industry are responsible for this: the
27 Bowersox, Closs and Cooper, “Supply Chain Logistics Management”, McGraw Hill, Page 24. 28 Harrison, Alan and Van Hoek, Remko, Logistics Management and Strategy, Pearson Education Limited, 2002, pages 29-34.
35

increase of customer expectations and the dispersion of technological know-how. When speaking of customer service, it is usual to refer to two types of customers:
Business customers, who represent an organization’s immediate trading environment
End Customers, who represent the ultimate customer for the network as a whole.
It is becoming common practice to refer to the relationships as business to business (B2B) and business to customer (B2C) accordingly. Keeping these definitions in mind, B2B integration should be always aligned towards the ultimate B2C process.
The organization
Tier 2
SuppliersTier 1
Suppliers
Tier 1
Customers
Tier 2
Customers
Upstream Downstream
Supply Side Demand Side
Purchasing and Supply
Inbound Logistics
Physical Distribution
Outbound Logistics
Supply Chain Management
The organization
Tier 2
SuppliersTier 1
Suppliers
Tier 1
Customers
Tier 2
Customers
Upstream Downstream
Supply Side Demand Side
Purchasing and Supply
Inbound Logistics
Physical Distribution
Outbound Logistics
Supply Chain Management
Figure 3.1: Relationships in the Supply Chain. (Source: Harrison and Van Hoek, After Slack et al., 1998)
36

Increasing Customer Expectations This increase has many causes, including: • Better levels of general education • Better ability to discern between alternative products • Exposure to more lifestyle issues in the media Business customers are also expecting more from vendors. Suppliers need to pay increasing attention to the service aspects of their dealings with industrial customers. This is especially true when the customer has implemented more customer-centric management systems such as just in time. Technological Know-how Technological know-how disperses across and between industries and between competitors through a number of routes, including: • Benchmarking projects • Product tear-down • Employee turnover • Educational programs When technologies mature, the rate at which new developments occur can be overtaken by the rate of dispersal. This leads to competing products having broadly the same characteristics and capabilities, with only marginal differences between them. This leads to customers becoming increasingly unable to perceive differences between them. While this process is gradual, it leads to products being eventually viewed as commodities. Faced with rising customer expectations and lowering product differentiation, companies are increasingly turning to customer service as their way to gain competitive advantage. Customer Service as a link between logistics and marketing The marketing mix is the set of marketing decisions that is made to implement positioning strategy (target market segments and differential advantage) and to achieve the associated marketing and financial goals. The marketing mix has been popularly termed the 4 Ps: Product: range, sizes, presentation and packaging, design and performance;
37

Price: list price, discounts, geographical pricing, payment terms; Promotion: sales force, advertising, consumer promotion, trade promotion, direct marketing; Place: channel selection, market coverage, distribution systems, dealer support. Logistics contributes fundamentally to the place decisions, as well as supporting product and promotion decisions. In order to achieve the goal of the right product in the right place at the right time, logistics systems and processes must be designed to support products in the market place. An effective interface between marketing and logistics requires the development and implementation of practices that deliver costumer service. The elements that make up costumer service are many and varied, so for the purpose of simplicity they are often categorized under three headings:
• Pre-transaction (before the sale) • Transaction (during the sale) • Post-transaction (after the sale)
Pre-transaction elements of customer service The pre-transaction elements of customer service are those set up in advance of a transaction. They result from planning undertaken to ensure that subsequent transactions occur smoothly, in line with customer needs. Examples of these elements are: Written customer policy - Does one exist? - Is it communicated to internal staff? - Do customers know about it and how to use it? - Does in contain specific measures on how you aim to perform? Accessibility - How easy is for customers to deal with the company? - Is the company easy to find physically and on the web? - Is it easy to find the company’s phone, fax and email? - Is there a specific first point of contact for customers?
38

Organizational Structure - is someone designated as responsible for customer service? - Do hey have the authority to make changes in order to help customers? System Flexibility - how flexible is the logistics system in accommodating to special needs of customers? Transaction elements of customer service Transaction elements are the customer service components of physical distribution. These are all the aspects necessary for and directly involved in getting the right product to the right place at the right time. The considerations made in this project place strong focus on these elements of customer service. Examples of these elements are: Order-cycle time - How long does it take from receiving the order to delivering it? (lead time) - How reliable is delivery? That is, does the company achieve the delivery dates/times? - What is the variation between shortest, average and longest order cycle time? Inventory Availability - Where orders are picked up from stock, what is the availability of each item? Order fill rate - What percentage of orders are met in full within the order lead time? This measure considers an order to be fulfilled only when the full amount of all items on an order is delivered. Post-transaction elements of customer service Following a transaction, customers usually need further services from a supplier. These are necessary to overcome problems that they encounter and as ongoing support during product use. Some of these services are opportunities to increase the revenue from the customer and provide an essential part of a business’ income. Examples of these elements are: Spares availability - What are the stock levels and delivery times for spare parts? Call-out time Specialist skills and equipments may be needed to service or repair a product.
39

- What is the time taken to arrive? - How long does a repair take? - On what percentage of occasions is a repair completed at the first call-out? Customer complaints - What is the speed at which complaints are resolved? - What percentage of complaints can be resolved by the first person the customer speaks to? It can be stated, in a more general way, that some of the basic elements and indicators of customer service in Logistics are29: • Availability of an item, representing the ability of the supplier to satisfy
customers’ orders within a time limit (accepted generally for a particular item). The number of stock-outs is a usual measure of product availability.
• Delivery time, elapsing between receipt by the supplier of a firm
commitment for an order and receipt of the goods by the customer. • Reliability, meaning the supplier's commitment to maintain a promised
delivery schedule. • Accuracy of quantities and products ordered. These elements as a rule have the most significant connection to the lead-time and structure of inventories. Transportation as a component of customer service in logistics30
Transportation is the operational area of logistics that geographically moves and positions inventory. Because of its fundamental importance and visible cost, transportation has traditionally received considerable managerial attention. Almost all enterprises, big and small, have managers for transportation. From the logistical point of view, three factors are fundamental to transportation performance: (1) cost, (2) speed and (3) consistency.
29 Danuta Kisperska-Moroñ from the Department of Business Logistic, University of Economics, Katowice, Poland, “Logistics customer service levels in Poland: Changes between 1993 and 2001”, International Journal of Production Economics 93-94, 8 January 2005, pages 121-128, available online at www.sciencedirect.com. 30 Bowersox, Closs and Cooper, “Supply Chain Logistics Management”, McGraw Hill, Page 41.
40

The cost of transport is the payment for shipment between two geographical locations and the expenses related to maintaining in-transit inventory. Logistical systems should utilize transportation that minimizes total system cost. This may mean that the least expensive method of transportation may not result in the lowest total cost of logistics. Speed of transportation is the time required to complete a specific movement. Speed and cost of transportation are related in two ways. First, transport firms capable of offering faster service typically charge higher rates. Second, the faster the transportation service is, the shorter the interval during which inventory is in-transit and unavailable. Thus, a critical aspect of selecting the most desirable method of transportation is to balance speed and cost of service. Consistency of transportation refers to variations in time required to perform a specific movement over a number of shipments. Consistency reflects the dependability of transportation. For years, transportation managers have identified consistency as the most important attribute of quality of transportation. When transportation lacks consistency, inventory safety stocks are required to protect against service break downs, impacting both the seller’s and buyer’s overall inventory commitment. With the advent of new information technology to control and report shipment status, logistics managers have begun to seek faster movement while maintaining consistency. Speed and consistency combine to create the quality aspect of transportation.
41

4. Empirical Study: Case at Volvo 3P In this chapter the empirical study is fully described. It contains basic explanations regarding the way in which the study is undertaken, followed by a thorough description of the current seat-supplying process. The material and information flows, as well as the service considerations, are of great importance in this aspect, in order to fully understand the process that this study intends to work upon. After the present situation is fully described, the 3 alternatives for the new situation are formulated.
4.1 Introduction to the empirical study The empirical study will start with some initial considerations that need to be clear before the bulk of the study begins. Clarifications as to which types of seats and which components were chosen as focus of the project are necessary. VTC uses numerous variants of seats, divided in 4 families: Basic, Standard, Comfort and De Luxe. Each of these families contains several variants with lots of features that ensure that any requirements from the customer can be completely fulfilled. Due to the high number of variants, and the complexity of considering all of them for the investigation, 2 types of seats were selected for this study. One of the seats is a STANDARD static seat, and the other one is a COMFORT air-suspended seat. An air-suspended seat has height mechanism activated by a pneumatic spring, while the static seat has a conventional mechanic height mechanism. These 2 seats were chosen because or their very high volume-value (cost per piece x annual volume) and upon agreement with Volvo 3P. Since a seat can be composed of more than 50 components depending on its features and the type of seat, for this project focus is made on those high-value components, which represent around 85% of the total material cost of a seat. In this way it is possible to perform a deeper research. The selected components are going to be referred to as MAIN COMPONENTS in this document. They are:
• Suspension units • Static units • Static supports • Metallic frames (Backrest frames) • Seat pans • Lumbar supports • Seat belt Buckles
42

• Backrest Foam • Seat Foam • Rubber Bellows • Side plastic covers • Front Plastic Covers • Cable wires • Upholstery (leather and non-leather)
Suspension Unit / Static unit
Backrest Frame
Seat pan
Lumbar Support
Static Support
Seat Belt Buckle
Seat Foam
Back Foam
Rubber Bellow
Plastic Front Cover Plastic Side Cover
Plastic Side Cover
Cable Wires
Upholstery
Externally visible components
Externally non-visible components
Figure 4.1: Model of a seat and its main components.
Figure 4.1 shows the general layout of a truck seat and its main components, those that this project will focus on. Although two different seats, one Standard static and one Comfort air-suspended, are used for this study, figure 4.1 can be considered to be a fairly adequate model for both of them given the similarities they present; most of the differences are internal (internal components) and functional (Comfort seats have more functions and features than Standard seats).
43

Following in this chapter there is a description of the current situation of the process. Afterwards, the three alternatives to the process will be defined and discussed. It must be kept in mind that the whole research is focused on the seat at the component level. It must be observed that because of the strategic nature of this project for Volvo 3P, confidential matters are of high importance on this thesis. In the contents of this document, information had to be omitted or restricted regarding the following subjects: ‐ Specific costs of components, seats, and transport contracts for both Volvo
AB Companies and its suppliers. ‐ Names of some companies, countries and cities. ‐ Specific duration of different activities. ‐ Specific potential origins of each of the components. ‐ And other data considered strategic by Volvo 3P.
This information was omitted or restricted on this document under specific request from Volvo 3P. The omission of such data is not considered to be of high impact for the purpose of the thesis.
4.2 Current situation of the seat-supplying process in Europe In order to understand the current situation of the seat-supplying process for VTC in Europe, its most relevant characteristics will be described in this section. This description includes the main actors involved in the process, the material flow, the information flow and some considerations regarding the current service level. Once section 4.2 is complete, the present situation will be fully explained. Therefore, by the end of this section, research sub-question A What is the present situation of the seat supplying process for Volvo Trucks Europe? will be answered.
44

4.2.1 Actors Involved The main companies involved in the seat-supplying process for VTC in Europe are Volvo 3P, the Volvo Cab manufacturing Plant in Umeå and CURRENT SUPPLIER as the current main seat-supplier. Volvo 3P Volvo 3P within the Volvo group Volvo 3P31 is Volvo AB’s unit responsible for purchasing, product planning, product development and product range management for Volvo Trucks, Renault Trucks and Mack Trucks. This unit was created after Volvo AB’s acquisition of Renault Trucks and Mack Trucks, in 2001, so that important synergies could be achieved. Volvo 3P has global presence, with 4 main sites: Gothenburg, Sweden; Allentown, USA; Lyon, France; and Greensboro, USA. These locations can be better seen in Figure 1.2, in the first chapter. There are 2800 employees working at Volvo 3P globally.
Figure 4.2: Volvo 3P within the Volvo Group. (Source: Volvo Intranet).
31 Volvo 3P stands for Purchasing, Product Planning and Product Development.
45

The Purchasing function within Volvo 3P Within Volvo 3P, different departments are in charge of each one of the different functions (purchasing, product planning, product development and product range management). Figure 4.3: Volvo 3P’s Organization. (Source: Volvo Intranet)
This thesis project is performed at the Purchasing department of Volvo 3P, which is responsible for the purchasing function for the 3 truck companies. Within the Purchasing department, the cab division buys the components to be installed in the cab, such as dashboards, panels, seats, rugs, textiles, etc. The purchasing process within Volvo 3P can be described as follows: Once the need for a part or supply and its required specifications are identified, the responsible buyer for the specific component requests a quotation from the supplier. Once the supplier makes an offer for the supplying of the part, Volvo 3P’s assessment of that offer takes place. Further negotiations between the supplier and the buyer are usually necessary before a final business case is made for the supply of the specific part. The buyer passes the offer to the Global Sourcing Committee (GSC) for its decision. If the business case is approved by the committee, a formal order is issued by Volvo 3P. This order is
46
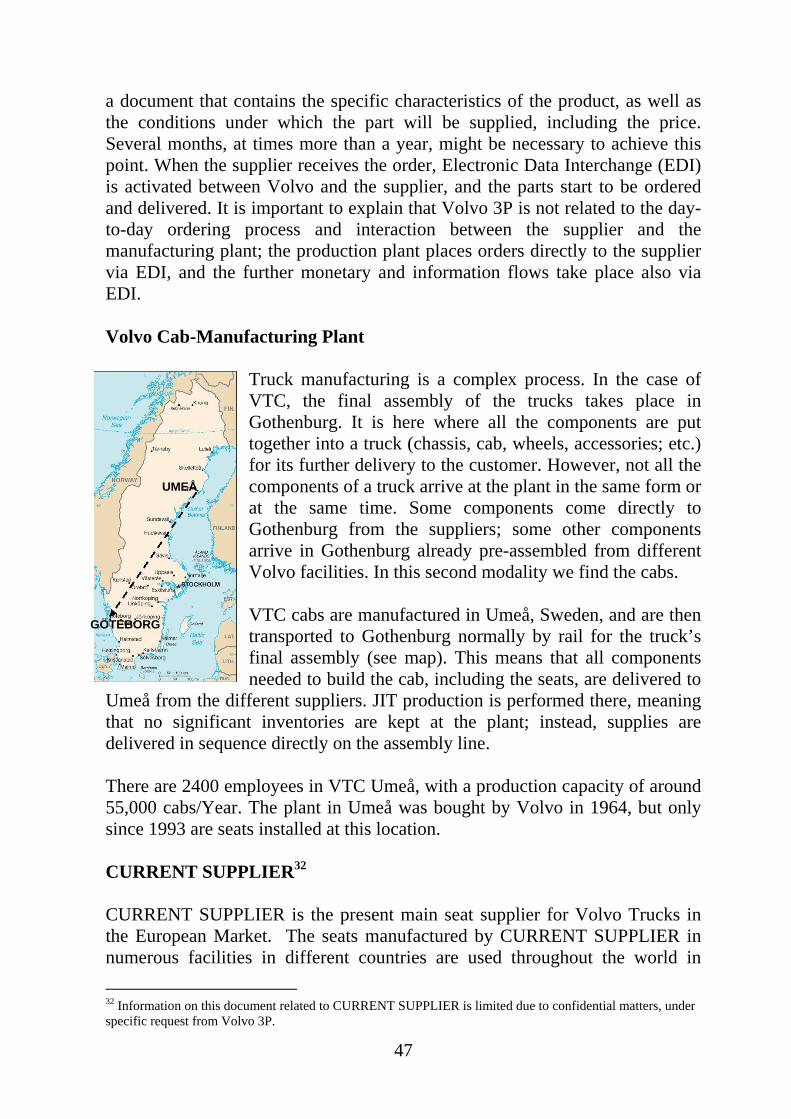
a document that contains the specific characteristics of the product, as well as the conditions under which the part will be supplied, including the price. Several months, at times more than a year, might be necessary to achieve this point. When the supplier receives the order, Electronic Data Interchange (EDI) is activated between Volvo and the supplier, and the parts start to be ordered and delivered. It is important to explain that Volvo 3P is not related to the day-to-day ordering process and interaction between the supplier and the manufacturing plant; the production plant places orders directly to the supplier via EDI, and the further monetary and information flows take place also via EDI. Volvo Cab-Manufacturing Plant
Truck manufacturing is a complex process. In the case of VTC, the final assembly of the trucks takes place in Gothenburg. It is here where all the components are put together into a truck (chassis, cab, wheels, accessories; etc.) for its further delivery to the customer. However, not all the components of a truck arrive at the plant in the same form or at the same time. Some components come directly to Gothenburg from the suppliers; some other components arrive in Gothenburg already pre-assembled from different Volvo facilities. In this second modality we find the cabs. VTC cabs are manufactured in Umeå, Sweden, and are then transported to Gothenburg normally by rail for the truck’s final assembly (see map). This means that all components needed to build the cab, including the seats, are delivered to
Umeå from the different suppliers. JIT production is performed there, meaning that no significant inventories are kept at the plant; instead, supplies are delivered in sequence directly on the assembly line.
GÖTEBORG
UMEÅ
There are 2400 employees in VTC Umeå, with a production capacity of around 55,000 cabs/Year. The plant in Umeå was bought by Volvo in 1964, but only since 1993 are seats installed at this location. CURRENT SUPPLIER32
CURRENT SUPPLIER is the present main seat supplier for Volvo Trucks in the European Market. The seats manufactured by CURRENT SUPPLIER in numerous facilities in different countries are used throughout the world in 32 Information on this document related to CURRENT SUPPLIER is limited due to confidential matters, under specific request from Volvo 3P.
47

trucks, coaches, transporters and construction and agricultural machinery of all kinds. CURRENT SUPPLIER’s customers include most of the big companies in the vehicle industry. CURRENT SUPPLIER is constantly working to reach globalization and to manufacture wherever this is beneficial to their customers. It uses JIT system for the rational expansion of modular corporate structure. Throughout the world they are setting up production facilities in which they use the same modular systems. In this way, CURRENT SUPPLIER helps their customers to make optimum use of the competitive factor of time. CURRENT SUPPLIER is still on their way to expansion. In addition to the increased use of electronics and innovative materials, the development of comfort and air-conditioning system continues to grow.
The future
The present
The beginning
Figure 4.4: CURRENT SUPPLIER’s products. (Source: CURRENT SUPPLIER’s website)
CURRENT SUPPLIER Umeå CURRENT SUPPLIER has a production facility in Umeå, Sweden, which acts as the first-tier supplier to Volvo Trucks Europe for the seats provided by CURRENT SUPPLIER. All seat components are delivered to CURRENT SUPPLIER Umeå from the second-tier suppliers (CURRENT SUPPLIER Europe Plant can be considered as one of them) for the final assembly of the seat. They are located 300 meters from Volvo Cab plant in Umeå, and they deliver the complete seats to a JIT cell inside Volvo plant, from where the seats are further delivered in sequence to the production line. The JIT cell is an area of more than 150 m2 Volvo rents to CURRENT SUPPLIER and under the supplier’s management.
48

Carriers under contract by CURRENT SUPPLIER CURRENT SUPPLIER arranges its transport activities from Country 1 (CURRENT SUPPLIER’s facilities in Europe) and other sub-suppliers to Umeå, while the transport from CURRENT SUPPLIER Umeå to VTC plant is arranged by the latter. The main carrier in charge of the transportation to CURRENT SUPPLIER Umeå will be referred to as Carrier 1.
4.2.2 Current Material Flow The material flow for the components that conform a seat is as follows:
Current Supplier
Europe Plant
Other 2nd-tier suppliers based in Europe
Final Assembly
Current Supplier Umeå Plant
Final Assembly
Current Supplier Umeå Plant
UMEÅ Cab Plant COMPLETE SEATS
Components supply33
Figure 4.5: Current Material Flow of the seat-supplying process.
The final seats are assembled at CURRENT SUPPLIER Umeå before they are delivered to VTC, so that CURRENT SUPPLIER Umeå acts as first-tier supplier to VTC. Components arrive at this location from different suppliers around Europe. Most of the main components are either manufactured or received at CURRENT SUPPLIER’s facilities in Country 1, and delivered to Umeå. These are: Suspension units and static units, Backrest frames, Seat pans, Lumbar supports and springs. Some components, like foam parts and more, are 33 More specific information on the origin of the different components is omitted for confidential reasons.
49

consolidated for further delivery to Umeå at a hub owned by CURRENT SUPPLIER. The other components, such as seat-belt Buckles and other metallic parts, are delivered by second-tier suppliers based in Europe directly to Umeå. Transport operations to CURRENT SUPPLIER Umeå plant The main carrier used by CURRENT SUPPLIER for their transport operations is Carrier 1. Several modes and routes are used in order to supply the components.
3
POSSIBLE ORIGINS
KIEL
LÜBECK
TRAVEMÜNDE
GÖTEBORG
HOLMSUND
TRELLEBORG UMEÅ
WESTERN WESTERN
EUROPEEUROPESWEDENSWEDEN
Road Ferry
Ferry
Boat
Road
Rail
Rail
Figure 4.6: Routes and modes used for transportation of CURRENT SUPPLIER´s
components for further assembly in Umeå. Components can come from three origins in Country 1. From these three origins, three possibilities exist for the transport to Umeå, Sweden (Figure 4.6): • Direct Transport through Kiel to Umeå. • Railway transport through Travemünde to Umeå. • Boat transport through Lübeck to Umeå34. Consolidation of several suppliers takes place at a hub located in origin 3. If the truck loaded there with destination Umeå is not completely filled at the hub, it is completely filled at origin 1, not too far away. 34 More specific information on the transportation, like transit times and frequency of shipments for each route is omitted for confidential reasons.
50

Additionally, there are direct trailers weekly going back from Umeå to origin 1 with empty pallets. Figure 4.7 shows the different locations involved in the transport process.
KIEL
LÜBECK TRAVEMÜNDE
TRELLEBORG
HOLMSUND
GÖTEBORG
UMEÅ
KIEL
LÜBECK TRAVEMÜNDE
TRELLEBORG
HOLMSUND
GÖTEBORG
UMEÅ
Figure 4.7: Locations involved in the transport process of components to Umeå.
51
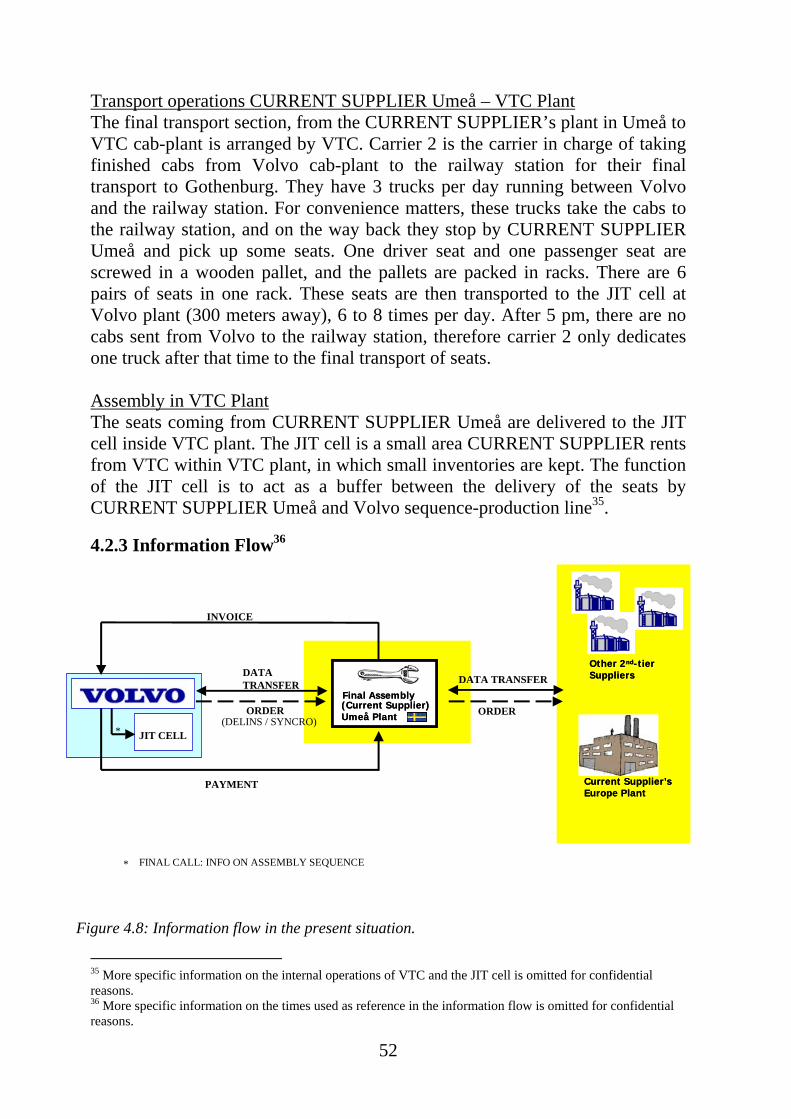
Transport operations CURRENT SUPPLIER Umeå – VTC Plant The final transport section, from the CURRENT SUPPLIER’s plant in Umeå to VTC cab-plant is arranged by VTC. Carrier 2 is the carrier in charge of taking finished cabs from Volvo cab-plant to the railway station for their final transport to Gothenburg. They have 3 trucks per day running between Volvo and the railway station. For convenience matters, these trucks take the cabs to the railway station, and on the way back they stop by CURRENT SUPPLIER Umeå and pick up some seats. One driver seat and one passenger seat are screwed in a wooden pallet, and the pallets are packed in racks. There are 6 pairs of seats in one rack. These seats are then transported to the JIT cell at Volvo plant (300 meters away), 6 to 8 times per day. After 5 pm, there are no cabs sent from Volvo to the railway station, therefore carrier 2 only dedicates one truck after that time to the final transport of seats. Assembly in VTC Plant The seats coming from CURRENT SUPPLIER Umeå are delivered to the JIT cell inside VTC plant. The JIT cell is a small area CURRENT SUPPLIER rents from VTC within VTC plant, in which small inventories are kept. The function of the JIT cell is to act as a buffer between the delivery of the seats by CURRENT SUPPLIER Umeå and Volvo sequence-production line35.
4.2.3 Information Flow36
INVOICE
PAYMENT
ORDER
DATA TRANSFER
(DELINS / SYNCRO)
DATA TRANSFER
ORDER
JIT CELL*
* FINAL CALL: INFO ON ASSEMBLY SEQUENCE
Final Assembly(Current Supplier) Umeå Plant
Final Assembly(Current Supplier) Umeå Plant
Final Assembly(Current Supplier) Umeå Plant
Current Supplier’s Europe PlantCurrent Supplier’s Europe Plant
Other 2nd-tier SuppliersOther 2nd-tier Suppliers
Figure 4.8: Information flow in the present situation.
35 More specific information on the internal operations of VTC and the JIT cell is omitted for confidential reasons. 36 More specific information on the times used as reference in the information flow is omitted for confidential reasons.
52

Volvo Trucks orders to CURRENT SUPPLIER Umeå, and CURRENT SUPPLIER Umeå orders to its suppliers (Volvo’s second-tier suppliers) for necessary supplies. All information transfers are made via EDI. Volvo provides CURRENT SUPPLIER with a long term forecast (less than a year, called “Delins”) according to Volvo’s GPS (Global Purchasing System). Additionally, more accurate information on assembling-sequence is provided by Volvo to CURRENT SUPPLIER within a few days locking time (“Syncro”) so that proper adjustments in the seat supply can be made at CURRENT SUPPLIER Umeå according to Volvo’s requirements. Seats are built a few days ahead of Volvo production, and sent to the JIT cell. A few hours in advance of due production, CURRENT SUPPLIER (JIT cell) receives the final “call” from VTC, informing the sequence in which the cabs are entering the assembly line. CURRENT SUPPLIER (JIT cell) has consequently a short time to deliver the seats on the assembly line in the correct sequence. Such short notice is the reason why the JIT cell is necessary. Additionally, transfer data take place daily at night between VTC and CURRENT SUPPLIER Umeå, and weekly between CURRENT SUPPLIER Umeå and its suppliers and plant in Europe. Once the seat is delivered at the assembly line, the invoice and payment processes are triggered.
4.2.4 Service Considerations Volvo’s JIT operations and sequence production require the first-tier supplier to provide timely service. Looking at figure 4.9, in the inbound section, it is clear that the interactions between an organization and its suppliers in the first and second tiers are deeply linked: any disturbances in the flows from second tier supplier to first tier supplier will affect the subsequent flow between the first tier supplier and the organization. In other words, the service levels offered by CURRENT SUPPLIER Umeå to Volvo depend to great extent on the service levels they receive from their sub-suppliers.
53

Volvo Trucks
Umeå Plant
Tier 2
SuppliersTier 1
Suppliers
Supply Side (Inbound Logistics)
CURRENT SUPPLIER
Umeå
CURRENT SUPPLIER
Headquarters
Other 2nd-tier Suppliers
……
……
Service level tier 2 - tier 1
Service level tier 1 - VOLVO
Figure 4.9: Relationships in the Supply Chain between Volvo and its first and second tier suppliers. (Source: Extracted from Harrison and Van Hoek, After Slack et al., 1998)
Given this close relationship, the potential consequences of any changes in the second tier level over the service received by Volvo must be thoroughly observed. Given the JIT operations at Volvo, the service levels offered by the first-tier supplier to Volvo Umeå cannot change in any of the alternatives, which is why in this section the following parameters will be discussed with strong focus on the relationship between second-tier supplier and first-tier supplier, in this case, CURRENT SUPPLIER Umeå. The discussion on the service levels will consider specific parameters. Additionally, it is divided in 2 different sections (Service level Tier 1 – Volvo and Service level Tier 2 – Tier 1) Service Level Tier 1 – Volvo The parameters considered in this section are: • Transit Time Volvo Plant is 300 meters away from CURRENT SUPPLIER Umeå. Therefore, the transit time is minimum. More detail on how this transportation is performed can be seen in section 4.2.2.
54
• Lead time37 In section 4.2.3, Information flow for the current situation, it is explained how the exchange of information occurs between Volvo plant and CURRENT SUPPLIER Umeå. According to this, the time elapsed between the moment the final order for the seat is placed and the moment when the seat is delivered to the production line is a few hours. However, it must be kept in mind that short-term assembly-sequence information and long-term forecasts are given by Volvo to CURRENT SUPPLIER. According to this information, the seats are made a few days ahead of scheduled cab production. • Reliability As expressed by Volvo through interviews, CURRENT SUPPLIER meets Volvo’s requirements, and has managed to support VTC’s Just in Time and sequence assembly operations with few errors over time. However, disturbances of different nature do occur from time to time. Among such disturbances, the following can be mentioned: ‐ Lack of Material at CURRENT SUPPLIER Umeå: Sometimes related to
components coming from its suppliers. ‐ Not enough production capacity in the seat-production at CURRENT
SUPPLIER Umeå during high demand periods. • Accuracy CURRENT SUPPLIER usually delivers the right seats in the right sequence, although occasionally the wrong seats are delivered, or they are delivered in the wrong sequence. This kind of disturbances is not too frequent. Service Level Tier 2 – Tier 1 The discussion of the same parameters for this section is based in the information provided by CURRENT SUPPLIER, which for obvious reasons is not as complete as the information for the service level Tier 1 - Volvo. • Transit Time Numerous companies from different locations deliver components directly to CURRENT SUPPLIER Umeå. Some other second-tier suppliers deliver to its facilities in Europe or hubs in Country 1. The transit times (up to CURRENT SUPPLIER Umeå) for the most distant origins range from 2 days to 6 days depending on the mode and origin of the transport operation.
37 More specific information on the lead times is omitted for confidential reasons.
55

• Lead time Different components coming from different second-tier suppliers have different lead times from the perspective of CURRENT SUPPLIER, and such information was not available for this thesis. However, given the nature of this project, for the service level Tier 2 – tier 1 stronger emphasis is made on the transport time, which has a high impact on the resulting lead-time. • Reliability Specific information on this aspect between CURRENT SUPPLIER and its suppliers was not available. However, based on the information provided by Volvo, it can be implied that the lack of Material at CURRENT SUPPLIER Umeå may be related to failures in the reliability and availability of parts offered from second-tier suppliers.
• Accuracy No information was available regarding this parameter because of the same reason mentioned before. Furthermore, from the information known it is not easy to judge whether delivery inaccuracies are responsibility of CURRENT SUPPLIER or its suppliers.
56

4.3 New situation of the seat-supplying process in Europe Emerging Market countries have gained massive interest from manufacturing-companies all over the world in the late years. Sourcing from low-cost countries can lower unit production costs by anywhere from 10% to 75%38, compared to costs in Germany, the United States and other western countries. Although labor costs are not the only factor for such savings, they are certainly the most important of them all, accounting for about 60% of the total cost advantage in mention. Other factors are capital investment requirements, government incentives, costs of parts and components and economies of scale. And the cost savings are not only related to manufacturing activities: outsourcing services from India can be up to 50% or 60% cheaper than the correspondent cost in United States and Western Europe. During the research made for this project, China, India and Eastern Europe were commonly found as key reference locations within the emerging markets39. In order to find opportunities to achieve cost-savings in the seat supplying process, attention was focused on the possibility to source some main seat components from emerging markets. As it can be argued that this would be of interest for the seat-suppliers rather than for Volvo as complete-seat buyer, it must be understood that any suppliers used by Volvo’s suppliers, as well as the components supplied by them, are of high interest to Volvo to the extent that the final cost and quality of the seat bought is directly linked to those of the second-tier suppliers. Furthermore, having the correct knowledge will enable the company to improve its position before its first-tier supplier; either for price-negotiations or sourcing demands, and even beyond, by working together to define more strategic issues like further partnerships or changes in the supply chain. So many possibilities can be formulated that it would be a never-ending task to evaluate all of them. The 3 potential alternatives described next are the result of extensive analysis and investigation, not only by the authors of this report but also under the instruction from Volvo 3P as well as through constant interviews with more than 20 experts within the Volvo Group and from Volvo’s business partners. These interviews covered several aspects. First, these interviews
38 “Anatomy of a Cost Advantage: It’s more Than Cheap Labour”, George Stalk and Dave Young on Going Global, Published by Schofield Media. 39 "OEMs and contract manufacturers have to take costs out of their businesses, and Eastern Europe and China are the places to go", according to George Perris of Sierra Marketing Group in Rocklin, California. “In Europe, the movement is to Eastern Europe, in North America to Latin America, and in Asia to China”, according to iSuppli Corp. in a report on the Electronic Manufacturing Services industry from the El Segundo, California-based market researcher. “The most cost-competitive regions for high volume manufacturing are identified as China, India and parts of eastern Europe”, from Electronics Weekly, 9/22/2004 Issue 2163, p3, 1p.
57

intended to establish the best potential origins within the emerging markets for the focus components. Additionally, these interviews provided lots of information for the cost-saving calculations. Quotations from around 10 potential Chinese suppliers provided the input for the calculations regarding components’ cost. Getting such quotations demanded large amounts of time and effort. Given the technical advancement of some of the components, potential suppliers are not always prone to giving potential costs without proper information on the components in question, like materials requirements, technical drawings and specifications and so on. Therefore, getting 10 of such quotations for most of the components provided valuable inputs to the further estimations. The three alternatives are designed to show Volvo complete sets of options to the current situation, and their associated cost-savings, service considerations and other concerns that must be taken into account. The current situation, which was explained in detail in section 4.2, shows most of the main components coming from Europe, where labor cost is rather high. This project seeks to present Volvo 3P possible alternatives that can allow reducing the landed cost of the seats for VTC. Among the 14 components chosen as focus for this study, 2 components show considerably higher costs in relation to the others (these 2 components will be referred as Component 1 and component 2 throughout this document), so that their sourcing is to some extent a driver for the definition of the alternatives, although not the only one. It can be said that the higher labor-intensive the component, the higher the potential savings from sourcing in emerging markets. This is true in the case of components 1 and 2. It must be stated at this point that for the potential alternatives the specific actors (companies involved) will not be individually described. Volvo 3P and Volvo Cab Manufacturing Plant in Umeå have been thoroughly described in the current situation (section 4.2). These 2 companies remain in all the scenarios. In the case of CURRENT SUPPLIER, present in Alternative 3, it was already described. For the potential first -tier suppliers, they are not defined. The potential second-tier suppliers cannot be mentioned because of confidential matters. Finally, it must be stated that the description of the material flows and the calculations that make part of this project, will only reach up to the moment in which the components arrive at the Final-assembly location in Umeå.
58

Once section 4.3 is complete, the 3 potential alternatives will be fully described. Therefore, by the end of this section, research sub-question B What will be the situation of the seat supplying process for Volvo Trucks in Europe in each of the potential alternatives? will be answered.
59

4.3.1 Potential Alternative 1: Emerging markets sourcing from Asia with final assembly in Umeå. The first potential alternative considers that most of the main components of the seats can be sourced from China and India, with some remaining components sourced from Europe as they are today. Components arrive at Umeå for their final assembly into complete seats. This final assembly is performed either by the 1st-tier supplier or outsourced to a logistics partner designated by this. Material Flow for Alternative 1
Final Assembly
(1st-tier supplier) Umeå
CHINA
INDIA
Other 2nd-tier suppliers based in Europe
UMEÅ Cab Plant COMPLETE SEATS
Figure 4.10: Material Flow for alternative 1.
Components Supply40
The nature of this first alternative is to consider as many components as possible will be sourced from China and India. This alternative does not consider any specific first-tier supplier. Due to the JIT and sequenced operations at Volvo plant in Umeå, the location of the final assembly must in all cases be close to VTC cab plant. This final assembly can be performed
40 More specific information on the potential origin of the specific components is omitted for confidential reasons.
60

either by the first tier supplier’s facilities in Umeå (as today in the case of CURRENT SUPPLIER) or by a logistics partner. Components need to be positioned in Umeå for their final assembly into the seats. The first potential alternative considers China and India as substitute origins for most of the main components previously defined. As mentioned in the introduction of section 4.3, these substitute origins were determined according to research made by the authors of this document, conclusions from interviews with different experts within Volvo Group41, and upon agreement with Volvo 3P. In this alternative, based on the calculations that will be explained in the analysis chapter, almost all components could be sourced from China and India, except one, which did not show any savings in relation to the current cost. Around 70% of the main components could come from China, and the remaining main components would come from India. In the case of some components, the possibility exists to source them from either China or India. This is taken into account in the calculations of the analysis section (section 5.2). Since this project neither intends nor attempts to research on the totality of the more than 50 components that make a seat, for those components that have not been mentioned before (those not in the list of main components of section 4.1) it will be assumed that they are sourced from their current suppliers. This also applies to the component that does not show potential savings if it were sourced from Asia. Transport Operations to Final Assembly Umeå Bringing components from China and India to Umeå implies the use of several modes and routes. The goods coming by sea from China and India in containers will be trans-shipped at a main port in Europe, e.g. Hamburg, Rotterdam or Le Havre, with further destination Gothenburg. From Gothenburg the shipment is transported by road and rail to Umeå. The total transportation time is around 1 month. 42
Transport operations Final Assembly Umeå – VTC Plant This section of the transport would not be changed from the present situation, in which it is handled by Volvo. Detailed information in this regard can be seen in section 4.2.2.
41 Purchasers for different truck components with vast experience in emerging markets and persons from EMS (Emerging Markets Sourcing, unit within Volvo Group). 42 Volvo Logistics and other logistics partners of Volvo.
61
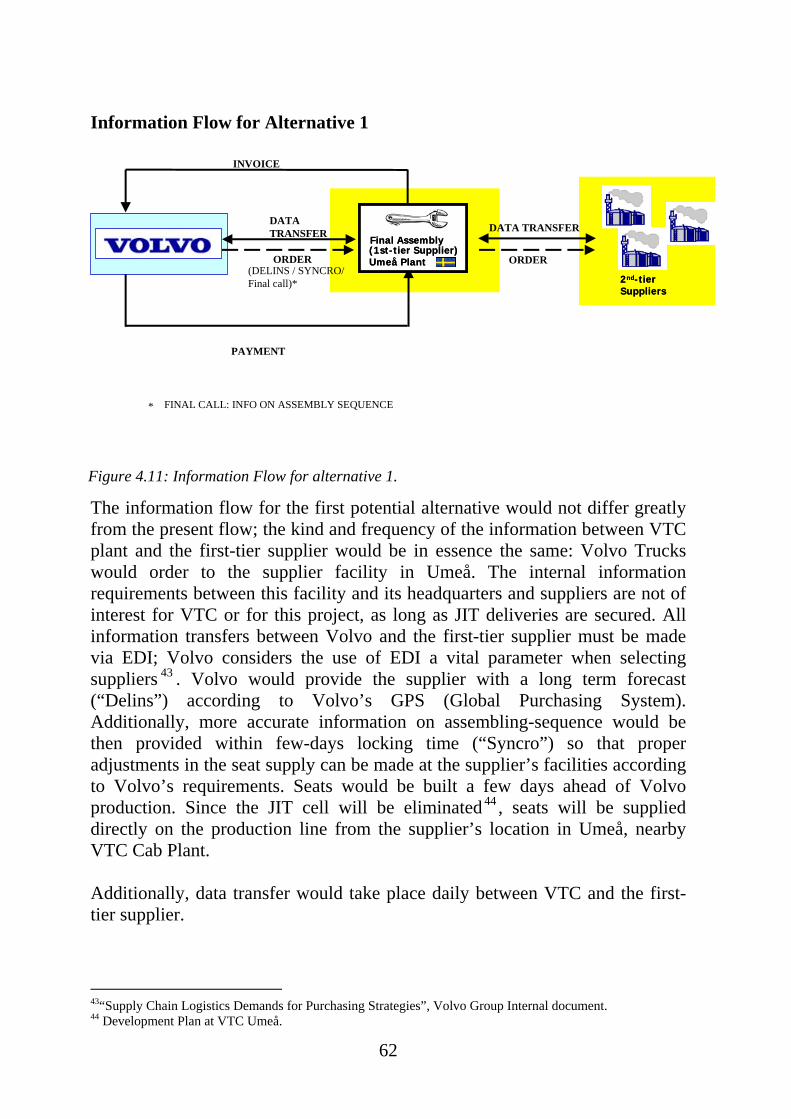
Information Flow for Alternative 1
* FINAL CALL: INFO ON ASSEMBLY SEQUENCE
INVOICE
PAYMENT
ORDER
DATA TRANSFER
(DELINS / SYNCRO/ Final call)*
DATA TRANSFER
ORDER
Final Assembly(1st-tier Supplier) Umeå Plant
Final Assembly(1st-tier Supplier) Umeå Plant
Final Assembly(1st-tier Supplier) Umeå Plant
2nd-tier Suppliers2nd-tier Suppliers
The information flow for the first potential alternative would not differ greatly from the present flow; the kind and frequency of the information between VTC plant and the first-tier supplier would be in essence the same: Volvo Trucks would order to the supplier facility in Umeå. The internal information requirements between this facility and its headquarters and suppliers are not of interest for VTC or for this project, as long as JIT deliveries are secured. All information transfers between Volvo and the first-tier supplier must be made via EDI; Volvo considers the use of EDI a vital parameter when selecting suppliers 43 . Volvo would provide the supplier with a long term forecast (“Delins”) according to Volvo’s GPS (Global Purchasing System). Additionally, more accurate information on assembling-sequence would be then provided within few-days locking time (“Syncro”) so that proper adjustments in the seat supply can be made at the supplier’s facilities according to Volvo’s requirements. Seats would be built a few days ahead of Volvo production. Since the JIT cell will be eliminated 44 , seats will be supplied directly on the production line from the supplier’s location in Umeå, nearby VTC Cab Plant.
Figure 4.11: Information Flow for alternative 1.
Additionally, data transfer would take place daily between VTC and the first-tier supplier.
43“Supply Chain Logistics Demands for Purchasing Strategies”, Volvo Group Internal document. 44 Development Plan at VTC Umeå.
62

Once the seat is delivered at the assembly line, the invoice process will be triggered, and so will the electronic payment. Service Level for Alternative 1 Volvo’s JIT operations and sequence production require the first-tier supplier to provide timely service. Looking at figure 4.9, 2 different aspects of service levels are considered, “tier 2- tier “1 and “tier 1 – Volvo”. Since “tier 1 – Volvo” is assumed not to change in any of the alternatives proposed, no matter which company acts as tier 1 supplier, the service levels discussion for the three alternatives will focus on the service level “tier 2 – tier 1”. Service Level Tier 2 – Tier 1 The parameters considered in this section are the same parameters considered for the current situation: • Transit Time The transit times for components coming by ship from China and India to Gothenburg is around a month (30 days). From Gothenburg to Umeå, the transit time is around one day. These times can have variations due to unexpected situations arisen during the long transportations, affecting the consistency of the deliveries. However, current advance in communication systems and track-and-trace capabilities help diminishing the effect of such situations. • Lead time Specific lead times are hard to estimate since the first tier supplier is not defined in this case, nor are the potential second tier suppliers. Even in the current situation, in which CURRENT SUPPLIER was extensively contacted, such information was not available for this thesis. The lead times are expected to be longer for those components supplied from China and India as a result of longer distances and transit times in relation to the current situation. • Reliability Reliability can be affected by the longer transport operations resulting from bringing components from Asian nations. Long transport journeys have higher probabilities of suffering delays due to unexpected situations, as well as more trans-shipment operations.
63

• Accuracy Accuracy is more important in the alternatives since wrong products delivered from long distances will take longer to be detected and corrective measures will take longer to have effect. Effective measures must be implemented by the suppliers in order to eliminate or decrease the probability of occurrence of this kind of errors, e.g. efficient use of bar-codes and packaging techniques and procedures. The first Alternative presents the extreme case of sourcing from Asia as many of the main components as possible. While it is the one with the highest potential cost-savings, being Asia the most distant origin among the ones considered in this study results in Alternative 1 suffering from the longest transport times for the highest number of main components, around 30 days. This puts special requirements in the first-tier supplier, as it must deal with the increasing lead-times and other risks associated with long-distance and multi-modal transport operations. The correct use and deployment of inventories will play a decisive role in this aspect. The harmonization of the procurement processes of these components with those components coming from closer origins (e.g. those components still supplied by their current suppliers) will be vital in order to assure that the service levels offered to Volvo do not result affected. Additionally, in the case of potential Chinese suppliers, communication might become an issue: most of the communications with Chinese potential second-tier suppliers were held in Chinese language. The number of English-speaking Chinese people is increasing lately, more so in the business sector, but language can still be an issue when dealing with companies based in that country. This situation was not faced when dealing with Indian-based companies and contacts.
64

4.3.2 Potential Alternative 2: Emerging Markets component sourcing from Asia, subassembly in Eastern Europe and final assembly in Umeå. The second potential alternative considers that most of the main components of the seats can be sourced from China and India, and that the sub-assembly of component 1 and component 2 is performed in an Eastern European country. The remaining components are sourced from their current suppliers. Components arrive at Umeå for their final assembly into complete seats. This final assembly is performed either by the 1st-tier supplier or outsourced to a logistics partner designated by this. Material Flow for Alternative 2
Final Assembly
(1st-tier supplier) Umeå
CHINA
INDIA
EASTERN EUROPE
Other 2nd-tier suppliers based in Europe
UMEÅ Cab Plant COMPLETE SEATS
Figure 4.12: Material Flow for alternative 2.
Components Supply45
Similar in nature to the first alternative, this second option also considers that as many components as possible will be sourced from China and India, while
45 More specific information on the potential origin of the specific components is omitted for confidential reasons.
65

the assembly of component 1 and component 2 will take place in a country in Eastern Europe. As for the first potential alternative, this one does not consider any specific first-tier supplier. Due to the JIT and sequenced operations at Volvo plant in Umeå, the location of the final assembly must in all cases be close to VTC cab plant. This final assembly can be performed either by the first tier supplier’s facilities in Umeå (as today in the case of CURRENT SUPPLIER) or by a logistics partner. Components need to be positioned in Umeå for their final assembly into the seats. Based on the calculations that will be explained in the analysis chapter, around 55% of the main components could be sourced from China. Around 30% of the main components could be sourced from India. In the case of some components, the possibility exists to source them from either China or India. This is taken into account in the calculations of the analysis section. Components 1 and 2 would be assembled in Eastern Europe and further delivered to Umeå. The benefits from making these components, which are rather heavy, in Eastern Europe are twofold. On one hand, lower labor costs may make the manufacturing costs lower against current costs. On the other hand, the proximity of Eastern Europe to Sweden will keep transport and associated costs relatively low in comparison to Asia. In order to decide in which country to establish the manufacturing of Component 1 and Component 2, several parameters must be considered. It could be the subject of a different thesis to decide where in Eastern Europe to locate the manufacturing plant for these components; whether to fully make the component here or just perform some pre-assembly for further termination or re-tooling to incoming parts; whether to acquire a plant, build it, merge, associate or simply outsource the manufacturing operations; and several other aspects that make this decision a delicate one. Moreover, depending on who is Volvo’s first-tier supplier (today CURRENT SUPPLIER), additional factors would come into consideration. Possible existing or planned partnerships of such company in specific countries; ongoing studies for sourcing in emerging markets; national preferences; and several more factors that make a definitive decision to be made on this study not viable and mainly impractical. Instead, this thesis explores different alternatives within Eastern Europe according to labor cost and other basic parameters that can give a clear idea on the potential situation. The countries that are considered in this section are Romania, Slovakia, Czech Republic, Hungary, Turkey, and Poland. For those components that have not been mentioned before (those not in the list of main components of section 4.1) it will be assumed that they are sourced from their current suppliers. This also applies to the component that does not show potential savings if it were sourced from Asia.
66

Similar to the first alternative, Volvo would not buy these components directly, since there must be a seat-supplier in charge of the whole flow, acting Volvo as first-tier supplier. Volvo would receive the finished seats. The reasons why the figure of the first-tier seat supplier in the first and second potential alternatives is left undefined are several. These alternatives are intended to show the management wide options when seeking lower costs for cost for the seats, thus avoiding further considerations as to which supplier it should be. In this way, the option is open to almost any seat supplier who is interested in working in close partnership with Volvo Trucks, and willing to listen to Volvo’s suggestions regarding second-tier suppliers. This does not in any way exclude CURRENT SUPPLIER, which actually could be highly beneficial to work with considering the level of partnership already achieved with them. But designing the potential alternatives assuming that CURRENT SUPPLIER, or any specific company, will definitely be the main seat supplier would bring additional constraints at every step of this research: such company’s interests would need to be included in any consideration and assumption made for this research, consuming resources and time. And above all, not allowing this study to focus the totality of its attention in Volvo’s interests. Transport Operations to Final Assembly Umeå The transport of components from Asia to Umeå will occur in the same way as for the first alternative (section 4.3.1). For the components coming from Eastern Europe, the countries considered are: ‐ Slovakia ‐ Czech Republic ‐ Hungary ‐ Romania ‐ Turkey ‐ Poland
These countries were suggested as options by Volvo 3P. The transport times from these countries range between 5 to 9 days46. These transports are made by road, in full trailers. Many options for routing exist for these transports. Components are transported by either road or rail to typical transport hubs in Europe such as Lubeck or Travemunde, for ferry transports to Sweden. From there, the trailers can either arrive in Umeå via Holmsund (by ferry) or via Gothenburg (by rail), among several other options.
46 According to Volvo Logistics and other logistics partners of Volvo.
67
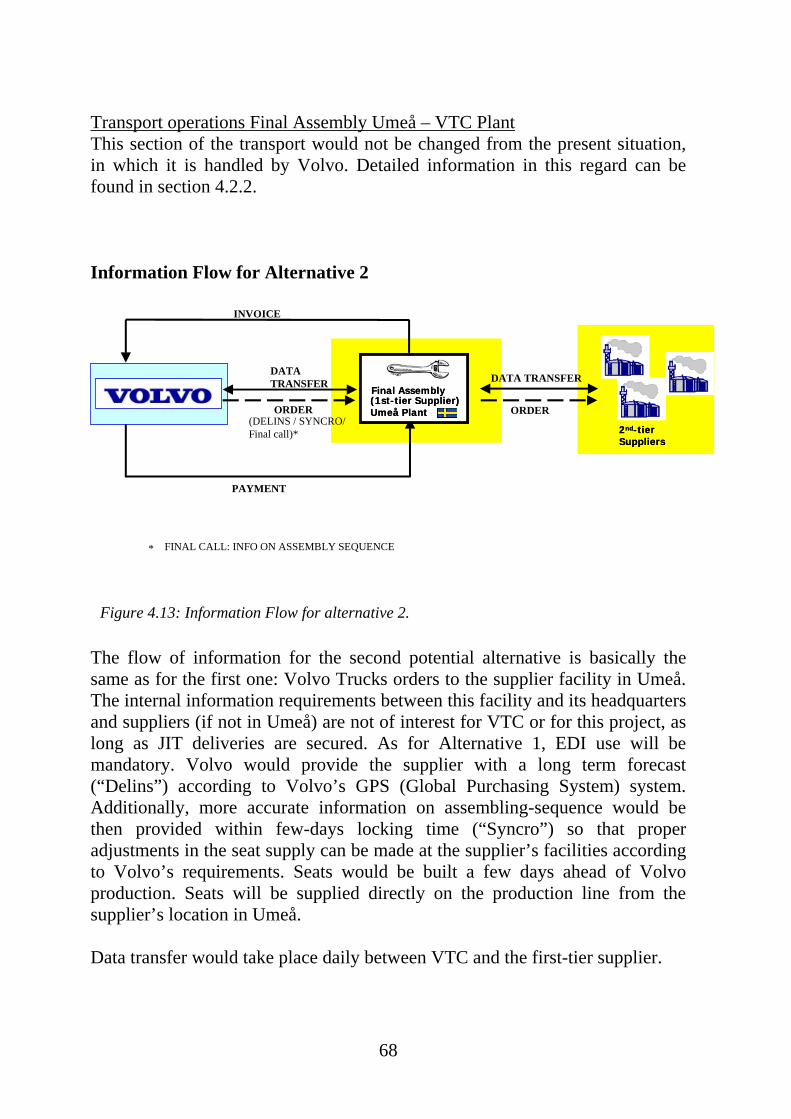
Transport operations Final Assembly Umeå – VTC Plant This section of the transport would not be changed from the present situation, in which it is handled by Volvo. Detailed information in this regard can be found in section 4.2.2. Information Flow for Alternative 2 * FINAL CALL: INFO ON ASSEMBLY SEQUENCE
INVOICE
PAYMENT
ORDER
DATA TRANSFER
(DELINS / SYNCRO/ Final call)*
DATA TRANSFER
ORDER
Final Assembly(1st-tier Supplier) Umeå Plant
Final Assembly(1st-tier Supplier) Umeå Plant
Final Assembly(1st-tier Supplier) Umeå Plant
2nd-tier Suppliers2nd-tier Suppliers
Figure 4.13: Information Flow for alternative 2.
The flow of information for the second potential alternative is basically the same as for the first one: Volvo Trucks orders to the supplier facility in Umeå. The internal information requirements between this facility and its headquarters and suppliers (if not in Umeå) are not of interest for VTC or for this project, as long as JIT deliveries are secured. As for Alternative 1, EDI use will be mandatory. Volvo would provide the supplier with a long term forecast (“Delins”) according to Volvo’s GPS (Global Purchasing System) system. Additionally, more accurate information on assembling-sequence would be then provided within few-days locking time (“Syncro”) so that proper adjustments in the seat supply can be made at the supplier’s facilities according to Volvo’s requirements. Seats would be built a few days ahead of Volvo production. Seats will be supplied directly on the production line from the supplier’s location in Umeå. Data transfer would take place daily between VTC and the first-tier supplier.
68

Once the seat is delivered at the assembly line, the invoice process will be triggered as well as the electronic payment. The main difference between the first 2 potential alternatives is the manufacturing of Component 1 and Component 2 in an Eastern-Europe country, but this change will not be reflected in the information flow from VTC’s perspective; it is the responsibility of the 1st-tier supplier to arrange its communication with its suppliers. Service Level for Alternative 2 As in the case of Alternative 1, Volvo’s JIT operations and sequence production require the first-tier supplier to provide timely service. Since “Service level tier 1 – Volvo” will not change in any of the alternatives proposed, with no regards as to which company acts as tier 1 supplier, the service levels discussion for the this alternative will also focus on the service level “tier 2 – tier 1”. Service Level Tier 2 – Tier 1 The parameters considered in this section are the same parameters are • Transit Time The transit times for components coming by ship from China and India to Gothenburg is around a month (30 days). From Gothenburg to Umeå, the transit time is around one day. For components coming from Eastern Europe to Umeå the transit time ranges from 5 to 9 days. The considerations made on this aspect regarding components coming from Asia were already discussed in Alternative 1. For components coming from Eastern Europe, the situation is more similar to the way in which transport operations are performed in the current situation, mostly using road or rail transport, with a section performed by ferry. • Lead time Specific lead times are hard to estimate since the first tier supplier is not defined in this case, nor are the potential second tier suppliers in Asia and Eastern Europe. The lead times are expected to be longer for those components supplied from China and India as a result of longer distances and transit times in relation to the current situation. For components 1 and 2, being assembled in Eastern Europe, the lead-time is expected to be shorter than for components coming from Asia, and not too different from that of today’s situation.
69
• Reliability Reliability can be affected by the longer transport operations resulting from bringing components from Asian and Eastern European nations. Long transport journeys have higher probabilities of suffering delays due to unexpected situations, as well as more trans-shipment operations. The hazards to reliable transport operations are higher for components shipped from Asia than for components delivered from Eastern Europe. • Accuracy Accuracy gains additional importance in the alternatives since wrong products delivered from long distances will take longer to be detected and corrective measures will take longer to have effect. As for the other Alternatives, effective measures must be implemented by the suppliers in order to eliminate or decrease the probability of occurrence of this kind of errors, e.g. efficient use of bar-codes and packaging techniques and procedures. The second Alternative combines considerations from both the current situation and the first Alternative. On one hand, some of the main components are sourced from China and India. On the other hand, other main components are sourced from Eastern Europe, in which case the circumstances although not totally similar, are somewhat comparable to the current situation, at least as far as transport operations are concerned. Eastern Europe offers advantages in potential cost-savings without including the hazards to the service levels of time-demanding ocean transport. This may suggest that further attention should be put in this region, researching on the possibility of sourcing a higher number of components and moving manufacturing operations there.
70

4.3.3 Potential Alternative 3: Emerging markets component sourcing through CURRENT SUPPLIER This is the alternative most similar to today’s situation. In this case, CURRENT SUPPLIER is the main seat supplier. However, some second-tier suppliers would be changed. This could be upon agreement between VTC and CURRENT SUPPLIER, seeking a lower total cost for the seats. Material Flow for Alternative 3
Current Supplier’s Europe Plant
Final Assembly
(Current Supplier) Umeå Plant
Final Assembly
(Current Supplier) Umeå Plant
CHINA
INDIA
Other 2nd-tier suppliers based in Europe
UMEÅ Cab Plant COMPLETE SEATS
Components Supply
Figure 4.14: Material Flow for alternative 3.
The third alternative shows CURRENT SUPPLIER as Volvo’s first-tier supplier, as it is today. With CURRENT SUPPLIER currently manufacturing some of the main components, (including Component 1 and Component 2) from its Europe factory (not in Sweden), their reluctance to source those components from China or India is to some extent expected. However, it is of their interest to reduce the total costs of the seats as well. It might be interesting for CURRENT SUPPLIER to investigate the potential savings of sourcing some components from emerging markets as the ones this project considers.
71

Furthermore, if evidence were shown proving that lower costs can be achieved by sourcing in different markets, there would be no reason not to consider the option at least for some of the components. In the third alternative Component 1 and Component 2 are still manufactured at CURRENT SUPPLIER’s factory in Europe. The same component that offers no savings if sourced from Asia is considered to remain being sourced from its current supplier. The rest of the main components could come from Asia, similar to alternative 2. All components would arrive at Umeå for final assembly. This assembly would take place at CURRENT SUPPLIER Umeå, 300 meters away from VTC cab-plant, same as today. Transport Operations to Final Assembly at CURRENT SUPPLIER Umeå The transport of components from Asia to Umeå will occur in the same way as for the first alternative. Components 1 and 2, coming from CURRENT SUPPLIER factory will come as they do today (see section 4.2.2) Transport operations CURRENT SUPPLIER Umeå – VTC Plant The final delivery to VCT can be made as it is made at present (described in section 4.2.2). Opposed to today’s situation, the completed seats would not be delivered to the JIT cell but directly into the production line.
72

Information Flow for Alternative 3
INVOICE
PAYMENT
ORDER
DATA TRANSFER
(DELINS / SYNCRO)
DATA TRANSFER
ORDER
* FINAL CALL: INFO ON ASSEMBLY SEQUENCE
Final Assembly(Current Supplier) Umeå Plant
Final Assembly(Current Supplier) Umeå Plant
Final Assembly(Current Supplier) Umeå Plant
Current Supplier’s Europe PlantCurrent Supplier’s Europe Plant
Other 2nd-tier SuppliersOther 2nd-tier Suppliers
Figure 4.15: Information Flow for alternative 3. Given the high similarity between the third alternative and the current situation, the information flow for both will not differ greatly, the main difference being the elimination of the JIT cell. Like for the second alternative, the change in the communication between CURRENT SUPPLIER and its suppliers will not be reflected in the information flow from VTC’s perspective. Service Level for Alternative 3 As in for all Alternatives, Volvo’s JIT operations and sequence production require the first-tier supplier to provide timely service. Since “Service level tier 1 – Volvo” will not change in any of the alternatives proposed, with no regards as to which company acts as tier 1 supplier, the service levels discussion for the this alternative will also focus on the service level tier 2 – tier 1. Potential changes to the service level may originate from the increased distances form where some components will be sourced. In order to keep a high service level, CURRENT SUPPLIER must ensure on-time deliveries to VTC plant. Service Level Tier 2 – Tier 1 The parameters considered in this section are the same parameters are
73

• Transit Time The transit times for components coming by ship from China and India to Gothenburg is around a month (30 days). From Gothenburg to Umeå, the transit time is around one day. For components coming from CURRENT SUPPLIER factory, the transit time ranges from 2 to 6 days. The implications for the service levels of both situations from the transporttime perspective have been extensively discussed in the service level sections for the current situation and the first and second Alternatives. • Lead time The lead times are expected to be longer for those components supplied from China and India as a result of longer distances and transit times in relation to components sourced from CURRENT SUPPLIER factory in Europe. • Reliability Reliability can be affected by the longer transport operations resulting from bringing components from Asian nations. Long transport journeys have higher probabilities of suffering delays due to unexpected situations, as well as more trans-shipment operations. • Accuracy Accuracy is more important in the alternatives since wrong products delivered from long distances will take longer to be detected and corrective measures will take longer to have effect. Alternative 3 is unique among the alternatives in the sense that it considers CURRENT SUPPLIER as the first-tier supplier of seats. As the evidence shows so far in this thesis, the fewer components sourced from emerging markets the lower the potential cost-savings, even more when it comes to Components 1 and 2, which require long assemblies. This is reflected in the lowest potential savings among the three Alternatives for Alternative 3 (see Appendixes A, B and C). However, the situation must be seen with more attention, as it also implies the benefits of doing business with a known partner, avoiding thus the “investment costs”47. If the investment costs are considerable, such benefits gain importance. In the case of Alternative 3, Volvo and CURRENT SUPPLIER may decide to investigate the possibility of sourcing not only main components but also more standard components. This point is further developed in the recommendations section (6.2). 47 Investment costs, as considered in this document, include those costs associated to starting business with a new partner e.g. establishment of electronic communications, acquisition of new assets, etc.
74

5. Analysis The analysis corresponds to the ways in which data collected during the whole thesis is used in order to answer the research questions formulated for the project. Sub-questions A and B have already been answered in sections 4.2 and 4.3 respectively. Once the analysis chapter is finished, the main research question Do the proposed alternatives offer significant potential cost savings, at adequate service levels, over the current situation for Volvo 3P regarding the seat supplying process for Volvo Trucks in Europe? will be answered. The analysis will focus on the estimation of the potential cost savings offered by every potential alternative and the comparison of service levels associated to each alternative in relation to current service levels.
5.1 Estimation of the Potential Cost Savings When calculating the cost savings of a component, several factors need to be considered. For several reasons, the calculations carried out in this section of the thesis do not include all such factors. Too many variables came into consideration, and considering the number of components, possible origins and potential suppliers that had to be researched on for each alternative, estimating all of the factors for all of the possibilities would have been nearly a never-ending project. Therefore, it was decided by the authors of this thesis in agreement with the supervisors48 to take into consideration the following cost-factors in the calculation of cost-savings for each component: ‐ Component cost at the origin ‐ Transportation cost from different origins to the final assembly facility in
Umeå, which include: freight costs (different origins - Umeå) by different modes, handling costs at ports and terminals and local charges.
‐ Packaging costs. On the other hand, the calculations on this project do not include estimations on inventory-carrying costs. These costs depend on how the first-tier supplier
48 Both the University’s supervisor and the Company’s supervisor.
75

manages its business, under which terms it buys from its suppliers, its inventory policies, logistics strategies, and so on. Estimating such conditions on hypothetical alternatives as the ones proposed in this thesis is virtually impossible, since too many assumptions would need to be made. In addition, such costs are not expected to vary greatly in relation to the current situation. Transaction costs are equally excluded from these calculations. Their estimation is highly complex, even more in totally hypothetical situations as the three alternatives shown. They are expected to increase to some extent, although its impact should not be so high if all suppliers concerned use EDI systems. Therefore, in the case of the cost considerations for this project, focus is made on potential cost-savings estimations rather than in total cost calculations.
5.1.1 Estimation of the total potential cost savings for each component In order to understand how the savings per alternative were calculated, it must be first understood how these savings were estimated for each component. As it has been mentioned throughout this document, confidential information must not be released regarding matters considered strategic by Volvo or its partners. Therefore, the calculations made in order to estimate the potential cost-savings cannot be included in this document. However, examples will be used to illustrate how these calculations were made for each component. The general formula used for the estimation of the cost-savings per component is: (Formula 1) Current cost in Umeå – Potential cost in Umeå
Next, an explanation on how this formula is applied to the components coming from each of the potential origins (China, Eastern Europe and India) will be shown. To show the procedure in a proper way, let’s take examples of component Q, R and W, coming from China, Eastern Europe and India respectively. (All values used in the examples are completely fictitious and only used for the purpose of explaining the way in which the calculations were made). Component coming from China (Component Q) For component Q, Formula 1 takes the following form: (Formula 2) [C1 + T1] – [CN + TN]
76

Where: C1 is the current component cost. T1 is the current cost of positioning the component in Umeå. CN is the potential component cost in china. TN is the potential Cost of positioning the component in Umeå. Current component cost (C1) is provided by CURRENT SUPPLIER. It corresponds to the cost of the component not including positioning costs. Let’s assume that for component Q
C1 = 25 €
Current cost of positioning the component in Umeå (T1) is provided by CURRENT SUPPLIER. It corresponds to the transportation and packaging cost of positioning the component in the assembly facilities in Umeå. Its calculation is:
T1 = C1 x M% Where
T1 is the current cost of positioning the component in Umeå. C1 is the current component cost M% is the percentage charged by the current supplier as Transport and Packaging Costs. Let’s assume that in this case,
M = 5%
Therefore,
T1 = 25 € x 5% = 1, 25€ Potential Component cost in China (CN) comes from several quotations by potential Chinese suppliers in FOB Shanghai terms. In this way, the packaging, pre-carriage to Shanghai and other associated local charges are already included. Let’s assume that the FOB cost estimation of Q is given in the form of a range between the highest and lowest quotations received. For Q, we assume that
Minimum quotation = 10 € Maximum quotation = 12 €
Therefore, for component Q
Minimum CN = 10 €
77

Maximum CN = 12 € Information regarding the potential cost of positioning the component in Umeå (TN) for components coming from China is provided by Volvo Logistics, although as mentioned before the actual costs are not used in these examples. It is estimated considering that the components are transported in 40 ft containers. The cost of taking one 40 ft container from Shanghai to Umeå is between 3.000€ and 4.000€49, including the sea freight Shanghai – Gothenburg and the land freight Gothenburg – Umeå. Knowing the packaging information for component Q, and the dimensions of a 40 ft container, it could be determined that 600 units of Q can be packed in one 40 ft container. Therefore, TN for component Q is:
Minimum TN = 3.000 € / 600 units = 5 €/unit Maximum TN = 4.000 € / 600 units = 6, 67 €/unit
Once C1, T1, CN and TN are defined, the range of savings per component is obtained using formula 2:
[C1 + T1] – [CN + TN]
Minimum savings / Component Q: [25 €+ 1, 25 €] – [12 € + 6, 67 €] = 7,58 € Maximum savings / Component Q: [25 €+ 1, 25 €] – [10 € + 5 €] = 11,25 € Assuming that for 2004 the volume for component Q is 50.000 units, the total annual savings if component Q is sourced from China are: Minimum Annual savings Component Q
7,58 € x 50.000 units = 379.000 €
Maximum Annual savings Component Q 11,25 € x 50.000 units = 562.500 €
Component coming from Eastern Europe (Component R) For component R, Formula 1 takes the same form as for Q: (Formula 2) [C1 + T1] – [CN + TN] Where: C1 is the current component cost. 49 Real values correspond to contract-costs given by carriers to Volvo Logistics, so that in the examples fictitious costs are used instead of actual costs.
78

T1 is the current cost of positioning the component in Umeå. CN is the potential component cost in each different origin in Eastern Europe. TN is the potential Cost of positioning the component in Umeå. Current component cost (C1) is provided by CURRENT SUPPLIER. It corresponds to the cost of the component not including positioning costs. Let’s assume that for component R
C1 = 50 €
Current cost of positioning the component in Umeå (T1) is provided by CURRENT SUPPLIER. It corresponds to the transportation and packaging cost of positioning the component in the assembly facilities in Umeå. Its calculation is:
T1 = C1 x M% Where
T1 is the current cost of positioning the component in Umeå. C1 is the current component cost M% is the percentage charged by the current supplier as Transport and Packaging Costs. Let’s assume that in this case,
M = 5%
Therefore,
T1 = 50 € x 5% = 2, 5 € Potential Component cost in each different origin in Eastern Europe (CN) is based on labor costs. This method is used for components 1 and 2, to be assembled in Eastern Europe. In this case, one single source for the labor costs50 of the different countries was used. The calculation is based on the variation of the labor costs maintaining the same other factors (Assembly time, material cost, material overheads, material venture, etc) constant on current levels. With the labor-costs for each of the Eastern European countries considered, and being the assembly time and other production data known, the total manufacturing cost for Component R can be estimated as a range (for Eastern Europe):
Minimum CN = 30 € Maximum CN = 35 €
50 EMS (unit within the Volvo Group) database.
79

Potential Cost of positioning the component in Umeå (TN) for components coming from Eastern Europe is estimated considering that the components are transported in full Trailers. The cost of taking one full trailer from the specific Eastern European country to Umeå is between 2.500 € and 3.500 €51. Knowing the packaging information for component R, and the dimensions of a trailer, it could be determined that 400 units of R can be packed in one Trailer. Therefore, TN for component R is:
Minimum TN = 2.500 € / 400 units = 6,25 €/unit Maximum TN = 3.500 € / 400 units = 8,75 €/unit
Once C1, T1, CN and TN are defined, the range of savings per component is obtained using formula 2:
[C1 + T1] – [CN + TN]
Minimum savings / Component R: [50 €+ 2,5 €] – [35 € + 8,75 €] = 8,75 € Maximum savings / Component R: [50 €+ 2,5 €] – [30 € + 6,25 €] = 16,25 € Assuming that for 2004 the volume for component R is 50.000 units, the total annual savings if component R is sourced from Eastern Europe are: Minimum Annual savings Component R
8,75 € x 50.000 units = 437.500 €
Maximum Annual savings Component R 16,25 € x 50.000 units = 812.500 €
Component coming from India (Component W) For Component W coming from India, formula 1 takes the form: (Formula 1) [C1 + T1] – [CN + TN] =[ C1+T1] – [(C1+T1)x(1-P%)] (Formula 3) =[C1+T1] x P% Where: C1 is the current component cost. T1 is the current cost of positioning the component in Umeå. P% is the estimated reduction in landed cost.
51 Real values correspond to contract-costs given by carriers to Volvo Logistics and other Logistics Partners, so that in the examples fictitious costs are used instead of actual costs.
80

Current component cost (C1) is provided by CURRENT SUPPLIER. It corresponds to the cost of the component when it arrives at the final assembly location in Umeå not including the positioning costs. Let’s assume that for component W
C1 = 40 € Current cost of positioning the component in Umeå (T1) was provided by CURRENT SUPPLIER. It corresponds to the transportation and packaging cost of positioning the component in the assembly facilities in Umeå. Its calculation is:
T1 = C1 x M% Where
T1 is the current cost of positioning the component in Umeå. C1 is the current component cost M% is the percentage charged by the supplier as Transport and Packaging Costs. Let’s assume that in this case,
M = 5%
Therefore, T1 = 40 € x 5% = 2 €
The estimated reduction in landed cost (P%) is provided by experts within Volvo Group with experience in component sourcing from emerging markets. Let’s assume that for component W:
P = 20% to 30% Therefore, using formula 3: Minimum savings for W= [40 €+ 2 €] x 20% = 8,4 € / unit Maximum savings for W= [40 €+ 2 €] x 30% = 12,6 € / unit Assuming that for 2004 the volume for component W was 50.000 units, the total annual savings if component W is sourced from India are: Minimum Annual savings Component W
8,4 € x 50.000 units = 420.000 €
Maximum Annual savings Component W 12,6 € x 50.000 units = 630.000 €
81

5.1.2 Estimation of the total potential cost savings for Alternative 1 The nature of the first alternative is to consider as many components as possible will be sourced from China and India. It presents around 70% of the main components coming from China, and the remaining main components coming from India. In this case, one of the analyzed components showed no savings in relation to current costs if sourced from Asia, so that it is assumed to come from the same supplier as currently, offering no potential savings. For the estimation of the annual savings per component for Alternative 1, calculations according to the examples in section 5.1.1 were used: For components coming from China, refer to component Q; for components coming from India, refer to component W. Once the annual savings per component are estimated, it is possible to estimate the potential annual cost savings for the complete Alternative. In order to better understand this procedure, the reader can refer to Appendix A: Calculations for Alternative 1. It can be seen in the Appendix that since several quotations were considered for both components and transportation, the annual savings for each component are shown in the form of a range. Consequently the Annual Savings for Alternative 1 are shown in the form of 2 ranges. The first one (Total Savings 1 in Appendix A) is estimated sourcing components from China disregarding the Indian option when both China and India are possible origins for the component. The second one (Total Savings 2 in Appendix A) is estimated sourcing components from India and disregarding the Chinese option when both China and India are possible origins for the component. Once the 2 estimated savings ranges are established (A-B and C-D in Appendix A), they must be compared to the total spent in those same components (main components) in the current situation (values E and F in Appendix A), to determine the percentage saved if the first Alternative was implemented. By calculating C/F (minimum potential savings for alternative 1 divided by maximum current spent) the minimum savings percentage is obtained. By calculating B/E (maximum potential savings for Alternative 1 divided by minimum current spent) the maximum savings percentage is obtained. For Alternative 1, total annual savings of at least 23% can be achieved. This value concurs to usual expected savings when sourcing components from emerging markets, according to interviews held with several experienced persons. It must be remarked that the minimum savings are estimated using the
82

highest potential costs against the lowest current costs, it is, the 2 extreme cases. It is the belief of the authors of this thesis that higher savings could be realistically expected.
83

5.1.3 Estimation of the total potential cost savings for Alternative 2 The second option considers that as many components as possible will be sourced from China and India, while the assembly of component 1 and component 2 will take place in a country in Eastern Europe. It presents around 55% of the main components coming from China. Around 30% of the main components could be sourced from India. In this case, one of the analyzed components showed no savings in relation to current costs if sourced from Asia, so that it is assumed to come from the same supplier as currently, offering no potential savings. For the estimation of the annual savings per component for Alternative 2, calculations according to the examples in section 5.1.1 were used: For components coming from China, refer to component Q; for components coming from India, refer to component W and for components 1 and 2, coming from Eastern Europe, refer to component R. Once the annual savings per component are estimated, it is possible to estimate the potential annual cost savings for the complete Alternative. In order to better understand this procedure, the reader can refer to Appendix B: Calculations for Alternative 2. It can be seen in the Appendix that since several quotations were considered for both components and transportation, the annual savings for each component are shown in the form of a range. Consequently the Annual Savings for Alternative 2 are shown in the form of 2 ranges. The first one (Total Savings 1 in Appendix B) is estimated sourcing components from China disregarding the Indian option when both China and India are possible origins for the component. The second one (Total Savings 2 in Appendix B) is estimated sourcing components from India and disregarding the Chinese option when both China and India are possible origins for the component. Once the 2 estimated savings ranges are established (A-B and C-D in Appendix B), they must be compared to the total spent in those same components (main components) in the current situation (values E and F in Appendix B), to determine the percentage saved if the second Alternative was implemented. By calculating C/F (minimum potential savings for alternative 2 divided by maximum current spent) the minimum savings percentage is obtained. By calculating B/E (maximum potential savings for Alternative 2 divided by minimum current spent) the maximum savings percentage is obtained. For Alternative 2, total annual savings of at least 23% can be achieved. As mentioned for Alternative 1, this value concurs to usual expected savings when
84

sourcing components from emerging markets, according to interviews held with several experienced persons. It must be remarked that the minimum savings are estimated using the highest potential costs against the lowest current costs, it is, the 2 extreme cases. It is the belief of the authors of this thesis that higher savings could be realistically expected.
85

5.1.4 Estimation of the total potential cost savings for Alternative 3 Different from Alternatives 1 and 2, the third alternative shows CURRENT SUPPLIER as Volvo’s first-tier supplier, as it is today. Component 1 and Component 2 are still manufactured at CURRENT SUPPLIER’s factory in Europe. The rest of the main components could come from Asia, similar to alternative 2. For the estimation of the annual savings per component for Alternative 3, calculations according to the examples in section 5.1.1 were used: For components coming from China, refer to component Q; for components coming from India, refer to component W. Components 1 and 2 will offer no savings as they are considered to be sourced as they are today. Once the annual savings per component are estimated, it is possible to estimate the potential annual cost savings for the complete Alternative. In order to better understand this procedure, the reader can refer to Appendix C: Calculations for Alternative 3. It can be seen in the Appendix that since several quotations were considered for both components and transportation, the annual savings for each component are shown in the form of a range. Consequently the Annual Savings for Alternative 3 are shown in the form of 2 ranges. The first one (Total Savings 1 in Appendix B) is estimated sourcing components from China disregarding the Indian option when both China and India are possible origins for the component. The second one (Total Savings 2 in Appendix B) is estimated sourcing components from India and disregarding the Chinese option when both China and India are possible origins for the component. Once the 2 estimated savings ranges are established (A-B and C-D in Appendix C), they must be compared to the total spent in those same components (main components) in the current situation (values E and F in Appendix C), to determine the percentage saved if the third Alternative was implemented. By calculating C/F (minimum potential savings for alternative 3 divided by maximum current spent) the minimum savings percentage is obtained. By calculating B/E (maximum potential savings for Alternative 3 divided by minimum current spent) the maximum savings percentage is obtained. For Alternative 3, total annual savings of at least 14% can be achieved. This value is a lower than the estimated savings for alternatives 1 and 2 because the two more expensive components (components 1 and 2) are still sourced from the current supplier, not located in an emerging market. Again, it must be remarked that the minimum savings are estimated using the highest potential
86

costs against the lowest current costs, it is, the 2 extreme cases. It is the belief of the authors of this thesis that higher savings could be realistically expected. From the estimated savings from the 3 alternatives, some remarks can be pointed. • The potential savings shown for each alternative reflect the savings in the
cost of the components positioned in the final assembly plant in Umeå; disregarding who the seat-supplier is and which specific company performs the final assembly this plant must be nearby Volvo Cab Plant in Umeå. This thesis does not include considerations or calculations beyond this point. Keeping in mind the supply chain perspective, savings for the pipeline must benefit all of its members; Volvo as OEM and final buyer of the seats will benefit to some extent from such savings although it is not buying these components directly.
• Even though the sources used for the costs estimations52 played a vital role
in the results achieved, the authors believe that similar estimations would have been reached if different sources had been used.
• As the origin of Component 1 and Component 2 was a major driver in the
definition of the different alternatives, the cost of these 2 components was a major determinant of the consequent cost savings achieved by each alternative. From the results of the calculation it is easy to observe that the minimum cost savings for Alternative 1 and 2 are similar, and higher than for alternative 3. This finding meets the expectations prior to the calculations, since in alternative 1 and alternative 2 the main components are sourced from emerging markets, while in alternative 3 they are not. Given the fact that Components 1 and 2 are high-labor consuming (long manufacturing time, including extensive labor), and have the highest costs within the main components considered, it can be concluded that emerging markets offer more appealing savings-opportunities for high-labor consuming components than for low-labor consuming components.
• Alternative 1 and Alternative 2 show similar minimum cost savings. When
defining the alternatives, two aspects were kept in mind: component cost and positioning cost. Since the labor cost in Asia is lower than the labor cost in Eastern Europe, and at the same time Eastern Europe is closer to Umeå than Asia, the results are not unexpected.
52 Quotations for components and transport operations, experts’ opinions and labor-cost based estimations.
87

• All the calculations were based in the annual volumes of seats53 used by
Volvo Trucks for 2004. Further analysis on the components of specific seats was necessary for establishing the volumes of the different components.
• Based on the calculations, one component does not show savings if it is
sourced from the emerging markets included in this study. • For the results achieved in Alternative 2, 6 different countries 54 were
considered as potential origins, although in the results shown in Appendix B for the costs estimations they are all gathered as Eastern Europe.
53 For STANDARD and COMFORT seats. 54 Slovakia, Romania, Hungary, Poland, Turkey, Czech Republic.
88

5.2 Service Levels Analysis The service implications of any logistical modification to a process are highly important when considering such changes as the ones this project proposes. Achieving high cost-savings would mean little if the service levels are significantly affected. In a general way, some aspects can be discussed that may potentially affect the logistics service levels when components sourcing is done from long distance emerging markets. The following discussion does not refer to a specific alternative but rather it is focused on general aspects that concern the three of them. Based on this discussion, a further analysis of the 4 parameters (transit time, lead time, reliability, accuracy) for the three alternatives will follow. Longer lead-time Most of the hazards to the process derived from the change to distant emerging markets sourcing are related to the increase of the lead-time for the components sourced from Asia and Eastern Europe. Although it can be argued that this increase in the lead-time will affect the first-tier supplier and therefore it should be his sole responsibility to overcome it, one must keep in mind that any disturbance in the process for the seat supplier will ultimately affect VTC’s sequence production, and thus it is worth being considered. Stronger requirements will fall upon the first-tier supplier when sourcing from long-distance markets. Risk of wrong parts or wrong quantities delivered In the event of a mistake in the components shipped from a supplier in a distant market, it would take longer to identify such mistake and therefore to correct it. Given the transport time of approximately one month from Asian suppliers, any mistake in the components shipped will affect the subsequent delivery of seats to VTC plant in Umeå in a greater way than it would today, when the transport times from current second-tier suppliers to the seats-final assembly in Umeå are among 2 and 6 days. Furthermore, when expedite shipments are necessary it takes usually one day to bring the required parts to Umeå in the current situation. At least 3 business days (and at a much higher cost) will be necessary for the delivery of the part from Asia. Risk of defects Similar to the chance of wrong product delivered, the delivery of a defective part would take longer to be discovered and subsequently corrected. In addition, by the time a defective part, or parts, is identified at Umeå, more defective parts might have been produced and already shipped.
89

Risk of accident Given the longer distances, several modes are used for different sections of the transport operations. Sea transport brings the typical risks associated with the ocean, like tornadoes, sea-storms and sinking. Road and rail transport always imply the risk of accident; even though numerous safety measures are implemented frequently, accidents are always a possibility. It is true that the current situation of the supplying process also includes sea, road and rail transport, therefore presenting the same risks as the alternatives, but the exposure of the components to such hazards would be higher in the proposed alternatives to the extent that the goods will spend more time in transit. Risk of damage Longer distances imply more trans-shipments at ports and terminals, resulting in more handling operations, during which the goods may suffer damage. Packaging plays an important role in preventing the occurrence of such situations. Given the characteristics of long-distance transportation, different and probably more expensive packaging is necessary. Other associated risks Depending on the transport routes, and the transit regions, there exists the risk of loss of goods due to pillage. Additionally, strikes are frequent at maritime ports and due to the increase in port operations for components coming from Asia the exposure of the goods to this kind of stop would be higher. Problems related to the Information systems used by the 2nd-tier suppliers can arise. It has been stated before that Volvo’s suppliers are required to have EDI capabilities. But those information transfers between the 1st-tier supplier and its suppliers might not be as agile, if their information systems are not compatible. This may cause errors of different kinds that must be prevented. The following analysis will be focused on the four service-levels parameters considered when describing the current situation and the different alternatives. Each parameter will be discussed considering the 3 alternatives and the current situation. In all cases, Volvo’s JIT operations and sequence production require the first-tier supplier to provide timely service. Since “Service level tier 1 – Volvo” will not change in any of the alternatives proposed, with no regards as to which company acts as tier 1 supplier, the service levels discussion will focus on the service level tier 2 – tier 1.
90

5.2.1 Transit Time In this thesis the transit time is considered from origin of the components (China, India, Eastern Europe, Current 2nd-tier suppliers) to seats-final-assembly in Umeå. ‐ In the current situation, the transit time for the components is between 2
and 6 days. ‐ In Alternative 1, the transit time is approximately 30 days for components
coming from Asia. ‐ In Alternative 2, the transit time is between 5 and 9 days for components
coming from Eastern Europe and approximately 30 days for components coming from Asia.
‐ In Alternative 3, the transit time for Components 1 and 2 is between 2 and 6 days. For Components coming from Asia, the transit time is around 30 days.
All alternatives consider changes in the origins only for the main components focus of study. Those components whose origin is not modified (because they are not in the list of main components or because they offered no savings) are not considered in the analysis. The long transit time associated to long distance transport has direct incidence on some of the factors discussed at the beginning of this section: the effect of wrong parts delivered and defective components; as well as the risk of accident and damage are higher for those components in all the alternatives coming from Asia. To lesser extent in the case of components coming from Eastern Europe, although for these components the risk of loss due to pillage and accident can be higher depending on the conditions of each country of origin as well as of transit.
5.2.2 Lead Time Shorter lead times mean more flexibility and faster overall response to unexpected situations such as demand fluctuations. The transport times of components transported from Eastern Europe (Poland, Czech Republic, Slovakia, Hungary, Romania, Turkey or Poland) would basically not be too higher in relation to the current transport times, although depending on different factors, like infrastructure condition, blocks, etc, these times can vary to some extent. Although lead times are not the same as transit times, they are certainly linked, as longer transit times usually imply longer lead times. Since no first-tier supplier is defined in the first two alternatives, and in the case of CURRENT SUPPLIER its lead-time information regarding its suppliers is not known, specific lead-time estimations cannot be made.
91

5.2.3 Reliability Reliability can be affected by the longer transport operations in the different alternatives. Long transport journeys have higher probabilities of suffering delays due to unexpected situations, as well as more trans-shipment operations. The 3 alternatives include some degree of distant transportation, so that the risk of reliability issues from tier-2 suppliers to the tier-1 supplier can increase in relation to the current situation.
5.2.4 Accuracy Accuracy is very important in the alternatives since wrong products or wrong quantities delivered from long distances will take longer to be detected and corrective measures will take longer to have effect. It is therefore important to pay special attention to this aspect for components coming from long-distance markets. From the prior analysis, it is clear that the higher the distance the goods need to be transported, the higher the risks of the service levels to be affected. Components coming from Asia and Eastern Europe must be transported higher distances than in the current situation, and will spend more time in transit. However, the potential cost-savings resulting from emerging markets sourcing are too considerable to ignore. Furthermore, the risks to the service levels are several but are not impossible to overcome. Several initiatives can be undertaken by both the first-tier and second-tier suppliers (from Volvo’s perspective). In order to reduce the risks associated with longer lead-times as a result of long distances and in-transit times, an option for the first-tier seat-supplier could be to keep some intermediate inventory somewhere in Europe. This inventory would be aimed at reducing the response time towards unexpected situations. This would help reduce the risks of too-long transport and lead-times, as well as those affecting the reliability and accuracy.
92

6. Conclusions and Recommendations In this chapter, general conclusions regarding the findings of this project are presented. Next, recommendations by the authors based on the investigation will be given.
6.1 Conclusions The Conclusions of the present thesis are: • The three alternatives offer cost savings in relation to the current situation of
the seat supplying process. Although some aspects, like inventory, financial and transaction costs were not included in the calculations for practical reasons, the findings of the present thesis are a real indicator of the potential opportunities of component sourcing from emerging markets. Furthermore, those costs that were not included are not expected to present changes in relation to the current situation big enough to alter the results of the study.
• Labor-intensive components (components that require much manual labor)
offer the highest possibilities for savings if sourced from emerging markets, due to their low labor costs as well as low tooling costs.
• The technical complexity of some components can make it difficult, and
longer, to get proper quotations from potential suppliers, since the more technically advanced the component, the more information is required. In addition, the technical complexity of some components can constitute a barrier to its sourcing from emerging markets: the technological know-how for some specific processes or components may not be developed enough in the potential suppliers’ countries.
• Several risks to the service levels (in terms of transit time, lead-time,
reliability and accuracy) are inherent to long-distance sourcing. As a general rule, the longer the distance the goods must be transported, the higher the risk for the service level to be affected. In this sense, components coming from Asia present the highest risks, followed by components coming from Eastern Europe, in different measures given the different geographical location and individual characteristics of each country. However, these risks can be minimized in different ways. This point will be further developed in the recommendations section.
93

• Additional considerations regarding sourcing from distant origins such as Asia include the currency exchange/rate risk, difficulties in communications (language, culture), difference in quality and technical standards and the different measuring units (metric- imperia).
• The purpose of this project was since the beginning to show a whole picture
of potential sourcing of components from emerging markets including estimations on cost savings and service levels in relation to the current situation. This purpose has been completely achieved. Furthermore, based on the findings on potential cost savings per component, more alternatives can be consequently formulated, therefore obtaining further utilization from this project’s findings. The authors also believe that a practical way to implement these alternatives in the future could be through the combination of several different setups always taking into account the associated service implications.
• Investment costs can play an important role when initiating business
relations with new suppliers at any tier. Investment costs include all those costs that must be incurred into when a new partnership is set up, such as establishment of new facilities (production, assembly or storing), establishment of electronic communications (EDI), prototype development, production design, administrative-related costs, etc.
• In the case of the truck seats and in a more general way for any kind of
components, not always is it possible to source them from Asia and distant emerging markets in a practical way. Transportation of such components to where they must be finally used (for final or partial assembly) may imply logistical inconveniences. On one hand, some characteristics of the component may make its transport unfeasible. Low weight/high volume and shape-related packing requirements are some of such characteristics. Furthermore, value-related issues may arise, in the form of insurance, inventory-in-transit and tied-up capital. Moreover, logistic costs are not the only reason not to bring such components from distant emerging markets; some expertise inherent to the fabrication of particular components may discourage western companies from sourcing them from such origins.
• The findings of this project can be easily applied to the other 2 truck
manufacturing companies of the Volvo Group, Renault Trucks and Mack Trucks.
94
6.2 Recommendations The recommendations suggested by the authors of this thesis are: • Additional to the specific components that this thesis centered its attention
on (main components), the possibility to source more standard components like screws, upholstery, slides, valves, cables, air-nipples, seat-belt buckles, etc. must be researched upon. Furthermore, such initiatives should be undertaken not only at the company level but also at the supply-chain-level.
• A good way to reduce the risks to the service levels associated to long-
distance sourcing is through inventories. The primary objective of inventories is the reduction of risks, the lower the risks the lower the inventory levels that must be kept to prevent against them. In order to reduce the risks associated with longer lead-times as a result of distances and in-transit times, an option for the first-tier seat-supplier could be to keep some intermediate inventory somewhere in Europe. This inventory would be aimed at reducing the response time towards unexpected situations of different natures. This inventory could be kept in some existing facilities of the supplier, keeping in mind that Volvo would probably not be its sole customer, and the costs of such inventory would not be charged only to Volvo. In case the supplier does not have such facilities, several options should be reviewed, such as acquiring, renting, building, outsourcing, etc. Furthermore, such safety stock could also be kept in the supplier’s facilities at Umeå.
• Further cost savings can be achieved by means of consolidation: if several
suppliers located in a geographical area consolidate their shipments to a common origin (in this case Umeå), lower transportation costs can be obtained. On the other hand, economies of scale and economies of scope can be sought by sourcing as many components or similar components as possible from one same supplier. However, special attention should be paid in order not to totally depend on one specific supplier.
Additionally, the authors of this thesis suggest further research opportunities based on this project regarding: • The impact of those costs not included in the calculations of this thesis,
such as inventory-related costs, investment costs and transaction costs. • Location selection within Eastern Europe: although this project considers
several countries in Eastern Europe as potential assembly locations, its
95

scope does not go as far as to decide the best option. Further research could aim at defining what the best solution might be.
• Although numerous quotations were obtained during this project, more
quotations from potential suppliers in not only China but also India and other emerging markets would provide a wider base upon which to base further estimations. In a similar way, additional quotations for transport operations would serve the same goal.
• Further research could also focus on determining the first-tier supplier
and/or logistics partner, even determining specific second-tier suppliers according to more specific requirements.
This thesis is finalizing with the conclusion and recommendation given by the authors. Through this study, the authors believe that the potential savings for Volvo by sourcing from Emerging Markets could be achieved in the near future and further efforts on this aspect are highly recommended.
96

References Literature Dawson, Catherine, (2002), “Practical research Methods, a user friendly guide to mastering research techniques and projects”, How to Books. Ghauri, Pervez and Gronhaug, Kjell, (2002), “Research Methods in Business Studies, a practical guide”, Prentice Hall. Yin, Robert, (1994), “Case Study Research, Design and Methods”, second edition, SAGE Publications. Winter, J. (1987), ”Problemformulering, undersökning och rapport” Stockholm: Liber AB Gourdin, Kent, (2001), “Global Logistics Management, a competitive advantage for the new millennium”, Blackwell Business. Harrison, Alan and Van Hoek, Remko (2002), “Logistics Management and Strategy”, Pearson Education Limited. Bowersox, Closs and Cooper, “Supply Chain Logistics Management”, McGraw Hill. Articles Bley, Doug, Strategic Finance; Oct2004, Vol. 86 Issue 4, p38, 4p, 2bw Hannon, David, Purchasing, 2/6/2003, Vol. 132 Issue 2, p12, 2p, 1c Den Breejen, Erwin, van den Hurk, Joris, European Chemical News; 10/25/2004, Vol. 81 Issue 2121, following p16, 1p. Danuta Kisperska-Moroñ from the Department of Business Logistic, University of Economics, Katowice, Poland, “Logistics customer service levels in Poland: Changes between 1993 and 2001”, International Journal of Production Economics 93-94, 8 January 2005, pages 121-128, available online at www.sciencedirect.com.
97

“Anatomy of a Cost Advantage: It’s more Than Cheap Labour”, George Stalk and Dave Young on Going Global, Published by Schofield Media. iSuppli Corp. in a report on the Electronic Manufacturing Services industry from the El Segundo, California-based market researcher. Electronics Weekly, 9/22/2004 Issue 2163, p3, 1p. Internet Sources http://www.volvo.com/group/global/en-gb/Volvo+Group/our+companies/volvotrucks/keyfactstrucks.htm http://www.volvo.com/NR/rdonlyres/EF08F790-C034-40C6-95C6-6F46513C296B/0/3p_presentation.pdf http://www.volvo.com/group/global/en-gb/Volvo+Group/our+companies/volvotrucks/ http://www.volvo.com/group/global/en-gb/Volvo+Group/our+companies/Renaulttrucks/ http://www.volvo.com/NR/rdonlyres/EF08F790-C034-40C6-95C6-6F46513C296B/0/3p_presentation.pdf http://education.calumet.purdue.edu/vockell/research/workbook/workbook5.htm#Unit1 http://www.ncrel.org/sdrs/areas/misc/glossary.htm#reliab http://www.m-w.com/cgi-bin/dictionary?book=Dictionary&va=reliability
98

Appendix A
Potential Cost Savings for Alternative 1
99
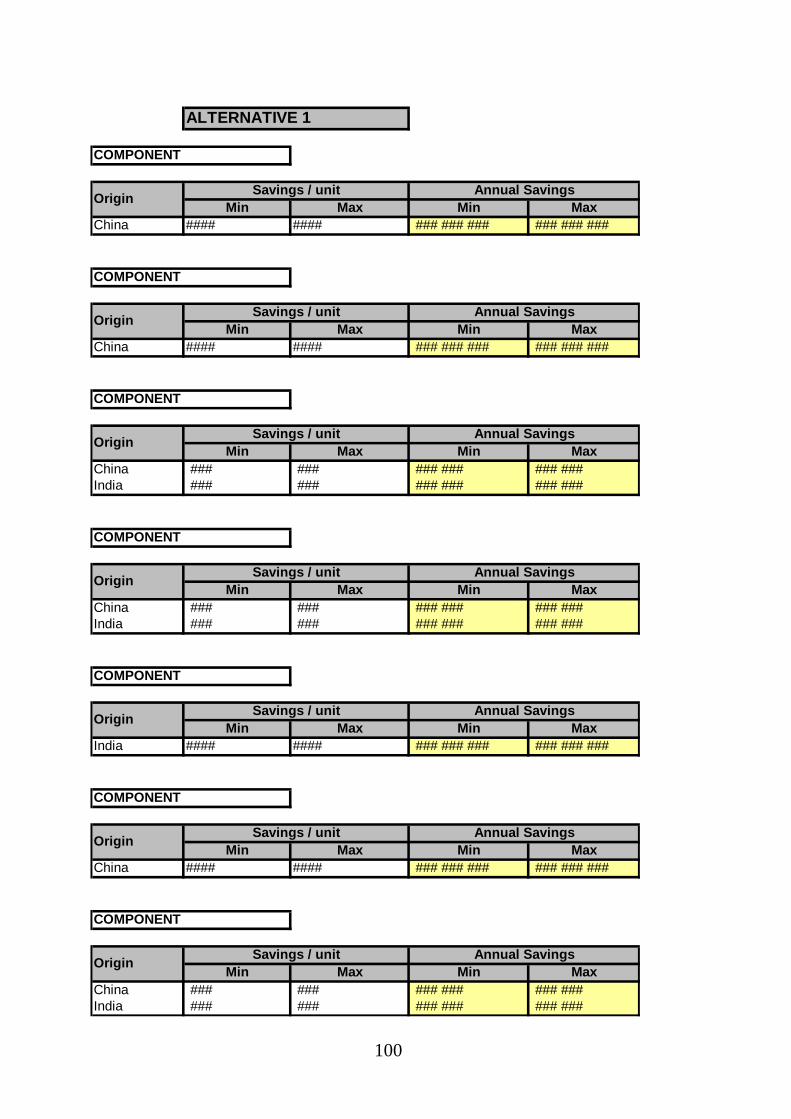
Min Max Min MaxChina #### #### ### ### ### ### ### ###
Min Max Min MaxChina #### #### ### ### ### ### ### ###
Min Max Min MaxChina ### ### ### ### ### ###India ### ### ### ### ### ###
Min Max Min MaxChina ### ### ### ### ### ###India ### ### ### ### ### ###
Min Max Min MaxIndia #### #### ### ### ### ### ### ###
Min Max Min MaxChina #### #### ### ### ### ### ### ###
Min Max Min MaxChina ### ### ### ### ### ###India ### ### ### ### ### ###
COMPONENT
Savings / unit
Origin
Origin
Origin
Origin
Origin
Origin
Origin
Savings / unit Annual Savings
COMPONENT
COMPONENT
Savings / unit Annual Savings
COMPONENT
Savings / unit Annual Savings
ALTERNATIVE 1
COMPONENT
Savings / unit Annual Savings
Savings / unit Annual Savings
COMPONENT
Savings / unit Annual Savings
COMPONENT
Annual Savings
100

Min Max Min MaxChina #### #### ### ### ### ### ### ###
Min Max Min MaxChina #### #### ### ### ### ### ### ###
Min Max Min MaxChina #### #### ### ### ### ### ### ###
Min Max Min MaxIndia #### #### ### ### ### ### ### ###
Min Max Min MaxChina #### #### ### ### ### ### ### ###
Min Max Min MaxChina #### #### ### ### ### ### ### ###
Min Max Min MaxCurrent - - - -
Origin
Origin
Origin
Origin
Annual Savings
COMPONENT
COMPONENT
Savings / unit Annual SavingsOrigin
COMPONENT
COMPONENT
Origin
Origin
Savings / unit Annual Savings
COMPONENT 1
Savings / unit Annual Savings
Savings / unit Annual Savings
Savings / unit Annual Savings
COMPONENT
Savings / unit Annual Savings
COMPONENT
Savings / unit
101

Min Max Min MaxChina #### #### ### ### ### ### ### ###
Min Max Min MaxChina #### #### ### ### ### ### ### ###
Min Max Min MaxChina #### #### ### ### ### ### ### ###
Min MaxTotal savings 1 A BTotal savings 2 C D
Current Situat. Total Spent E FSavings % 23% 82%
Origin
Origin
Origin
COMPONENT
COMPONENT
Savings / unit Annual Savings
Savings / unit Annual Savings
COMPONENT
Savings / unit Annual Savings
Alternative 1
102

Appendix B
Potential Cost Savings for Alternative 2
103

Origin Savings / unit Annual SavingsMin Max Min Max
Eastern Europé #### #### ### ### ### ### ### ###
Origin Savings / unit Annual SavingsMin Max Min Max
Eastern Europé #### #### ### ### ### ### ### ###
Min Max Min MaxChina ### ### ### ### ### ###India ### ### ### ### ### ###
Min Max Min MaxChina ### ### ### ### ### ###India ### ### ### ### ### ###
Min Max Min MaxIndia #### #### ### ### ### ### ### ###
Min Max Min MaxChina #### #### ### ### ### ### ### ###
Min Max Min MaxChina ### ### ### ### ### ###India ### ### ### ### ### ###
Origin
ALTERNATIVE 2
Savings / unit Annual SavingsOrigin
Annual Savings
COMPONENT
Savings / unit Annual Savings
Origin
Annual Savings
COMPONENT
Savings / unit Annual Savings
Origin
Origin
COMPONENT
COMPONENT
COMPONENT
Savings / unit
COMPONENT
Savings / unit
COMPONENT
104

Min Max Min MaxChina #### #### ### ### ### ### ### ###
Min Max Min MaxChina #### #### ### ### ### ### ### ###
Min Max Min MaxChina #### #### ### ### ### ### ### ###
Min Max Min MaxIndia #### #### ### ### ### ### ### ###
Min Max Min MaxChina #### #### ### ### ### ### ### ###
Origin Savings / unit Annual SavingsMin Max Min Max
China #### #### ### ### ### ### ### ###
Min Max Min MaxCurrent - - - -
Origin
Origin
Origin
COMPONENT
Savings / unit
COMPONENT
Savings / unit Annual SavingsOrigin
COMPONENT
Savings / unit Annual Savings
COMPONENT
Savings / unit Annual Savings
COMPONENT
Savings / unit Annual SavingsOrigin
Annual Savings
COMPONENT
COMPONENT
Savings / unit Annual Savings
Origin
105
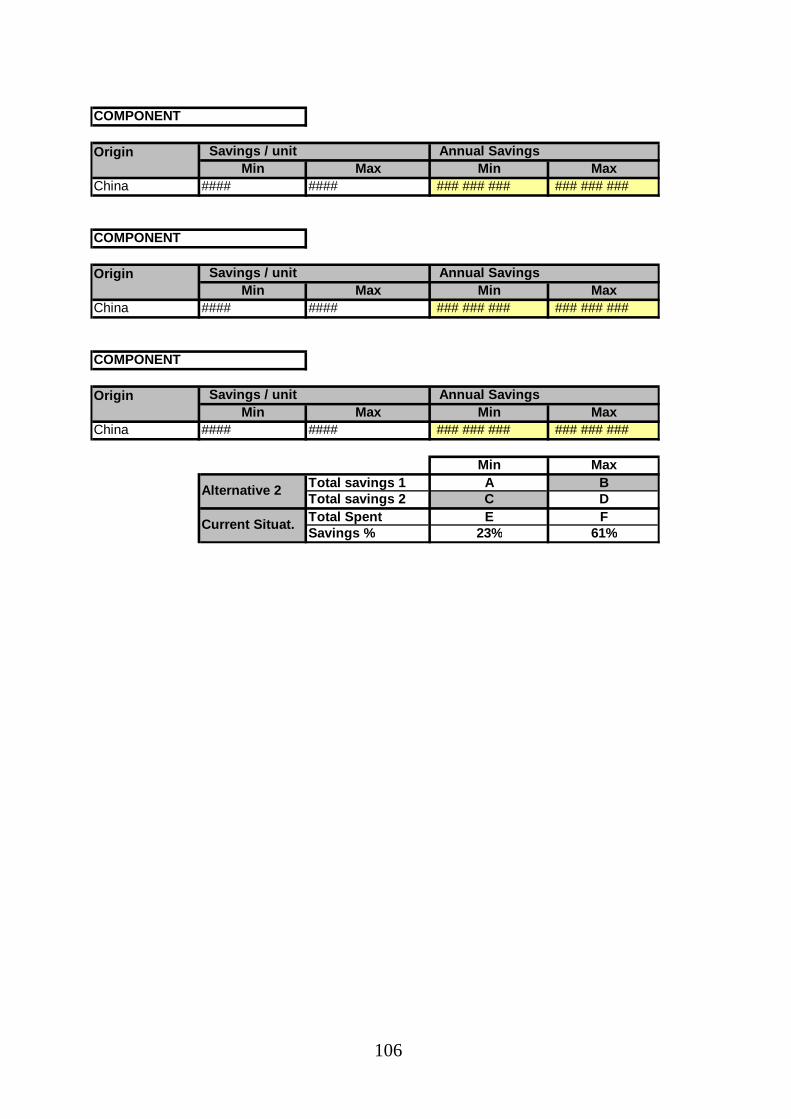
Origin Savings / unit Annual SavingsMin Max Min Max
China #### #### ### ### ### ### ### ###
Origin Savings / unit Annual SavingsMin Max Min Max
China #### #### ### ### ### ### ### ###
Origin Savings / unit Annual SavingsMin Max Min Max
China #### #### ### ### ### ### ### ###
Min MaxTotal savings 1 A BTotal savings 2 C DTotal Spent E FSavings % 23% 61%
COMPONENT
COMPONENT
COMPONENT
Alternative 2
Current Situat.
106
Appendix C
Potential Cost Savings for Alternative 3
107

Min Max Min MaxCurrent - - - -
Min Max Min MaxCurrent - - - -
Min Max Min MaxChina ### ### ### ### ### ###India ### ### ### ### ### ###
Min Max Min MaxChina ### ### ### ### ### ###India ### ### ### ### ### ###
Min Max Min MaxIndia #### #### ### ### ### ### ### ###
Min Max Min MaxChina #### #### ### ### ### ### ### ###
Min Max Min MaxChina ### ### ### ### ### ###India ### ### ### ### ### ###
Savings / unit Annual SavingsOrigin
Annual Savings
COMPONENT
Savings / unit Annual Savings
Origin
Origin
Annual Savings
COMPONENT
Savings / unit Annual Savings
Origin
Origin
Annual Savings
COMPONENT
Savings / unit Annual Savings
Origin
Origin
ALTERNATIVE 3
COMPONENT
Savings / unit
COMPONENT
Savings / unit
COMPONENT
Savings / unit
COMPONENT
108

Min Max Min MaxChina #### #### ### ### ### ### ### ###
Min Max Min MaxChina #### #### ### ### ### ### ### ###
Min Max Min MaxChina #### #### ### ### ### ### ### ###
Min Max Min MaxIndia #### #### ### ### ### ### ### ###
Min Max Min MaxChina #### #### ### ### ### ### ### ###
Min Max Min MaxChina #### #### ### ### ### ### ### ###
Min Max Min MaxCurrent - - - -
Savings / unit Annual Savings
COMPONENT
Savings / unit Annual Savings
Origin
Origin
COMPONENT
Savings / unit Annual Savings
COMPONENT
Origin
Savings / unit Annual Savings
COMPONENT
Savings / unit Annual SavingsOrigin
Origin
COMPONENT
Savings / unit Annual Savings
COMPONENT
Origin
COMPONENT
Savings / unit Annual SavingsOrigin
109
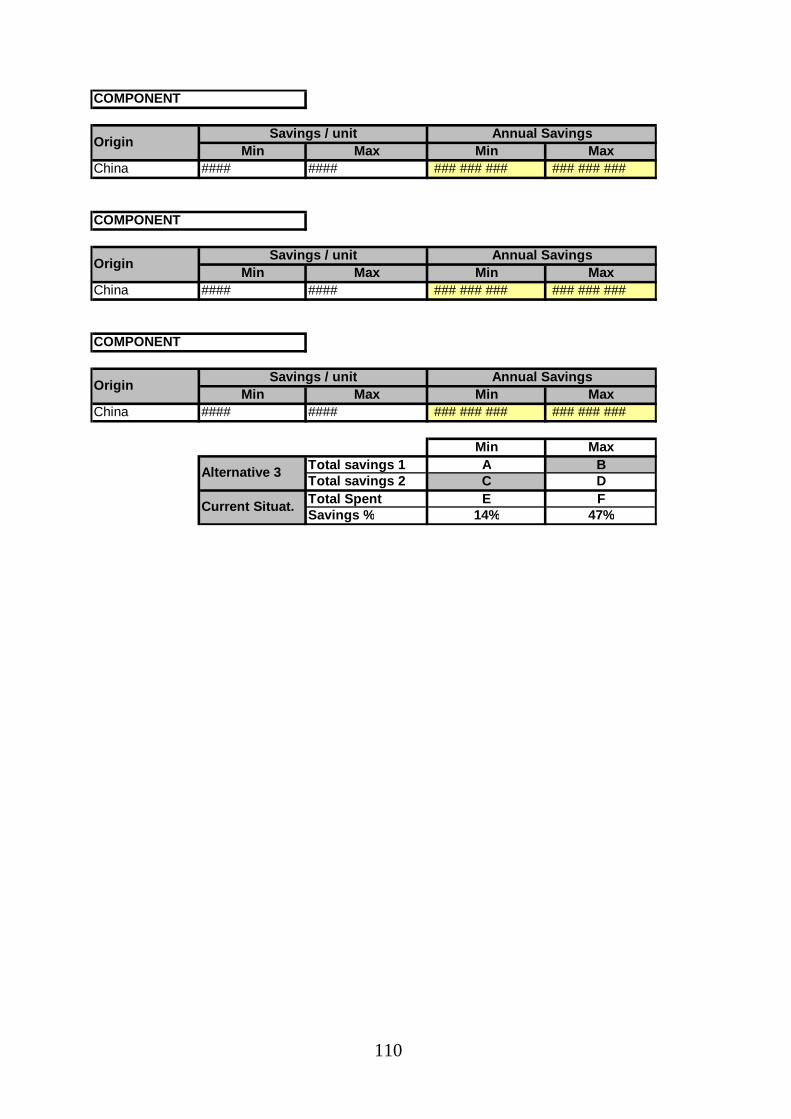
Min Max Min MaxChina #### #### ### ### ### ### ### ###
Min Max Min MaxChina #### #### ### ### ### ### ### ###
Min Max Min MaxChina #### #### ### ### ### ### ### ###
Min MaxTotal savings 1 A BTotal savings 2 C DTotal Spent E FSavings % 14% 47%
COMPONENT
COMPONENT
Savings / unit Annual Savings
Savings / unit Annual Savings
COMPONENT
Savings / unit Annual Savings
Origin
Origin
Origin
Alternative 3
Current Situat.
110