Atomic-scale insights into electro-steric substitutional ...

HAL Id: hal-03100588https://hal-unilim.archives-ouvertes.fr/hal-03100588
Submitted on 6 Jan 2021
HAL is a multi-disciplinary open accessarchive for the deposit and dissemination of sci-entific research documents, whether they are pub-lished or not. The documents may come fromteaching and research institutions in France orabroad, or from public or private research centers.
L’archive ouverte pluridisciplinaire HAL, estdestinée au dépôt et à la diffusion de documentsscientifiques de niveau recherche, publiés ou non,émanant des établissements d’enseignement et derecherche français ou étrangers, des laboratoirespublics ou privés.
Localization and steric effect of the lone electron pair ofthe tellurium Te 4+ cation and other cations of the p
-block elements. A systematic studyDavid Hamani, Olivier Masson, Philippe Thomas
To cite this version:David Hamani, Olivier Masson, Philippe Thomas. Localization and steric effect of the lone electronpair of the tellurium Te 4+ cation and other cations of the p -block elements. A systematic study.Journal of Applied Crystallography, International Union of Crystallography, 2020, 53 (5), pp.1243-1251. �10.1107/S1600576720010031�. �hal-03100588�

1
Localization and steric effect of the lone electron pair of tellurium Te4+
cation and other cations of the p-block elements. A systematic study.
D. Hamani, O. Masson *, P. Thomas
Institut de Recherche sur les Céramiques (IRCER) – UMR CNRS 7315, Université de
Limoges, Centre Européen de la Céramique, 12 rue Atlantis, 87068 Limoges Cedex, France.
* Corresponding author: Olivier Masson, E-mail: [email protected]
Keywords
Lone electron pair; localization; steric effect; geometrical method; tellurium(IV) oxide.
Abstract
We developed a simple method based on pure geometrical concepts to localize lone pairs (LP)
of cations of the p-block elements and model their steric effect. The method was applied to
1185 structures containing LP cations in 2439 non-equivalent positions. For oxide crystal
structures, it is observed that going from bottom left to top right in the periodic table, LP
moves away from the cation core and decreases in size. For a given kind of cation M*, the LP
radius increases linearly with the M*-LP distance, the smallest rate being observed for Tl+ and
the largest for Cl5+
. The influence of the anion type was also studied in the case of the Te4+
cation. Overall, the same trends are observed. The smallest Te-LP distances and LP radii are
found for anions of large size and small charge.

2
1. Introduction
Cations of the p-block elements (M*), when bonded to anions such as O2-
, F-, Cl
-, may present
a lone electron pair (LP) with stereochemical activity responsible for asymmetric atomic
environments. This phenomenon, usually explained with the valence shell electron pair
repulsion (VSEPR) theory of Gillespie & Nyholm (1957), can play a significant role on the
properties of many compounds. As an example, the remarkable nonlinear optical properties of
tellurite (i.e. TeO2-based) materials are known to be partly due to the activity of the 5s2 lone
electron pair of Te4+
cations (Fargin et al., 1996; Jeansannetas et al., 1999; Suehara et al.,
2004b,a; Soulis et al., 2008; Roginskii et al., 2017). The position and steric effect of LP are
thus valuable parameters for understanding the structure-properties relationships of some
inorganic compounds and must be assessed by experimental or theoretical methods.
The volume occupied by lone pairs in crystalline compounds was first estimated
experimentally by Andersson & Åström (1972) who noticed that the average available
volume for anions is larger in compounds with LP cations than without. Thanks to the
difference between these volumes, they estimated that the lone pairs occupy an effective
volume similar to that of the anions. Experimental localization of LP of cations appears later
through the study of electronic density maps obtained by X-ray diffraction methods
(Kondratyuk et al. (1987) for α-TeO2 crystal). This kind of analysis, while interesting, is
generally complex to implement and not suited for systematic studies. In this context,
modeling is an invaluable tool, but to date only few methods exist to localize LPs or estimate
their steric effect.
The first modeling method was introduced by Galy et al. (1975). It was based on geometrical
concepts considering that LP cations are located in the center of a regular polyhedron

3
(tetrahedron, triangular bipyramid or octahedron) made of LP and surrounding anions. The
principle of the method, illustrated in
Figure 1, entails that LPs and anions are modeled by spheres of equal size. In this pioneering
work, Galy et al. systematically calculated the M*-LP distances found in 48 non-equivalent
environments of 40 crystal structures containing 12 LP cation types and determined trends
relating the average M*-LP distances to the position of the elements in the periodic table.
While powerful, this method assumes a regular polyhedron around the LP cation and works
poorly with structures with not compact enough anionic packing, e.g. with heavy LP cations
such as Tl+, Pb
2+ and Bi
3+. More recently, another geometrical method using the algorithm
initially proposed by Balić Žunić & Makovicky (1996) was applied to determine the LP
stereoactivity in TeO2-based structures (Christy & Mills, 2013). The stereoactivity was
estimated as the distance between the Te4+
core and the center of a large sphere as close as
possible to the centers of the neighboring anions. A linear correlation was found by the
authors between this distance and the radius of the sphere, highlighting the fact that the lone
pair repels the neighboring anions.
In 1978, Verbaere et al. (1978) proposed a non-geometrical method based on the calculation
of the local electric field around LP cations in order to obtain the cation polarization. This
method requires the knowledge of both the charges and polarizabilities of all the ions in the
system. It was first applied on crystal structures containing Tl+ cations and was later on
implemented in the HYBRIDE program (Wallez, 1999).

4
More recently, quantum chemistry calculations using the electron localization function (ELF)
introduced by Becke & Edgecombe (1990) was used to visualize and analyze lone pairs in
different compounds (e.g. Chesnut, 2000; Seshadri, 2001; Berski et al., 2007; Rahm &
Christe, 2013). Based on the Pauli Exclusion Principle, ELF associates a value to every point
in space depending on the probability of finding two electrons with same spin. ELF maps can
be used to localize lone pairs by identifying high ELF values in the LP cation neighborhood.
The ELF method has been applied for instance in the case of compounds containing Te4+
(Hamani, 2010), Tl+ to Po
4+ (Matar & Galy, 2015; Galy & Matar, 2016), N
3+ to Bi
3+ cations
(Galy et al., 2017; Galy & Matar, 2018; Galy & Vignoles, 2020) and Sn2+
(Galy & Matar,
2019). This procedure is however highly demanding and requires generally long-time
computer calculations.
In this paper, we present a new and simple method able to localize lone pairs and determine
their steric effect in various chemical systems. It is based on pure geometrical concepts and
requires no a priori knowledge apart from the ionic radii. The description of the method is
presented in § 2. Its application and the analysis of the evolutions of the M*-LP distance and
LP radius as functions of the cation type is presented in § 3 using 1138 oxide crystal
structures containing As3+
, Bi3+
, Br5+
, Cl5+
, Ga+, Ge
2+, I
5+, In
+, P
3+, Pb
2+, S
4+, Sb
3+, Se
4+, Sn
2+,
Te4+
, Tl+ or Xe
6+ cations in 2380 non-equivalent positions. In § 4, emphasis is given to
TeO2-based structures and to the influence of the anion type (X) within 47 non-oxide
TemXn-based structures containing 59 non-equivalent Te4+
positions.
2. The lone pair localization method
The principle of the method is based on the fact that space can be filled with hard spheres
representing anions, LP cation cores and LPs, each LP cation being decomposed into a core
and a lone pair. LP cations have asymmetric environments characterized by a neighboring
empty space (i.e. not occupied by anions) which can partly be filled with a sphere modeling

5
the steric effect of the lone pair. The positions and radii of anions and LP cation cores are
fixed whereas the position and radius of LP are adjusted to best fill the empty space. To our
knowledge, such a problem has no analytical solution and must be solved numerically. We
used the following procedure. The position and radius of the lone pair are varied in order to
minimize the sum of distances (SoD) between LP and the neighboring anion surfaces (i.e. the
length of empty space between LP and anions), calculated as follows:
where is the distance between the centers of the lone pair and a neighboring anion k,
is the LP radius and is the radius of anion k. The sum is performed over all anions
which lie within a given cut-off distance from the LP cation core. All the terms in SoD are
positive or null, i.e. no interpenetration between the LP sphere and the neighboring spheres is
allowed. The retained LP position and size values are those which minimize SoD. In practice,
a spherical coordinate system is used to sample the unit-cell volume using constant angular
and radial steps. A constant step is also used to sample . The procedure is illustrated in
6
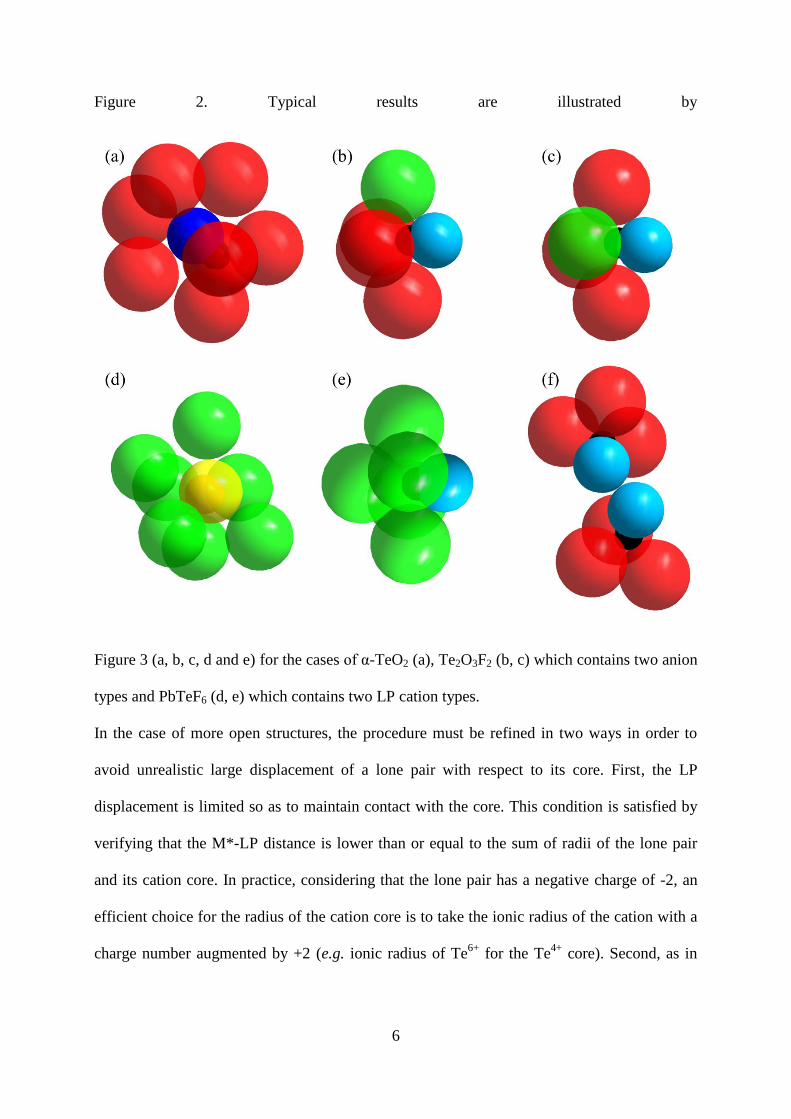
Figure 2. Typical results are illustrated by
Figure 3 (a, b, c, d and e) for the cases of α-TeO2 (a), Te2O3F2 (b, c) which contains two anion
types and PbTeF6 (d, e) which contains two LP cation types.
In the case of more open structures, the procedure must be refined in two ways in order to
avoid unrealistic large displacement of a lone pair with respect to its core. First, the LP
displacement is limited so as to maintain contact with the core. This condition is satisfied by
verifying that the M*-LP distance is lower than or equal to the sum of radii of the lone pair
and its cation core. In practice, considering that the lone pair has a negative charge of -2, an
efficient choice for the radius of the cation core is to take the ionic radius of the cation with a
charge number augmented by +2 (e.g. ionic radius of Te6+
for the Te4+
core). Second, as in

7
some structures the lone pairs face each other, the SoD criterion is modified such as to avoid
interpenetration between facing lone pairs, as follows:
where is the distance between lone pairs LPi and LPj, the sum over i being taken for
all lone pairs facing each other. In order to have a unique solution, all facing LPs are
considered to have the same radius. This is exact when facing LPs belong to cations of
equivalent positions. In most other cases the induced error is expected to be small, in
particular when the lone pairs belong to cations with close positions in the periodic table. The
results of the procedure in the case of facing LPs are illustrated in

8
Figure 3 (f) for α-CdTeO3 where the lone pairs of Te4+
ions from two non-equivalent
positions face each other.
The presented procedure requires the choice of a cut-off radius as well as ionic radii. The
effect of these parameters on the results was tested as follows. Regarding the cut-off radius, it
appeared that the average M*-LP distance and LP radius converge to stable values for a
cut-off larger than 6 Å (see supporting information S1). In practice, a cut-off of 10 Å is a
good choice as it ensures converged values in all cases without impacting too much the
computation time. Regarding the choice of the ionic radii, both crystal radii and effective radii
(Shannon, 1976) were tested. The effect on M*-LP distance is small. Over 2439 non-
equivalent LP cation positions, the average M*-LP distance was 0.83 Å using crystal radii
versus 0.86 Å using effective radii, i.e. a relative variation of less than 4%. The localization
method is thus mostly insensitive to the choice of ionic radii. The LP radius is however more
affected by ionic radii. The average LP radius was 1.27 Å using crystal radii versus 1.15 Å
using effective radii, i.e. a relative variation of more than 10 %. This effect can be explained
by the fact that smaller anion radii (crystal radii) free more space around the LP cation cores
and thus induce larger LP radii. Whatever the chosen radii, the relative evolutions of the
M*-LP distance and LP radius as functions of M* did not change.
The method was implemented in a program written in C++ language, ‘LPLoc’ (Hamani &
Masson, 2019). The input is a Crystallographic Information File (CIF) (Hall et al., 1991; (a))
containing at least the space group with the lattice parameters and the atomic positions of the
analyzed structure. The user can choose the cut-off radius and select either crystal or effective
ionic radii or input his/her own radius values. Calculations took a few seconds to a few dozen
seconds, depending on the complexity of the structure, on a personal computer with Intel®
Core™ i5-2500K CPU @ 3.30 GHz and 4.00 Go RAM.
3. Results and discussion

9
All the results presented in this section were obtained using effective ionic radii and a cut-off
radius of 10 Å. The CIF files of the analyzed structures were extracted from the Inorganic
Chemistry Structure Database (ICSD) (b). The structure selection criteria and the full results
are listed in supporting information S2.
3.1. Evolutions of the M*-LP distances and LP radii within the periodic table for
cations of p-block elements in oxide crystal structures
The method was applied to 1138 oxide crystal structures containing LP cations of p-block
elements in order to establish trends in the evolutions of M*-LP distances and LP radii within
the periodic table. This corresponds to 2380 non-equivalent positions of As3+
, Bi3+
, Br5+
, Cl5+
,
Ga+, Ge
2+, I
5+, In
+, P
3+, Pb
2+, S
4+, Sb
3+, Se
4+, Sn
2+, Te
4+, Tl
+ and Xe
6+.
The average M*-LP distances and LP radii are reported in Table 1 and are represented
schematically in Figure 4 according to the positions of the elements in the periodic table. We
note that the M*-LP distances tend to decrease down a group, with the exceptions of Ga+ and
In+, for which only one structure was valuable from the database, and of the very small S
4+
and Cl5+
cations. The trend along a period is less clear. Things are different if we instead
consider the relative displacement (RD) of the lone pair away from its core with respect to the
cation core and LP sizes, using the relation
RD = dM*-LP/(rM*+rLP),
where dM*-LP, rM* and rLP are the average M*-LP distance, the core radius and the average LP
radius respectively. This permits taking into account the size effect of the cation. The relative
displacement can vary between 0% (i.e. LP is not active stereochemically) and 100% (i.e. the
core is completely naked, the lone pair being tangent to the core). The obtained RD values are
reported in Table 1 and Figure 4. Minimal relative displacements are found at the bottom left
for Tl+ (13%), In
+ (3%) and Ga
+ (0%) and maximal ones at the top right for S
4+ and Cl
5+ (93%
for both). We now observe clear trends: the relative displacements decrease down a group and

10
increase from left to right in a period. This results confirm the previous works (Galy et al.,
1975) and generalize them to a large number of compounds.
The decrease of the relative M*-LP distance down a group means that for a given cation
charge, the smaller the core radius, the larger the M*-LP distance. This evolution can be
related to the bond valence distortion theorem (Allmann, 1975; Brown, 1978; Urusov, 2003;
Brown, 2011, 2016). A large LP displacement allows the anions located at the opposite side
of the lone pair to get closer to the core, which in turn allows the formation of cation-anion
bonds with large bond valences, i.e. primary bonds. Thus for cation with small core size, a
large LP displacement enables the cation to reach its ideal valence (i.e. its formal charge) with
only primary bonds. On the contrary, in the case of large core radius, the cation valence
cannot be satisfied anymore with primary bonds. A small LP displacement is thus mandatory
to increase the number of secondary bonds which supply the missing bond valences.
The increase of the relative M*-LP distance observed from left to right in a period (i.e. from
less charged to more charged cations) can also be explained with the bond valence distortion
theorem. Indeed, a highly charged cation, i.e. with small core radius, must undergo a large LP
displacement in order to favor shorter cation-anion distances and reach its high valence.
Similarly, when the lone pair sufficiently displaces away from the core, it also partially bares
the latter. The relative volume (RV) of the naked part of the core with respect to the full core
volume, RV = Vnaked_M*/VM* (where Vnaked_M* and VM* are the volumes of the naked part and
the core respectively), is reported in Table 1 and Figure 4 for each LP cation type. This
parameter is related to RD and thus has a similar evolution within the periodic table. A zero
relative volume is observed at the bottom left for Ga+, In
+, Tl
+ and Pb
2+ and the largest values
are obtained at the top right for S4+
(98%) and Cl5+
(99%). The cores of Ga+, In
+, Tl
+ and Pb
2+
are thus fully enclosed within the lone pair while the cores of S4+
and Cl5+
are almost totally
naked.

11
Regarding the average LP radii (Table 1 and Figure 4) and except for the very small S4+
and
Cl5+
cations of the third period, we found little variation in a group (1.46 Å in average for M+,
1.33 Å for M2+
, 1.16 Å for M3+
, 1.08 Å for M4+
, 0.99 Å for M5+
and 0.84 Å for M6+
). We did
not observe an overall increase down a group, as we could have expected from the general
trends of the ionic radii. From left to right however, the LP radii clearly decrease, suggesting
that they are mainly related to the cation charge.
The evolutions of the LP radius as a function of the M*-LP distance for the different elements
are plotted in Figure 5. There is a clear positive and linear correlation between these two
parameters, indicating that the longer the M*-LP distance, the larger the LP radius. The
variations are more or less pronounced depending on the element. Overall, the slope increases
from bottom left to top right, with a value of 0.10 for Tl+ (i.e. the LP radius is almost
insensitive to the M*-LP distance) and 0.96 for Cl5+
. Clearly, the higher the slope, the smaller
the cation radius. The intercept at the origin can be thought as the cation radius when the LP is
stereochemically inactive.
3.2. The specific case of the Te4+
cation
3.2.1. Oxide crystal structures
This part focuses on TeO2-based structures, for which the presence of LP on Te4+
cations
induces asymmetric environments and large variations of the coordination number depending
on the type and quantity of added modifier oxides. A recent review of the structural features
of these compounds is given by Christy et al. (2016).
In the reference structure α-TeO2, all Te4+
cations are four-fold coordinated and form TeO4
disphenoids presenting two short equatorial bonds (Te-Oeq = 1.88 Å) and two longer axial
bonds (Te-Oax = 2.12 Å) (Kondratyuk et al., 1987). When adding modifier oxides, the TeO4
units transform into TeO3+1 (deformed disphenoids with one lengthened bond) and TeO3 units
(triangular pyramids) in varied proportions (Figure 6) (e.g. Tagg et al., 1994; Becker et al.,

12
1997; Mirgorodsky et al., 2002). Besides these three usual environments, atypical
environments are also described in the literature, such as five-fold coordination (for instance
in BaTe2O6, K2Te4O12, NiTe2O5, SrTe3O8 and P2Te3O11) and a very rare six-fold coordination
reported in Cs2Te4O12 and Pr2Te2O7. In the former, the Te4+
cation is located at the center of a
perfect TeO6 octahedron (Te-O = 2.11 Å) (Siritanon et al., 2011).
The present localization method was applied to 227 oxide structures involving one kind of LP
cation (Te4+
) in 456 non-equivalent positions. Results are gathered in Table 1 and Figure 4
and Figure 5. The Te-LP distances vary between 0.00 Å and 1.78 Å with an average value of
1.09 Å and a small standard deviation of 0.21 Å. Without considering Cs2Te4O12 and
Pr2Te2O7 for which the LP is not stereochemically active, the shortest Te-LP distance
(0.48 Å) is obtained in Rb4Te8O23 and the longest one (1.78 Å) in Mn2Te3O8. Concerning the
LP radii, they vary between 0.68 Å and 1.49 Å with an average value of 1.11 Å and a small
standard deviation of 0.11 Å. The shortest values are found in Pr2Te2O7 (0.68 Å), Cs2Te4O12
(0.71 Å) and Nb2Te3O11 (0.83 Å), the longest one in Ga2Te3O9 (1.56 Å).
At the best of our knowledge, there is only one experiment (Kondratyuk et al., 1987) dealing
with the LP localization in TeO2-based materials. This study was performed on α-TeO2 single
crystal by X-ray diffraction to obtain its precise electronic density map. It revealed a local
electronic density maximum, attributed to the lone pair, situated at about 0.6 Å from the core.
Later, an ab initio study (Suehara et al., 2004b) performed on TeO4H4 molecule, with
geometry close to the TeO4 disphenoid found in α-TeO2, also revealed an electronic density
maximum at about 0.6 Å from the core. The studies of Galy et al. (1975) and Christy & Mills
(2013) on oxide crystal structures respectively gave an average Te-LP distance of 1.25 Å for
15 Te4+
environments (1.37 Å for α-TeO2) and 1.15 Å for 40 Te4+
environments (0.88 Å for
α-TeO2).

13
In order to better understand those differences, we performed a complementary analysis using
the ELF function. For 33 oxide structures containing 66 non-equivalent Te4+
positions, we
calculated the Te-LP distances by considering that the local maximum of ELF function near
the Te4+
core corresponds to the LP position. The calculations were carried out using the
Vienna ab initio simulation package (VASP) code 4.6 (Kresse & Hafner, 1993, 1994; Kresse
& Furthmüller, 1996a,b) with the generalized gradient approximation PW91 (GGA-PW91)
(Perdew et al., 1992, 1993) and projector augmented-wave (PAW) potentials (Blöchl, 1994;
Kresse & Joubert, 1999). Results are reported in Table 2 and Figure 7.
The average Te-LP distance of 0.94 Å is in relatively good agreement with that obtained with
our localization method on the same structures (1.05 Å). It is interesting to note that the
Te-LP distance for α-TeO2 from the ELF analysis (0.91 Å) is clearly larger than that
corresponding to the maximum of electronic density (0.6 Å), and is in better agreement with
that calculated with our localization method (1.04 Å). A domain with high ELF values repels
neighboring electrons, and thus is indicative of the intensity of the LP steric effect. This
certainly explains the better agreement between the results obtained with our method and the
ELF analysis and also suggests that the electronic density is not the best measure of the LP
steric effect. While the agreement with the ELF analysis is particularly good for average
values, one can notice a large dispersion of Te-LP distances obtained with our method. In
particular, the method led to distances as large as 1.78 Å (for Mn2Te3O8). It is unlikely that
the maximum of the LP electron density or electron pair probability be actually shifted to such
extreme values from the core. This is supported by the fact that the maximum ELF values are
found closer to the core, at distances lower than 1.2 Å. Instead, such large values probably
indicate a substantial departure of the LP electron density (and electron pair probability) from
a spherical symmetry, retaining the main part of the electron density close to the core. This
nevertheless also indicates that the neighboring anions are strongly repelled from the core,

14
leading to a large empty space along the LP direction. To emphasize this point, we applied
our method by fixing the LP radius to a constant value, typical of Te4+
cation. We used a
value of 1.05 Å, which is both close to the value found for the reference -TeO2 compound
and to the average radius obtained from the linear trend of §3.1. The obtained results are
given in Table 2 and Figure 7. We can observe a clear reduction of the dispersion as well as a
closer agreement with the ELF analysis, in particular an identical average Te-LP distance of
0.94 Å. Note that as already seen on Figure 5, this effect clearly depends on the nature of the
LP cation. With Tl+ cation for example, the possibility of creating large empty space is much
more limited, as suggested by the corresponding small slope given in the plot of Figure 5. If
we now compare those results with data of literature related to tellurite crystal structures, one
can notice that the average Te-LP distance obtained by Galy et al. (1.25 Å) is larger than the
above average values obtained with our method and the ELF analysis (the same is true in the
case of α-TeO2 with a distance of 1.37 Å). This may be due to the fact that their method
considers that the LP radius is equal to the average radius of the neighboring anions, which
could induce an overestimation of the LP size and in turn an overestimation of the Te-LP
distance. Finally, our results are close to those obtained by Christy & Mills (2013).
3.2.2. Non-oxide crystal structures
This part focuses on the Te4+
LP in the rare cases of non-oxide compounds in order to analyze
the effect of the kind of anion. The method was applied to 47 structures containing only one
LP cation type (Te4+
) in 59 non-equivalent positions and one anion type (X) among Br-, Cl
-,
F-, I
-, S
2- and Se
2-. The Te-LP distances and Te
4+ LP radii are presented in Table 3 and Figure
8; those related to O2-
are included for comparison. Overall, the values tend to be smaller in
environments implying larger and less charged anions. The smallest average distances and
radii are indeed observed with Br- and I
- (Te-LP distances of 0.32 Å and 0.35 Å respectively;
Te4+
LP radii of 0.77 Å in both cases). For each anion type, the LP radius increases linearly

15
with the Te-LP distance as observed in oxide structures. These results can still be explained
with the bond valence concept. With small anions, the Te4+
valence is reached with a low
number of neighboring anions due to short Te-X bonds, implying that anions of the second-
coordination sphere are far from the core. Consequently, the lone pair can displace away from
the core. With larger anions, the Te-X primary bonds are longer so the cation valence can
only be reached by increasing the coordination number, inducing a more symmetric
environment, a smaller Te-LP distance and a smaller LP radius.
In most cases, Te4+
cation has a stereoactive lone pair, the only exceptions being observed
within perfect or quasi-perfect octahedra. Besides Cs2Te4O12 and Pr2Te2O7 (rLP = 0.71 Å and
0.68 Å respectively), the LP radius is equal to 0.74 Å in Cs2TeBr6 and 0.72 Å in K2TeBr6,
Rb2TeBr6, K2TeI6 and Rb2TeI6. A Te4+
cation whose lone pair is inactive can thus be modeled
by a hard sphere of 0.72 Å in radius whatever the surrounding anionic species.
4. Conclusion
A systematic study was performed on oxide structures and on Te4+
-containing non-oxide
structures in order to improve the local structural description of compounds containing cations
of the p-block elements carrying a lone electron pair.
We developed a simple method based on pure geometrical concepts to localize lone pairs and
model their steric effect regardless the LP cation types and their environment.
This method was applied to 1185 structures containing one LP cation type in 2439 non-
equivalent positions and one anion type, using the ‘LPLoc’ program (Hamani & Masson,
2019).
In the periodic table, from bottom left to top right, the overall trends for oxide crystal
structures are that the lone pair moves away from its core (with respect to the cation core and
LP sizes) and the LP size decreases (rLP = 1.52 Å for Tl+ and 0.40 Å for Cl
5+). For one
cationic species, the evolution of the LP radius reveals a linear increase more or less

16
pronounced with the M*-LP distance: the Tl+ cation retains a lone pair of quasi-constant size
whatever the oxide structure, whereas in the case of Cl5+
, the LP size distinctly increases with
the Cl-LP distance.
The influence of different anions for one LP cation type was also studied in the case of Te4+
.
For each anion type, the same trend as in oxide structures is observed, namely a linear
increase of the LP radius with the Te-LP distance. Overall, the smallest Te-LP distances and
LP radii are found for anions of large size and small charge (bottom right of the periodic
table).
The universal character of the proposed method, applied to crystalline compounds in this
study, could be transposed to amorphous compounds in order to improve their structural
description at atomic scale.
17
Figures
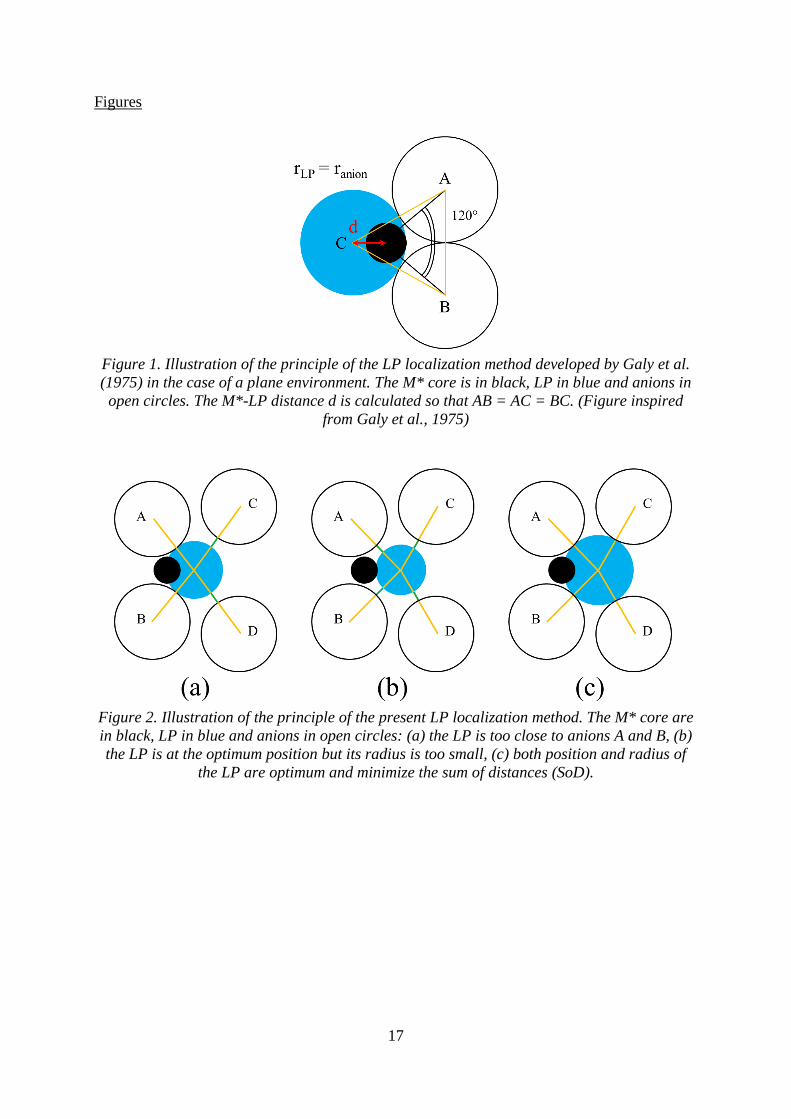
Figure 1. Illustration of the principle of the LP localization method developed by Galy et al.
(1975) in the case of a plane environment. The M* core is in black, LP in blue and anions in
open circles. The M*-LP distance d is calculated so that AB = AC = BC. (Figure inspired
from Galy et al., 1975)
Figure 2. Illustration of the principle of the present LP localization method. The M* core are
in black, LP in blue and anions in open circles: (a) the LP is too close to anions A and B, (b)
the LP is at the optimum position but its radius is too small, (c) both position and radius of
the LP are optimum and minimize the sum of distances (SoD).

18
Figure 3. Graphical representations (space-filling model) of the results obtained by applying
the present method to LP cations in specific compounds: (a) Te4+
in α-TeO2 (ICSD #62898),
(b and c) Te4+
(2 different sites) in Te2O3F2 (#82162), (d and e) Pb2+
and Te4+
in PbTeF6
(#81865) and (f) Te4+
in α-CdTeO3 (#60067). Te4+
cores are in black, Te4+
LPs in blue, Pb2+
core in orange, Pb2+
LP in yellow, O2-
anions in red and F- anions in green. Radii of the
Te4+
cores, Pb2+
core, O2-
and F- anions are 0.56 Å, 0.775 Å, 1.40 Å and 1.33 Å respectively.

19
Figure 4. Schematic representations of the LP size and displacement (from the core) with
respect to the position of the cation M* in the periodic table. The cores are in black and LPs
in blue. The average M*-LP distances, LP radii, relative displacements and relative volumes
(see text) given for each cation were obtained from 2380 non-equivalent M* positions in 1138
oxide crystal structures.

20
Figure 5. Variation of the LP radius as a function of the M*-LP distance for cations of the
p-block elements based on 2380 non-equivalent M* positions in 1138 oxide crystal structures.
The dashed red line indicates the core radius value, a and b are the slope and the intercept at
the origin of the linear regression (black line) respectively.

21
Figure 6. Local environments of Te
4+ cations found in TeO2-based crystal structures: (a)
usual environments, (b) atypical environments. Te4+
cores are in black, O2-
anions in red,
blue arrows represent Te4+
LPs and longest Te-O bonds are drawn with dashed lines. Typical
compound illustrative of each environment is given in brackets as well as the collection code
of its ICSD entry.

22
Figure 7. Comparison of the distributions of the Te-LP distances obtained with the present
method and using the ELF function, based on 66 non-equivalent Te4+
positions in 33 oxide
crystal structures. The bin width is 0.1 Å.
Figure 8. Comparison of the variation of the Te
4+ LP radius as a function of the Te-LP
distance for different kinds of anions. The dashed red line indicates the core radius value
(0.56 Å), a and b are the slope and the intercept at the origin of the linear regression (black
line) respectively.

23
Tables
M*
Number
of
structures
Number
of non-
equivalent
positions
Core
radius
(Å)
dM*-LP (Å) rLP (Å) Average
relative
displacement
(RD, %)
Average
relative
volume
(RV, %) Average
Standard
deviation Min. Max. Average
Standard
deviation Min. Max.
As3+
25 43 0.46 1.21 0.17 0.96 1.80 1.15 0.10 0.94 1.39 75 73
Bi3+
179 365 0.76 0.60 0.31 0.00 1.55 1.14 0.12 0.82 1.50 32 23
Br5+
9 10 0.39 1.19 0.16 0.97 1.48 1.00 0.12 0.83 1.17 86 91
Cl5+
7 7 0.27 0.62 0.07 0.46 0.71 0.40 0.07 0.24 0.47 93 99
Ga+ 1 1 0.62 0.00 - 0.00 0.00 1.40 - 1.40 1.40 0 0
Ge2+
1 2 0.53 1.22 0.09 1.16 1.28 1.35 0.00 1.35 1.35 65 47
I5+
94 278 0.53 0.99 0.15 0.49 1.67 0.98 0.08 0.68 1.20 66 71
In+ 1 1 0.80 0.06 - 0.06 0.06 1.45 - 1.45 1.45 3 0
P3+
3 5 0.38 1.27 0.21 0.94 1.50 1.10 0.14 0.89 1.27 86 88
Pb2+
207 447 0.775 0.52 0.30 0.00 1.42 1.29 0.09 1.01 1.62 25 0
S4+
7 9 0.29 0.91 0.08 0.79 1.07 0.69 0.07 0.57 0.82 93 98
Sb3+
60 120 0.60 1.06 0.25 0.45 1.65 1.24 0.12 0.90 1.66 58 47
Se4+
211 439 0.42 1.21 0.18 0.80 1.79 1.05 0.12 0.79 1.41 82 85
Sn2+
25 48 0.69 0.94 0.23 0.48 1.57 1.35 0.08 1.17 1.53 46 24
Te4+
227 456 0.56 1.09 0.21 0.00 1.78 1.11 0.11 0.68 1.49 65 65
Tl+ 78 145 0.885 0.31 0.24 0.00 1.24 1.52 0.09 1.29 1.86 13 0
Xe6+
3 4 0.48 0.83 0.16 0.61 1.00 0.84 0.08 0.73 0.92 63 69
Table 1. Average M*-LP distances, LP radii, relative displacements and relative volumes (see
text) obtained from 2380 non-equivalent M* positions in 1138 oxide crystal structures.
Method
dTe-LP (Å)
Average Standard
deviation Min. Max.
ELF function 0.94 0.08 0.69 1.15
Present method with rLP allowed to vary 1.05 0.22 0.48 1.66
Present method with rLP fixed at 1.05 Å 0.94 0.15 0.42 1.24
Table 2. Comparison of the average Te-LP distances obtained with the present method and
using the ELF function, based on 66 non-equivalent Te4+
positions in 33 oxide crystal
structures
X
Number
of
structures
Number
of non-
equivalent
positions
Anion
radius
(Å)
dTe-LP (Å) rLP (Å)
Average Standard
deviation Min. Max. Average
Standard
deviation Min. Max.
Br- 7 8 1.96 0.32 0.28 0.00 0.65 0.77 0.05 0.72 0.85
Cl- 14 15 1.81 0.62 0.09 0.44 0.78 0.85 0.04 0.80 0.95
F- 9 11 1.33 1.15 0.29 0.81 1.74 1.12 0.15 0.97 1.38
I- 7 14 2.20 0.35 0.19 0.00 0.77 0.77 0.04 0.72 0.88
O2-
227 456 1.40 1.09 0.21 0.00 1.78 1.11 0.11 0.68 1.49
S2-
6 7 1.84 1.05 0.39 0.70 1.82 1.10 0.24 0.89 1.57
Se2-
4 4 1.98 0.95 0.27 0.69 1.34 1.02 0.13 0.86 1.17
Table 3. Comparison of the average Te-LP distances and Te4+
LP radii obtained for seven
different kinds of anions (X).

24
References
Allmann, P. D. R. (1975). Monatshefte Für Chem. Chem. Mon. 106, 779–793.
Andersson, S. & Åström, A. (1972). Natl. Bur. Stand. SP364. Solid State Chemistry.
Proceedings of the 5th Materials Research Symposium, 3–14.
Balić Žunić, T. & Makovicky, E. (1996). Acta Crystallogr. B. 52, 78–81.
Becke, A. D. & Edgecombe, K. E. (1990). J. Chem. Phys. 92, 5397–5403.
Becker, C. R., Tagg, S. L., Huffman, J. C. & Zwanziger, J. W. (1997). Inorg. Chem. 36,
5559–5564.
Berski, S., Gajewski, G. & Latajka, Z. (2007). J. Mol. Struct. 844–845, 278–285.
Blöchl, P. E. (1994). Phys. Rev. B. 50, 17953–17979.
Brown, I. D. (1978). Chem. Soc. Rev. 7, 359–376.
Brown, I. D. (2011). J. Phys. Chem. A. 115, 12638–12645.
Brown, I. D. (2016). The Chemical Bond in Inorganic Chemistry: The Bond Valence Model
Oxford: Oxford University Press.
Chesnut, D. B. (2000). J. Phys. Chem. A. 104, 11644–11650.
Christy, A. G. & Mills, S. J. (2013). Acta Crystallogr. Sect. B Struct. Sci. Cryst. Eng. Mater.
69, 446–456.
Christy, A. G., Mills, S. J. & Kampf, A. R. (2016). Mineral. Mag. 80, 415–545.
Fargin, E., Berthereau, A., Cardinal, T., Le Flem, G., Ducasse, L., Canioni, L., Segonds, P.,
Sarger, L. & Ducasse, A. (1996). J. Non-Cryst. Solids. 203, 96–101.
Galy, J., Couégnat, G., Vila, E. & Matar, S. F. (2017). Comptes Rendus Chim. 20, 446–459.
Galy, J. & Matar, S. F. (2016). Prog. Solid State Chem. 44, 35–58.
Galy, J. & Matar, S. F. (2018). Solid State Sci. 82, 44–51.
Galy, J. & Matar, S. F. (2019). Prog. Solid State Chem. 56, 100252.
Galy, J., Meunier, G., Andersson, S. & Åström, A. (1975). J. Solid State Chem. 13, 142–159.
Galy, J. & Vignoles, G. L. (2020). Solid State Sci. 100, 106068.
Gillespie, R. J. & Nyholm, R. S. (1957). Q. Rev. Chem. Soc. 11, 339–380.
Hall, S. R., Allen, F. H. & Brown, I. D. (1991). Acta Crystallogr. A. 47, 655–685.

25
Hamani, D. (2010). Cristallochimie de matériaux à base de dioxyde de tellure : vers un
modèle structural pour l’étude des composés vitreux. thesis. Université de Limoges.
Hamani, D. & Masson, O. (2019). LPLoc program. IRCER - UMR CNRS 7315, Université
de Limoges, France. The software is freely available on request from the authors.
Jeansannetas, B., Blanchandin, S., Thomas, P., Marchet, P., Champarnaud-Mesjard, J. C.,
Merle-Méjean, T., Frit, B., Nazabal, V., Fargin, E., Le Flem, G., Martin, M. O.,
Bousquet, B., Canioni, L., Le Boiteux, S., Segonds, P. & Sarger, L. (1999). J. Solid
State Chem. 146, 329–335.
Kondratyuk, I. P., Muradyan, L. A., Pisarevskii, Yu. V. & Simonov, V. I. (1987).
Kristallografiya. 32, 609–617.
Kresse, G. & Furthmüller, J. (1996a). Comput. Mater. Sci. 6, 15–50.
Kresse, G. & Furthmüller, J. (1996b). Phys. Rev. B. 54, 11169–11186.
Kresse, G. & Hafner, J. (1993). Phys. Rev. B. 47, 558–561.
Kresse, G. & Hafner, J. (1994). Phys. Rev. B. 49, 14251–14269.
Kresse, G. & Joubert, D. (1999). Phys. Rev. B. 59, 1758–1775.
Matar, S. F. & Galy, J. (2015). Prog. Solid State Chem. 43, 82–97.
Mirgorodsky, A. P., Merle-Méjean, T., Thomas, P., Champarnaud-Mesjard, J.-C. & Frit, B.
(2002). J. Phys. Chem. Solids. 63, 545–554.
Perdew, J. P., Chevary, J. A., Vosko, S. H., Jackson, K. A., Pederson, M. R., Singh, D. J. &
Fiolhais, C. (1992). Phys. Rev. B. 46, 6671–6687.
Perdew, J. P., Chevary, J. A., Vosko, S. H., Jackson, K. A., Pederson, M. R., Singh, D. J. &
Fiolhais, C. (1993). Phys. Rev. B. 48, 4978–4978.
Rahm, M. & Christe, Karl. O. (2013). ChemPhysChem. 14, 3714–3725.
Roginskii, E. M., Kuznetsov, V. G., Smirnov, M. B., Noguera, O., Duclère, J.-R., Colas, M.,
Masson, O. & Thomas, P. (2017). J. Phys. Chem. C. 121, 12365–12374.
Seshadri, R. (2001). J. Chem. Sci. 113, 487–496.
Shannon, R. D. (1976). Acta Crystallogr. A32, 751–767.
Siritanon, T., Li, J., Stalick, J. K., Macaluso, R. T., Sleight, A. W. & Subramanian, M. A.
(2011). Inorg. Chem. 50, 8494–8501.
Soulis, M., Merle-Méjean, T., Mirgorodsky, A. P., Masson, O., Orhan, E., Thomas, P. &
Smirnov, M. B. (2008). J. Non-Cryst. Solids. 354, 199–202.
Suehara, S., Thomas, P., Mirgorodsky, A., Merle-Méjean, T., Champarnaud-Mesjard, J. C.,
Aizawa, T., Hishita, S., Todoroki, S., Konishi, T. & Inoue, S. (2004a). J. Non-Cryst.
Solids. 345–346, 730–733.

26
Suehara, S., Thomas, P., Mirgorodsky, A. P., Merle-Méjean, T., Champarnaud-Mesjard, J. C.,
Aizawa, T., Hishita, S., Todoroki, S., Konishi, T. & Inoue, S. (2004b). Phys. Rev. B.
70, 205121.
Tagg, S. L., Huffman, J. C. & Zwanziger, J. W. (1994). Chem. Mater. 6, 1884–1889.
Urusov, V. S. (2003). Z. Für Krist. 218, 709–719.
Verbaere, A., Marchand, R. & Tournoux, M. (1978). J. Solid State Chem. 23, 383–390.
Wallez, G. (1999). HYBRIDE: a program for the research of lone pairs positions in crystalline
solids.
(a). Crystallographic Information File project of the International Union of Crystallography.
(b). Inorganic Crystal Structure Database, Fachinformationszentrum Karlsruhe.