LOCAL TV STATION ROADMAP for MONETIZING … current social roadmap for local TV broadcasters is more...
28
© 2017 BIA/Kelsey and Share Rocket. All Rights Reserved LOCAL TV STATION ROADMAP for MONETIZING SOCIAL MEDIA April 2017
Transcript of LOCAL TV STATION ROADMAP for MONETIZING … current social roadmap for local TV broadcasters is more...
© 2017 BIA/Kelsey and Share Rocket. All Rights Reserved
LOCAL TV STATION ROADMAP for MONETIZING SOCIAL MEDIA April 2017
LOCAL TV STATION ROADMAP for MONETIZING SOCIAL MEDIA
© 2017 BIA/Kelsey and Share Rocket. All Rights Reserved i
CONTENTS Executive Summary ................................................................................................................................... 1
Introduction ................................................................................................................................................ 3
Local TV Station Social Media Roadmap ................................................................................................ 4
Total Addressable Market in Social Platform Advertising ................................................................... 7
Market Share of the Major Social Platforms ...................................................................................... 8
National Versus Local Social Media Audience Activation .................................................................... 9
Social Media Ad Spending Among SMBs that Advertise on TV ......................................................... 10
The Value of a Social Media Currency for TV Broadcasters .............................................................. 11
Local TV Social Audience Growth .......................................................................................................... 13
Content’s Reign in Social Even Stronger ............................................................................................... 14
Analysis of Major Social Platforms ........................................................................................................ 15
Facebook is the Dominant Platform for Engagement and Reach .................................................... 17
The Case for Engagement ...................................................................................................................... 19
Engagement Leads to Revenue Opportunity ................................................................................. 20
Selling Social Audiences Like TV ............................................................................................................ 21
Conclusions and Recommendations .................................................................................................... 23
About the Authors ................................................................................................................................... 24
About BIA/Kelsey ..................................................................................................................................... 25
About Share Rocket ................................................................................................................................. 25
Endnotes ................................................................................................................................................... 26
FIGURES Figure 1 - U.S. Mobile Social Advertising Forecast 2016-2021 ........................................................... 7
Figure 2 - Social Media Advertising by Company .................................................................................. 8
Figure 3 - Social Media Spending: National vs Local Activation .......................................................... 9
Figure 4 - Use of Social Media Advertising by SMBs Using TV/Cable ............................................... 10
Figure 5 - Top 10 Market Station Audience (May 2016) ..................................................................... 12
Figure 6 - Example Market (Dallas-Fort Worth) ................................................................................... 13
Figure 7 - Pew Demographic Data by Platform ................................................................................... 15
Figure 8 - 15-Market Study Combined Totals* .................................................................................... 18
LOCAL TV STATION ROADMAP for MONETIZING SOCIAL MEDIA
© 2017 BIA/Kelsey and Share Rocket. All Rights Reserved 1
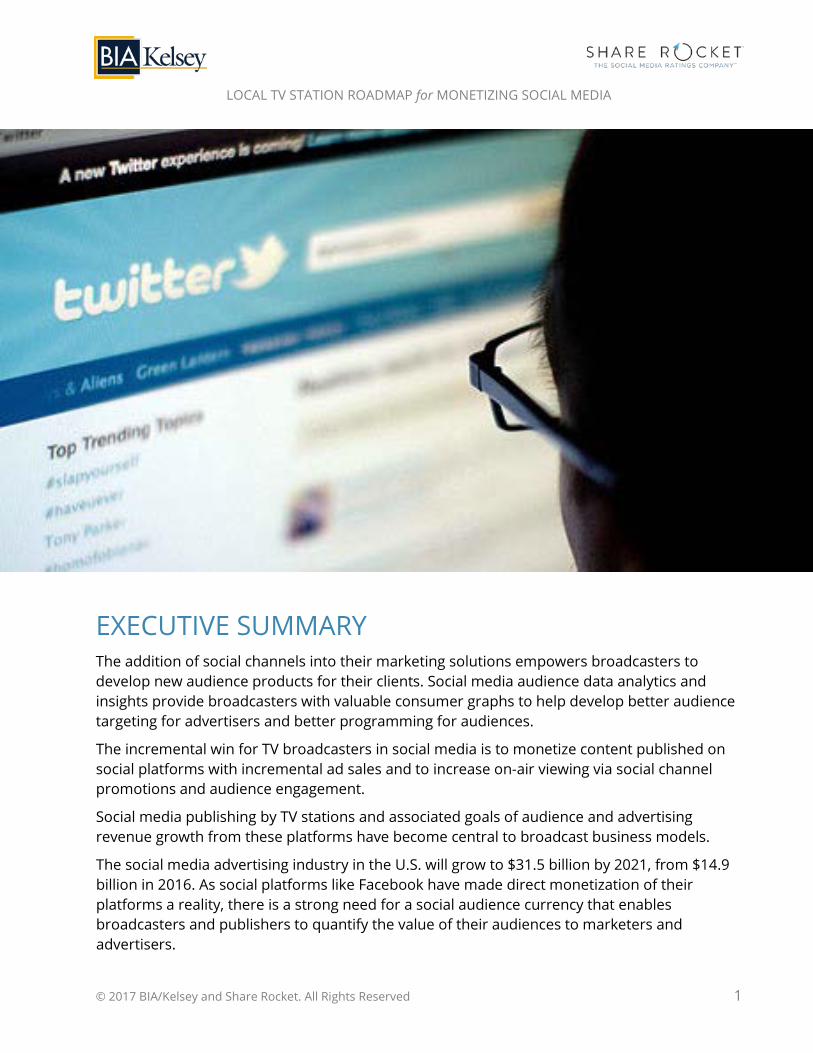
EXECUTIVE SUMMARY The addition of social channels into their marketing solutions empowers broadcasters to develop new audience products for their clients. Social media audience data analytics and insights provide broadcasters with valuable consumer graphs to help develop better audience targeting for advertisers and better programming for audiences.
The incremental win for TV broadcasters in social media is to monetize content published on social platforms with incremental ad sales and to increase on-air viewing via social channel promotions and audience engagement.
Social media publishing by TV stations and associated goals of audience and advertising revenue growth from these platforms have become central to broadcast business models.
The social media advertising industry in the U.S. will grow to $31.5 billion by 2021, from $14.9 billion in 2016. As social platforms like Facebook have made direct monetization of their platforms a reality, there is a strong need for a social audience currency that enables broadcasters and publishers to quantify the value of their audiences to marketers and advertisers.
LOCAL TV STATION ROADMAP for MONETIZING SOCIAL MEDIA
© 2017 BIA/Kelsey and Share Rocket. All Rights Reserved 2
When considering the opportunity to monetize their social audiences, we offer three conclusions for broadcasters:
1 2017 can be the breakout year for broadcasters to monetize their investments in social media more fully. This will require broadcasters to adapt and evolve their sales organizations.
2 Broadcasters need to develop four major strategies to achieve success in building out social media complements to their broadcast platforms: Audience amplification and extension Revenue diversification and growth Product lifecycle and platform strategy Audience targeting and consumer journeys
3 Facebook is the dominant social platform for local TV and sponsored content sales on this platform can be attractive because: Cost of sales are low Content costs are low New source of premium video inventory can be monetized Scarcity provides upward pricing pressure since broadcast content offers
limited inventory.
LOCAL TV STATION ROADMAP for MONETIZING SOCIAL MEDIA
© 2017 BIA/Kelsey and Share Rocket. All Rights Reserved 3
INTRODUCTION The win for TV broadcasters in social media is to monetize content published on social platforms with incremental ad sales and to increase on-air viewing via social channel promotions and audience engagement.
In addition to multiplatform content distribution, the addition of social channels in their distribution strategy empowers broadcasters to develop new audience products. Social media audience data analytics and insights provide broadcasters with valuable consumer graphs for deep segmentation beyond gender/age and optimizing content and advertising and better serve audience needs.
Local TV broadcasters can use their high value and premium news content to develop news packages specifically for social channels to attract and sell different audience segments than they can reach over-the-air alone. This ability will allow TV broadcasters to realize some of the over $10 billion that will be spent in locally-targeted social advertising by 2021.
For example, audience data show a continual decline in the millennial audience for broadcast TV. A survey by Coupofy found that among millennials consuming news on their smartphones, Twitter (14%) and Instagram (33%) are top channels used. However, the killer app clearly is Facebook as the source of smartphone news for 69% of millennials. Overall, 40% of millennials check their social media for news first thing in the morning. Men were twice as likely to as women to do so. And there are also attitudinal and lifestyle differences among millennials who use Facebook, Twitter and Instagram for their news. By using news content to develop products and associated services for these social media channels, local TV broadcasters are growing the value of their news franchises.
LOCAL TV STATION ROADMAP for MONETIZING SOCIAL MEDIA
© 2017 BIA/Kelsey and Share Rocket. All Rights Reserved 4
LOCAL TV STATION SOCIAL MEDIA ROADMAP Social media publishing by TV stations and associated goals of audience and advertising revenue growth from these platforms have become central to broadcast business models.
Social channels are attracting more of their audiences' time and attention as an efficient and complementary means for getting their news. According to the Pew Research Center, "Facebook has 1.8 billion users, and 44% of Americans get their news from the site." These are significant numbers for the Facebook platform.
The sheer mass and growth of social platforms like Facebook encourages leading broadcast TV groups like E. W. Scripps to publish news first on Facebook's live streaming platform. Nonetheless, Scripps is having challenges monetizing their Facebook audiences on that platform. As a Scripps executive told Broadcasting & Cable, "Because it's difficult for stations to make money directly from the Facebook Live feeds, the Scripps stations try to nudge viewers back to their advertising-supported websites or broadcasts."
The current social roadmap for local TV broadcasters is more focused on branding goals (awareness, favorability, engagement) than monetization by publishing their content on these platforms. The key to monetizing social audiences is to entice them into the broadcast audience to boost ratings. However, we're seeing that social media publishing roadmap expand strategically. Local TV broadcasters are pursuing these four basic strategies in their social media roadmap.
LOCAL TV STATION ROADMAP for MONETIZING SOCIAL MEDIA
© 2017 BIA/Kelsey and Share Rocket. All Rights Reserved 5
Here's the Local TV Social Media Roadmap we're expecting to see growing into the future:
1 Audience Amplification and Extension: Broadcasters are seeking deeper audience engagement, targeting and revenue growth by publishing their own content not only to air but to social channels to further serve existing broadcast audiences and extend their reach to segments they don't serve over the air.
2 Revenue Diversification and Growth: Marketers and agencies are following those audiences with their spending. Social media channels appeal to different audience segments and have developed very effective ad formats and audience targeting tools to encourage increasing ad spend. Indeed, with the range of formats, inventory, audience targeting, publishing and programmatic advertising solutions, social media channels have become their own integrated ad platforms and primarily mobile ad platforms at that. Consider the case of Facebook when considering how fast change can occur in digital media. In Q1 2012 Facebook had essentially zero dollars from mobile ad revenue. By Q4 2016, Facebook generated $7.25 billion in mobile ad revenue, or about 85% of its total revenue.
3 Product Lifecycle and Platform Strategy: Local TV news content of course is a perishable asset, so the more ways stations can monetize that content in a relatively short window the better. By pairing with social media players, local TV broadcasters can take a broadcast news product and add to its lifecycle by repurposing the underlying assets into news packages better suited to the different social channels and their respective audiences. For example, Facebook's recently-launched "Journalism Project" has the explicit goal of collaborating with news organizations to develop new products, train journalists in developing new storytelling formats and working together to come up with even more new business models. Social media can provide broadcasters with better access to more efficient and scalable distribution platforms that technically are better optimized than they can accomplish themselves. The repurposed and incremental news packages broadcasters distribute across social platforms and the resulting audiences they attract add to the lifecycle value of their news assets in a timely fashion.
LOCAL TV STATION ROADMAP for MONETIZING SOCIAL MEDIA
© 2017 BIA/Kelsey and Share Rocket. All Rights Reserved 6
4 Audience Targeting and Consumer Journey: Broadcasters can also leverage social media's advanced audience targeting data for their news programming running on these partner platforms to create different and incremental audience segments than they what they have to sell over the air. TV broadcasters and their advertisers can also benefit from audiences they reach with both their over-the-air and social programming by taking advantage of the consumer journey and the differential and complementary roles broadcast and social media play in this journey. A recent joint study between Facebook and Nielsen Catalina found that, "in most cases, a combination of TV and Facebook exposure resulted in the best return on ad spend, although some campaigns that brought the two together resulted in flat ROAS." By developing ad campaigns that run across screens and platforms like broadcast and social, broadcasters can provide better overall service to both audiences and advertisers.
LOCAL TV STATION ROADMAP for MONETIZING SOCIAL MEDIA
© 2017 BIA/Kelsey and Share Rocket. All Rights Reserved 7
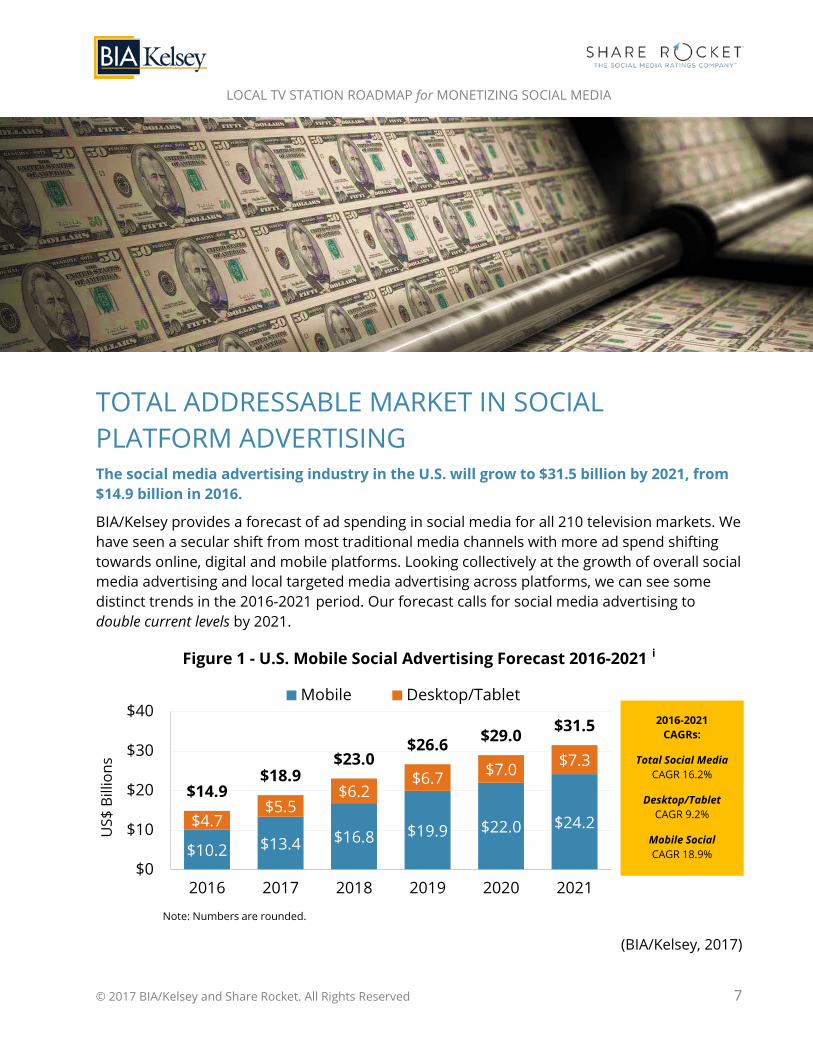
TOTAL ADDRESSABLE MARKET IN SOCIAL PLATFORM ADVERTISING The social media advertising industry in the U.S. will grow to $31.5 billion by 2021, from $14.9 billion in 2016.
BIA/Kelsey provides a forecast of ad spending in social media for all 210 television markets. We have seen a secular shift from most traditional media channels with more ad spend shifting towards online, digital and mobile platforms. Looking collectively at the growth of overall social media advertising and local targeted media advertising across platforms, we can see some distinct trends in the 2016-2021 period. Our forecast calls for social media advertising to double current levels by 2021.
Figure 1 - U.S. Mobile Social Advertising Forecast 2016-2021 i
(BIA/Kelsey, 2017)
$10.2 $13.4 $16.8 $19.9 $22.0 $24.2 $4.7 $5.5
$6.2 $6.7 $7.0 $7.3
$14.9 $18.9
$23.0 $26.6 $29.0 $31.5
$0
$10
$20
$30
$40
2016 2017 2018 2019 2020 2021
Mobile Desktop/Tablet
US$
Bill
ions
Note: Numbers are rounded.
2016-2021 CAGRs:
Total Social Media CAGR 16.2%
Desktop/Tablet CAGR 9.2%
Mobile Social CAGR 18.9%
LOCAL TV STATION ROADMAP for MONETIZING SOCIAL MEDIA
© 2017 BIA/Kelsey and Share Rocket. All Rights Reserved 8
Social media players have successfully optimized their platforms for both mobile users and advertisers; mobile is now the largest contributor of revenues for most social media companies. Driven largely by Facebook and Twitter, U.S. mobile social ad revenues will grow almost 2.5 times the 2016 level by 2021, reaching $24.2 billion — an 18.9 percent CAGR.
Facebook dominates the industry currently and will continue to maintain its large market share lead of more than 80% in the foreseeable future, but smaller rivals like Snapchat and Pinterest are starting to gain traction with advertisers and will slowly chip away some market share for themselves. Facebook has been particularly resilient at maintaining its user base and quickly adjusting to new competitive threats from rivals by offering new features to users and their advertising partners. Many companies have come to recognize Facebook’s leadership in the space and rely on it as their primary channel to reach social media users.
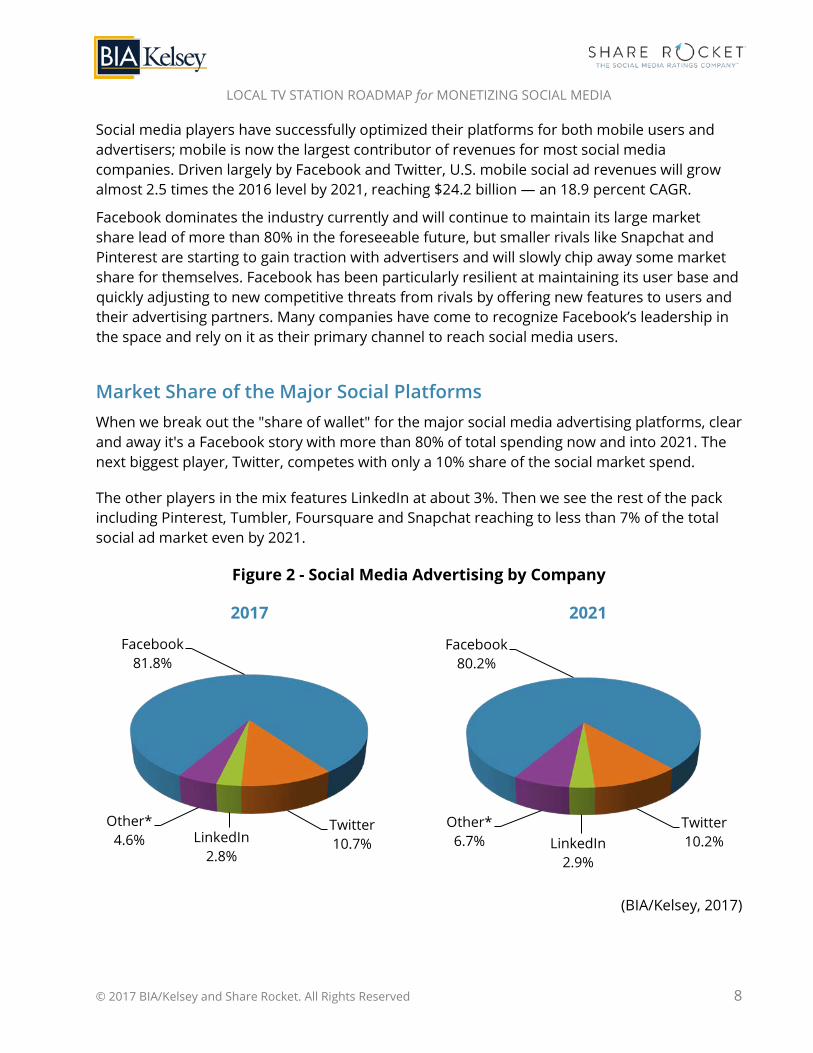
Market Share of the Major Social Platforms When we break out the "share of wallet" for the major social media advertising platforms, clear and away it's a Facebook story with more than 80% of total spending now and into 2021. The next biggest player, Twitter, competes with only a 10% share of the social market spend.
The other players in the mix features LinkedIn at about 3%. Then we see the rest of the pack including Pinterest, Tumbler, Foursquare and Snapchat reaching to less than 7% of the total social ad market even by 2021.
Figure 2 - Social Media Advertising by Company
2017 2021
(BIA/Kelsey, 2017)
Facebook 81.8%
Twitter 10.7% LinkedIn
2.8%
Other* 4.6%
Facebook 80.2%
Twitter 10.2% LinkedIn
2.9%
Other* 6.7%
LOCAL TV STATION ROADMAP for MONETIZING SOCIAL MEDIA
© 2017 BIA/Kelsey and Share Rocket. All Rights Reserved 9
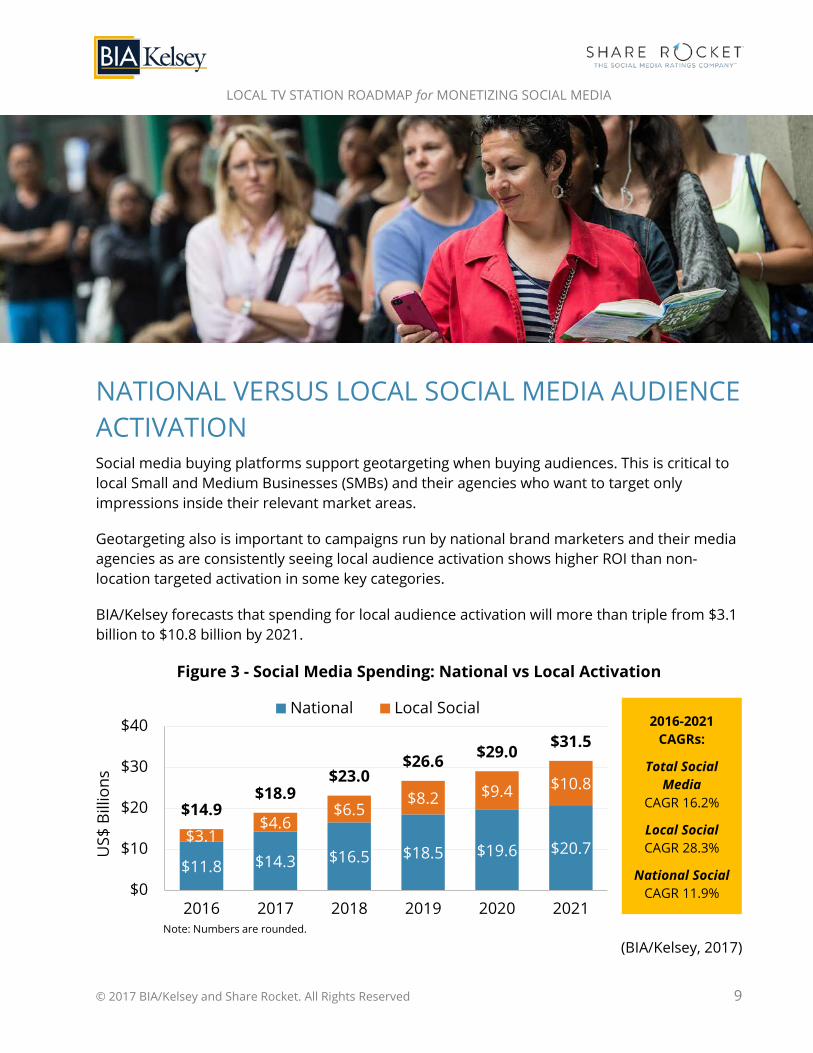
NATIONAL VERSUS LOCAL SOCIAL MEDIA AUDIENCE ACTIVATION Social media buying platforms support geotargeting when buying audiences. This is critical to local Small and Medium Businesses (SMBs) and their agencies who want to target only impressions inside their relevant market areas.
Geotargeting also is important to campaigns run by national brand marketers and their media agencies as are consistently seeing local audience activation shows higher ROI than non-location targeted activation in some key categories.
BIA/Kelsey forecasts that spending for local audience activation will more than triple from $3.1 billion to $10.8 billion by 2021.
Figure 3 - Social Media Spending: National vs Local Activation
(BIA/Kelsey, 2017)
$11.8 $14.3 $16.5 $18.5 $19.6 $20.7 $3.1
$4.6 $6.5
$8.2 $9.4 $10.8 $14.9
$18.9 $23.0
$26.6 $29.0 $31.5
$0
$10
$20
$30
$40
2016 2017 2018 2019 2020 2021
National Local Social
US$
Bill
ions
Note: Numbers are rounded.
2016-2021 CAGRs:
Total Social Media
CAGR 16.2%
Local Social CAGR 28.3%
National Social CAGR 11.9%
LOCAL TV STATION ROADMAP for MONETIZING SOCIAL MEDIA
© 2017 BIA/Kelsey and Share Rocket. All Rights Reserved 10
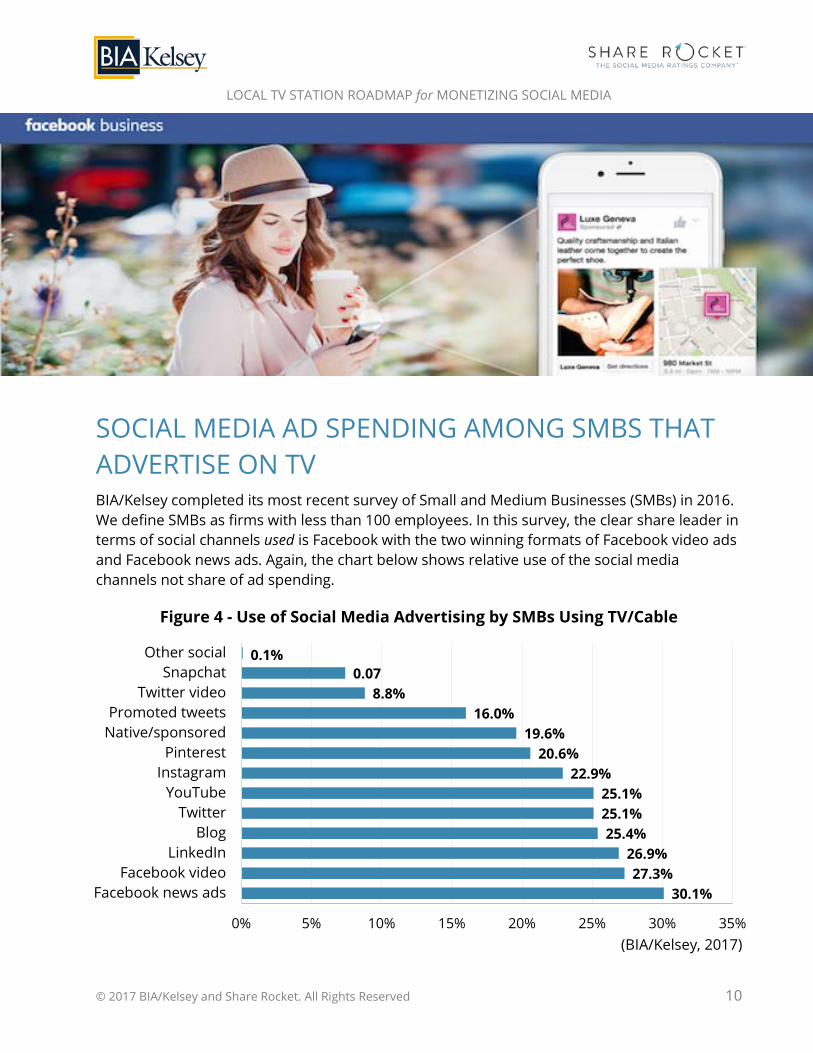
SOCIAL MEDIA AD SPENDING AMONG SMBS THAT ADVERTISE ON TV BIA/Kelsey completed its most recent survey of Small and Medium Businesses (SMBs) in 2016. We define SMBs as firms with less than 100 employees. In this survey, the clear share leader in terms of social channels used is Facebook with the two winning formats of Facebook video ads and Facebook news ads. Again, the chart below shows relative use of the social media channels not share of ad spending.
Figure 4 - Use of Social Media Advertising by SMBs Using TV/Cable
(BIA/Kelsey, 2017)
30.1% 27.3%
26.9% 25.4%
25.1% 25.1%
22.9% 20.6%
19.6% 16.0%
8.8% 0.07
0.1%
0% 5% 10% 15% 20% 25% 30% 35%
Facebook news adsFacebook video
LinkedInBlog
TwitterYouTube
InstagramPinterest
Native/sponsoredPromoted tweets
Twitter videoSnapchat
Other social
LOCAL TV STATION ROADMAP for MONETIZING SOCIAL MEDIA
© 2017 BIA/Kelsey and Share Rocket. All Rights Reserved 11
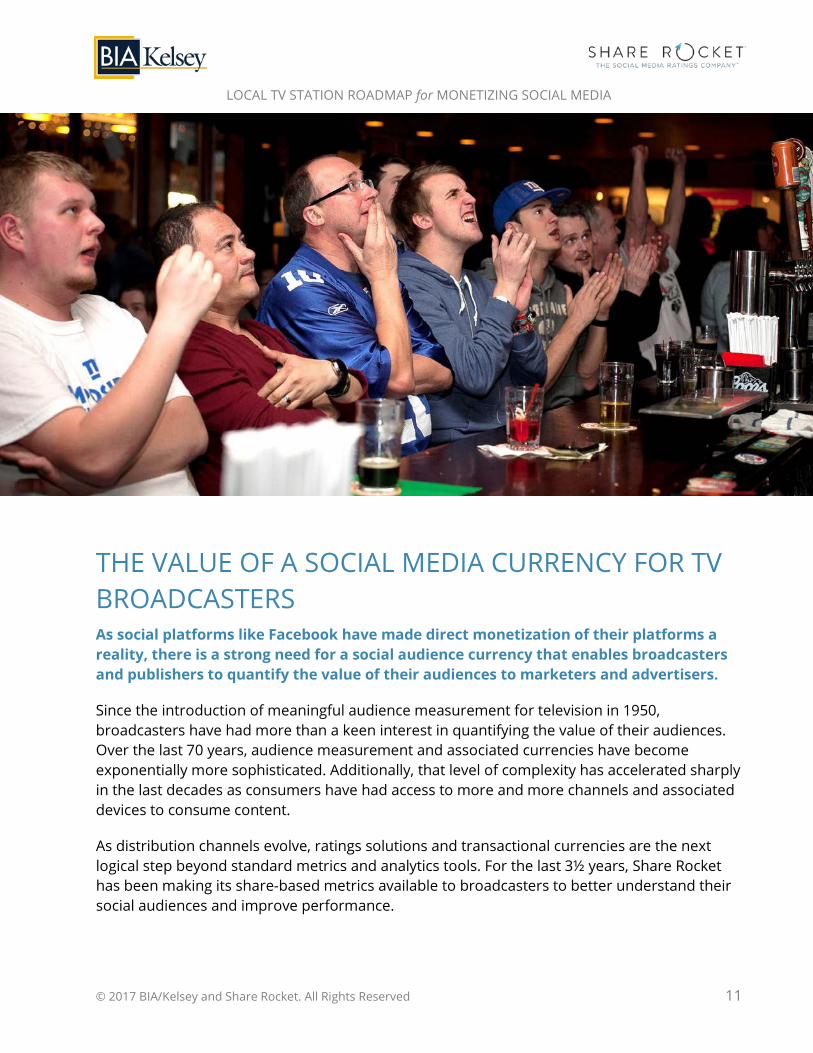
THE VALUE OF A SOCIAL MEDIA CURRENCY FOR TV BROADCASTERS As social platforms like Facebook have made direct monetization of their platforms a reality, there is a strong need for a social audience currency that enables broadcasters and publishers to quantify the value of their audiences to marketers and advertisers.
Since the introduction of meaningful audience measurement for television in 1950, broadcasters have had more than a keen interest in quantifying the value of their audiences. Over the last 70 years, audience measurement and associated currencies have become exponentially more sophisticated. Additionally, that level of complexity has accelerated sharply in the last decades as consumers have had access to more and more channels and associated devices to consume content.
As distribution channels evolve, ratings solutions and transactional currencies are the next logical step beyond standard metrics and analytics tools. For the last 3½ years, Share Rocket has been making its share-based metrics available to broadcasters to better understand their social audiences and improve performance.
LOCAL TV STATION ROADMAP for MONETIZING SOCIAL MEDIA
© 2017 BIA/Kelsey and Share Rocket. All Rights Reserved 12
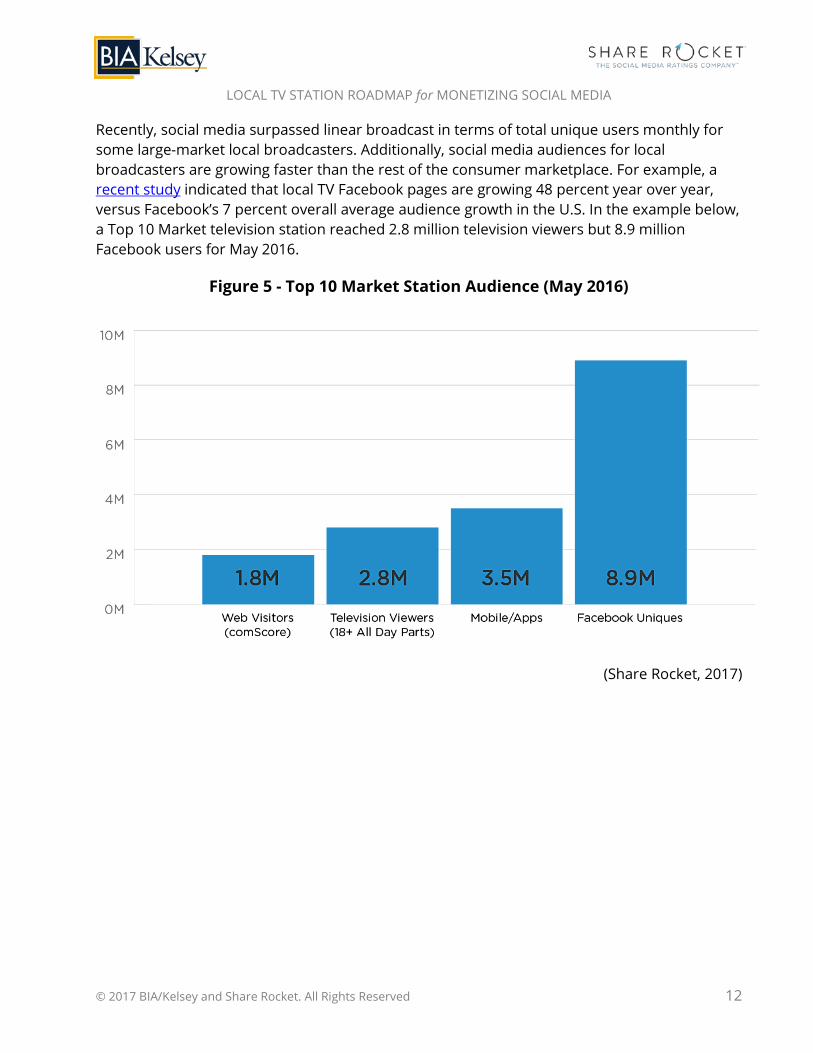
Recently, social media surpassed linear broadcast in terms of total unique users monthly for some large-market local broadcasters. Additionally, social media audiences for local broadcasters are growing faster than the rest of the consumer marketplace. For example, a recent study indicated that local TV Facebook pages are growing 48 percent year over year, versus Facebook’s 7 percent overall average audience growth in the U.S. In the example below, a Top 10 Market television station reached 2.8 million television viewers but 8.9 million Facebook users for May 2016.
Figure 5 - Top 10 Market Station Audience (May 2016)
(Share Rocket, 2017)
LOCAL TV STATION ROADMAP for MONETIZING SOCIAL MEDIA
© 2017 BIA/Kelsey and Share Rocket. All Rights Reserved 13
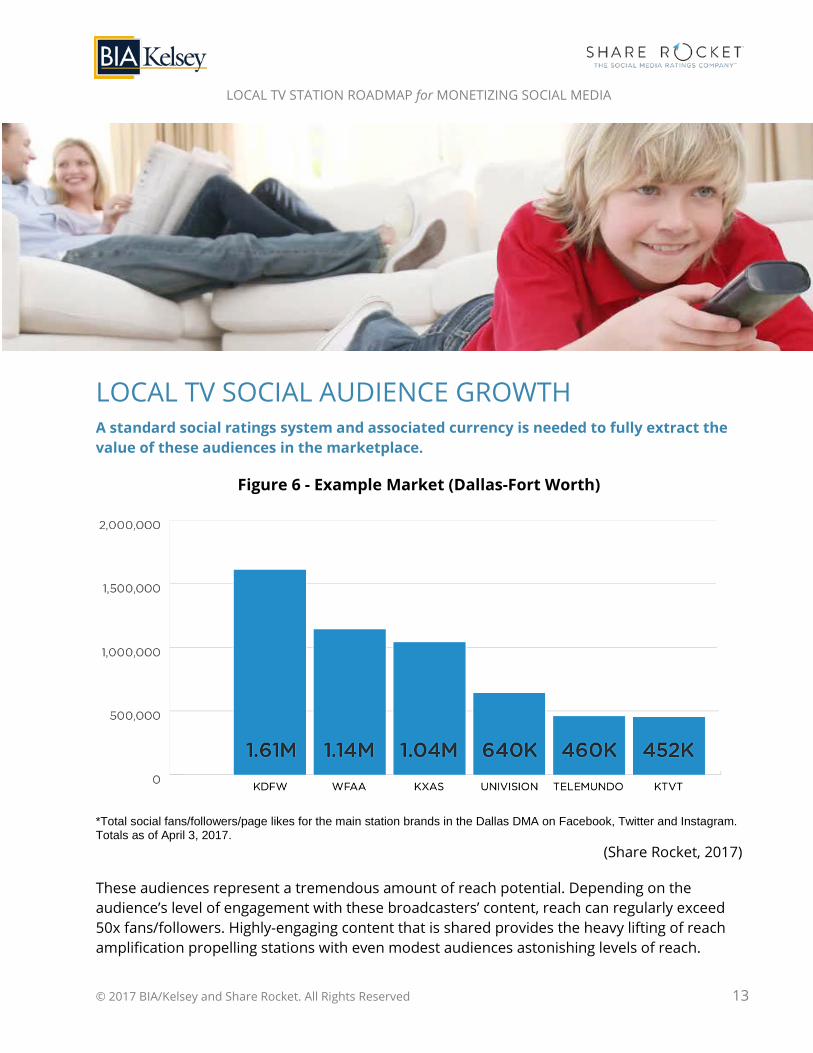
LOCAL TV SOCIAL AUDIENCE GROWTH A standard social ratings system and associated currency is needed to fully extract the value of these audiences in the marketplace.
Figure 6 - Example Market (Dallas-Fort Worth)
*Total social fans/followers/page likes for the main station brands in the Dallas DMA on Facebook, Twitter and Instagram. Totals as of April 3, 2017.
(Share Rocket, 2017)
These audiences represent a tremendous amount of reach potential. Depending on the audience’s level of engagement with these broadcasters’ content, reach can regularly exceed 50x fans/followers. Highly-engaging content that is shared provides the heavy lifting of reach amplification propelling stations with even modest audiences astonishing levels of reach.
LOCAL TV STATION ROADMAP for MONETIZING SOCIAL MEDIA
© 2017 BIA/Kelsey and Share Rocket. All Rights Reserved 14
CONTENT’S REIGN IN SOCIAL EVEN STRONGER Content from local broadcasters represents some of the most engaging content on Facebook.
Facebook values this content as we see in the amount of effort the company has recently been putting into publisher relations. Earlier this year, Facebook announced their “Journalism Project.” This high-profile project has highlighted the value Facebook is placing on locally-published content. To entice publishers and broadcasters to publish their content directly on-platform, Facebook has begun to address long-standing monetization challenges publishers have had with the platform. Improvements to the number and types of available ad units on Facebook Instant Articles, combined with the relaxation of Sponsored Content restrictions, are clear signs that Facebook is addressing concerns related to monetization.
To further emphasize how important this content is to Facebook, they now allow broadcasters and publishers to retain 100% of the revenue generated, if the content is published natively and when certain rules and requirements are followed.
LOCAL TV STATION ROADMAP for MONETIZING SOCIAL MEDIA
© 2017 BIA/Kelsey and Share Rocket. All Rights Reserved 15
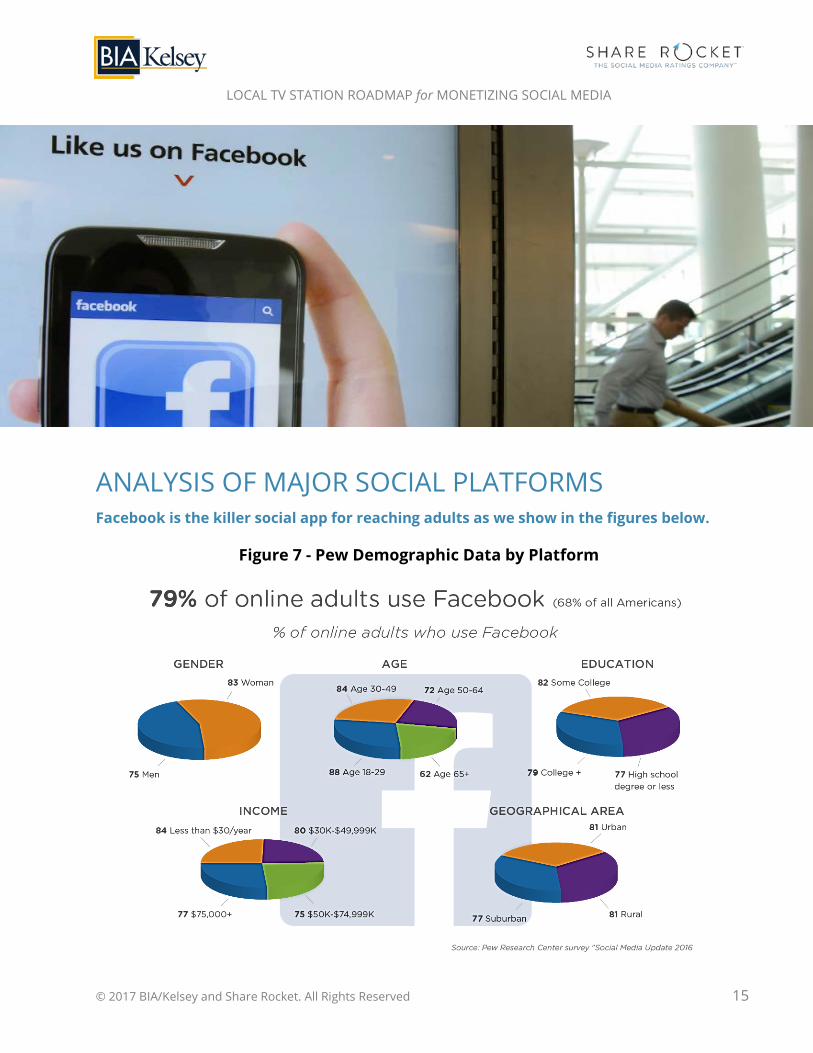
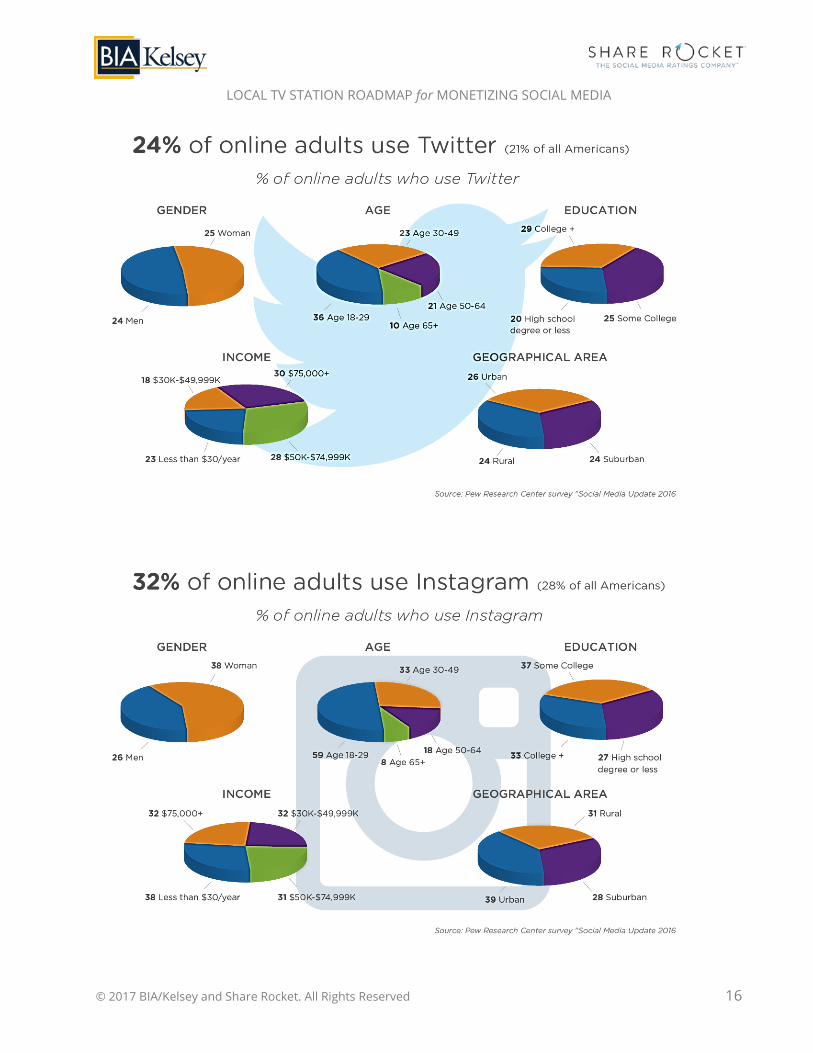
ANALYSIS OF MAJOR SOCIAL PLATFORMS Facebook is the killer social app for reaching adults as we show in the figures below.
Figure 7 - Pew Demographic Data by Platform
LOCAL TV STATION ROADMAP for MONETIZING SOCIAL MEDIA
© 2017 BIA/Kelsey and Share Rocket. All Rights Reserved 16
LOCAL TV STATION ROADMAP for MONETIZING SOCIAL MEDIA
© 2017 BIA/Kelsey and Share Rocket. All Rights Reserved 17
FACEBOOK IS THE DOMINANT PLATFORM FOR ENGAGEMENT AND REACH The singular ability to drive engagement on social media has made Facebook the dominant tool for broadcasters in the format.
Recently analyzed social platform data from local television markets from October to December illustrates Facebook’s dominance as an engagement platform. The analysis included data from top ten DMAs, mid-sized DMAs and small market DMAs. The data shows small, mid-sized, and large market broadcasters all saw very similar levels of engagement on Facebook, Twitter and Instagram. We found that broadcasters in large markets did post more often on Twitter while broadcasters in smaller markets posted more on the Facebook platform.
However, while there were differences between the percentage of Voice that was published on Twitter versus Facebook in markets of different sizes, the overall data showed consistently that more than 90 percent of the engagement for broadcasters in all three market sizes came from Facebook.
LOCAL TV STATION ROADMAP for MONETIZING SOCIAL MEDIA
© 2017 BIA/Kelsey and Share Rocket. All Rights Reserved 18
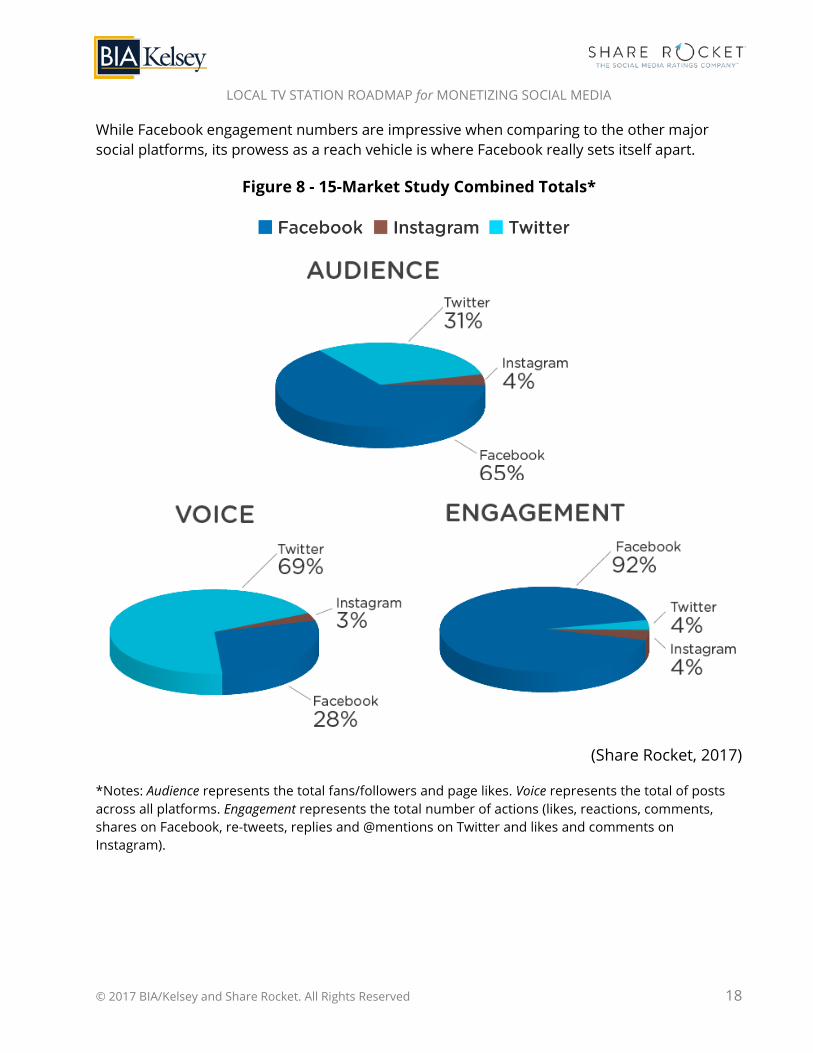
While Facebook engagement numbers are impressive when comparing to the other major social platforms, its prowess as a reach vehicle is where Facebook really sets itself apart.
Figure 8 - 15-Market Study Combined Totals*
(Share Rocket, 2017)
*Notes: Audience represents the total fans/followers and page likes. Voice represents the total of posts across all platforms. Engagement represents the total number of actions (likes, reactions, comments, shares on Facebook, re-tweets, replies and @mentions on Twitter and likes and comments on Instagram).
LOCAL TV STATION ROADMAP for MONETIZING SOCIAL MEDIA
© 2017 BIA/Kelsey and Share Rocket. All Rights Reserved 19
THE CASE FOR ENGAGEMENT Consumers are now completely in control, so their engagement and attention must be earned.
Unlike television or even “traditional digital” platforms, social platforms bring a unique form of audience interaction: Engagement. Content that is liked, commented on and shared with friends and family is a new concept to most broadcasters that have built their businesses around one-way communications. While most have adapted to the concept of direct two-way dialogues with their audiences, few have been able to translate this newfound phenomenon into meaningful revenue.
Digital devices give consumers the power to watch, or experience (because it’s no longer just passive viewing), what they want to watch or experience when they want to watch or experience it, on whatever device they choose. And they are growing increasingly savvy in their use of new technologies to avoid unwanted intrusions on their time.
LOCAL TV STATION ROADMAP for MONETIZING SOCIAL MEDIA
© 2017 BIA/Kelsey and Share Rocket. All Rights Reserved 20
Dr. Scott Moore writes that we’re in "The Era of Consumer Engagement," and points to mountains of historical evidence that highly engaging content contributes towards effective advertising. This is a long and widely accepted fact but it’s become somewhat lost in recent years as the industry dialog shifted towards programmatic media placement and more intelligent audience targeting.
In the Era of Consumer Engagement, highly engaging social content from trusted publishers is an enormous untapped resource for advertisers. Every publisher post has these intrinsic strengths we think of as The Four Pillars of Engagement Value:
1 Amplified Reach
2 Audience Receptivity
3 Viewability
4 Brand Safety
Add to these Pillars that the content is most often mobile, it’s increasingly video and contains ads that cannot be skipped or blocked. This is powerful media and exactly what advertisers are longing for, as evidence by the industry’s recent cries to clean up the media supply chain.
Engagement Leads to Revenue Opportunity Stations and networks that have committed to growing engagement have larger and faster growing social audiences. They also generate more engagement per post than those that don’t. Besides growing their footprint, they have cultivated a highly-engaged audience around a new class of highly premium ad inventory.
LOCAL TV STATION ROADMAP for MONETIZING SOCIAL MEDIA
© 2017 BIA/Kelsey and Share Rocket. All Rights Reserved 21
SELLING SOCIAL AUDIENCES LIKE TV The increasing number of ad units available, coupled with Facebook’s commitment to working with publishers to make Instant Articles a successful monetization tool, makes directly sold Instant Articles inventory a powerful opportunity for growth in 2017.
Several progressive companies are bringing back the concept of selling audiences as opposed to impressions across their digital and multi-platform networks. Snap, Pandora, and Roku are actively promoting strategies to make buying their audiences “more like TV”. Local broadcaster Nexstar Broadcasting has shifted their core strategy to selling audiences versus impressions, allowing them to better value their multi-platform assets.
In the last 12 months Facebook has made several revenue-generating opportunities available for publishers to monetize their audiences and content.
Instant Articles Facebook Audience Network (FAN): 70/30 revenue split Publisher/Facebook
Direct Sell: 100% to Publisher
Sponsored Content / Branded Content
Direct Sell: 100% to Publisher
LOCAL TV STATION ROADMAP for MONETIZING SOCIAL MEDIA
© 2017 BIA/Kelsey and Share Rocket. All Rights Reserved 22
Throughout most of 2016, broadcasters and publishers tested the Facebook Audience Network (FAN) powered Instant Article approach to monetization of their Facebook content. The overwhelming consensus has been that the revenue generated was not worth the tradeoff of giving up referral traffic into their owned digital platforms.
It is worth noting however, that some broadcast groups have found success with Instant Articles by direct selling the inventory. This approach has resulted in improved CPMs. Some groups have successfully sold this same inventory at 2-3x higher CPMs than were generated by Facebook sold inventory. The bonus, of course, is being able to retain 100 percent of this revenue because it is sold directly.
Sponsored Content is still very much in the experimental or testing phase as well, but represents perhaps even more upside for broadcasters and publishers with live video capabilities.
National broadcasters as well as magazine and newspaper publishers appear to be the most active pioneers in the Sponsored Content category. However, several local broadcasters have begun testing the platform and revenue potential and leveraging the higher engagement and wider organic reach this content type provides.
Sponsored Content on Facebook is attractive to local broadcasters and publishers for these four reasons:
1 Cost of sales is low. Existing sales teams can add Sponsored Content to their offerings. Digital sales teams can sell a new platform. Television sales can offer a new (and typically younger and mostly mobile audience) as an audience extension to their television buy.
2 Content costs are low. A typical station is already creating an average of 1500 engaging posts per month on Facebook. Weather, Sports, and other sponsor friendly content can now be published with a sponsored message attached.
3 New Source of Premium Video Inventory. Facebook Live and native video posts can now be monetized.
4 Scarcity provides upward pricing pressure. Unlike digital where there is seemingly unlimited impressions available, Sponsored Content is a limited commodity. There are only so many posts or avails published each day.
LOCAL TV STATION ROADMAP for MONETIZING SOCIAL MEDIA
© 2017 BIA/Kelsey and Share Rocket. All Rights Reserved 23
CONCLUSIONS AND RECOMMENDATIONS BIA/Kelsey's advertising forecast paints the clear picture that growth in advertising expenditures will skew toward digital channels and especially mobile and video platforms. Facebook is the singular social platform that offers broadcasters the highest levels of audience engagement and monetization and it's particularly strong in its mobile video reach.
We offer these final takeaways:
1 Broadcasters are looking to better service audiences with deeper insights into what content engages them and advertisers looking for cross-platform audience targeting with premium content.
2 2017 is the year to monetize social, critical forces are coming together in terms of platforms, audiences, social media currency and increased investment in social by marketers and agencies.
3 Broadcasters and publishers that can quickly adapt their sales organizations are poised to capitalize first and maximize their revenue opportunity.
4 Broadcasters need to bring to market a new social media currency and develop sales organizations and strategies to quickly scale a social monetization strategy.
LOCAL TV STATION ROADMAP for MONETIZING SOCIAL MEDIA
© 2017 BIA/Kelsey and Share Rocket. All Rights Reserved 24
ABOUT THE AUTHORS
Rick Ducey Managing Director, BIA/Kelsey
Ducey is managing director, leading BIA/Kelsey’s strategy consulting practice. He assists clients with their business planning and revenue models, strategic research, market assessment, and designing and implementing strategies for leveraging video media assets and inventory in local markets.
Mark Fratrik SVP, Chief Economist, BIA/Kelsey Fratrik serves as BIA/Kelsey’s chief economist and is responsible for forecasting across all local media segments. He also manages the company’s numerous proprietary databases and conducts primary research on various trends in the broadcasting and related communications industries.
Chris Kraft CEO/Founder, Share Rocket Kraft is an accomplished media veteran and serial entrepreneur. Share Rocket is a social media ratings and audience insights company providing broadcasters and digital publishers an easy way to measure, manage and monetize their social media equity. Share Rocket is the emerging standard social media ratings and currency for the broadcast industry.
LOCAL TV STATION ROADMAP for MONETIZING SOCIAL MEDIA
© 2017 BIA/Kelsey and Share Rocket. All Rights Reserved 25
ABOUT BIA/KELSEY Local media is one of the fastest moving industries of our time. And BIA/Kelsey has been at the center of it for more than 30 years.
BIA/Kelsey is the leading research and advisory firm focused on the advertising and marketing marketplace. We have proven advisory services and consulting methods that put our clients in the best possible position to compete and stand out in today’s multiplatform, interactive world.
Our research, forecasts, industry analysis, competitive intelligence and industry-leading analyst team propel our clients’ success forward. Put yourself in the best possible position to compete and win — turn to BIA/Kelsey.
Connect with BIA/Kelsey:
www.biakelsey.com
Local Media Watch blog
www.twitter.com/BIAKelsey
www.facebook.com/biakelsey
BIA/Kelsey’s daily newsletter
ABOUT SHARE ROCKET Share Rocket is a social media ratings and audience solution providing media companies an easy way to quantify their social media equity, benchmark against peers and turn social market intelligence into insights that drive social success.
When it comes to measuring social media, broadcasters have unique requirements. Share Rocket was developed to give broadcasters a way to measure much the same way they do on-air … with ratings based metrics.
Are you winning? Define your market and see how you compete. Tracking of multi-tiered brands and sub-brands provides foundation for Social Ratings™ and allows you to measure Total Social Equity™ for internal and competitive brands. Our proprietary ShareScore™ provides a quantitative measurement of social performance relative to a competitive set. Social Overnights – Market rankings for brands and sub-brands based on Social Share™ or Social Equity Index™ prescriptive reports show how to improve social performance.
Easily compare performance against best-in-market peers. Reveals tactics and best practices employed by best-in-market performers (post frequency, post type, time of day, and others).
Request a demo today.
LOCAL TV STATION ROADMAP for MONETIZING SOCIAL MEDIA
© 2017 BIA/Kelsey and Share Rocket. All Rights Reserved 26
ENDNOTES i Note that BIA/Kelsey defines "social media advertising" as money spent on advertising formats across social networks. Social advertising is included in BIA/Kelsey’s forecast in the "display" advertising format category in the online/interactive and mobile advertising platforms. BIA/Kelsey’s definition of social advertising includes only paid advertising. Therefore, our forecast excludes other monetization aspects of social media such as virtual currency, social measurement platforms and services or social commerce (i.e., e-commerce that is supported by social media other than paid advertising).