The Driving-Force Dependence of Electrochemical Rate Parameters

Local order parameters for use in driving homogeneous ice nucleationwith all-atom models of water
Aleks Reinhardt,1 Jonathan P. K. Doye,1, a) Eva G. Noya,2 and Carlos Vega31)Physical and Theoretical Chemistry Laboratory, Department of Chemistry, University of Oxford, Oxford, OX1 3QZ,United Kingdom2)Instituto de Química Física Rocasolano, CSIC, Calle Serrano 119, E-28006 Madrid,Spain3)Departamento de Química Física, Facultad de Ciencias Químicas, Universidad Complutense de Madrid, E-28040 Madrid,Spain
(Dated: 22 October 2012)
We present a local order parameter based on the standard Steinhardt–Ten Wolde approach that is capable both of trackingand of driving homogeneous ice nucleation in simulations of all-atom models of water. We demonstrate that it is capableof forcing the growth of ice nuclei in supercooled liquid water simulated using the TIP4P/2005 model using overbiassedumbrella sampling Monte Carlo simulations. However, even with such an order parameter, the dynamics of ice growthin deeply supercooled liquid water in all-atom models of water are shown to be very slow, and so the computation offree energy landscapes and nucleation rates remains extremely challenging.
PACS numbers: 64.60.Q-, 64.70.D-, 82.60.Nh, 64.60.qe
I. INTRODUCTION
It is well-known that substances cooled below their thermo-dynamic freezing point do not necessarily freeze, especiallywhen they are very pure. Homogeneous nucleation is a kinet-ically disfavoured process; according to classical nucleationtheory, a critical cluster must spontaneously form in the super-cooled liquid before crystallisation can proceed.1–3 The kineticbarrier, in the framework of classical nucleation theory, arisesfrom a competition between a favourable bulk free energy dif-ference between the phases and the unfavourable formation ofan interface between the phases. The presence of a free energybarrier to nucleation makes homogeneous nucleation a rareevent.
Homogeneous nucleation has been studied using computersimulations in a range of systems;3,4 however, the nucleationof ice, despite being of fundamental interest,5 is still prov-ing to be difficult to simulate successfully despite the appar-ent simplicity of the process. The crystallisation of ice hasbeen studied in a large number of simulations;6–41 neverthe-less, whereas several simulations of homogeneous nucleationusing the mW coarse-grained water model42 have been rea-sonably successful,23,29,30,36 all-atom simulations have beenless so. The mW potential is a good representation of thestructure and the thermodynamics of water; however, it has un-realistically fast dynamics and no representation of hydrogens,and so the use of an all-atom model would offer considerablefurther insight into the process. However, Matsumoto andco-workers’ single MD trajectory of TIP4P water nucleatinginto ice remains the only successful brute-force simulation ofhomogeneous ice nucleation with an all-atom model.9 Othersimulations have used small system sizes or looked at condi-tions that are not representative of homogeneous nucleationfrom the bulk liquid water. While brute-force simulations of a
a)Author for correspondence. Electronic mail: [email protected]
rare event are unlikely to be successful, the use of rare eventmethods can potentially allow us to compute free energy land-scapes for nucleation. Such calculations have recently beenattempted in the homogeneous ice nucleation simulations ofRadhakrishnan and Trout, who used umbrella sampling,11,12
and Quigley and Rodger, who used metadynamics.20 However,the use of global order parameters in driving homogeneous icenucleation can lead to non-physical nucleation pathways, aswe discuss below.
It is a surprising state of affairs that modern simulation meth-ods have so far not been able to capture the fundamental phys-ical behaviour of the homogeneous nucleation process of ice.Some of the outstanding problems are how to simulate thehomogeneous nucleation of ice using a local measure of order,and the determination of a free energy landscape using suchan order parameter. Here, we address one of these aspects:we develop some appropriate order parameters to allow us todrive the nucleation process and grow a single ice cluster usingall-atom models of water. We first examine order parametersused in nucleation studies in general (Section II) and then in-troduce the order parameters we use in all-atom water modelsimulations (Section III). We discuss the water potential andsimulations methods we used in Section IV, and we presentthe results of driving nucleation in Section V. Finally, we dis-cuss the outstanding problems that need to be overcome inorder to obtain a free energy landscape and nucleation rates inSection VI.
II. ORDER PARAMETERS IN NUCLEATION STUDIES
In order to monitor the process of nucleation, we requirea quantitative measure that can distinguish how far along theprocess is. The quantity describing this is usually known asan order parameter. The first step in deciding on an orderparameter is to classify particles as being solid-like or liquid-like in nature. In the nucleation literature, such classification
arX
iv:1
208.
6033
v2 [
cond
-mat
.sta
t-m
ech]
8 N
ov 2
012
2
is often based on the Steinhardt classification parameter43,44
ql(i) =
[4π
2l+1
+l
∑m=−l
|qlm(i)|2]1/2
, (1)
where
qlm(i) =1
Nneighs(i)
Nneighs(i)
∑j=1
Ylm(θij, ϕij
), (2)
Ylm(θij, ϕij
)are the spherical harmonics, θ and ϕ are the polar
angles measured in an arbitrary laboratory frame of referenceand Nneighs(i) is the number of neighbours of particle i.45 Itis important to note that all ql(i) are rotationally invariantregardless of the choice of l. There is no radial componentin this scheme; one can be introduced if necessary. However,a limited radial dependence arises through our definition ofneighbours. In nucleation studies, we are often hoping tocompare the environment about a particle to a symmetricalcrystalline system, and so we can simply pick the value of lthat best corresponds to the symmetry of the crystalline systemand compute the spherical harmonic expansion coefficientsfor only that l.43 It is both convenient and computationallyless expensive to replace the complex spherical harmonicswith their real analogues;36,46 we continue to denote complexconjugates in the following for generality, but they can bedropped if real spherical harmonics are used.
A. Global order parameters
In many studies, the local Steinhardt classification param-eters (Eq. (2)) are averaged across the system to give globalSteinhardt order parameters; these are typically expressed asthe magnitude of the vector sum of the local classification pa-rameters averaged over all N particles in the system, namely43
Ql =
4π
2l+1
+l
∑m=−l
∣∣∣∣∣ 1Ntot
N
∑i=1
Nneighs(i)qlm(i)
∣∣∣∣∣21/2
, (3)
where Ntot = ∑Ni=1 Nneighs(i). Although local classification
parameters ql are a good measure of the local order about aparticle, they are generally non-zero both in the solid phaseand in the liquid phase, as the liquid is often reasonably well-ordered, especially when considering only its first neighbourshell. However, the vectors add incoherently in the liquid phaseand the global order parameter Ql averages out to zero for largesystems, whilst it does not do so in the solid phase.44 As aresult, the increase in the magnitude of Ql can be used to trackhow solid-like a system is. Global order parameters of thistype have been used in two previous studies of homogeneousice nucleation.11,20 However, global order parameters are notideal in nucleation studies,44 particularly in studies where thesystem is not only tracked, but driven to increase the value ofa global order parameter.36
First of all, in nucleation studies, we often wish to performcalculations in such a way as to enable us to compare the results
to classical nucleation theory. To do this, we need to know thesize of the largest crystalline cluster, usually by knowing howmany particles there are in the cluster. However, with a globalorder parameter, we have no knowledge of what the size ofthe largest crystalline cluster is; indeed, the physical meaningof any particular value of a global order parameter is not onlysystem-size dependent, but physically hard to interpret, anda free energy landscape calculated as a function of a globalorder parameter does not have a clear physical interpretationin terms of nucleation.
Secondly, the interfacial free energy is in competition withthe more favourable entropy arising from a larger number ofsmaller clusters. It can be shown44 that this entropy can playa significant rôle in small systems that can be simulated oncomputers: in the early stages of nucleation, many small nucleiare always more favourable than one single nucleus comprisingthe same number of particles. There is, however, a crossoverto the expected behaviour once a certain nucleus size has beenpassed. This means that, when comparing results to classicalnucleation theory, a ‘global’ measure of crystallinity – whicheffectively induces an entropic break-up of small clusters – isinappropriate.44
Finally, we have suggested in our previous work36 that thepathways produced when the nucleation process is driven byglobal order parameters may be inconsistent with the naturalnucleation pathways (i.e. those pathways that would occur foran unbiassed system given sufficient time), particularly so inthe case of ice. Since there is no distinction between the liquidand the solid states of particles when global order parametersare used, driving the system to increase its global order param-eter can potentially induce an orientational coherence even inthe liquid state. This suggests that a particle is influenced notonly by its neighbours, but potentially by a crystalline clusterthat is very far removed from it, even though such a long-rangeinteraction has no basis in reality.36 Furthermore, when rareevent techniques are applied to a system, it is relatively easyto compensate for arbitrarily large free energy barriers; thereis a danger, therefore, that if the natural, lowest free energypathway is dynamically slow (having accounted for the free en-ergy barrier associated with the process itself), such a pathwaymay not be observed and a higher free energy pathway couldbe found instead provided that it is dynamically faster and itshigher free energy has been negated by a rare event method.We have previously also suggested that, for ice nucleation, theuse of global order parameters in driving nucleation may leadto precisely such high free energy pathways.36
B. Local order parameters
Even though the local Steinhardt classification parametersdefined above cannot distinguish between solid and liquid par-ticles on their own, there are a few approaches that allowus to do this without sacrificing their local nature. It is of-ten convenient to calculate the dot products of the individ-ual local classification parameters expressed in vector form,𝑞l(i), whose (2l+1) components are the Steinhardt parame-ters qlm(i) for m ∈ [−l, l]∩Z, with the equivalent vectors of aparticle’s neighbours.44 We calculate the rotationally invariantfunction dl(i, j) = 𝑞l (i) ·𝑞?l (j), where i and j are neighbours;
3
this dot product value ranges between −1 and +1. By plottingthe distribution of dl values for the liquid and the crystallinephases, a critical threshold dc can be determined as the firstpoint where the probability of being in the solid phase is non-zero.44 The number of crystalline connections is then definedas44
nconnections(i) =Nneighs(i)
∑j=1
H(dl(i, j)−dc), (4)
where H is the Heaviside step function. The number of con-nections should be higher in the solid phase than in the liquidphase, and a criterion involving a threshold minimum numberof connections to distinguish between the two phases is oftena good classification parameter.44,47
Another procedure involves calculating the neighbour-averaged contribution,48,49
〈qlm(i)〉=1
Nneighs(i)+1
Nneighs(i)
∑j=0
qlm(j), (5)
where j runs over all the neighbours of particle i, and includesthe particle itself (when j = 0). The average local bond classi-fication parameter is then given by
〈ql(i)〉=[
4π
2l+1
+l
∑m=−l
|〈qlm(i)〉|2]1/2
. (6)
In both approaches mentioned, the second neighbour shell iseffectively taken into account through the use of local Stein-hardt vectors of the first neighbour shell, either by averagingor by taking dot products.
Any two particles belong to the same crystalline cluster ifthey are both classified as being solid-like and are locatedwithin a certain fixed distance of one another (that is, theyare neighbours). Once all the particles have been classified,the size of the largest such cluster is normally calculated innucleation studies; this then acts as the overall (local) orderparameter.
It is very useful for an order parameter used in driving nu-cleation to be local in nature; however, that an order param-eter is local is not sufficient for it to be a valid metric usedfor driving the nucleation process. For example, in their icenucleation simulations,21,38 Brukhno and co-workers used amaximum director projection approach to yield local order pa-rameters. However, although these order parameters do permitthe growth of ice to be driven in a fixed orientation with re-spect to the simulation box, the rotational bias inherent in theprocedure induces a non-local and non-physical orientationalcoherence in the growing ice cluster; we suggest that, as aresult, this order parameter may not be suitable to study icenucleation.
More complex order parameters used to track largermolecule crystallisation have also been proposed,50 whilst anoverview of many simpler order parameters used in vapour-liquid nucleation was produced by Senger and co-workers.51
−1.0 −0.5 0.0 0.5 1.00
5
10
15
20
d3(i, j)
Prob
abili
tyde
nsity
liquidice Icice Ih
FIG. 1. A typical probability density distribution for all pairs ofd3(i, j) = 𝑞3(i) ·𝑞?3(j), where the centres of mass of molecules i andj are within 3.5 Å of each other. The three states depicted wereequilibrated at 200 K (using the TIP4P/2005 water model) and theice structures are not, therefore, ‘perfect’. This figure is analogous tothose in Refs 25, 36, and 52.
III. ORDER PARAMETERS FOR HOMOGENEOUS ICENUCLEATION
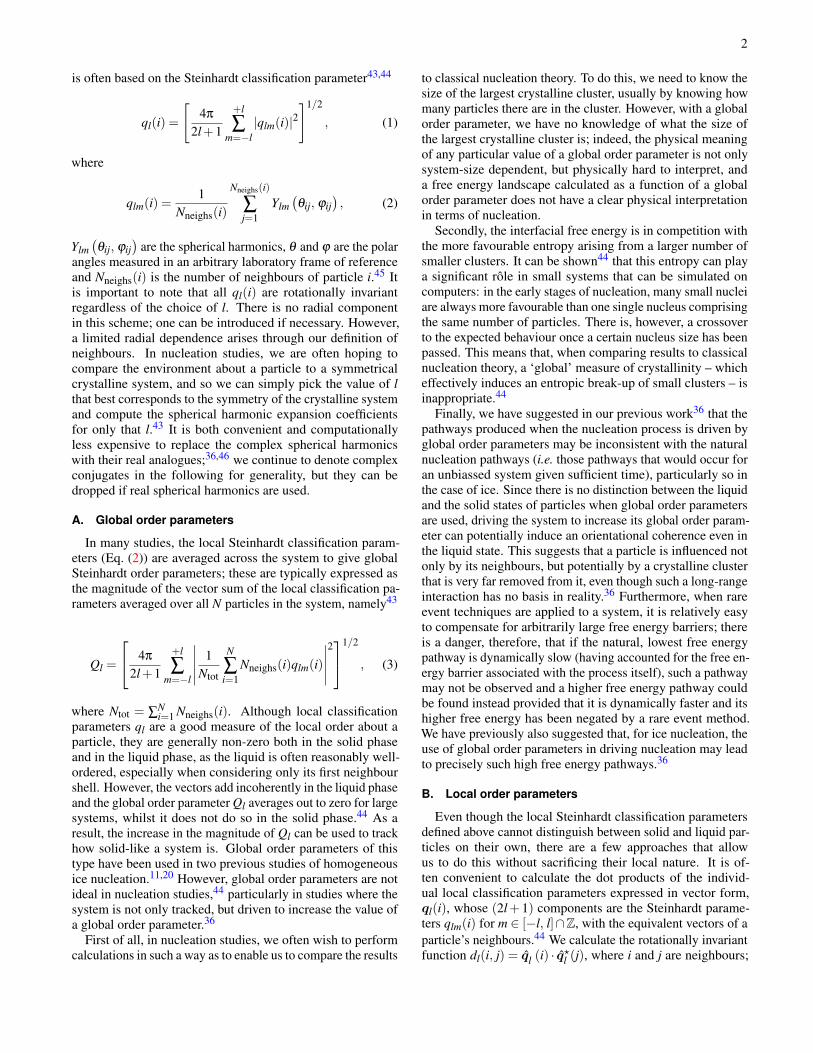
The choice of an order parameter to drive ice nucleation isnot trivial: as discussed above, it is preferable that it be local;it must be forgiving enough to be able to induce the growthof a small ice cluster; and it must be strict enough to ensurethat the structure grown is actually ice-like and has, ultimately,long-range order. In our simulations, we use a variation ofthe dot product approach described above that is commonlyused in studies of tetrahedral liquids.25,36,52,53 We choose touse l = 3, since the l = 3 spherical harmonics are the ones bestdescribing tetrahedrality. A plot of the distribution of d3(i, j) isshown in Fig. 1; to account for the eclipsed bond in hexagonalice, we define a classification parameter as
nconnections(i) =Nneighs(i)
∑j=1
Γ (d3(i, j)), (7)
where
Γ (x) =
{1 if [(x <−0.825)∨ (−0.23 < x < 0.01)],0 otherwise.
(8)These limiting values were chosen to encompass d3(i, j) re-gions (Fig. 1) where the probability density function for eitherice phase has a value greater than 0.1. We classify a moleculeas ice-like if nconnections ≥ 3 and as liquid-like otherwise. Thisgives perfect identification in both equilibrated cubic and equi-librated hexagonal ice. The order parameter we use to trackthe progress of nucleation is the size of the largest cluster ofmolecules classified as ice, where two molecules belong tothe same crystalline cluster if they are both ice-like and theircentres of mass are within 3.5 Å of each other.
Unfortunately, whilst this classification procedure (regard-less of the precise details of the parameterisation of the limitingvalues) works well for the mW potential,25,36 it does not do

4
FIG. 2. An example of non-ice-like chain growth in TIP4P/2005umbrella sampling simulations when using the order parameter with-out chain removal as described in the text. The system has 1000molecules at 240 K, starting from a 24-molecule cluster. Moleculesclassified as being part of the largest crystalline cluster are shown inred and violet; there are 45 molecules in this cluster. Molecules whosecentres of mass are within 3.5 Å are connected with lines. Moleculesshown in violet would be removed from the largest crystalline clusteron application of the chain removal algorithm described in the text.
so in all-atom models of water. When used in the form pre-sented above in umbrella sampling54 or forward flux samplingsimulations,55 natural fluctuations in the system often result inmolecules satisfying the order parameter even if they are notreally ice-like. When forced to grow with a biassing potential,‘chains’ form more easily than real ice grows, even thoughsuch chains actually represent an abuse of the order parameter,and ‘ice’ structures as depicted in Fig. 2 are commonplace.The real issue is not just that such chains form, but that whenthey do form, the system is not subsequently able to transformto the correct (compact) ice structure, and ice growth is ar-rested. For example, in forward flux sampling simulations, theprobability of reaching the next interface along the reactionco-ordinate rapidly approaches zero once the system exhibitspredominantly chains, and in umbrella sampling simulations,the system is frustrated so much that it fails to grow furthereven when using extremely large biassing potentials. This sug-gests that chain growth of this type is not a natural feature ofice nucleation.
Such chain growth can be observed with all variants of lo-cal order parameters we have tried. In order to alleviate theproblem of chain growth, we (a) classify any molecule withmore than four neighbours (within 3.5 Å) as being liquid, and(b) explicitly exclude molecules belonging to chains from thelargest crystalline cluster. We achieve the latter by removingany molecules with only one neighbour belonging to the largestcluster from the largest cluster, except if that single neighbouris connected to three further molecules in the largest cluster.This allows ‘chains’ comprising a single molecule to form andthus allows ice to grow. We iterate the procedure until nofurther molecule is removed.
Removing chains could be problematic in the initial stagesof nucleation: it is impossible for an ice structure smallerthan a single chair (or boat) not to be formed of chains, andsmall rings may form instead if forced. However, due to thesimilarity of liquid water and ice, it is possible to wait for a
0.2 0.4 0.6 0.8 1.0 1.20.2
0.4
0.6
0.8
〈q4〉(i)
〈 q6〉(i)
liquidice Icice Ih
FIG. 3. Neighbour-averaged order parameters for systems of ices Ihand Ic and liquid water. All systems were equilibrated at 200 K usingthe TIP4P/2005 water model, and they contain different numbers ofmolecules. The neighbour cutoff distance was 3.5 Å.
boat or chair cluster to form spontaneously in a simulation, andlimit umbrella sampling to systems with clusters larger than∼10 molecules. Doing so does not appear to be a significantlimitation when the critical cluster is expected to comprise over100 molecules.
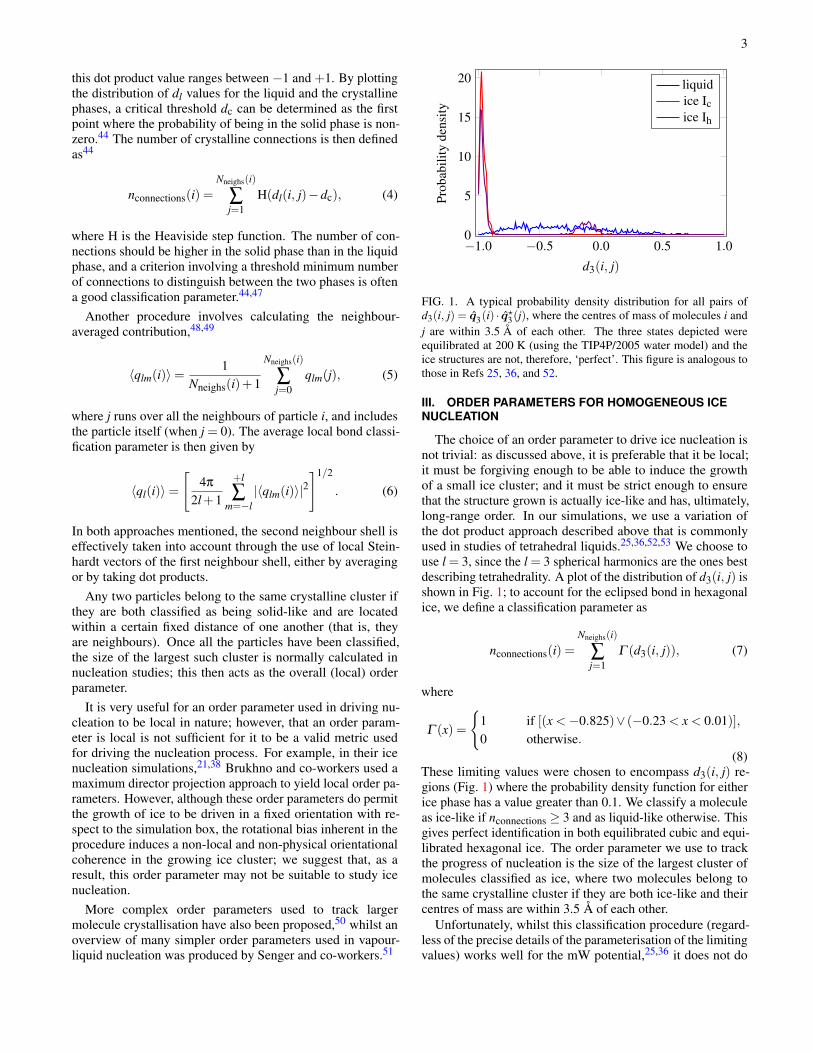
Although neighbour-averaged classification parameters areexcellent at distinguishing between the phases of systems with-out much structure in the liquid phase,48,56 it is less clearwhether the same applies to well-structured liquids like water.Using l = 4 and l = 6 (as depicted in Fig. 3) gives better sep-aration between the phases than does using l = 3. Liquid wa-ter and hexagonal ice are less well-separated in the 〈q4〉-〈q6〉plane than in the Lennard–Jones case; nonetheless, a choiceof 〈q6(i)〉 > 0.7 as an ice-liquid boundary would appear tobe reasonable. Calculating the size of the largest cluster withthis method results on average in only slightly smaller clusterscompared to those resulting from the dot product approach,and the formation of chains is as problematic as when usingthe latter. We have shown36 that for the mW monatomic modelof water,42 a dot product approach leads to a free energy profilethat is almost entirely consistent with classical nucleation the-ory. By contrast, including ‘surface’ molecules in the largestice cluster, as attempted in other studies with the same modelof water,30,57 appears to reduce the agreement with classicalnucleation theory.36 Lechner and co-workers have recentlyused a combination of dot product vectors and their neighbour-averaged classification parameters to study the rôle of the sur-face and the bulk terms when comparing simulation data toclassical nucleation theory for a soft-core colloid model.56,58
Using neighbour-averaged classification parameters reducesthe size of the critical cluster when compared to one calculatedusing a dot product approach in their work.56,58 The clusterswe have analysed with both approaches show only a smalldifference in cluster size; on average, the neighbour-averagedclusters are slightly smaller, but for individual configurations,the converse can also hold. Nonetheless, given that the numberof molecules classified as being part of the cluster by the dotproduct approach is itself a rather conservative estimate of thecluster size,36 and since it would be computationally extremely

5
expensive to perform two-dimensional umbrella sampling withan additional order parameter, we restrain ourselves, for thetime being, to using the dot product approach only. However,the neighbour-averaged approach is an attractive alternative,and ensuring that clusters are of essentially the same size withboth approaches is a useful confirmation that the exact detailsof the order parameter do not appear to change the outcomesignificantly.
IV. SIMULATION DETAILS
An empirical model that reproduces a large number of ex-perimental results at a reasonable computational cost is theTIP4P/2005 model,59 which seems to be the best of the ‘sim-ple’ all-atom models available at present, and is one that workswell across several phases60–62 and at large supercoolings.63
Although more complex models can, at a considerable com-putational expense, capture more of the underlying physicalbehaviour, their use, at least in their present state of devel-opment, does not necessarily result in a better description ofwater.64–68 In this work, we therefore use the TIP4P/2005model of water, as described in the original paper by Abascaland Vega,59 using the same parameters for cutoffs and Ewaldsummation.
To simulate the nucleation of ice, we use the MetropolisMonte Carlo (MC) approach69 in the isobaric-isothermal en-semble, coupled with umbrella sampling54 to drive the process.In umbrella sampling, an additional term dependent on the or-der parameter arises in the Boltzmann factor when consideringwhether to accept or reject a trial move; whilst this additionalenergy is often implemented as a quadratic bias potential,70 inour implementation, we use adaptive umbrella weights.71 Wetypically choose these weights to correspond roughly to thenegative of the free energy predicted by classical nucleationtheory for a given cluster size: the precise potentials we usedwere changed slightly as the simulations progressed.71
All-atom models of water have particularly slow dynamics,especially for crystal growth, making any possible improve-ment in computational speed worth considering. It has beenshown that ice crystal growth occurs more rapidly (in computertime) in molecular dynamics (MD) simulations than in corre-sponding Monte Carlo ones,15,72 which may suggest that thecollective motion possible in MD simulations helps to speedup the dynamics of cluster reorganisation, and thus aids us indriving crystallisation. The choice of MD simulations overMC simulations is therefore appealing; however, as we areultimately interested in the free energy landscape of ice nucle-ation, we wish to continue to use umbrella sampling and thusMonte Carlo simulations.
While the majority of simulations presented in this paperused the standard Monte Carlo method, we have recently begunto couple Monte Carlo with MD simulations in a hybrid MonteCarlo approach,73 where short MD simulations replace singleparticle rotational and translational Monte Carlo moves. Pro-vided that the MD integrator is time reversible and symplecticand that the choice of momenta from the Maxwell–Boltzmanndistribution is accounted for in the Metropolis acceptance cri-terion, detailed balance is obeyed73 irrespective of the fact thatthe MD hamiltonian does not incorporate an umbrella sam-
pling term. We implement the symplectic and time reversiblequaternion-based algorithm of Miller III and co-workers74,75
to simulate rigid body rotations.76,77 We are able to drive nucle-ation using both methods; however, simulations are consider-ably faster in real time when the hybrid Monte Carlo approachis used,78 which confirms the importance of collective motionfor nucleation.
V. NUCLEATION PATHWAYS
We have run umbrella sampling simulations in a variety ofsystems with TIP4P/2005 water. Typical simulations involvedbetween 1900 and 2500 water molecules and three distinctscenarios were considered: growth from a seed hexagonalice cluster, growth from a seed cubic ice cluster and growthdirectly from the supercooled liquid water.
The approach we used was to bias the umbrella samplingweights to favour larger clusters, although the weights cho-sen were only slightly overbiassed compared to the classicalnucleation theory prediction of the free energy barrier. If theumbrella weights bias the growth to be too quick, then thesystem can begin to grow defective crystal nuclei that cannotrepair themselves by shrinking and regrowing: the weightsmust be sufficiently small to allow clusters to grow and shrinkthroughout each umbrella sampling window.
Several snapshots of ice growth in such simulations aredepicted in Fig. 4. Provided that umbrella sampling does notattempt to drive the nucleation too quickly, the resulting iceclusters appear to be reasonable: for example, they do not spanthe simulation box and are compact. This suggests that theorder parameter presented above is a suitable order parameterboth to track and to drive the process of homogeneous icenucleation.
It is intriguing to note that it appears that in what we believeto be overbiassed driving of nucleation, cubic ice seeds seemto grow in a cubic fashion, and conversely, hexagonal ice seedsresult in the growth of hexagonal ice. Growth directly fromthe supercooled liquid is somewhat more tricky: because theorder parameter we use cannot track clusters smaller than 6molecules, and cannot readily track the growth of very smallclusters of ice, it was necessary to wait for small clusters toform spontaneously. These were then biassed to grow fur-ther, although with a very gentle set of umbrella weights, andonly when the growth became spontaneous with that set ofweights did we progress to higher umbrella sampling windows.Analogously to what we observed in mW simulations,36 icegrown directly from the supercooled liquid contains both cubicand hexagonal ice patterns, with cubic ones dominating, butless so than in the corresponding mW clusters: for example,60-molecule ice clusters in this work were classified to haveapproximately 70 % core cubic ice, whilst the mW analogueswere about 90 % cubic. Whether this is a result of a true dif-ference between the TIP4P/2005 and mW models of water orsimply a consequence of overbiassed non-equilibrated drivingin this work is unclear and warrants further investigation. Theice clusters observed in this work are roughly spherical, andthis sphericity follows the same trends as for the mW modelnucleation reported previously.36
Matsumoto and co-workers looked at some properties of the

6
(a) (b)
(c)
FIG. 4. Representative nucleation snapshots from umbrella sampling simulations of TIP4P/2005 water. In each case, two pictures depict thesame cluster from different perspectives; one within the liquid framework (in cyan) and one showing solely the largest crystalline cluster. Inthe former, spheres represent centres of mass of molecules classified as ice: red spheres correspond to cubic ice, orange spheres correspond tohexagonal ice and pink spheres correspond to ice molecules not within the largest crystalline cluster. Pictures representing solely the largestcluster depict both the oxygen (red) and the hydrogens (white) of each molecule. In (a), an 82-molecule ice cluster grown from the supercooledliquid at 240 K is shown; in (b), a 73-molecule ice cluster grown from a small cluster of Ih ice at 240 K is shown; and in (c), a series of iceclusters of increasing size (comprising 23, 60, 77, 107 and 145 molecules from left to right) grown from a small cluster of Ic ice at 200 K isdepicted. There are 1900 molecules in the system in (a) and the first three configurations of (c), and 2500 molecules in (b) and the last twoconfigurations of (c). Simulations of nucleation from a hexagonal seed (shown in (b)) were undertaken using the hybrid Monte Carlo approach,and the rest by a standard Metropolis Monte Carlo approach. p = 1 bar.
clusters they observed along the nucleation pathway of theirspontaneous MD nucleation trajectory.9 Their clusters com-prise molecules that are connected by a network of long-livedhydrogen bonds, and thus include the majority of the clustersurface. Nevertheless, non-compact clusters were observed notto lead to successful nucleation pathways, whereas the clustersassociated with nucleation were much more compact and ex-hibited only few chains (Fig. 4 of Ref. 9). We can compare thisbehaviour to what we observe in driven nucleation simulations.Although the order parameter we use to drive nucleation doesnot count molecules in chains as belonging to the largest crys-talline cluster, it does not, in principle, suppress such growth,and so if chain growth were a natural feature associated withnucleation, we might expect chains to grow nonetheless. Inorder to investigate whether chains are such a feature of the nu-cleation process or, as we suggested previously, an artefact ofthe order parameter coupled with slow dynamics of ice growth,we have calculated the numbers of molecules that are classifiedas belonging to chains along the nucleation pathway as drivenby the order parameter presented above. In fact, chains areusually present on the surface of the growing ice nuclei; how-ever, the absolute numbers are small: for example, in the set ofsimulations started from a hexagonal seed cluster, a cluster of
50 molecules has on average only 3.25 molecules belonging tochains, and such chains grow reasonably uniformly on all sidesof the crystalline cluster surface. Although certain configura-tions do exist with longer chains, chain growth does not seemto play a crucial rôle in ice nucleation as driven by our orderparameter, which is consistent with the behaviour observed inspontaneous nucleation by Matsumoto and co-workers.
Although we made no serious attempt to equilibrate the nu-cleation simulations, it may nevertheless be possible to gainphysical insight into the nucleation pathway from our simu-lations. In order to compare the pathway observed with thatreported in our simulations using the mW potential36 and withQuigley and Rodger’s simulation of TIP4P nucleation,20 wecalculate the Steinhardt-style Q6 and Chau–Hardwick-style79
tetrahedrality parameters as defined by Quigley and Rodger,20
including their smoothing function. These are given by
Ql =
4π
2l+1
+l
∑m=−l
∣∣∣∣∣ 14N
N
∑i=1
N
∑j6=i
f (rij)Ylm(θij, ϕij
)∣∣∣∣∣21/2
,
(9)where N is the number of particles and f (rij) is the smoothing
7
40 60 80 100 120 140
0.10
0.15
0.20
Size of largest cluster
Q6ζ
FIG. 5. The global order parameters Q6 and ζ calculated as a functionof the size of the largest crystalline cluster, the order parameter usedto drive nucleation in this work, for the system seeded with a cubicice nucleus. Error bars show the standard deviation for the populationof configurations at each cluster size. The results depicted here referto the 576 particles nearest the centre of mass of the ice nucleus.T = 200 K, p = 1 bar.
function, and
ζ =1
4N
N
∑i=1
N
∑j=1j 6=i
N
∑k>jk 6=i
f (rij)f (rik)(��ij · ��ik +1/3
)2, (10)
where ��ij is the unit vector from particle i to particle j. Thesmoothing function is defined as
f (r) =
1 if r ≤ 3.1 Å,(
cos (r/Å−3.1)π0.4 +1
)/2 if 3.1 Å < r ≤ 3.5 Å,
0 otherwise.(11)
We take into account the nearest 576 molecules from the centreof mass of the largest crystalline cluster as determined by thelocal order parameter defined above in order to ensure thatthese results can be compared to the previous work. The re-sulting diagram for the simulation of nucleation from a cubicice seed nucleus is depicted in Fig. 5. Although the curvesare rather noisy, as can be expected from a set of simulationsthat have not been equilibrated, and there are clear minor vari-ations in slope corresponding to different umbrella samplingwindows, we can nevertheless observe that the two order pa-rameters plotted change roughly linearly as the cluster sizeincreases. This linearity, which reflects the growth of an icenucleus into a largely unperturbed liquid, is consistent with thenucleation pathway we reported for the mW model of water,36
although the actual values of the global order parameters sug-gest that the system studied here is less well ordered than itsmW analogue. This is perhaps not surprising considering thatthe mW systems we studied previously were very well equili-brated. Importantly, the pathway is rather different from thatobserved in Q6-ζ space by Quigley and Rodger,20 as theirfree energy landscape involves an initial increase in the Q6 ori-entational order before the tetrahedrality parameter ζ begins
to change, which implies that the entire system, rather thanjust a crystalline nucleus, becomes more ordered prior to thenucleation event. Since the free energies associated with thenucleation pathway in Quigley and Rodger’s study are con-siderably higher than the ones implied by our (not completelyequilibrated) results, this adds further weight to our contentionthat global order parameters may locate pathways that are notfully consistent with the natural nucleation pathways. It mustbe emphasised that local order parameters do not necessar-ily result in more natural reaction co-ordinates; however, ifa pathway can be found that has a lower free energy barrierassociated with it, then such a pathway will be favoured overone that has a significantly higher free energy barrier.
VI. DISCUSSION AND CONCLUSIONS
We have introduced an order parameter that is capable oftracking and driving the homogeneous nucleation of ice withthe TIP4P/2005 water model. The order parameter is local innature and thus does not exhibit the anomalous behaviour as-sociated with global order parameters. We believe it to be thefirst rotationally invariant order parameter of this kind that iscapable of driving homogeneous ice nucleation in simulationsof an all-atom model of water. One of the major difficulties inthe development of such an order parameter is that the time thatis required to confirm whether an order parameter is fit for pur-pose is very significant, given that the dynamics at reasonablesupercoolings are so slow. In particular, it is important thatthe umbrella sampling weights not be increased too quicklyeven if it appears that no growth is forthcoming: one mustexercise a considerable degree of patience when performingsuch nucleation simulations.
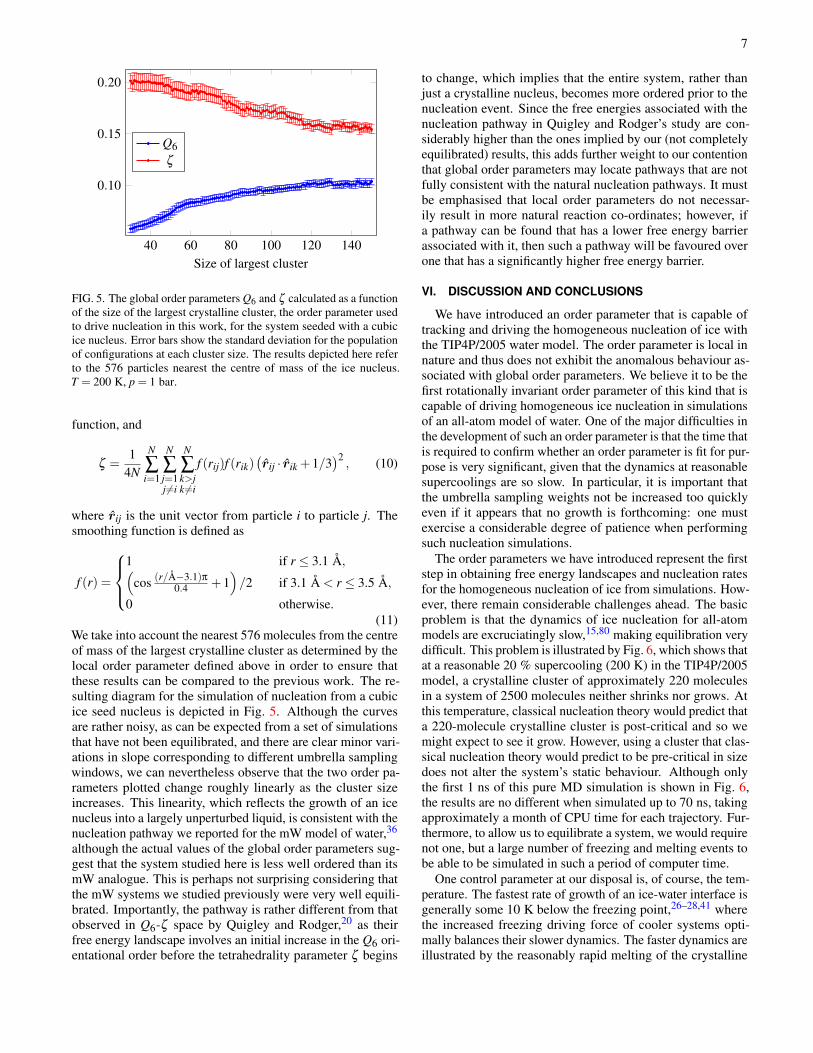
The order parameters we have introduced represent the firststep in obtaining free energy landscapes and nucleation ratesfor the homogeneous nucleation of ice from simulations. How-ever, there remain considerable challenges ahead. The basicproblem is that the dynamics of ice nucleation for all-atommodels are excruciatingly slow,15,80 making equilibration verydifficult. This problem is illustrated by Fig. 6, which shows thatat a reasonable 20 % supercooling (200 K) in the TIP4P/2005model, a crystalline cluster of approximately 220 moleculesin a system of 2500 molecules neither shrinks nor grows. Atthis temperature, classical nucleation theory would predict thata 220-molecule crystalline cluster is post-critical and so wemight expect to see it grow. However, using a cluster that clas-sical nucleation theory would predict to be pre-critical in sizedoes not alter the system’s static behaviour. Although onlythe first 1 ns of this pure MD simulation is shown in Fig. 6,the results are no different when simulated up to 70 ns, takingapproximately a month of CPU time for each trajectory. Fur-thermore, to allow us to equilibrate a system, we would requirenot one, but a large number of freezing and melting events tobe able to be simulated in such a period of computer time.
One control parameter at our disposal is, of course, the tem-perature. The fastest rate of growth of an ice-water interface isgenerally some 10 K below the freezing point,26–28,41 wherethe increased freezing driving force of cooler systems opti-mally balances their slower dynamics. The faster dynamics areillustrated by the reasonably rapid melting of the crystalline

8
0 200 400 600 800 10000
100
200
200K
240K
Time / ps
Size
ofla
rges
tclu
ster
FIG. 6. MD simulations of melting. The starting point is a crystallinecluster comprising approximately 220 molecules embedded in super-cooled liquid water. The curves exhibiting melting were simulatedat 240 K, whilst the remaining ones were simulated at 200 K. Thesesimulations entailed 2500 TIP4P/2005 water molecules. Note that themelting point of TIP4P/2005 ice is 252 K.61 p = 1 bar.
cluster at 240 K (∼5 % supercooling) as depicted in Fig. 6.One consideration that must be borne in mind when choos-ing a suitable temperature at which to perform simulations isthat the majority of experimental rates have been reported attemperatures corresponding to supercoolings of between 27 %and 10 %;81 these also encompass the atmospherically rele-vant conditions. While higher temperature simulations maybe easier to run in some ways due to the expedited dynamics,raising the temperature is not without its problems. For ex-ample, while we can negate the higher nucleation free energybarrier with umbrella sampling, it is not just the barrier height,but also the critical cluster size that increases with increasingtemperature. Increasing the temperature would thus require usto simulate considerably larger systems than are computation-ally affordable in order to avoid spurious finite size effects: forillustration, at 200 K, the critical cluster for TIP4P/2005 wateris predicted by classical nucleation theory to encompass 102
molecules, while at 240 K, this rises to 104 molecules.82,83 Wecould attempt to extrapolate the free energy barrier to lowertemperatures using histogram reweighting84 based on the re-sults of small cluster simulations at higher temperatures. How-ever, the calculation of nucleation rates requires the simulationof critical clusters, and so must be performed at sufficientlylow temperatures so that the critical cluster is small enough tobe feasible to simulate.
How does one, then, successfully simulate the homogeneousnucleation process and obtain a free energy landscape and nu-cleation rate? The simplest strategy is simply to wait for avery long time: however, given how computationally challeng-ing the process is, this may involve an inordinate amount ofcomputer time. A second approach is to use more efficientsimulation algorithms; indeed, as discussed above, the use ofthe hybrid Monte Carlo approach gives a significant advantageover standard Monte Carlo simulations in terms of simulationspeed. Other tricks of the trade that might be advantageousinclude the use of hamiltonian exchange85 to couple the sys-tem of interest to one that is dynamically faster, or the use
of reaction fields in place of the computationally expensiveEwald summation.86 Finally, the water potential we use is an-other parameter of the system that is under our control. It hasbeen suggested that there are few differences in the dynam-ics of ice melting of most common all-atom water models,87
and so a possible solution to the equilibration problem maybe to use a model of water that is not necessarily the best atdescribing most experimental properties, but one whose dy-namics are computationally faster; examples might includeTIP5P(-E)88,89 and the Nada–Van der Eerden potential.10,13
Even though such potentials may be computationally moredemanding than TIP4P-analogues on a per-step basis, the dy-namics of ice growth might nevertheless be faster.18
In conclusion, the development of a seemingly rigorousorder parameter may help us to advance our understanding ofice nucleation; in particular, we have further corroborated ourhypothesis that the difficulty in simulating ice nucleation inall-atom models such as TIP4P/2005 is more a result of theslow dynamics of the process rather than of an overwhelminglylarge free energy barrier. We hope that the order parameterwe have presented here represents a stepping stone towardsthe successful determination of a free energy landscape andnucleation rate for homogeneous ice nucleation for all-atomwater models.
ACKNOWLEDGMENTS
We should like to thank the Engineering and Physical Sci-ences Research Council and the Dirección General de In-vestigación Científica y Técnica (grants FIS2010-16159 andFIS2010-15502) for financial support.
REFERENCES
1A. Laaksonen, V. Talanquer, and D. W. Oxtoby, Annu. Rev. Phys. Chem.46, 489 (1995).
2S. Auer and D. Frenkel, Adv. Polym. Sci. 173, 149 (2005).3J. Anwar and D. Zahn, Angew. Chem., Int. Ed. 50, 1996 (2011).4R. P. Sear, Int. Mater. Rev. 57, 328 (2012).5D. E. Hagen, R. J. Anderson, and J. L. Kassner, J. Atmos. Sci. 38, 1236(1981); M. Toner, E. G. Cravalho, and M. Karel, J. Appl. Phys. 67, 1582(1990); D. W. Oxtoby, J. Phys.: Cond. Matt. 4, 7627 (1992); H. R. Prup-pacher, J. Atmos. Sci. 52, 1924 (1995); M. B. Baker, Science 276, 1072(1997); T. Koop, B. Luo, A. Tsias, and T. Peter, Nature 406, 611 (2000);K. E. Zachariassen and E. Kristiansen, Cryobiology 41, 257 (2000); P. G.Debenedetti, J. Phys.: Cond. Matt. 15, R1669 (2003); K. E. Zachariassen,E. Kristiansen, S. A. Pedersen, and H. T. Hammel, Cryobiology 48, 309(2004); S. Benz, K. Megahed, O. Möhler, H. Saathoff, R. Wagner, andU. Schurath, J. Photoch. Photobio. A 176, 208 (2005); D. A. Hegg andM. B. Baker, Rep. Prog. Phys. 72, 056801 (2009); P. Spichtinger and D. J.Cziczo, J. Geophys. Res. 115, D14208 (2010); G. John Morris, E. Acton,B. J. Murray, and F. Fonseca, Cryobiology 64, 71 (2012).
6I. M. Svishchev and P. G. Kusalik, Phys. Rev. Lett. 73, 975 (1994).7I. M. Svishchev and P. G. Kusalik, J. Am. Chem. Soc. 118, 649 (1996).8M. Yamada, S. Mossa, H. E. Stanley, and F. Sciortino, Phys. Rev. Lett. 88,195701 (2002).
9M. Matsumoto, S. Saito, and I. Ohmine, Nature 416, 409 (2002).10H. Nada and J. P. J. M. van der Eerden, J. Chem. Phys. 118, 7401 (2003).11R. Radhakrishnan and B. L. Trout, J. Am. Chem. Soc. 125, 7743 (2003).12R. Radhakrishnan and B. L. Trout, Phys. Rev. Lett. 90, 158301 (2003).13H. Nada and Y. Furukawa, J. Cryst. Growth 283, 242 (2005).14M. A. Carignano, P. B. Shepson, and I. Szleifer, Mol. Phys. 103, 2957
(2005).

9
15R. García Fernández, J. L. F. Abascal, and C. Vega, J. Chem. Phys. 124,144506 (2006).
16L. Vrbka and P. Jungwirth, J. Phys. Chem. B 110, 18126 (2006).17L. Vrbka and P. Jungwirth, J. Mol. Liq. 134, 64 (2007).18M. A. Carignano, J. Phys. Chem. C 111, 501 (2007).19S. Bauerecker, P. Ulbig, V. Buch, L. Vrbka, and P. Jungwirth, J. Phys.
Chem. C 112, 7631 (2008).20D. Quigley and P. M. Rodger, J. Chem. Phys. 128, 154518 (2008).21A. V. Brukhno, J. Anwar, R. Davidchack, and R. Handel, J. Phys.: Cond.
Matt. 20, 494243 (2008).22E. Pluharová, L. Vrbka, and P. Jungwirth, J. Phys. Chem. C 114, 7831
(2010).23E. B. Moore and V. Molinero, J. Chem. Phys. 132, 244504 (2010).24N. Kastelowitz, J. C. Johnston, and V. Molinero, J. Chem. Phys. 132, 124511
(2010).25E. B. Moore, E. de la Llave, K. Welke, D. A. Scherlis, and V. Molinero,
Phys. Chem. Chem. Phys. 12, 4124 (2010).26R. G. Pereyra, I. Szleifer, and M. A. Carignano, J. Chem. Phys. 135, 034508
(2011).27V. C. Weiss, M. Rullich, C. Köhler, and T. Frauenheim, J. Chem. Phys. 135,
034701 (2011).28D. Rozmanov and P. G. Kusalik, Phys. Chem. Chem. Phys. 13, 15501
(2011).29E. B. Moore and V. Molinero, Phys. Chem. Chem. Phys. 13, 20008 (2011).30T. Li, D. Donadio, G. Russo, and G. Galli, Phys. Chem. Chem. Phys. 13,
19807 (2011).31P. Pirzadeh, E. N. Beaudoin, and P. G. Kusalik, Chem. Phys. Lett. 517, 117
(2011).32P. Pirzadeh and P. G. Kusalik, J. Am. Chem. Soc. 133, 704 (2011).33E. González Solveyra, E. de la Llave, D. A. Scherlis, and V. Molinero,
J. Phys. Chem. B 115, 14196 (2011).34H. Nada, Cryst. Growth Des. 11, 3130 (2011).35J. Y. Yan and G. N. Patey, J. Phys. Chem. Lett. 2, 2555 (2011).36A. Reinhardt and J. P. K. Doye, J. Chem. Phys. 136, 054501 (2012).37J. C. Johnston and V. Molinero, J. Am. Chem. Soc. 134, 6650 (2012).38T. L. Malkin, B. J. Murray, A. V. Brukhno, J. Anwar, and C. G. Salzmann,
Proc. Natl. Acad. Sci. U.S.A. 109, 1041 (2012).39S. J. Cox, S. M. Kathmann, J. A. Purton, M. J. Gillan, and A. Michaelides,
Phys. Chem. Chem. Phys. 14, 7944 (2012).40J. Y. Yan and G. N. Patey, J. Phys. Chem. A 116, 7057 (2012).41D. Rozmanov and P. Kusalik, Phys. Chem. Chem. Phys. 14, 13010 (2012).42V. Molinero and E. B. Moore, J. Phys. Chem. B 113, 4008 (2009).43P. J. Steinhardt, D. R. Nelson, and M. Ronchetti, Phys. Rev. B 28, 784
(1983).44P.-R. ten Wolde, M. J. Ruiz-Montero, and D. Frenkel, Faraday Discuss. 104,
93 (1996).45Although we use the index variable j in all equations of this type to represent
neighbour identities, it should be understood to represent particle identitiesassociated with the neighbour number j. It would perhaps be formally morecorrect to refer to the j-th element of a neighbour list, but this would reducethe readability of many equations without any substantial informative value.
46M. A. Blanco, M. Flórez, and M. Bermejo, J. Mol. Struc.–Theochem. 419,19 (1997).
47J. Wedekind and D. Reguera, J. Chem. Phys. 127, 154516 (2007).48W. Lechner and C. Dellago, J. Chem. Phys. 129, 114707 (2008).49S. Jungblut and C. Dellago, J. Chem. Phys. 134, 104501 (2011).50E. E. Santiso and B. L. Trout, J. Chem. Phys. 134, 064109 (2011).51B. Senger, P. Schaaf, D. S. Corti, R. Bowles, J.-C. Voegel, and H. Reiss,
J. Chem. Phys. 110, 6421 (1999).52F. Romano, E. Sanz, and F. Sciortino, J. Chem. Phys. 134, 174502 (2011).53L. M. Ghiringhelli, C. Valeriani, E. J. Meijer, and D. Frenkel, Phys. Rev.
Lett. 99, 055702 (2007).54G. M. Torrie and J. P. Valleau, J. Comput. Phys. 23, 187 (1977).55R. J. Allen, D. Frenkel, and P. R. ten Wolde, J. Chem. Phys. 124, 024102
(2006).56W. Lechner, C. Dellago, and P. G. Bolhuis, Phys. Rev. Lett. 106, 085701
(2011).57E. B. Moore and V. Molinero, Nature 479, 506 (2011).58W. Lechner, C. Dellago, and P. G. Bolhuis, J. Chem. Phys. 135, 154110
(2011).
59J. L. F. Abascal and C. Vega, J. Chem. Phys. 123, 234505 (2005).60C. Vega, J. L. F. Abascal, M. M. Conde, and J. L. Aragones, Faraday
Discuss. 141, 251 (2009).61C. Vega and J. L. F. Abascal, Phys. Chem. Chem. Phys. 13, 19663 (2011).62P. T. Kiss and A. Baranyai, J. Chem. Phys. 134, 054106 (2011).63H. L. Pi, J. L. Aragones, C. Vega, E. G. Noya, J. L. Abascal, M. A. Gonzalez,
and C. McBride, Mol. Phys. 107, 365 (2009).64D. J. Huggins, J. Chem. Phys. 136, 064518 (2012).65I. Gladich and M. Roeselová, Phys. Chem. Chem. Phys. 14, 11371 (2012).66S. Habershon and D. E. Manolopoulos, Phys. Chem. Chem. Phys. 13, 19714
(2011).67I. G. Tironi, R. M. Brunne, and W. F. van Gunsteren, Chem. Phys. Lett. 250,
19 (1996).68M. A. González and J. L. F. Abascal, J. Chem. Phys. 135, 224516 (2011).69N. Metropolis, A. W. Rosenbluth, M. N. Rosenbluth, A. H. Teller, and
E. Teller, J. Chem. Phys. 21, 1087 (1953).70S. Auer and D. Frenkel, J. Chem. Phys. 120, 3015 (2004).71M. Mezei, J. Comput. Phys. 68, 237 (1987).72M. M. Conde, C. Vega, and A. Patrykiejew, J. Chem. Phys. 129, 014702
(2008).73S. Duane, A. D. Kennedy, B. J. Pendleton, and D. Roweth, Phys. Lett.
B 195, 216 (1987); D. W. Heermann, P. Nielaba, and M. Rovere, Com-put. Phys. Commun. 60, 311 (1990); B. Mehlig, D. W. Heermann, andB. M. Forrest, Phys. Rev. B 45, 679 (1992); A. Brass, B. J. Pendleton,Y. Chen, and B. Robson, Biopolymers 33, 1307 (1993); M. Tuckerman,Statistical mechanics: Theory and molecular simulation (Oxford UniversityPress, Oxford, 2010).
74T. F. Miller III, M. Eleftheriou, P. Pattnaik, A. Ndirango, D. Newns, andG. J. Martyna, J. Chem. Phys. 116, 8649 (2002).
75H. Kamberaj, R. J. Low, and M. P. Neal, J. Chem. Phys. 122, 224114 (2005).76We also initially tried to perform MD simulations of rigid bodies by first per-
forming a non-constrained move and then applying a constraints algorithm;however, we encountered significant difficulties doing so. While reasonablylong MD simulations using an analytic constraints algorithm77 result inthe correct behaviour, short MD simulations of only a few steps within ahybrid Monte Carlo scheme invariably led to a (catastrophic) decrease in thepotential energy of the system.
77S. Miyamoto and P. A. Kollman, J. Comput. Chem. 13, 952 (1992).78In our hybrid Monte Carlo simulations, we chose the MD timestep and the
number of MD steps per Monte Carlo step to result in an approximately40 % acceptance ratio. For example, at 240 K, we used an MD timestep of0.75 fs and 13 MD steps per MC step. A constant pressure is achieved byattempting an MC volume move on average once every four MC steps. As apoint of comparison, nucleation from a cubic ice seed in a standard MonteCarlo simulation took approximately six times longer than the growth froma hexagonal seed to similar final sizes in a hybrid Monte Carlo simulation.
79P.-L. Chau and A. J. Hardwick, Mol. Phys. 93, 511 (1998); J. R. Erringtonand P. G. Debenedetti, Nature 409, 318 (2001).
80D. Pan, L.-M. Liu, B. Slater, A. Michaelides, and E. Wang, ACS Nano 5,4562 (2011).
81J. E. McDonald, J. Meteorol. 10, 416 (1953); S. C. Mossop,P. Phys. Soc. Lond. B 68, 193 (1955); B. Mason, Adv. Phys. 7, 221 (1958);D. G. Thomas and L. A. K. Staveley, J. Chem. Soc. , 4569 (1952); G. R.Wood and A. G. Walton, J. Appl. Phys. 41, 3027 (1970); G. T. Butorin andV. P. Skripov, Sov. Phys. Crystallogr. 17, 322 (1972); R. W. Michelmore andF. Franks, Cryobiology 19, 163 (1982); P. Taborek, Phys. Rev. B 32, 5902(1985); V. Stoyanova, D. Kashchiev, and T. Kupenova, J. Aerosol Sci. 25,867 (1994); L. S. Bartell and J. Huang, J. Phys. Chem. 98, 7455 (1994);J. Huang and L. S. Bartell, J. Phys. Chem. 99, 3924 (1995); S. E. Wood,M. B. Baker, and B. D. Swanson, Rev. Sci. Instrum. 73, 3988 (2002); P. Ka-bath, P. Stöckel, A. Lindinger, and H. Baumgärtel, J. Mol. Liq. 125, 204(2006); B. J. Murray and A. K. Bertram, Phys. Chem. Chem. Phys. 8, 186(2006); J. F. Edd, K. J. Humphry, D. Irimia, D. A. Weitz, and M. Toner,Lab Chip 9, 1859 (2009); C. A. Stan, G. F. Schneider, S. S. Shevkoplyas,M. Hashimoto, M. Ibanescu, B. J. Wiley, and G. M. Whitesides, Lab Chip9, 2293 (2009); B. J. Murray, S. L. Broadley, T. W. Wilson, S. J. Bull,R. H. Wills, H. K. Christenson, and E. J. Murray, Phys. Chem. Chem. Phys.12, 10380 (2010); M. E. Earle, T. Kuhn, A. F. Khalizov, and J. J. Sloan,Atmos. Chem. Phys. 10, 7945 (2010); D. Rzesanke, J. Nadolny, D. Duft,R. Muller, A. Kiselev, and T. Leisner, Phys. Chem. Chem. Phys. 14, 9359
10
(2012); A. Manka, H. Pathak, S. Tanimura, J. Wölk, R. Strey, and B. E.Wyslouzil, Phys. Chem. Chem. Phys. 14, 4505 (2012).
82We use the enthalpy of melting, density and melting temperature resultssummarised by Vega and Abascal61 for the TIP4P/2005 model and the inter-facial free energy for the basal plane of TIP4P ice reported by Davidchackand co-workers83 to estimate the critical cluster sizes. We note that using theTIP4P value for the interfacial free energy is only a first approximation andmay not be very well suited to the TIP4P/2005 model of water. For exam-ple, the vapour-liquid surface tension is appreciably larger for TIP4P/2005than for the TIP4P model;61 determining whether the same applies to theice-liquid interfacial free energy would be an interesting study in its ownright.
83R. L. Davidchack, R. Handel, J. Anwar, and A. V. Brukhno, J. Chem. The-ory Comput. 8, 2383 (2012).
84A. M. Ferrenberg and R. H. Swendsen, Phys. Rev. Lett. 61, 2635 (1988).85H. Fukunishi, O. Watanabe, and S. Takada, J. Chem. Phys. 116, 9058
(2002).86P. H. Hünenberger and W. F. van Gunsteren, J. Chem. Phys. 108, 6117
(1998).87X. Wei, S. Xiao, and J. Ni, Mol. Sim. 36, 823 (2010).88M. W. Mahoney and W. L. Jorgensen, J. Chem. Phys. 112, 8910 (2000).89S. W. Rick, J. Chem. Phys. 122, 094504 (2005).