The Driving-Force Dependence of Electrochemical Rate Parameters
8
6128 J. Phys. Chem. 1984, 88, 6128-6135 The Driving-Force Dependence of Electrochemical Rate Parameters: Origins of Anodic-Cathodic Asymmetries for Metal-Aquo Redox Couples Joseph T. Hupp and Michael J. Weaver* Department of Chemistry, Purdue University, West Lafayette, Indiana 47907 (Received: April 30, 1984) The consequences of differences in the intramolecular force constants and the ionic entropies between the oxidized and reduced states of aquo redox couples upon their electrochemicalkinetics are examined as a function of the driving force. A generalized harmonic oscillator model is utilized that involves estimating the activation barrier from the individual force constants in the oxidized and reduced states rather than employing average (“reduced”) values. Noticeable asymmetry in the anodic and cathodic Tafel plots is predicted for redox couples having large (ca. twofold) differences in force constants, the plots being more curved at anodic overpotentials. The calculated plots are in reasonable agreement with experimental Tafel plots determined previously for Cr(OH2)63+/2+ and EU(OH~):+/~+ at the mercury-aqueous interface. Comparisonsare also presented between electrochemical “ideal” activation parameters determined for cr(oH&3+/2+as a function of anodic and cathodic overpotentials and the corresponding parameters calculated from structural and thermodynamic data. Substantially smaller activation enthalpies are observed for Cr(OH2)62+ oxidation than for Cr(OH2)63+ reduction; both are close to the theoretical predictions. The anodic activation enthalpies approach zero at moderate overpotentials even though the activation entropies remain large and negative. Parallels are also drawn with corresponding results and data interpretations of the driving-force dependencies for related homogeneous reactions. Introduction We have recently reported and discussed an anomalous driv- ing-force dependence of rate constants for the outer-sphere electrochemical reduction and oxidation involving metal(III/II) aquo couples of chromium, vanadium, and europium at the mercury-aqueous interface.’-2 The metal(II1) reductions exhibit linear variations of the logarithm of the work-corrected rate constant, k,,, with electrode potential (Le. Tafel plots) over the entire accessible range of overpotentials (ca. 300-600 mV, de- pending on the reaction).'^^ In contrast, the work-corrected Tafel plots for the corresponding metal(I1) oxidations in hexafluoro- phosphate or perchlorate electrolytes are sharply curved at moderate overpotentials, yielding variations of log k,,, with electrode potential at higher oxidation driving forces that are unexpectedly small’ in comparison with the predictions of the usual harmonic oscillator t r e a t m e ~ ~ t . ~ Similarly weak dependencies of the rate constants upon the thermodynamic driving force have been noted for a number of homogeneous bimolecular reactions involving oxidation of M(I1) aquo c~mplexes.*~~-~ The observed marked asymmetry of the anodic and cathodic Tafel plots contrasts the essentially symmetrical behavior predicted by the conventional theoretical relationships.’ We have speculated that the major source of this asymmetry is associated with major differences in the short-range solvent polarization between the oxidized and reduced aquo species, possibly associated with a rearrangement step either before or after electron transfer.’ However, the recent acquisition of reliable Raman spectral measurements for both M(II1) and M(I1) aquo complexesgalong with the emergence of new metal-ligand bond length datal0 has prompted us to reexamine this problem. Specifically, these data indicate that the force constants for the totally symmetric met- al-aquo stretching mode are expected to differ substantially (ca. (1) Tyma, P. D.; Weaver, M. J. J. Electroanal. Chem. Interfacial Elec- trochem: 1980, 111, 195. (2) Weaver, M. J.; Hupp, J. T. ACS Symp. Ser. 1982, No. 198, 181. (3) Weaver, M. J.; Anson, F. C. J. Phys. Chem. 1976, 80, 1861. (6 Marcus, R. A. J. Chem. Phys. 1965, 43, 679. (5) Chou. M.: Creutz, C.: Sutin, N. J. Am. Chem. SOC. 1977, 99, 5615. (6) Creutz, C. Inorg. Chem. 1978, 17, 1046. (7) Weaver, M. J.; Yee, E. L. Inorg. Chem. 1980, 19, 1936. (8) Balzani, V.; Scandola, F.; Orlandi, G.; Sabbatini, N.; Indelli, M. T. J. Am. Chem. SOC. 1981, 103, 3370. (9) (a) Best, S. P.; Beattie, J. K.; Armstrong, R. S. J. Chem. SOC., Dalton Trans., in press. (b) Jenkins, T. E.; Lewis, J. Specirochim. Acta, Part A 1981, 37A, 47. (10) Brunschwig, B. S.; Creutz, C.; MaCartney, D. H.; Sham, T. K.; Sutin, N. Faraday Discuss. Chem. SOC. 1982, No. 74, 113. twofold) between the oxidized and reduced forms for couples such as Cr(OH2)63+/2+ which feature large changes (-0.15-0.2 A) in the metal-ligand bond lengths, Aa. Such force constant dif- ferences will yield noticeably different free energy parabolas for the oxidized and reduced forms for these reactions since a large portion of the free energy barrier is associated with inner-shell (i.e. metal-ligand) reorganization. Such asymmetry in the free energy curves for individual redox couples will often cancel for homogeneous reactions, especially those involving a structurally similar pair of redox couples. However, it can in principle yield significantly asymmetric activation energy-driving force (and hence log kcor-potential) plots for electrochemical reactions at anodic and cathodic overpotentials! The extent of such asymmetry has been shown to be only minor at small over potential^.^ We have stated previously that this factor is much too small to account for the observed Tafel plot asymmetry.’ However, more detailed consideration of the inner-shell reaction energetics on the basis of the recent structural data leads us to revise this conclusion. The purpose of this article is to examine in quantitative terms the predicted influence of differing metal-ligand force constants on such driving-force dependencies and the degree to which the experimental data can be accounted for on this basis. In addition, the electrochemical activation parameters for Cr(OH2)63+/2+ and Eu(OH2);+I2+ have been evaluated over a wide range of anodic and cathodic overpotentials and are compared with the corre- sponding theoretical predictions. Besides providing a more com- plete description of the driving-force-dependentreaction energetics, such comparisons are of particular interest since the large (ca. 200 J deg-’ mol-’) differences in entropy between the oxidized and reduced aquo cations” yield very substantial differences in the redox thermodynamics at anodic and cathodic overpotentials.’ Finally, some commonalities are explored between the driving-force dependence of redox reactivities for electrochemical and homo- geneous processes. Driving-Force Dependence of Electrochemical Rate Constants Figures 1 and 2 contain experimental Tafel plots for Cr- (OH7)63+/2+ and Eu(OH2),9+i2+, respectively, over a range of anodic and cathodic overpotentials at the mercury-aqueous in- terface. These plots, which are taken from ref 1, are shown as solid curves. Similar data have also been obtained for V- (OH2)63+/2+, although over a somewhat smaller overpotential range.’ The dotted lines in Figures 1 and 2 are the Tafel plots (11) Yee, E. L.; Cave, R. J.; Guyer, K. L.; Tyma, P. D.; Weaver, M. J. J. Am. Chem. SOC. 1979, 101, 1131. 0022-3654/84/2088-6128$01.50/0 0 1984 American Chemical Society
Transcript of The Driving-Force Dependence of Electrochemical Rate Parameters
6128 J. Phys. Chem. 1984, 88, 6128-6135
The Driving-Force Dependence of Electrochemical Rate Parameters: Origins of Anodic-Cathodic Asymmetries for Metal-Aquo Redox Couples
Joseph T. Hupp and Michael J. Weaver*
Department of Chemistry, Purdue University, West Lafayette, Indiana 47907 (Received: April 30, 1984)
The consequences of differences in the intramolecular force constants and the ionic entropies between the oxidized and reduced states of aquo redox couples upon their electrochemical kinetics are examined as a function of the driving force. A generalized harmonic oscillator model is utilized that involves estimating the activation barrier from the individual force constants in the oxidized and reduced states rather than employing average (“reduced”) values. Noticeable asymmetry in the anodic and cathodic Tafel plots is predicted for redox couples having large (ca. twofold) differences in force constants, the plots being more curved at anodic overpotentials. The calculated plots are in reasonable agreement with experimental Tafel plots determined previously for Cr(OH2)63+/2+ and EU(OH~):+/~+ at the mercury-aqueous interface. Comparisons are also presented between electrochemical “ideal” activation parameters determined for cr(oH&3+/2+ as a function of anodic and cathodic overpotentials and the corresponding parameters calculated from structural and thermodynamic data. Substantially smaller activation enthalpies are observed for Cr(OH2)62+ oxidation than for Cr(OH2)63+ reduction; both are close to the theoretical predictions. The anodic activation enthalpies approach zero at moderate overpotentials even though the activation entropies remain large and negative. Parallels are also drawn with corresponding results and data interpretations of the driving-force dependencies for related homogeneous reactions.
Introduction We have recently reported and discussed an anomalous driv-
ing-force dependence of rate constants for the outer-sphere electrochemical reduction and oxidation involving metal(III/II) aquo couples of chromium, vanadium, and europium at the mercury-aqueous interface.’-2 The metal(II1) reductions exhibit linear variations of the logarithm of the work-corrected rate constant, k,,, with electrode potential (Le. Tafel plots) over the entire accessible range of overpotentials (ca. 300-600 mV, de- pending on the reaction).'^^ In contrast, the work-corrected Tafel plots for the corresponding metal(I1) oxidations in hexafluoro- phosphate or perchlorate electrolytes are sharply curved at moderate overpotentials, yielding variations of log k,,, with electrode potential a t higher oxidation driving forces that are unexpectedly small’ in comparison with the predictions of the usual harmonic oscillator t r e a t m e ~ ~ t . ~ Similarly weak dependencies of the rate constants upon the thermodynamic driving force have been noted for a number of homogeneous bimolecular reactions involving oxidation of M(I1) aquo c ~ m p l e x e s . * ~ ~ - ~
The observed marked asymmetry of the anodic and cathodic Tafel plots contrasts the essentially symmetrical behavior predicted by the conventional theoretical relationships.’ We have speculated that the major source of this asymmetry is associated with major differences in the short-range solvent polarization between the oxidized and reduced aquo species, possibly associated with a rearrangement step either before or after electron transfer.’ However, the recent acquisition of reliable Raman spectral measurements for both M(II1) and M(I1) aquo complexesg along with the emergence of new metal-ligand bond length datal0 has prompted us to reexamine this problem. Specifically, these data indicate that the force constants for the totally symmetric met- al-aquo stretching mode are expected to differ substantially (ca.
(1) Tyma, P. D.; Weaver, M. J. J . Electroanal. Chem. Interfacial Elec- trochem: 1980, 111, 195.
(2) Weaver, M. J.; Hupp, J. T. ACS Symp. Ser. 1982, No. 198, 181. (3) Weaver, M. J.; Anson, F. C. J . Phys. Chem. 1976, 80, 1861. (6 Marcus, R. A. J . Chem. Phys. 1965, 43, 679. ( 5 ) Chou. M.: Creutz, C.: Sutin, N. J . Am. Chem. SOC. 1977, 99, 5615. (6) Creutz, C. Inorg. Chem. 1978, 17, 1046. (7) Weaver, M. J.; Yee, E. L. Inorg. Chem. 1980, 19, 1936. (8) Balzani, V.; Scandola, F.; Orlandi, G.; Sabbatini, N.; Indelli, M. T. J.
Am. Chem. SOC. 1981, 103, 3370. (9) (a) Best, S. P.; Beattie, J. K.; Armstrong, R. S. J. Chem. SOC., Dalton
Trans., in press. (b) Jenkins, T. E.; Lewis, J. Specirochim. Acta, Part A 1981, 37A, 47.
(10) Brunschwig, B. S.; Creutz, C.; MaCartney, D. H.; Sham, T. K.; Sutin, N. Faraday Discuss. Chem. SOC. 1982, No. 74, 113.
twofold) between the oxidized and reduced forms for couples such as Cr(OH2)63+/2+ which feature large changes (-0.15-0.2 A) in the metal-ligand bond lengths, Aa. Such force constant dif- ferences will yield noticeably different free energy parabolas for the oxidized and reduced forms for these reactions since a large portion of the free energy barrier is associated with inner-shell (i.e. metal-ligand) reorganization. Such asymmetry in the free energy curves for individual redox couples will often cancel for homogeneous reactions, especially those involving a structurally similar pair of redox couples. However, it can in principle yield significantly asymmetric activation energy-driving force (and hence log kcor-potential) plots for electrochemical reactions at anodic and cathodic overpotentials! The extent of such asymmetry has been shown to be only minor a t small over potential^.^ We have stated previously that this factor is much too small to account for the observed Tafel plot asymmetry.’ However, more detailed consideration of the inner-shell reaction energetics on the basis of the recent structural data leads us to revise this conclusion.
The purpose of this article is to examine in quantitative terms the predicted influence of differing metal-ligand force constants on such driving-force dependencies and the degree to which the experimental data can be accounted for on this basis. In addition, the electrochemical activation parameters for Cr(OH2)63+/2+ and Eu(OH2);+I2+ have been evaluated over a wide range of anodic and cathodic overpotentials and are compared with the corre- sponding theoretical predictions. Besides providing a more com- plete description of the driving-force-dependent reaction energetics, such comparisons are of particular interest since the large (ca. 200 J deg-’ mol-’) differences in entropy between the oxidized and reduced aquo cations” yield very substantial differences in the redox thermodynamics at anodic and cathodic overpotentials.’ Finally, some commonalities are explored between the driving-force dependence of redox reactivities for electrochemical and homo- geneous processes.
Driving-Force Dependence of Electrochemical Rate Constants Figures 1 and 2 contain experimental Tafel plots for Cr-
(OH7)63+/2+ and Eu(OH2),9+i2+, respectively, over a range of anodic and cathodic overpotentials a t the mercury-aqueous in- terface. These plots, which are taken from ref 1, are shown as solid curves. Similar data have also been obtained for V- (OH2)63+/2+, although over a somewhat smaller overpotential range.’ The dotted lines in Figures 1 and 2 are the Tafel plots
(11) Yee, E. L.; Cave, R. J.; Guyer, K. L.; Tyma, P. D.; Weaver, M. J. J . Am. Chem. SOC. 1979, 101, 1131.
0022-3654/84/2088-6128$01.50/0 0 1984 American Chemical Society

Anodic-Cathodic Asymmetries for M-OH2 Redox Couples
-6
The Journal of Physical Chemistry, Vol. 88, No. 25, 1984 6129
- /Ef =-660mV I ,
Figure 1. Plots of the logarithm of the rate constant, log k , for Cr- (OH2):+ reduction and Cr(OH$+ oxidation at cathodic and anodic overpotentials, respectively, against the electrode potential, E . Solid curves are the experimental work-corrected Tafel plots at the mercury- aqueous interface, taken from ref 1 and 3. The dotted line is the anodic Tafel plot corresponding to a transfer coefficient of 0.50. (Experimental cathodic Tafel plot has a slope of 0.50.) Dashed lines are anodic and cathodic Tafel plots calculated by using individual force constants for Cri1'-OH2 and Cr"-OH2 bonds (see text for details). Dotted-dashed curves are corresponding calculated Tafel plots, but by assuming that the outer-shell reorganization energy equals zero.
that would be obtained for the same value of k,,, at the formal potential, Ef (Le. the "standard" rate constant E,,), if the transfer coefficient, am,, equals 0.5 throughout the entire overpotential range. The transfer coefficient is defined as
(1) where the plus-minus sign refers to anodic and cathodic rate constants, respectively. The strongly asymmetric nature of the experimental anodic and cathodic Tafel plots is clearly seen by comparison with the dotted straight lines.
The conventional expression for electrochemical rate constants as a function of the overpotentia14 can be written for one-electron reactions as
(2)
a,, = f (RT/F)(d In k,,/dE)
k,, = A exp([-XfF(E - Ef)I2/4XRT)
where the plus-minus sign again refers to anodic and cathodic rate constants, A is a preexponential factor, and X is the intrinsic reorganization energy. This last term is the free energy required to adjust the reactant nuclear coordinates so that they correspond to those of the product, but without electron transfer. The form of eq 2 clearly predicts symmetrical curved Tafel plots at anodic and cathodic overpotentials. This symmetry follows from the assumption contained in eq 2 that the force constants of the oxidized and reduced forms are equal; i.e., the reactant and product parabolas have identical shapes.
We and others have previously employed eq 2 (or equivalent relationships) for comparing the rate constant-overpotential de- pendence with the harmonic oscillator m ~ d e l . ' > ~ * ' ~ It is conven-
(12) For example: (a) Garreau, D.; Saveant, J. M.; Tessier, D. J . Phys. Chem. 1979, 83, 3003. (b) Corrigan, D. A.; Evans, D. H. J . Electroanal. Chem. Interfacial Electrochem. 1980, 106, 287,
-Ef= -625 rnV I ,
0 -200 -400 -600 -800 -IC E,mV vs s.c.e.
3
Figure 2. As Figure 1, but for E U ( O H ~ ) , ~ + / ~ + .
tional to determine X from the experimental standard rate constant via eq 2 and to reinsert this quantity into eq 2 to find the predicted overpotential dependence of log k,, which is compared with the experimental data.1,3J2 A somewhat different approach is used here whereby the predicted log kcor-overpotential dependences are obtained directly from calculated free-energy barriers derived from the known redox structural parameters. This latter procedure is now outlined.
The work-corrected rate constant can be expressed asI3 k,,, = KOv,r,KeI exp(-AG*/RT) (3)
where KO is the statistical part of the equilibrium constant for forming the precursor state from the bulk reactant, Y, is the nuclear frequency factor, rn is the nuclear tunneling factor, K , ~ is the electronic transmission coefficient, and AG* is the free energy of activation for the elementary electron-transfer step. Although the preexponential factors exert important influences upon the absolute magnitudes of k,,, the dependence of k , upon the driving force is expected to arise almost entirely from variations in AG*. For the present purpose, it is particularly convenient to formulate AG* in terms of intrinsic reorganization energies for the forward and reverse directions, Xf and A,, respectively, for the generalized reaction
Ox. + e- Red. (4) Provided that the free energy-reaction coordinate profiles are quadratic in nature, values of AG* as a function of the free energy driving force AGO (= fF(E - E,) ) can be obtained from the simultaneous solution to the following relations:I4
AG* = XfX2 (sa)
(13) Hupp, J. T.; Weaver, M. J. J . Electroanal. Chem. Interfacial Elec- trochem. 1983, 152, 1.
(14) Equations 5a and 5b define the intersection point of a pair of inter- secting parabolas with differing shapes (Figure 3) being displaced vertically by an amount equal to the driving force AGO. This treatment is most ap- propriate for calculating AG* for electrochemical reactions since the reactant and product parabolas refer to a single species rather than to homogeneous processes where a pair of reacting species are involved. Analogous consid- erations have also been made for proton-transfer processes. See: Koeppl, G. W.; Kresge, A. J. J . Chem. SOC., Chem. Commun. 1973, 371. Kresge, A. J . Chem. SOC. Reu. 1973, 2, 475.

6130
and
The Journal of Physical Chemistry, Vol. 88, No. 25, 1984
AfxZ = A,( 1 - a2 + AGO (5b) and X is a dimensionless parameter characterizing the nuclear coordinates of the transition stateI5 (see Figure 3). (For con- venience, quantities such as A , AG*, AGO, etc. refer here and below to the forward reaction, either cathodic or anodic, being considered even though the reduction process is commonly regarded as the "forward reaction", as in eq 4.) The combination of eq 3 and 5 yields the simplified symmetrical relation eq 2 only for the special case when Af = A, = A. However, when Af # A,, they instead predict nonsymmetrical log k,,-overpotential plots in the anodic and cathodic directions. The latter will clearly apply when the force constants differ in the oxidized and reduced forms.
The various components of eq 3 and 5 can be evaluated (or estimated) as follows. The forward and reverse reorganization energies for eq 4 can be separated into inner-shell (reactant bond distortional) and outer-shell (solvent reorganization) contributions according to
(6a)
(6b)
Xf = A:, + A,
A, = A& + A,, where Xi, and A[, are the inner-shell reorganization energies as- sociated with the reactant and product species, respectively.
These can be related to the corresponding force constant, fr, for symmetrical bond stretching (or compression) of the ith bond, and the change in bond distance between the oxidized and reduced forms by means of
where Ai, = 0.5CfiA?\a2 (7a)
fr = 4q;7#p (7b) where vi,, is the bond vibrational frequency, c is the velocity of light, and p is the reduced mass of the vibrator.
The outer-shell reorganization energy, A,, will be assumed to be equal in the oxidized and reduced forms (vide infra). It is conventionally given by4
Hupp and Weaver
where e is the electronic charge, N is Avogadro's number, r is the reactant radius, R is the distance from the reactant to its image in the metal surface, and cop and e, are the optical and static dielectric constants, respectively. For the present aquo reactants, r was taken as 3.25 and R as 13
Values of AG* for the Cr(OH2)63+/2+ couple were calculated as a function of overpotential from eq 5-8, with p taken as the mass of the aquo ligand, along with the experimental values VIII = 543 cm-', vII = 380 cm-',99'' and Aa = 0.20 A.'O This yields inner-shell reorganization energies, Ai8 and Ai,, equal to 223 and 1 10 kJ mol-', respectively, and overall reorganization energies, A, and A,, of 3 10 and 197 kJ mol-', respectively. The corresponding calculated values of k,, were obtained by combining the values of AG* with numerical estimates of the preexponential factors in eq 3. Details concerning the physical significance of these quantities are given el~ewhere. '~+'*,~~ The composite quantity K , ~ Q was taken as 0.5 A; similar values (within ca. twofold) are in- dicated from both experimental and theoretical lines of evidenceF0
(15) The parameters X (eq 5) and a (eq 1) provide two distinct descriptions of the transition-state symmetry: the former indicates the location of the transition state along the reaction coordinate associated with changes in nuclear configuration (Figure 3), whereas the latter describes the effective fractional ionic charge in the transition state. In the harmonic oscillator model, a and X are equal at all points if Af = A, (and are also equivalent to Marcus' -m parameter4). However, this is not the case for the reactions described here since Af # A,.
(16) Weaver, M. J. J. Phys. Chem. 1980, 84, 568. (17) Although the average symmetric Cr(I1)-0 stretching frequency in
Cr(OH,):* has not been measured directly, it is likely to be close to 380 cm-' on the basis of similar values for several divalent metal-aquo complexes."
(18) Hupp, J. T. Ph.D. Dissertation, Michigan State University, 1983. (19) Hupp, J. T.; Weaver, M. J., submitted for publication.
>
u 2 w
2
b
NUCLEAR REACTION COORDINATE
Figure 3. Schematic representation of forward and reverse reorganization energies, Xf and A,, for the case when the force constants for the product bonds are greater than for the reactant bonds. The nuclear reaction coordinate is given by the dimensionless parameter X in eq 5.
The nuclear tunneling factor I?, was obtained from the driving- force-dependent relationship of Holstein2' as expressed conven- iently by It is calculated to equal 3.4 at E = Ef and depends only slightly upon overpotential in the range of interest here. The nuclear frequency factor v, was determined as 1 .O X 10" s-l from the above stretching frequencies as described in ref 13.
The resulting calculated values of log k,, against ( E - .EF) for Cr(OH2)63+/2+ in both anodic and cathodic directions are plotted as dashed curves in Figure 1. The standard rate constant, kS,,,, obtained from theory is in almost exact agreement with the ex- perimental value, 3 X cm s-'. Given the uncertainties and assumptions involved in deriving the former (probably ca. f20- fold), this agreement is somewhat fortuitous. For convenience, the calculated and experimental values of k",, are set exactly equal in Figure 1 so to facilitate the comparison of the theoretical predictions for the driving-force dependence of k,,, with experi- ment.
The theoretical analysis for EU(OH,)?+/~+ cannot be performed on the same quantitative basis as for Cr(OH2)63+/2+ since ex- perimental data for vIII, vII, and Aa are unavailable. However, approximate calculations of the log kc,,-overpotential plots for this couple may still be carried out. From the experimental standard rate constant, k&, = 3 X cm s-I, together with the theoretical value of A,, assuming r = 3.5 A and R = 13 A (87 kJ mol-', eq 8) and noting that the reaction is likely to be nearly adiabatic ( K ~ , - 1),23 an intrinsic inner-shell barrier, AG*int (Le. AG* for AGO = 0), of ca. 30 kJ mol-' is inferred. Since the interaction of Eu(II1) and Eu(I1) with the aquo ligands is pre- dominantly electrostatic, the Eu-OH2 force constants should be approximately proportional to the ionic charge divided by the cation-aquo bond distance, a.24 Given that a is likely to be about 2 A and the difference in bond lengths between Eu(II1)-OH2 and Eu(I1)-OH, is around 0.22 A,33 from the above values of AG*,,, and A,, and utilizing e 5 for AGO = 0 along with eq 6 leads to
The overpotential dependence of log k,,, for Eu(OH2)2+/'+ predicted by these parameters is shown as dashed curves in Figure 2.
Comparison between the experimental and calculated Tafel plots for Cr(OH2)63+/2+ and E u ( O H ~ ) , ~ + / ~ + in Figures 1 and 2 reveals that the observed anodic-cathodic asymmetry is accounted
estimates of AT and Ai:d. % of 170 and 95 kJ mol-', respectively.
(20) Hupp, J. T.; Weaver, M. J. J. Phys. Chem. 1984, 88, 1463. (21) Holstein, T.; Sher, H. Philos. Mug., [Part] B. 1981, 44, 343. (22) Sutin, N. Prog. Inorg. Chem. 1983, 30, 441. (23) Yee, E. L.; Hupp, J. T.; Weaver, M. J. Inorg. Chem. 1983,22, 3465. (24) Bockris, J. O'M.; Reddy, A. K. N. "Modern Electrochemistry"; Ple-
num Press: New York, 1970; Vol. I , Chapter 2.

Anodic-Cathodic Asymmetries for M-OH2 Redox Couples The Journal of Physical Chemistry, Vol. 88, No. 25, 1984 6131
TABLE I: Dependence of Experimental and Calculated Transfer Coefficients for Cr(OH2)63t/3+ on Anodic As Compared to Cathodic Overwtentials
0 0.45 0.55 0.50 200 0.35 0.40 0.50 0.52 0.46 400 0.22 0.36 0.49 0.47 0.42 600 0.20 0.33 -0.48 0.43 0.38 800 -0.19 0.29 0.34
Anodic or cathodic overpotential. *Anodic experimental transfer coefficient corrected for work terms, at listed overpotentials (data from ref 1). Anodic transfer coefficient, calculated by using individual force constants for Cr"'-OH2 and Cr'I-OH, bonds as described in text. dCathodic experimental transfer coefficient corrected for work terms, at listed overpotentials (data from ref 3). eCathodic transfer coeffi- cient, calculated by using individual force constants for Cr"'-OH2 and Cr"-OH2 bonds as described in text. fAnodic or cathodic transfer coefficient calculated by assuming equal force constants in oxidized and reduced forms (eq 2).
for in part by the inclusion of large force constants for the oxidized compared to the reduced forms in the theoretical calculations. Thus, these ratios of inner-shell force constants, estimated to be 2.05 and ca. 1.8 for Cr(OH2)63t/2+ and EU(OH~):+/~', respec- tively, yield noticeably smaller slopes in the Tafel plots at anodic as compared to cathodic overpotentials. Even though the predicted Tafel plots at cathodic overpotentials do exhibit some curvature, these are nevertheless closely similar to the essentially linear experimental plots in Figures 1 and 2. At anodic overpotentials, the marked curvature in the experimental Tafel plots is roughly mimicked by the calculated plots, especially for Cr(OH2)62+ ox- idation.
A comparison between the experimental and calculated transfer coefficients for Cr(OH2)63+/2+, derived from the slopes of the curves in Figure 1 (eq l ) , is given in Table I. The calculated anodic and cathodic quantities, a&& and a:ald, respectively, were obtained from the dashed curves, i.e. by using individual force constants. Although the changes in atald and a&ld with varying overpotential are similar, the former are substantially larger a t a given overpotential, in harmony with the behavior of the cor- responding experimental quantities a",& and a",& (Table I). In contrast, the transfer coefficient, agL, calculated from the con- ventional treatment (eq 2) displays a symmetrical overpotential dependence, in marked disagreement with the observed behavior (Table I).I The values of a:, are nevertheless significantly smaller than ciaalcd at large anodic overpotentials; this is also evident from the deviations between the solid and dashed curves in Figure 1 .
These residual discrepancies between theory and experiment a t anodic overpotentials may be due to several causes. Most simply, the actual curvature in the experimental log k,,-E plots may be somewhat different from that shown in Figures 1 and 2 due to possible potential-dependent errors in the application of double-layer corrections to the observed rate constants. Although the extent of this uncertainty is not large (around ca. twofold in log k,,), it is greatest at the largest anodic overpotentials in view of the substantial anionic specific adsorption encountered even in hexafluorophosphate electrolytes.' However, it is more likely that the discrepancies are due largely to remaining inadequacies of the theoretical model. One possibility is that the metal-ligand vibrational modes are anharmonic. However, trial calculations using anharmonic Morse potentials in place of the harmonic oscillator model (eq 7) yielded almost imperceptible changes in the Tafel plots, a t least for the conditions encountered in Figure l.25 A more important factor, at least for Cr(OH2)63+/2+, is liable to reside in the above assumption that all the metal-ligand bonds are equivalent. A pair of trans chromium-oxygen bonds in Cr-
are expected to be weaker, and therefore have smaller force constants, than the other four due to Jahn-Teller distortion. Since these bonds are also especially elongated,1° they may well
contribute importantly to the inner-shell barrier, yielding a more pronounced curvature in the calculated anodic Tafel plot.
As noted above, we previously attributed the observed Tafel plot asymmetry chiefly to the influence of short-range solvent polari~ation.'-~ Although a large fraction of the asymmetry effect now appears to reside in the inner-shell barrier, the present analysis suggests a way in which the outer-shell reorganization can con- tribute as well. We assumed above that A,, is equal for the reduction and oxidation directions; Le., the outer-shell "force constant" is independent of the metal oxidation state. This follows from the simple dielectric continuum model used to estimate the outer-shell barrier. If reorganization of hydrogen-bonded out- er-shell water molecules contributes significantly to the free energy barrier, greater Tafel plot asymmetry should result since the effective force constants associated with such motions should also be larger in the higher oxidation state.3 However, quantitative calculations of such effects are precluded at present due to the incompleteness of molecular structural information for the sur- rounding solvent.
With regard to recent provocative discussion^,^^^^^ we stress that it is necessary to include the outer-shell solvent contribution to the reorganization barrier in order to obtain satisfactory agreement between the theoretical and experimental rate constants for Cr- (OH2)63+/2+. This is also the case for a variety of other homo- geneous and electrochemical reaction^.'^ To illustrate this point for Cr(OH2)63+/2+, Figure 1 also contains log kc,,-E plots cal- culated by ignoring the solvent contribution (dotted-dashed lines). Although exhibiting very similar dependences of log k,,, upon overpotential to that seen with the proper inclusion of the solvent reorganization component, the calculated values of log k,,, are substantially (ca. 104-fold) larger than the experimental values.
In view of the continuing interest and speculation concerning the virtues of Tafel plots for examining some fundamental aspects of electrochemical k i n e t i ~ s , ~ ~ . ~ ~ , ~ ~ it is worthwhile to note some more general implications of the foregoing. It is evident that the degree of curvature of the Tafel plots can be at least as sensitive to the degree of mismatch between the forward and reverse re- organization energies as to the absolute magnitude of these en- ergies and hence to the intrinsic barrier, AG*i,t, and to kt,,. It is therefore extremely dangerous to estimate intrinsic barriers from the curvature of Tafel Further, the Tafel plot shapes are not very diagnostic of the factors contributing to reactant activation, such as the role of solvent reorganization. A more valuable approach to examining such fundamental questions is to compare the absolute magnitudes of the calculated and ex- perimental rate constants under well-defined conditions19 rather than their dependence upon the thermodynamic driving force. Nevertheless, such Tafel comparisons do provide one means of evaluating more subtle driving-force-dependent effects with the aim of "fine tuning" theoretical formulations.
Driving-Force Dependence of Electrochemical Activation Parameters
Activation parameters clearly provide an additional measure of information on the reaction energetics beyond that yielded by rate measurements a t a single temperature. These parameters can be particularly revealing, for example, of the solvational changes accompanying transition-state formation for simple redox reactions.32 Two distinct types of activation parameters can usefully be distinguished for electrochemical reactions. The first type, the so-called "real" activation parameters, refers to the
(26) Khan, S. U. M. In "Modern Aspects of Electrochemistry"; Bockris, J. OM., Conway, R. E., White, R. E., Eds.; Plenum hess: New York, 1983; Vol. 15.
(27) Bockris, J. O'M.; Khan, S. U. M. J . Phys. &em. 1983, 87, 4012. (28) Bockris, J. OM.; Khan, S. U. M. "Quantum Electrochemistry";
Plenum Press: New York, 1979; Chapter 7. (29) Saveant, J.-M.; Tessier, D. Faraday Discuss. Chem. SOC. 1982, No.
74, 51. (30) Memming, R.; Mollers, F. Ber. Bunsenges. Phys. Chem. 1972, 76,
415. (31) Fukuzumi, S.; Wong, C. L.; Kochi, J. K. J . Am. Chem. SOC. 1980,
102, 2928. Klingx, R. J.; Kochi, J. K. J . Am. Chem. Soc. 1981, 103, 5839. (32) Weaver, J. M. J . Phys. Chem. 1979, 83, 1748. (25) Hupp, J. T., unpublished work.
6132 The Journal of Physical Chemistry, Vol. 88, No. 25, 1984 Hupp and Weaver
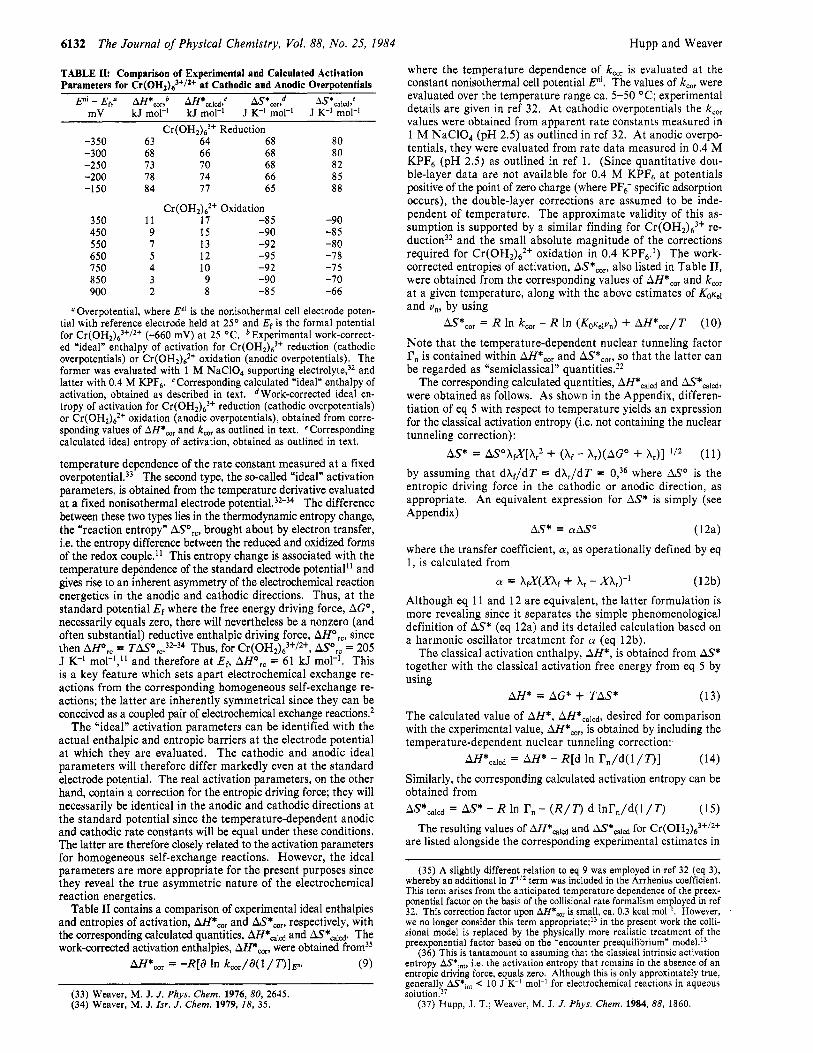
TABLE II: Comparison of Experimental and Calculated Activation Parameters for Cr(OH,L3’/*’ at Cathodic and Anodic Overmtentials
~ ~~~ ~~~
Cr(OH2):+ Reduction -350 63 64 68 -300 68 66 68 -250 73 70 68 -200 78 74 66 -1 50 84 77 65
350 11 17 -85 450 9 15 -90 550 I 13 -9 2 650 5 12 -9 5 750 4 10 -92 850 3 9 -90 900 2 8 -8 5
Cr(OH2)?’ Oxidation
80 80 82 85 88
-90 -8 5 -80 -7 8 -7 5 -70 -6 6
Overpotential, where Enl is the nonisothermal cell electrode poten- tial with reference electrode held at 25O and Ef is the formal potential for Cr(OH2)63t/2+ (-660 mV) at 25 “C. *Experimental work-correct- ed “ideal” enthalpy of activation for C T ( O H ~ ) ~ ~ ’ reduction (cathodic overpotentials) or Cr(OH2)tt oxidation (anodic overpotentials). The former was evaluated with 1 M NaC104 supporting ele~trolyte,~~ and latter with 0.4 M KPF6. CCorresponding calculated “ideal“ enthalpy of activation, obtained as described in text. Work-corrected ideal en- tropy of activation for reduction (cathodic overpotentials) or Cr(OH2);+ oxidation (anodic overpotentials), obtained from corre- sponding values of AH*,, and k,, as outlined in text. eCorresponding calculated ideal entropy of activation, obtained as outlined in text.
temperature dependence of the rate constant measured at a fixed ~verpotent ia l .~~ The second type, the so-called “ideal” activation parameters, is obtained from the temperature derivative evaluated at a fixed nonisothermal electrode p ~ t e n t i a l . ~ * - ~ ~ The difference between these two types lies in the thermodynamic entropy change, the “reaction entropy” ASo,,, brought about by electron transfer, i.e. the entropy difference between the reduced and oxidized forms of the redox couple.” This entropy change is associated with the temperature dependence of the standard electrode potential” and gives rise to an inherent asymmetry of the electrochemical reaction energetics in the anodic and cathodic directions. Thus, a t the standard potential Ef where the free energy driving force, AGO, necessarily equals zero, there will nevertheless be a nonzero (and often substantial) reductive enthalpic driving force, AH’,,, since then AHO, = TAS0rc.32-34 Thus, for Cr(OH2)63+/2+, AS”,, = 205 J K-I mol-’,” and therefore a t El, AHo,, = 61 kJ mol-’. This is a key feature which sets apart electrochemical exchange re- actions from the corresponding homogeneous self-exchange re- actions; the latter are inherently symmetrical since they can be conceived as a coupled pair of electrochemical exchange reactions.2
The “ideal” activation parameters can be identified with the actual enthalpic and entropic barriers a t the electrode potential at which they are evaluated. The cathodic and anodic ideal parameters will therefore differ markedly even at the standard electrode potential. The real activation parameters, on the other hand, contain a correction for the entropic driving force; they will necessarily be identical in the anodic and cathodic directions at the standard potential since the temperature-dependent anodic and cathodic rate constants will be equal under these conditions. The latter are therefore closely related to the activation parameters for homogeneous self-exchange reactions. However, the ideal
where the temperature dependence of, k,,, is evaluated at the constant nonisothermal cell potential Enl. The values of k,, were evaluated over the temperature range ca. 5-50 ‘C; experimental details are given in ref 32. At cathodic overpotentials the k,, values were obtained from apparent rate constants measured in 1 M NaClO, (pH 2.5) as outlined in ref 32. At anodic overpo- tentials, they were evaluated from rate data measured in 0.4 M KPF6 (pH 2.5) as outlined in ref 1. (Since quantitative dou- ble-layer data are not available for 0.4 M KPF6 at potentials positive of the point of zero charge (where PF6- specific adsorption occurs), the double-layer corrections are assumed to be inde- pendent of temperature. The approximate validity of this as- sumption is supported by a similar finding for re- d ~ c t i o n ~ ~ and the small absolute magnitude of the corrections required for Cr(OH2)62t oxidation in 0.4 KPF,.’) The work- corrected entropies of activation, AS*,,,, also listed in Table 11, were obtained from the corresponding values of AH*,,, and k,, at a given temperature, along with the above estimates of K ~ K , I and v,, by using
AS*cor = R In k,, - R In ( K O ~ , I ~ , , ) + AH*,,,/T (10) Note that the temperature-dependent nuclear tunneling factor I?, is contained within AH*,,, and AS*,,,, so that the latter can be regarded as “semiclassical” quantities.22
The corresponding calculated quantities, A P c a l d and AS*cald, were obtained as follows. As shown in the Appendix, differen- tiation of eq 5 with respect to temperature yields an expression for the classical activation entropy (i.e. not containing the nuclear tunneling correction):
AS* = ASoXfXIX: + (Xf - X,)(AG’ + A,)]-’/’ (11) by assuming that dXf/dT = dX,/dT = 0,36 where ASo is the entropic driving force in the cathodic or anodic direction, as appropriate. An equivalent expression for AS* is simply (see Appendix)
where the transfer coefficient, a, as operationally defined by eq 1, is calculated from
AS* = a A S 0 (1 2a)
a = XfX(XAf + A, - Xir)-’ (12b) Although eq 11 and 12 are equivalent, the latter formulation is more revealing since it separates the simple phenomenological definition of AS* (eq 12a) and its detailed calculation based on a harmonic oscillator treatment for 01 (eq 12b).
The classical activation enthalpy, AH*, is obtained from AS* together with the classical activation free energy from eq 5 by using
AH* = AG* + TAS* The calculated value of AH*, AH*calcd, desired for comparison with the experimental value, AH*,,,, is obtained by including the temperature-dependent nuclear tunneling correction:
Similarly, the corresponding calculated activation entropy can be obtained from AS*calcd = AS* - R In rn - ( R / T ) d lnI’,/d(l/T) (15)
The resulting values of and for Cr(OH2)63’/2C are listed alongside the corresponding experimental estimates in
(13)
AH*calcd = AH* - R[d In l?,,/d(l/n] (14)
parameteis are more appropriate for the present purposes since they reveal the true asymmetric nature of the electrochemical reaction energetics.
Table 11 contains a comparison of experimental ideal enthalpies and entropies of activation, AH*,, and AS*cor, respectively, with the corresponding calculated quantities, ma,d and AS*,ld, The work-corrected activation enthalpies, m,, were from35
(35) A slightly different relation to eq 9 was employed in ref 32 (eq 3), whereby an additional In TI/’ term was included in the Arrhenius coefficient. This term arises from the anticipated temperature dependence of the preex- ponential factor on the basis of the collisional rate formalism employed in ref 32. This correction factor upon m,, is small, ca. 0.3 kcal mol-I. However, we no longer consider this term appropriate;” in the present work the colli- sional model is replaced by the physically more realistic treatment of the preexponential factor based on the -encounter preequilibrium” m0de1.I~
(36) This is tantamount to assuming that the classical intrinsic activation i.e. the activation entropy that remains in the absence of an
entropic driving force, equals zero. Although this is only approximately true, generally < 10 J K-’ mol-’ for electrochemical reactions in aqueous sol~t ion.~’
(9) entropy AH*,,, = -R[d In kcor/d(l/ T ) I F ~
(33) Weaver, M. J. J. Phys. Chem. 1976, 80, 2645. (34) Weaver, M. J. Isr. J . Chem. 1979, 18, 3 5 . (37 ) Hupp, J . T.; Weaver, M. J . J . Phys. Chem. 1984, 88, 1860.

Anodic-Cathodic Asymmetries for M-OH2 Redox Couples The Journal of Physical Chemistry, Vol. 88, No. 25, 1984 6133
50
40
- '5 30- E -3 x
20- e 2
10-
-10-
-
-
O--
1 I
-400 -300 -200 -100 0 ' A G O , kJmol-'
Figure 4. Calculated free energy, enthalpic, and entropic barriers, AG*, AH*, and TM*, respectively, for C T ( O H ~ ) ~ ~ + electrooxidation as func- tion of free energy driving force, AGO (= -F(E - E f ) ) , by using eq 5, 6 , 8, 11, and 13 assuming that 2Xf = A,.
Table 11. The nuclear tunneling corrections to AH*calcd and AS*,ld range from ca. -3.5 to -10 kJ mol-' and -7 to -22 J K-' mol-', respectively, becoming more negative with increasing negative electrode potential.
Inspection of Table I1 reveals that the striking numerical differences in the calculated activation parameters for the anodic and cathodic directions brought about by the large reaction entropy for C T ( O H ~ ) ~ ~ + / ~ + is matched to a large degree by the experi- mental values. This agreement extends, albeit approximately, to the very small values of AH*,, and AH*calcd for C T ( O H ~ ) ~ ~ + oxidation at large anodic overpotentials and their mild overpo- tential dependence in comparison with that for re- duction at cathodic overpotentials. Similar calculations for Eu- (OH2)n3+/2+ are not feasible since the required quantitative structural data are unavailable for this couple. Nevertheless, the experimental values of AH*,, and AS*,, for EU(OH,) ,~+/~+ also display striking differences in the anodic and cathodic directions as a consequence of the large AS',, value (195 J K-' mol-' 11) for this couple. In addition, similarly small and even negative values of AH*,,, for Eu(OH2)>+ oxidation were obtained at anodic overpotentials (e.g. AH*,,, = -5 kJ mol a t E - Ef = 400 mV).
An apparently unexpected finding which we alluded to earlier' is the observation of near-zero activation enthalpies a t anodic overpotentials even though the activation entropies remain large and negative under these conditions (Table 11). Intuitively, one might expect the activation entropy to equal zero in the absence of an enthalpic barrier.' In order to examine this matter further, values of AG*calcd, AH*calcd, and As*calcd were calculated for C T ( O H ~ ) ~ ~ + oxidation over a considerable range of free energy driving forces, AGO, corresponding to a much greater span of anodic overpotentials than can be examined experimentally. The resulting plots of AG*,lcd, AH*calcd, and AS*,lcd against AGO are given in Figure 4. (Nuclear tunneling corrections were omitted . since these are small and the approximations inherent in their calculation become somewhat ambiguous for highly exoergonic reaction^.^^) Figure 4 indicates that AH*calcd decreases sharply
(38) Following current thinking," the magnitude of the nuclear tunneling correction will be maximized when the enthalpic, rather than the free energy, driving force is zero. However, the relevant driving force is that associated with the particular (inner or outer shell) mode being considered. Since the partitioning of either the enthalpic or the free energy driving force into inner- and outer-shell components is fraught with difficulties, the accurate prediction of the effective dependence of rn upon the cathodic and a n d i c overpotential is precluded a t present. Nevertheless, approximate calculations for Cr- (OH2)63+/2C indicate that r, depends only slightly on the overpotential in- creasing monotonically with increasing negative electrode potential over the range considered in Figure 1 (3.4 for E = Ef, 2.0 at E - Ef = 800 mV, and 4.0 a t E - El = -600 mV).
and even assumes small negative values a t substantially smaller driving forces than are necessary for AG*calcd to become zero. Indeed, AH*calcd attains a value of zero at two points, approxi- mately when AG" = --(Af + 2TAS") and when AGO = -Af, whereas AG*,ld and become zero only when AGO = -Af. The significance of negative activation enthalpies for related homogeneous reactions has been discussed by Marcus and ! S ~ t i n . ~ ~
A related feature of Figure 4 is the appearance of an enthalpic "inverted region", Le. a realm of increasing activation enthalpy with increasing exoergonicity within the "normal free energy region", i.e. where the activation free energy decreases with in- creasing driving force. It has been noted that the much-dbcussed free energy inverted regiona should be absent for electrochemical reactions at metal surface^.^^^^^ This is because oxidative dectron transfer to metal energy states above the Fermi level, or reductive electron transfer to metal energy states above the Fermi level, or reductive electron transfer from states below the Fermi level, will provide an activationless pathway even when -AGO exceeds Xf. However, the enthalpic inverted region should nevertheless be observable for electrochemical reactions. It would be interesting to explore this possibility experimentally by selecting reactions with sufficiently negative values of AS" so that the antiicipated enthalpic inverted region occurs a t sufficiently large values of AG*cor, corresponding to measurably slow reaction rates.
It should be noted that the anodic-cathodic driving-force asymmetry seen for the activation parameters has a different origin than that of the rate constants discussed above. Thus, purely symmetrical Tafel plots will be predicted provided that Af = A, irrespective of major differences in the entropic and en thalpic components of these reorganization energies.' Nevertheless, these two types of driving-force asymmetry are in a sense related since they both arise from equilibrium structural changes brought about by electron transfer. In addition, we have speculated that the especially small transfer coefficients observed at large anodic overpotentials (Figures 1 and 2) may be connected with the oc- currence of an enthalpically barrierless process (Le. AH*,,,, - 0) under these conditions.' Although the above analysis b,ased on force constant differences largely removes the need to invoke such "anomalous activation" mechanisms, such notions should none- theless not be wholly discarded at this point.
Parallel Reactivity Behavior for Homogeneous and Heterogeneous Processes
The foregoing demonstrates that the chief property of' simple electrochemical reactions which leads to unusual driving-force- dependent reactivities is their inherent chemical asymmetry. In this regard interfacial redox reactions have much in commlon with homogeneous cross-reactions between structurally diverse redox centers and in fact are more akin to these than to homo], xeneous self-exchange reactions. As an illustration, consider the V- (OH2)63+/2+ couple. The V(OH2),3+/2+ homogeneous self-ex- change reaction is a completely symmetrical process and is therefore necessarily isoenergetic as well as thermoneutral and isoentropic. In contrast, V(OH2)63+l2+ electrochemical exchange is characterized by net ASo and AH" values of -155 J K-' mol-l and -46 kJ mol-', respectively," for the oxidation reaction at the standard potential (Le. for AGO = 0). These thermodynamic changes are closely shared by the oxidation of V(OH,)62+ by C r ( b ~ y ) ~ ~ + in homogeneous aqueous solution (bpy = 2,2'-bi- pyridine), since the formal potentials of the reacting redox couples are virtually identical (-480 mV vs. S C E ' ' Z ~ ~ ) and AS",, for Cr(bpy)33+/2+ is close to zero (1 5 J K-' mol-' 43). (The values of AS" and AHo are deduced to be -140 J K-' mol-' and -41 kJ mol-', respectively.) It is not surprising, therefore, that cross- reactions between aquo and low-spin polypyridine complexes
(39) Marcus, R. A,; Sutin, N. Inorg. Chem. 1975, 14, 213. (40) For example, see: (a) Rehm, D.; Weller, A. Isr. J . Chem. 1970, 8,
259. (b) Creutz, C.; Sutin, N. J . Am. Chem. SOC. 1977, 99, 241. (c) Siders, P.; Marcus, R. A. J . A m . Chem. SOC. 1981, 103, 748.
(41) Marcus, R. A. J . Chem. Phys. 1965, 43, 2654. (42) Schmickler, W. Electrochim. Acta 1975, 20, 137. (43) Sahami, S.; Weaver, M. J. J . Electroanal. Chem. Interfacial Elec-
trochem. 1981, 122, 155.

6134
exhibit similarly "unusual" activation parameters to electro- chemical reactions involving the former reactant^.^ For example, the highly exoergonic oxidations of Fe(OH2)62+ by R ~ ( b p y ) ~ ~ + , R~(phen) ,~+, and F e ( ~ h e n ) ~ ~ + are characterized by small negative activation enthalpies and large negative activation It has been shown that the substantial negative entropic driving force for these reactions (ao = -175 J K-' mol-' 12) can account in broad terms for this kinetic behavior on the basis of the measured rate parameters for the parent self-exchange reactions.39
Moreover, comparably "anomalous" rate-driving force depen- dencies to those discussed here for electrochemical oxidations have also been observed for a number of homogeneous oxidations of aquo complexes.2 Analysis of the driving-force dependencies of homogeneous reactivity is complicated by the need to account for activation of the reducing, as well as oxidizing, redox center. Low-spin polypyridine complexes provide particularly useful co- reactants in this regard2 since the small entropic changes43 and intrinsic activation barriers4' that are characteristic of such couples enable the reaction energetics to be dominated by the other reklox center. In this respect such polypyridine reactants provide similar redox characteristics to metal surfaces. Although the "overpotential" provided by the former is fixed by its formal potential, driving-force dependencies can nevertheless be sc- rutinized by selecting a related series of polypyridine oxidants having a suitable range of formal potential^.^^
The dependence of homogeneous reactivities upon the driving force has often been d i s c ~ s s e d ~ , ~ - ~ , ~ ~ in terms of observed deviations from the "Marcus cross re la t io~ship"~
where
The Journal of Physical Chemistry, Vol. 88, No. 25, 198
k12 = (kllk22K12f)1/2 (16a)
Here k12 is the rate constant for a cross-reaction having an equilibrium constant K12 from the known self-exchange rate constants, kl l and k22, for the constituent redox couples. Since eq 16 is derived by assuming that the force constants for the oxidized and reduced forms of both reacting couples are progressively larger deviations from this relation are expected as the driving force is increased. When if < A, (as for aquo complex oxidations), the observed values of kI2 are expected to be pro- gressively smaller than those predicted from eq 16 as K12 in- c r e a s e ~ . ~ ~ Such considerations are entirely analogous to those considered above for electrochemical reactions. Thus, the sym- metrical Tafel relations obtained from the harmonic oscillator model with Af = A, (eq 12) can be derived from eq 16 by noting that a metal surface can be regarded formally as a coreactant with variable driving force and zero intrinsic barrier (i.e. having a "self-exchange rate constant" equal to the preexponential factor, A ) .
Chou et al. regarded the deviations from eq 16 due to unequal force constants as being too small to acqount for the observed discrepancies for a number of homogeneous cross-reactions, in- cluding several oxidations of aquo complexe~.~ Undoubtedly other factors, such as additional components of work terms, nonadia- b a t i ~ i t y , ~ , ~ , ~ ~ use of inappropriate self-exchange rate constant^,^^^^^ etc., also contribute importantly in many cases. Nevertheless, the above analysis clearly indicates that force constant differences can provide significant driving-force-dependent deviations from eq 2 and therefore from eq 16. Indeed, by employing the free energy form of eq 16, we have demonstrated that the observed driving-force-dependent deviations observed for homogeneous oxidations of aquo complexes are quantitatively consistent with the corresponding deviations for the electrooxidation reactions that are discussed here.2
(44) Sutin, N.; Gordon, B. M. J . Am. Chem. Soc. 1961, 83, 70. (45) Braddock, J. N.; Meyer, T. J. J. Am. Chem. SOC. 1973, 95, 3158. (46) Cramer, J. L.; Meyer, T. J. Inorg. Chem. 1974, 13, 1250. (47) Brown, G. M.; Sutin, N. J. Am. Chem. SOC. 1979, 101, 883. (48) Weaver, M. J.; Yee, E. L. Inorg. Chem. 1980, 19, 1936. (49) Newton, T. W. J . Chem. Educ. 1968, 45, 571. (SO) Endicott, J. F.; Durham, B.; Kumar, K. Inorg. Chem. 1982,21,2437. (51) Hupp, J. T.; Weaver, M. J. Inorg. Chem. 1983, 22, 2557.
4 Hupp and Weaver
The present analysis focuses attention on aquo redox couples since structural as well as extensive rate parameter-overpotential data are available for these systems. Nevertheless, such rate- driving force asymmetries should be observed for any redox couple with suitably large force constant differences between the oxidized and reduced forms, providing that inner-shell reorganization provides an important contribution to the activation barrier. These two factors will tend to occur together since it is anticipated that redox couples having such large force constant differences will also exhibit sizable bond length changes upon electron transfer and hence have large inner-shell barriers. Since such large structural changes commonly give rise to rapid irreversible chemical steps following electron transfer, the number of chem- ically reversible couples having the required properties may be relatively small. Nevertheless, the possible occurrence of such Tafel plot asymmetry, yielding otherwise unexpected Tafel line- arity or curvature, should be borne in mind when examining the electrochemical kinetics of reactions involving coupled chemical steps, including those involving proton transfer such as proton electroreduction.
Acknowledgment. We are indebted to Dr. J. K. Beattie for communicating his Raman spectral data for aquo complexes (ref 9a) prior to publication. This work is supported by the Air Force Office of Scientific Research.
Appendix. Equivalence of Eq 11 and 12 The free energy expression
AG* = X 2 A f (Sa)
AS* -2AfX dX/dT ('41)
may be differentiated with respect to temperature to yield
By solving eq 5, one obtains for X
X = {-A, + [A: + (A, - A,)(AGO + Ar)]1/2](Af - &)-I (A2) If one assumes that dA/dT = 0, differentiation of eq A2 yields
dX/dT = -)/zASo[A,Z + (A, - A,)(AGO + (A3)
Substitution of eq A3 into eq A1 yields
AS* = A S o x X f [ A , Z + (A, - &)(AGO + Ar)]-'l2 (1 1)
Rearranging eq A2, we find that
[A? + (Af - A,)(AGo + X(Af - A,) + A, (A4) and
[A; + (A, - A,)(AGo + = (xXf + A, - XA,)-' (A5) Incorporating this result into eq 1 1 yields
AS* = AS"AfX(XAf + A, - xX,)-'
dAGo/dX = 2(XAf + A, - Xxf)
('46)
('47)
dAG*/dX = 2XAf (A81
From eq 5b one can obtain (noting that dA/dX = 0)
From eq 5a one finds that
In view of eq A7 and A8, eq A6 may be rewritten as
AS* = ASo(dAG*/dX)(dAG0/dX)-' = A S o dAG*/dAGo
Noting that the transfer coefficient CY is defined as dAG*/dAGo, we recover the simple expression
('49)
A S * = aASo (12a) At first sight, eq 12a appears to be simply the entropic analogue
of the free energy expression AG* = AG*,,, + aAGo
where AG*int is the intrinsic free energy barrier, i.e. that which

J . Phys. Chem. 1984,88,6135-6139 6135
remains in the absence of the free energy driving force AGO. (Equation A10 is the most general form of the dependence of the activation barrier upon the driving force.) Indeed, the above assumption, dX/dT = 0, made in deriving eq 12a is equivalent to asserting that the intrinsic entropic barrier equals zero. However, a difference between the forms of eq 12a and A10 is that the transfer coefficient appearing in the former is the usual differential quantity, (Yd, defined in eq 1 or, equivalently, by a d = dAG*/dAGo, whereas that occurring in the latter is an integral
quantity defined by ai = (AG* - AG*h,)/AGo. Generally (Yd will differ from ai when the Tafel plots are curved, i.e. when (Y depends upon This distinction between the forms of eq 12a and A10 arises since the former can be obtained by taking the tem- perature derivative of the latter at a constant Galvani potential (Le. nonisothermal cell potential), whereupon dai /dT # 0.
Registry No. Cr(OH2):+, 14873-01-9; Cr(OH2),2+, 20574-26-9; mercury, 7439-97-6.
Aluminum-27 and Phosphorus-31 Nuclear Magnetic Resonance Studies of Aluminophosphate Molecular Sieves
C. S. Blackwell* and R. L. Patton Union Carbide Corporation, Tarrytown, New York (Received: May 4, 1984)
The 27Al NMR and NMR MAS spectra of four crystalline aluminophosphate molecular sieves, A1P04-5, A1P04-11, A1P04-17, and A1P04-3 1 were studied at 4.7 T and compared to some nonmicroporous materials, A1P04-quartz, metavariscite, and A1P04-tridymite. The molecular sieve spectra are generally consistent with their known framework structures constructed of alternating A104 and PO4 tetrahedra; however, the 27Al NMR chemical shift range was wide and asymmetrical lines and multiple peak maxima were observed. Both as-synthesized and calcined forms were examined and in one case (A1P04-17) adsorbed water reversibly resulted in a chemical shift into a region previously found from octahedral A1 in aluminophosphates and herein from metavariscite. High fields (9.4 T) and ('H-27Al) cross-polarization techniques helped assign the most unusual 27Al NMR chemical shifts to the result of secondary interactions of framework A1 with occluded template or H 2 0 within the micropores. Quadrupole effects are so severe in A1P04-quartz that even at 9.4 T a residual powder pattern persists under MAS conditions. All the 31P NMR MAS results are consistent with tetrahedral phosphorus.
Introduction Many previous researchers'" have shown that 27Al N M R
chemical shifts can be correlated with the coordination number of aluminum in A1-0 compounds. High-field NMR, made possible by superconducting magnets, can be used to increase chemical shift dispersion and reduce second-order quadrupole coupling effects. MAS (magic angle spinning) can further reduce second-order quadrupole effects (by a factor ca. 3) as well as often remove both CSA (chemical shift anisotropy) and dipole-dipole effects.
High-resolution 27Al N M R MAS spectra have been obtained for crystalline aluminum oxides,'q2 aluminosilicate^,^^^ alumino- silicate g lasse~ ,*~~ and nonmicroporous aluminophosphates.I0 We now report initial solid-state N M R studies of four members of the newly discovered family of synthetic, crystalline alumino- phosphate molecular sieves first reported by Wilson et al." Several of these microporous AlP04 frameworks are zeolite structural analogues, but most are novel and the crystal structure
(1) Muller, D.; Gessner, W.; Grimmer, A. R. Z . Chem. 1977, 17, 453. (2) Muller, D.; Gessner, W.; Behrens, H.-J.; Scheler, G. Chem. Phys. Lett.
(3) Mastikhin, V. M.; Krivorochko, 0. P.; Zolotovski, B. P.; Buyanov, R.
(4) Freude, D.; Behrens, H.-J. Cryst. Res. Technol. (1979-) 1981,16, K36. ( 5 ) Lampe, F. v.; Muller, D.; Gessner, W.; Grimmer, A.-R.; Scheler, G.
(6) de Jong, B. H. W. S.; Schramm, C. M.; Parziale, V. E. Geochim.
(7) Fyfe, C. A.; Gobbi, G. C.; Hartman, J. S.; Klinowski, J.; Thomas, J.
(8) Muller, D.; Hoebbel, D.; Gessner, W. Chem. Phys. Lett. 1981, 84, 25. (9) Hallas, E.; Haubenreisser, U.; Hahnert, M.; Muller, D. Glastech. Ber.,
1981, 79, 59.
A. React. Kinet. Catal. Lett. 1981, 18, 117.
Z . Anorg. Allg. Chem. 1982, 489, 16.
Cosmochim. Acta 1983, 47, 1223.
M. J. Phys. Chem. 1982, 86, 1247.
in Dress. (10) Muller, D.; Grunze, I.; Hallas, E.; Ludwig, G. Z . Anorg. Allg. Chem.
1983. 500. 80. (1'1) (a) Wilson, S. T.; Lok, B. M.; Messina, C. A.; Cannan, T. R.; Flan-
igen, E. M. J . Am. Chem. SOC. 1982,104, 1146. (b) Wilson, S. T.; Lok, B. M.; Messina, C. A.; Cannan, T. R.; Flanigen, E. M. In "Intrazeolite Chemistry"; American Chemical Society: Washington DC, 1983; ACS Symp. Ser. No. 218, p 79.
of one, A1P04-5, was described by Bennett et a1.'* The known structures can, like the zeolites, be described as three-dimensional tetrahedral framework oxides. The A1 and P atoms alternate, each surrounded by four framework oxygens to form Al(OP)4 or P- (OA1)4 linkages, respectively.
Experimental Section The N M R spectra were obtained on a Bruker CXP-200 sol-
id-statc and high-resolution N M R spectrometer operating at a field of 4.7 T with a standard 13C cross-polarization magic angle spinning (CP-MAS) accessory probe. Additional spectra were also taken on a Bruker AM-400 (9.4 T). The 31P NMR chemical shifts are referred to external H3P04 (85%) and the 27Al N M R chemical shifts are referred to external Al(H20)63' in A1(N03)3 aqueous sol~t ion. '~ Recalibration for magnet drift was done daily; changes of only a few hertz back and forth were observed. The chemical shift calibration is reproducible to less than 0.1 ppm, but when applied to samples is subject to bulk susceptibility effects. The Andrews-Beam single bearing rotors were made of Delrin and spun with dry nitrogen at approximately 3-4 kHz; extensive spinning sidebands could be seen when quadrupole effects were large. The magic angle was adjusted by maximizing the spinning sidebands15 for the 79Br NMR resonance of 79Br in KBr. A typical 3'P NMR spectrum was obtained from Bloch decay experiments of 20-1000 co-added fid's (free induction decays) produced by 4-w~ pulses followed by a 60-s relaxation delay. For 27Al N M R typically 500-1 000 Block decay fid's were accumulated by using
(12) Bennett, J. M.; Cohen, J. P.; Flanigen, E. M.; Pluth, J. J.; Smith, J. V. In "Intrazeolite Chemistry"; American Chemical Society: Washington, DC, ACS Symp. Ser. No. 218, p 109.
(1 3) Since aluminum chloride solutions can have very complex composi- tions due to hydroly~is,'~ we chose instead to use aqueous Al(NO&, reputed to remain unassociated, to generate a resonance for AI(H,O),'+ as our 0 ppm reference.
(14) Cotton, F. A.; Wilkinson, G. C. "Advanced Inorganic Chemistry"; Wiley-Interscience: New York, 1972; p 266.
(15) Frye, J. S.; Maciel, G. E. J . Magn. Reson. 1982, 48, 125.
0022-3654/84/2088-6135$01.50/0 0 1984 American Chemical Society