
Local Analysis of CO2 Chemisorption in a Rectangular ... · Hydrodynamics and reaction process...
9
Volume 7 • Issue 3 • 1000300 J Chem Eng Process Technol ISSN: 2157-7048 JCEPT, an open access journal Research Article Open Access Hlawitschka et al., J Chem Eng Process Technol 2016, 7:3 DOI: 10.4172/2157-7048.1000300 Research Article Open Access *Corresponding author: Hlawitschka MW, Chair of Separation Science and Technology, TU Kaiserslautern, PO Box 3049, Germany, E-mail: [email protected] Received June 28, 2016; Accepted July 07, 2016; Published July 17, 2016 Citation: Hlawitschka MW, Drefenstedt S, Bart HJ (2016) Local Analysis of CO 2 Chemisorption in a Rectangular Bubble Column Using a Multiphase Euler-Euler CFD Code. J Chem Eng Process Technol 7: 300. doi:10.4172/2157-7048.1000300 Copyright: © 2016 Hlawitschka MW, et al. This is an open-access article distributed under the terms of the Creative Commons Attribution License, which permits unrestricted use, distribution, and reproduction in any medium, provided the original author and source are credited. Local Analysis of CO 2 Chemisorption in a Rectangular Bubble Column Using a Multiphase Euler-Euler CFD Code Hlawitschka MW*, Drefenstedt S and Bart HJ Chair of Separation Science and Technology, TU Kaiserslautern, PO Box 3049, Germany Abstract Hydrodynamics and reaction process phenomena in bubble column reactors are complex and intrinsic interlinked and not fully understood. To obtain a better understanding, for the first time, a multiphase Euler-Euler solver is developed and validated to experimental data for the absorption of carbon dioxide in water offering the possibility of detailed temporal local and spatial analysis. The open source CFD tool OpenFOAM® with the multiphase solver multiphase Euler Foam is extended: (i) an absorption model was implemented, enabling absorption from different bubble size or phases to the liquid (ii) a chemical reaction model accounts for any number of reactions. The extensions were validated based on literature data and own experimental results at higher pH-value. The simulation results show a satisfactory agreement to experimental and simulative data from literature as well as to own experiments concerning bubble velocity, concentrations and pH profiles. Keywords: CFD simulation; Bubble column; Chemisorption; Absorption; Reactive flow; Euler-Euler; Multiphase CFD Introduction Reactive bubble columns are widely used in chemical, petrochemical, biochemical industries [1]. Different intrinsic interlinked phenomena such as hydrodynamics, absorption, reactions, coalescence and break-up of bubbles are involved and make predictions and scale-up difficult. Due to the complexity of the hydrodynamics and its mutual dependency on chemical species transport (reactions, interfacial mass transfer), the industrial approach to handle such systems is very oſten dependent on a ‘rule of thumb’ basis. e problem is either to neglect local flow phenomena near stirrers and dead zones (integral approach) or not to account for the poly-dispersity of the bubble swarm (pseudo-homogeneity) [2]. State of the art models, such as axial dispersion models, are still based on an integral description of the time-dependent hydrodynamics (one axial dispersion coefficient accounts for all non-idealities), mass transfer (integral mass transfer coefficient constant over the column height) and an integral bubble size (such as the constant mean Sauter diameter, d 32 ). Hence, these models are developed for a specific reactor geometry and chemical system and thus limited in predictability. Computational fluid dynamics (CFD) simulations can exactly predict local hydrodynamics considering any changes in apparatus geometry. In addition, population balance equations became a frequently applied tool to describe the changing bubble size distribution due to break-up and coalescence, while the bottleneck is still the predictability of coalescence and break-up kernels. However, recent research indicated a good agreement when coupling simulations with mass transfer models. Concerning reactive mass transfer, Fleischer et al. [3] used a one- dimensional two-phase simulation combined with population balance simulation to describe the chemisorption of carbon dioxide into an aqueous solution of sodium hydroxide. e simulations reveal a high sensitivity against small variations in hydrodynamic, mass transfer, and kinetic parameters. Márquez et al. [4] developed a model for the simulation of hydrodynamics and an irreversible chemical reaction in a gas-liſt reactor. A solver capable of calculating compressible two-phase bubbly flows with chemisorption has been introduced by Shimada et al. [5] and the simulations were compared to experimental data of Fleischer et al. [3]. While a good fit was found for the pH-profile, the used geometrical design of the column was different to the experimental data. Cachaza et al. [6] developed a transient Eulerian-Eulerian model for hydrodynamics and mass transfer in rectangular bubble columns but chemical reactions were not included. Rigopoulos [7] introduced a hybrid approach for coupling turbulent mixing and chemical reaction. e mixing of phases is estimated by averaging flow and concentration profiles from preliminary CFD flow field calculations and a numerical tracer experiment. e validation was against data of carbon dioxide absorption into an alkali solution. Darmana et al. [8] used an Eulerian- Lagrangian approach to model hydrodynamics, mass transfer and chemical reactions for two-phase flows. e chemisorption process of carbon dioxide in an aqueous solution of sodium hydroxide and the resulting reversible reactions were simulated in a bubble column reactor. A Lagrangian model enables an exact consideration of dispersed bubbles. However, it is not suitable for higher dispersed phase fractions and in general, this type of approach leads to a higher computational effort compared to an Eulerian one. In this study reaction algorithm are combined with a multiphase Euler-Euler CFD code based on the open source toolbox OpenFOAM®. To our knowledge, it is the first coupling of a CFD multi-phase model with reaction kinetic models to simulate the reactive mass transfer, while the coupling with population balances is presented elsewhere [9]. e resulting solver is capable of computing one liquid bulk phase and any amount of gaseous phase fractions in 3-D simulations. e model will be described in the next section, followed by a validation against literature test cases and own experimental data derived in a rectangular bubble column. Experimental eory e multi-fluid model is based on general conservation equations such as the conservation of volume and conservation of momentum for each phase. e continuity equation for the liquid phase l is given by: Journal of Chemical Engineering & Process Technology J o u r n a l o f C h e m i c a l E n g i n e e r i n g & P r o c e s s T e c h n o l o g y ISSN: 2157-7048
Transcript of Local Analysis of CO2 Chemisorption in a Rectangular ... · Hydrodynamics and reaction process...

Volume 7 • Issue 3 • 1000300J Chem Eng Process Technol ISSN: 2157-7048 JCEPT, an open access journal
Research Article Open Access
Hlawitschka et al., J Chem Eng Process Technol 2016, 7:3 DOI: 10.4172/2157-7048.1000300
Research Article Open Access
*Corresponding author: Hlawitschka MW, Chair of Separation Science and Technology,TU Kaiserslautern, PO Box 3049, Germany, E-mail: [email protected]
Received June 28, 2016; Accepted July 07, 2016; Published July 17, 2016
Citation: Hlawitschka MW, Drefenstedt S, Bart HJ (2016) Local Analysis of CO2 Chemisorption in a Rectangular Bubble Column Using a Multiphase Euler-Euler CFD Code. J Chem Eng Process Technol 7: 300. doi:10.4172/2157-7048.1000300
Copyright: © 2016 Hlawitschka MW, et al. This is an open-access article distributed under the terms of the Creative Commons Attribution License, which permits unrestricted use, distribution, and reproduction in any medium, provided the original author and source are credited.
Local Analysis of CO2 Chemisorption in a Rectangular Bubble Column Using a Multiphase Euler-Euler CFD CodeHlawitschka MW*, Drefenstedt S and Bart HJChair of Separation Science and Technology, TU Kaiserslautern, PO Box 3049, Germany
AbstractHydrodynamics and reaction process phenomena in bubble column reactors are complex and intrinsic interlinked
and not fully understood. To obtain a better understanding, for the first time, a multiphase Euler-Euler solver is developed and validated to experimental data for the absorption of carbon dioxide in water offering the possibility of detailed temporal local and spatial analysis. The open source CFD tool OpenFOAM® with the multiphase solver multiphase Euler Foam is extended: (i) an absorption model was implemented, enabling absorption from different bubble size or phases to the liquid (ii) a chemical reaction model accounts for any number of reactions. The extensions were validated based on literature data and own experimental results at higher pH-value. The simulation results show a satisfactory agreement to experimental and simulative data from literature as well as to own experiments concerning bubble velocity, concentrations and pH profiles.
Keywords: CFD simulation; Bubble column; Chemisorption;Absorption; Reactive flow; Euler-Euler; Multiphase CFD
IntroductionReactive bubble columns are widely used in chemical, petrochemical,
biochemical industries [1]. Different intrinsic interlinked phenomena such as hydrodynamics, absorption, reactions, coalescence and break-up of bubbles are involved and make predictions and scale-up difficult. Due to the complexity of the hydrodynamics and its mutual dependency on chemical species transport (reactions, interfacial mass transfer), the industrial approach to handle such systems is very often dependent on a ‘rule of thumb’ basis. The problem is either to neglect local flow phenomena near stirrers and dead zones (integral approach) or not to account for the poly-dispersity of the bubble swarm (pseudo-homogeneity) [2]. State of the art models, such as axial dispersion models, are still based on an integral description of the time-dependent hydrodynamics (one axial dispersion coefficient accounts for all non-idealities), mass transfer (integral mass transfer coefficient constant over the column height) and an integral bubble size (such as the constant mean Sauter diameter, d32). Hence, these models are developed for a specific reactor geometry and chemical system and thus limited in predictability.
Computational fluid dynamics (CFD) simulations can exactly predict local hydrodynamics considering any changes in apparatus geometry. In addition, population balance equations became a frequently applied tool to describe the changing bubble size distribution due to break-up and coalescence, while the bottleneck is still the predictability of coalescence and break-up kernels. However, recent research indicated a good agreement when coupling simulations with mass transfer models.
Concerning reactive mass transfer, Fleischer et al. [3] used a one-dimensional two-phase simulation combined with population balance simulation to describe the chemisorption of carbon dioxide into an aqueous solution of sodium hydroxide. The simulations reveal a high sensitivity against small variations in hydrodynamic, mass transfer, and kinetic parameters. Márquez et al. [4] developed a model for the simulation of hydrodynamics and an irreversible chemical reaction in a gas-lift reactor. A solver capable of calculating compressible two-phase bubbly flows with chemisorption has been introduced by Shimada et al. [5] and the simulations were compared to experimental data of Fleischer et al. [3]. While a good fit was found for the pH-profile, the used geometrical design of the column was different to the experimental
data. Cachaza et al. [6] developed a transient Eulerian-Eulerian model for hydrodynamics and mass transfer in rectangular bubble columns but chemical reactions were not included. Rigopoulos [7] introduced a hybrid approach for coupling turbulent mixing and chemical reaction. The mixing of phases is estimated by averaging flow and concentration profiles from preliminary CFD flow field calculations and a numerical tracer experiment. The validation was against data of carbon dioxide absorption into an alkali solution. Darmana et al. [8] used an Eulerian-Lagrangian approach to model hydrodynamics, mass transfer and chemical reactions for two-phase flows. The chemisorption process of carbon dioxide in an aqueous solution of sodium hydroxide and the resulting reversible reactions were simulated in a bubble column reactor. A Lagrangian model enables an exact consideration of dispersed bubbles. However, it is not suitable for higher dispersed phase fractions and in general, this type of approach leads to a higher computational effort compared to an Eulerian one.
In this study reaction algorithm are combined with a multiphase Euler-Euler CFD code based on the open source toolbox OpenFOAM®. To our knowledge, it is the first coupling of a CFD multi-phase model with reaction kinetic models to simulate the reactive mass transfer, while the coupling with population balances is presented elsewhere [9]. The resulting solver is capable of computing one liquid bulk phase and any amount of gaseous phase fractions in 3-D simulations. The model will be described in the next section, followed by a validation against literature test cases and own experimental data derived in a rectangular bubble column.
Experimental TheoryThe multi-fluid model is based on general conservation equations
such as the conservation of volume and conservation of momentum for each phase. The continuity equation for the liquid phase l is given by:
Journal of Chemical Engineering & Process TechnologyJournal
of C
hem
ical E
ngineering & Process Technology
ISSN: 2157-7048
Page 2 of 9
Citation: Hlawitschka MW, Drefenstedt S, Bart HJ (2016) Local Analysis of CO2 Chemisorption in a Rectangular Bubble Column Using a Multiphase Euler-Euler CFD Code. J Chem Eng Process Technol 7: 300. doi:10.4172/2157-7048.1000300
Volume 7 • Issue 3 • 1000300J Chem Eng Process Technol ISSN: 2157-7048 JCEPT, an open access journal
( )( ) ( )1
11n
ll l l comp l gl lg l l
pl
u u m m Stα α α α α
ρ =
∂+ ⋅∇ +∇⋅ − = − +
∂ ∑
(1)
Herelu represents the velocity of the continuous (liquid) phase
and glm is the mass transfer from the liquid phase l to the dispersed (gaseous) phase g and lgm is the mass transfer vice versa. Sl defines the source term applied to the liquid phase entry and αl is the liquid holdup. The first term on the left hand side describes the accumulation, the second term the convection and the third term a possible interface sharpening, while the interface compression velocity is given by [10]:
compu C uααα
∇=
∇
(2)
with 0,
1, nointerface sharpening
Cinterface sharpening activeα
=
(3)
The conservation of momentum of the liquid phase is represented by:
( ) ( ) ( ) ( ), , ,1
n
l l l l l l l l l l l l l D l lift l VM l gl gl lg lgp
u u u p u g F F F m u m utα ρ α ρ α µ α α ρ
=
∂+∇⋅ = − ∇ +∇⋅ ∇ + + + + + −
∂ ∑
(4)
The viscosity of the liquid phase is given by µl, the gravitation vector is named g , and the forces , , ,D l lift lF F
and ,VM lF
describe the drag force, lift force and virtual mass force. The term ( )gl gl lg lgm u m u−
describes the momentum influence due to mass transfer. The lift force ,lift lF
is not relevant and not considered but the drag term ,D lF
is given by:
( ) ( ),3 ,4
g l g lD l l l d D l g g l
u u u uF C K u u
dρ α α α α
− −= = −
(5)
where
3 .4
g ll D
u uK C
dρ
−=
(6)
The dispersed phase fraction given by αd and the corresponding velocity is described by gu . The drag coefficient CD can be described by a various number of correlations. For example, the first one used in this work is Ishii and Zuber [11]:
23DC Eo= (7)
The second one used is a variant of Tomiyama et al. [12]:
( )0.68716 48 81 0.15 , , ,3 4D
EoC max min ReRe Re Eo
= + + (8)
where
( ) 232l gg d
Eoρ ρ
σ−
= (9)
The virtual mass force ,VM lF
includes the virtual mass effect occurring when a phase accelerates relative to another phase:
,g gl l
VM l VM l g
d ud uF Cdt dt
ρ α
= −
(10)
The turbulence modelling is based on large eddy simulation [13] with a simulation of large-scale turbulence structures and a fine-tuned modelling of the smaller scales. In this work the latter is by the Smagorinsky model [14], where the turbulent viscosity is given by:
( )0.52 2 ˆ ˆsgs s mn mnC S Sµ = ∆ (11)
Where Δ represents the grid size and ˆmnS is the rate-of-strain
tensor. In OpenFOAM 2.3.1 the Smagorinsky constant Cs is defined as follows:
2 2 ks k
e
CC CC
= (12)
The model constant Cs=0.1 is taken from literature [8] and in ordered to ensure comparability the constants Ck=0.03742 and Ce=1.048 were used throughout.
Mass transfer and species transport
The chemisorption of carbon dioxide in aqueous sodium hydroxide solution starts with the absorption process of carbon dioxide from the dispersed phase into the surrounding continuous phase:
( ) ( )2, 2,g lCO CO→
From a computational point, the presence of gas phase in a mesh cell leads to an increase of the corresponding species in the continuous phase until the solubility limit is reached.
The absorption rates appear in the source terms of the species transport equations, which describe the transport of the species inside the numerical domain:
( ) ( ) ( )j j j j j jl l l l l l l lY u Y D Y m S
tα ρ α ρ α ρ α∂
+∇⋅ −∇⋅ ∇ = +∂
(14)
Only Ns-1 transport equations are solved, where Ns corresponds to the number of species observed in the process. The mass fractions of the species must fulfill the following constraint:
1
1SN
j
j
Y=
=∑ (15)
The mass transfer is based on the two-film theory with a linear gradient of a species j in the liquid (continuous) phase and the dispersed phase. Figure 1 shows a schematic concentration profile and the mass fractions in the bulk phases and at the interface. j
gY and jlY represent
the mass fractions in the bulk of the dispersed (gaseous) phase and the surrounding liquid phase, respectively. The mass fractions
*jgY and
*jlY describe the corresponding mass fractions at the interface. Based
on the assumption of a liquid side mass transfer resistance, the mass transfer jm is given by:
( )*j j j jl l l
cell
Am Ek Y YV
ρ= −
(16)
lρ is the density of the continuous phase, Vcell is the cell volume and E is the enhancement factor.
The interface area corresponds to the summation of the interface areas of each single bubble in a numerical cell. Assuming spherical bubbles of constant size, it corresponds to:
6i cellA V
dα= (17)
The enhancement factor E describes the influence of chemical reaction to the absorption. Fleischer et al. [3] analyzed the dependence of the enhancement factor E on the pH value. A correlation is used to approximate the results of Fleischer in dependence of the hydroxide mass fraction as depicted in Figure 2.
1, 1.8 6
1 241.3* 1.0069,
OH
OH
if Y eE
Y else
−
−
< −= +
(18)
Up to a pH-value of 10, the enhancement factor E is close to unity (see horizontal dotted line), but in the range of pH 10 to 14 rises rapidly

Page 3 of 9
Citation: Hlawitschka MW, Drefenstedt S, Bart HJ (2016) Local Analysis of CO2 Chemisorption in a Rectangular Bubble Column Using a Multiphase Euler-Euler CFD Code. J Chem Eng Process Technol 7: 300. doi:10.4172/2157-7048.1000300
Volume 7 • Issue 3 • 1000300J Chem Eng Process Technol ISSN: 2157-7048 JCEPT, an open access journal
and describes an enhancement of the physical mass transfer. Albeit its simple structure, the average deviation of the correlation of the findings of Fleischer et al. is about 4% and never higher than 10%.
The mass transfer coefficient Kj is calculated based on the Sherwood Shj number and the diffusion coefficient Dj.
j jj
j
k dShD
= (19)*( )j
lY corresponds to the equilibrium mass fraction of species j in the liquid phase. It is defined by the Henry constant H.
* *j jj l l l
j jg g g
c YHc Y
ρρ
= = (20)
With the above equations the mass transfer from the dispersed to the continuous phase is then:
2
6 gj j j j ji l l
l
m E D Sh H Yd
ρα ρ
ρ
= −
(21)
Reaction
Reactions describe the transformation of one set of chemical substances into another. The developed solver enables a description of reactions in the liquid phase. The general stoichiometry equation of a reversible reaction for J species taking part in a reaction is:
1 1
J J
j j j jm m
j j
X Xβ β= =
′ ′′∑ ∑ (22)
jX represents the summation formula of species jmj β ′⋅ and j
mβ′′
are the stoichiometric coefficients of the reaction m for the educt side (left) and product side (right). For a chemical system with M reactions the production rate jS of a species J is:
( )1
Mj j j
m m mm
S β β ω′
=
′ ′= −∑ (23)
The production rates jS are used as source terms in the species transport equation. The reaction velocity
mω of the m-th reaction is dependent on the rate coefficients '
mk and ''mk for the forward
chemical reaction and the backward chemical reaction as well as on the concentrations jc of the participating species j.
( ) ( )' '
1 1
j jm m
J Jj j
m m mj j
k c k cβ β′ ′′
= =
= −∏ ∏ (24)
The concentration cj of the species j are derived from the mass fractions Yj, the density ρl and the molar mass Wj.
j j ljc Y
Wρ
= (25)
The temperature dependent rate coefficients 'mk of the forward
reaction is described by the Arrhenius equation. A
'TT
m mk A e−
= (26)
Am is the pre-exponential factor. The activation temperature TA can be interpreted as thermal energy required to start the reaction. The rate constant ''
mk of the backward reaction is commonly derived from the equilibrium constant GG, mK :
'
GG, ''m
mm
kKk
= (27)
For the rate constants ' '',m mk k and the equilibrium constant KGG,m different empirical models available (s. chapter 4.3). Besides the existing models in OpenFOAM 2.3.1 an additional model for the rate constant '
mk was implemented:
ln'
mm m m
CB T D E TT
m mk A e + + + = (28)
where Am, Bm, Cm, Dm and Em are reaction specific constants.
Solver extensionsThe model is embedded in the standard multiphaseEulerFoam
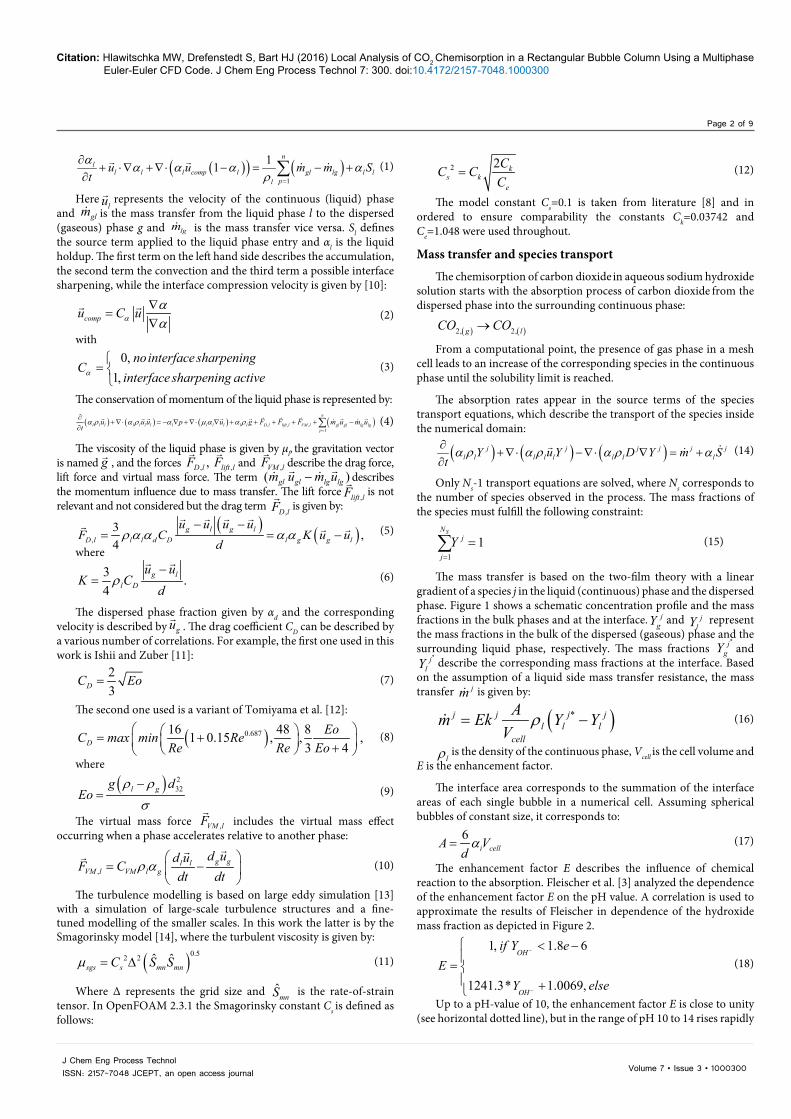
solver in OpenFOAM 2.3.1 and enables the simulation of reactive mass transfer. Declarations of the different phases i as well as hydrodynamic calculation of these are done within the original multiphaseEulerFoam environment. Figure 3 shows the interaction between the phases i, the chemical species j and the physical phenomena where one continuous phase with an infinite number of gaseous phases or different bubble sizes can be coupled. The composition of the liquid phase is being described by the OpenFOAM class basic Multi Component Mixture, where scalar fields Yj represent the mass fractions of the chemical species. It has no influence on the hydrodynamic behavior of the phases
Figure 1: Schematic representation of the interface mass transfer for a gas bubble in the liquid bulk phase.
0
2
4
6
8
10
12
14
16
18
20
7 8 9 10 11 12 13 14
Enha
ncem
ent f
acto
r E
pH-value
Figure 2: Evolution of the enhancement factor E in dependence of pH-value (Fleischer et al.) simulations: continuous line (—). Eqn. 18: as squares (▪).
Page 4 of 9
Citation: Hlawitschka MW, Drefenstedt S, Bart HJ (2016) Local Analysis of CO2 Chemisorption in a Rectangular Bubble Column Using a Multiphase Euler-Euler CFD Code. J Chem Eng Process Technol 7: 300. doi:10.4172/2157-7048.1000300
Volume 7 • Issue 3 • 1000300J Chem Eng Process Technol ISSN: 2157-7048 JCEPT, an open access journal
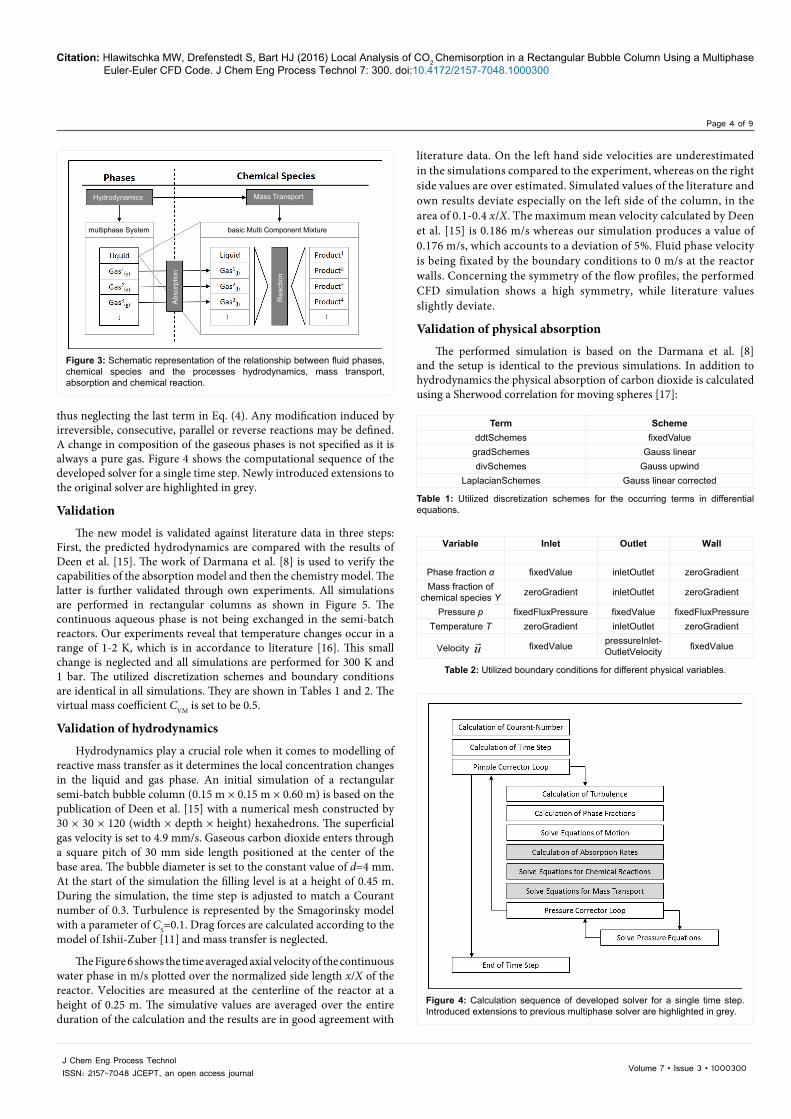
thus neglecting the last term in Eq. (4). Any modification induced by irreversible, consecutive, parallel or reverse reactions may be defined. A change in composition of the gaseous phases is not specified as it is always a pure gas. Figure 4 shows the computational sequence of the developed solver for a single time step. Newly introduced extensions to the original solver are highlighted in grey.
Validation
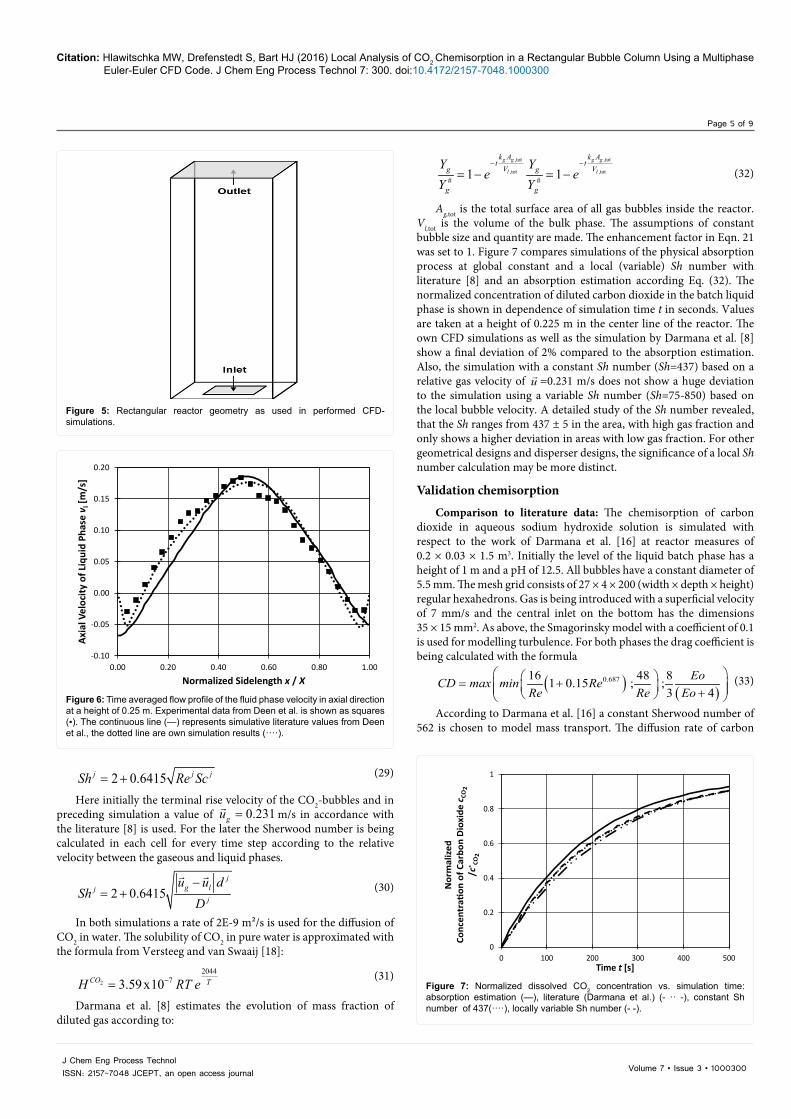
The new model is validated against literature data in three steps: First, the predicted hydrodynamics are compared with the results of Deen et al. [15]. The work of Darmana et al. [8] is used to verify the capabilities of the absorption model and then the chemistry model. The latter is further validated through own experiments. All simulations are performed in rectangular columns as shown in Figure 5. The continuous aqueous phase is not being exchanged in the semi-batch reactors. Our experiments reveal that temperature changes occur in a range of 1-2 K, which is in accordance to literature [16]. This small change is neglected and all simulations are performed for 300 K and 1 bar. The utilized discretization schemes and boundary conditions are identical in all simulations. They are shown in Tables 1 and 2. The virtual mass coefficient CVM is set to be 0.5.
Validation of hydrodynamics
Hydrodynamics play a crucial role when it comes to modelling of reactive mass transfer as it determines the local concentration changes in the liquid and gas phase. An initial simulation of a rectangular semi-batch bubble column (0.15 m × 0.15 m × 0.60 m) is based on the publication of Deen et al. [15] with a numerical mesh constructed by 30 × 30 × 120 (width × depth × height) hexahedrons. The superficial gas velocity is set to 4.9 mm/s. Gaseous carbon dioxide enters through a square pitch of 30 mm side length positioned at the center of the base area. The bubble diameter is set to the constant value of d=4 mm. At the start of the simulation the filling level is at a height of 0.45 m. During the simulation, the time step is adjusted to match a Courant number of 0.3. Turbulence is represented by the Smagorinsky model with a parameter of CS=0.1. Drag forces are calculated according to the model of Ishii-Zuber [11] and mass transfer is neglected.
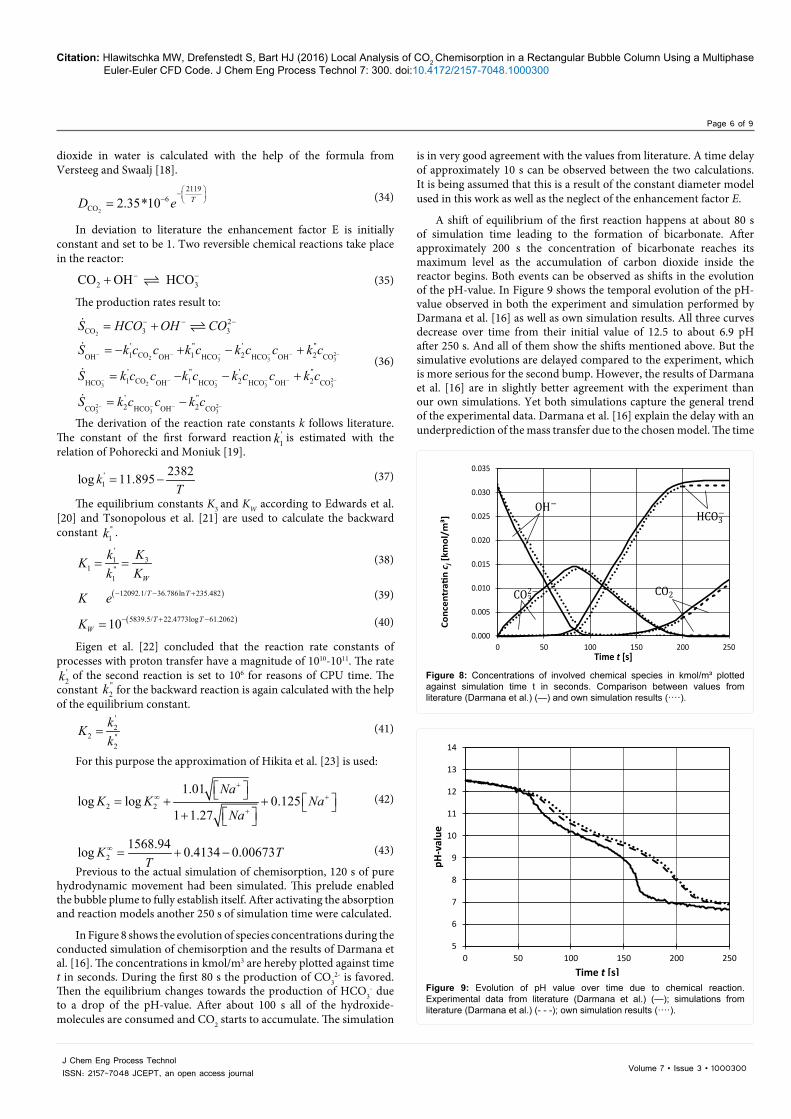
The Figure 6 shows the time averaged axial velocity of the continuous water phase in m/s plotted over the normalized side length x/X of the reactor. Velocities are measured at the centerline of the reactor at a height of 0.25 m. The simulative values are averaged over the entire duration of the calculation and the results are in good agreement with
literature data. On the left hand side velocities are underestimated in the simulations compared to the experiment, whereas on the right side values are over estimated. Simulated values of the literature and own results deviate especially on the left side of the column, in the area of 0.1-0.4 x/X. The maximum mean velocity calculated by Deen et al. [15] is 0.186 m/s whereas our simulation produces a value of 0.176 m/s, which accounts to a deviation of 5%. Fluid phase velocity is being fixated by the boundary conditions to 0 m/s at the reactor walls. Concerning the symmetry of the flow profiles, the performed CFD simulation shows a high symmetry, while literature values slightly deviate.
Validation of physical absorption
The performed simulation is based on the Darmana et al. [8] and the setup is identical to the previous simulations. In addition to hydrodynamics the physical absorption of carbon dioxide is calculated using a Sherwood correlation for moving spheres [17]:
multiphase System basic Multi Component Mixture
Abs
orpt
ion
Rea
ctio
n
Hydrodynamics Mass Transport
Figure 3: Schematic representation of the relationship between fluid phases, chemical species and the processes hydrodynamics, mass transport, absorption and chemical reaction.
Figure 4: Calculation sequence of developed solver for a single time step. Introduced extensions to previous multiphase solver are highlighted in grey.
Term SchemeddtSchemes fixedValue
gradSchemes Gauss lineardivSchemes Gauss upwind
LaplacianSchemes Gauss linear corrected
Table 1: Utilized discretization schemes for the occurring terms in differential equations.
Table 2: Utilized boundary conditions for different physical variables.
Variable Inlet Outlet Wall
Phase fraction α fixedValue inletOutlet zeroGradientMass fraction of
chemical species Y zeroGradient inletOutlet zeroGradient
Pressure p fixedFluxPressure fixedValue fixedFluxPressureTemperature T zeroGradient inletOutlet zeroGradient
Velocity u fixedValue pressureInlet-OutletVelocity fixedValue
Page 5 of 9
Citation: Hlawitschka MW, Drefenstedt S, Bart HJ (2016) Local Analysis of CO2 Chemisorption in a Rectangular Bubble Column Using a Multiphase Euler-Euler CFD Code. J Chem Eng Process Technol 7: 300. doi:10.4172/2157-7048.1000300
Volume 7 • Issue 3 • 1000300J Chem Eng Process Technol ISSN: 2157-7048 JCEPT, an open access journal
2 0.6415j j jSh Re Sc= + (29)
Here initially the terminal rise velocity of the CO2-bubbles and in preceding simulation a value of 0.231gu =
m/s in accordance with the literature [8] is used. For the later the Sherwood number is being calculated in each cell for every time step according to the relative velocity between the gaseous and liquid phases.
2 0.6415j
g ljj
u u dSh
D−
= +
(30)
In both simulations a rate of 2E-9 m²/s is used for the diffusion of CO2 in water. The solubility of CO2 in pure water is approximated with the formula from Versteeg and van Swaaij [18]:
2
204473.59 x1 0 CO TH RT e−=
(31)
Darmana et al. [8] estimates the evolution of mass fraction of diluted gas according to:
,tot ,tot
,tot ,tot
# #1 1g g g g
l l
k A k At t
V Vg g
g g
Y Ye e
Y Y
− −
= − = − (32)
Ag,tot is the total surface area of all gas bubbles inside the reactor. Vl,tot is the volume of the bulk phase. The assumptions of constant bubble size and quantity are made. The enhancement factor in Eqn. 21 was set to 1. Figure 7 compares simulations of the physical absorption process at global constant and a local (variable) Sh number with literature [8] and an absorption estimation according Eq. (32). The normalized concentration of diluted carbon dioxide in the batch liquid phase is shown in dependence of simulation time t in seconds. Values are taken at a height of 0.225 m in the center line of the reactor. The own CFD simulations as well as the simulation by Darmana et al. [8] show a final deviation of 2% compared to the absorption estimation. Also, the simulation with a constant Sh number (Sh=437) based on a relative gas velocity of u =0.231 m/s does not show a huge deviation to the simulation using a variable Sh number (Sh=75-850) based on the local bubble velocity. A detailed study of the Sh number revealed, that the Sh ranges from 437 ± 5 in the area, with high gas fraction and only shows a higher deviation in areas with low gas fraction. For other geometrical designs and disperser designs, the significance of a local Sh number calculation may be more distinct.
Validation chemisorption
Comparison to literature data: The chemisorption of carbon dioxide in aqueous sodium hydroxide solution is simulated with respect to the work of Darmana et al. [16] at reactor measures of 0.2 × 0.03 × 1.5 m3. Initially the level of the liquid batch phase has a height of 1 m and a pH of 12.5. All bubbles have a constant diameter of 5.5 mm. The mesh grid consists of 27 × 4 × 200 (width × depth × height) regular hexahedrons. Gas is being introduced with a superficial velocity of 7 mm/s and the central inlet on the bottom has the dimensions 35 × 15 mm2. As above, the Smagorinsky model with a coefficient of 0.1 is used for modelling turbulence. For both phases the drag coefficient is being calculated with the formula
( ) ( )0.68716 48 81 0.15 ; ;
3 4EoCD max min Re
Re Re Eo = + +
(33)
According to Darmana et al. [16] a constant Sherwood number of 562 is chosen to model mass transport. The diffusion rate of carbon
Figure 5: Rectangular reactor geometry as used in performed CFD-simulations.
-0.10
-0.05
0.00
0.05
0.10
0.15
0.20
0.00 0.20 0.40 0.60 0.80 1.00
Axia
l Vel
ocity
of L
iqui
d Ph
ase
v l [m
/s]
Normalized Sidelength x / X
Figure 6: Time averaged flow profile of the fluid phase velocity in axial direction at a height of 0.25 m. Experimental data from Deen et al. is shown as squares (▪). The continuous line (—) represents simulative literature values from Deen et al., the dotted line are own simulation results (····).
0
0.2
0.4
0.6
0.8
1
0 100 200 300 400 500
Nor
mal
ized
Co
ncen
trati
on o
f Car
bon
Dio
xide
cCO
2 /c
* CO2
Time t [s]
Figure 7: Normalized dissolved CO2 concentration vs. simulation time: absorption estimation (—), literature (Darmana et al.) (- ·· -), constant Sh number of 437(····), locally variable Sh number (- -).
Page 6 of 9
Citation: Hlawitschka MW, Drefenstedt S, Bart HJ (2016) Local Analysis of CO2 Chemisorption in a Rectangular Bubble Column Using a Multiphase Euler-Euler CFD Code. J Chem Eng Process Technol 7: 300. doi:10.4172/2157-7048.1000300
Volume 7 • Issue 3 • 1000300J Chem Eng Process Technol ISSN: 2157-7048 JCEPT, an open access journal
dioxide in water is calculated with the help of the formula from Versteeg and Swaalj [18].
2
21196
CO 2.35*1 0 TD e − − = (34)
In deviation to literature the enhancement factor E is initially constant and set to be 1. Two reversible chemical reactions take place in the reactor:
2 3CO OH HCO− −+ (35)
The production rates result to:
2
22 3 3 3
223 3 3 3
2 23 3 3
CO
' '' ' ''1 CO 1 2 2OH OH HCO HCO OH CO
' '' ' ''1 CO 1 2 2HCO OH HCO HCO OH CO
' ''2 2CO HCO OH
23
C
3
O
S
S k c c k c k c c k c
S k c c k c k c c k
HCO OH
c
S k c k c
CO
c
− − − − − −
− − − − − −
− − − −
− − −
− + − +
−
= +
=
=
=
− +
−
(36)
The derivation of the reaction rate constants k follows literature. The constant of the first forward reaction '
1k is estimated with the relation of Pohorecki and Moniuk [19].
'1
2382log 11.895kT
= − (37)
The equilibrium constants K3 and KW according to Edwards et al. [20] and Tsonopolous et al. [21] are used to calculate the backward constant ''
1k . '
311 ''
1 W
KkKk K
= = (38)
( )12092.1/ 36.786ln 235.482T TK e − − + (39)
( )5839.5/ 22.4773log 61.206210 T TWK − + −= (40)
Eigen et al. [22] concluded that the reaction rate constants of processes with proton transfer have a magnitude of 1010-1011. The rate
'2k of the second reaction is set to 106 for reasons of CPU time. The
constant ''2k for the backward reaction is again calculated with the help
of the equilibrium constant.'2
2 ''2
kKk
= (41)
For this purpose the approximation of Hikita et al. [23] is used:
2 2
1.01log log 0.125
1 1.27
NaK K Na
Na
+
∞ +
+
= + + +
(42)
21568.94log 0.4134 0.00673 K T
T∞ = + − (43)
Previous to the actual simulation of chemisorption, 120 s of pure hydrodynamic movement had been simulated. This prelude enabled the bubble plume to fully establish itself. After activating the absorption and reaction models another 250 s of simulation time were calculated.
In Figure 8 shows the evolution of species concentrations during the conducted simulation of chemisorption and the results of Darmana et al. [16]. The concentrations in kmol/m3 are hereby plotted against time t in seconds. During the first 80 s the production of CO3
2- is favored. Then the equilibrium changes towards the production of HCO3
- due to a drop of the pH-value. After about 100 s all of the hydroxide-molecules are consumed and CO2 starts to accumulate. The simulation
is in very good agreement with the values from literature. A time delay of approximately 10 s can be observed between the two calculations. It is being assumed that this is a result of the constant diameter model used in this work as well as the neglect of the enhancement factor E.
A shift of equilibrium of the first reaction happens at about 80 s of simulation time leading to the formation of bicarbonate. After approximately 200 s the concentration of bicarbonate reaches its maximum level as the accumulation of carbon dioxide inside the reactor begins. Both events can be observed as shifts in the evolution of the pH-value. In Figure 9 shows the temporal evolution of the pH-value observed in both the experiment and simulation performed by Darmana et al. [16] as well as own simulation results. All three curves decrease over time from their initial value of 12.5 to about 6.9 pH after 250 s. And all of them show the shifts mentioned above. But the simulative evolutions are delayed compared to the experiment, which is more serious for the second bump. However, the results of Darmana et al. [16] are in slightly better agreement with the experiment than our own simulations. Yet both simulations capture the general trend of the experimental data. Darmana et al. [16] explain the delay with an underprediction of the mass transfer due to the chosen model. The time
0.000
0.005
0.010
0.015
0.020
0.025
0.030
0.035
0 50 100 150 200 250
Conc
entr
atin
c j [k
mol
/m³]
Time t [s]
OH−
CO32− CO2
HCO3−
Figure 8: Concentrations of involved chemical species in kmol/m³ plotted against simulation time t in seconds. Comparison between values from literature (Darmana et al.) (—) and own simulation results (····).
5
6
7
8
9
10
11
12
13
14
0 50 100 150 200 250
pH-v
alue
Time t [s] Figure 9: Evolution of pH value over time due to chemical reaction. Experimental data from literature (Darmana et al.) (—); simulations from literature (Darmana et al.) (- - -); own simulation results (····).
Page 7 of 9
Citation: Hlawitschka MW, Drefenstedt S, Bart HJ (2016) Local Analysis of CO2 Chemisorption in a Rectangular Bubble Column Using a Multiphase Euler-Euler CFD Code. J Chem Eng Process Technol 7: 300. doi:10.4172/2157-7048.1000300
Volume 7 • Issue 3 • 1000300J Chem Eng Process Technol ISSN: 2157-7048 JCEPT, an open access journal
delay between the calculation in literature and the own results can be explained in the same manner as above when analyzing the evolutions of the species concentration.
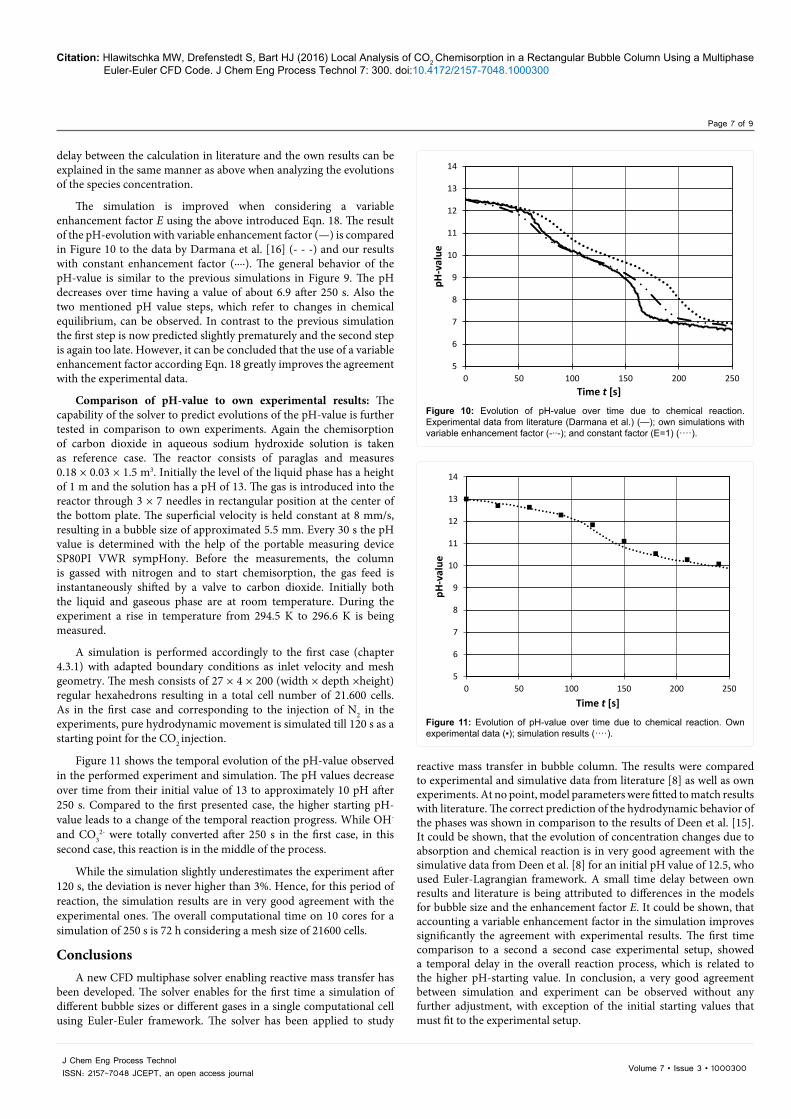
The simulation is improved when considering a variable enhancement factor E using the above introduced Eqn. 18. The result of the pH-evolution with variable enhancement factor (—) is compared in Figure 10 to the data by Darmana et al. [16] (- - -) and our results with constant enhancement factor (····). The general behavior of the pH-value is similar to the previous simulations in Figure 9. The pH decreases over time having a value of about 6.9 after 250 s. Also the two mentioned pH value steps, which refer to changes in chemical equilibrium, can be observed. In contrast to the previous simulation the first step is now predicted slightly prematurely and the second step is again too late. However, it can be concluded that the use of a variable enhancement factor according Eqn. 18 greatly improves the agreement with the experimental data.
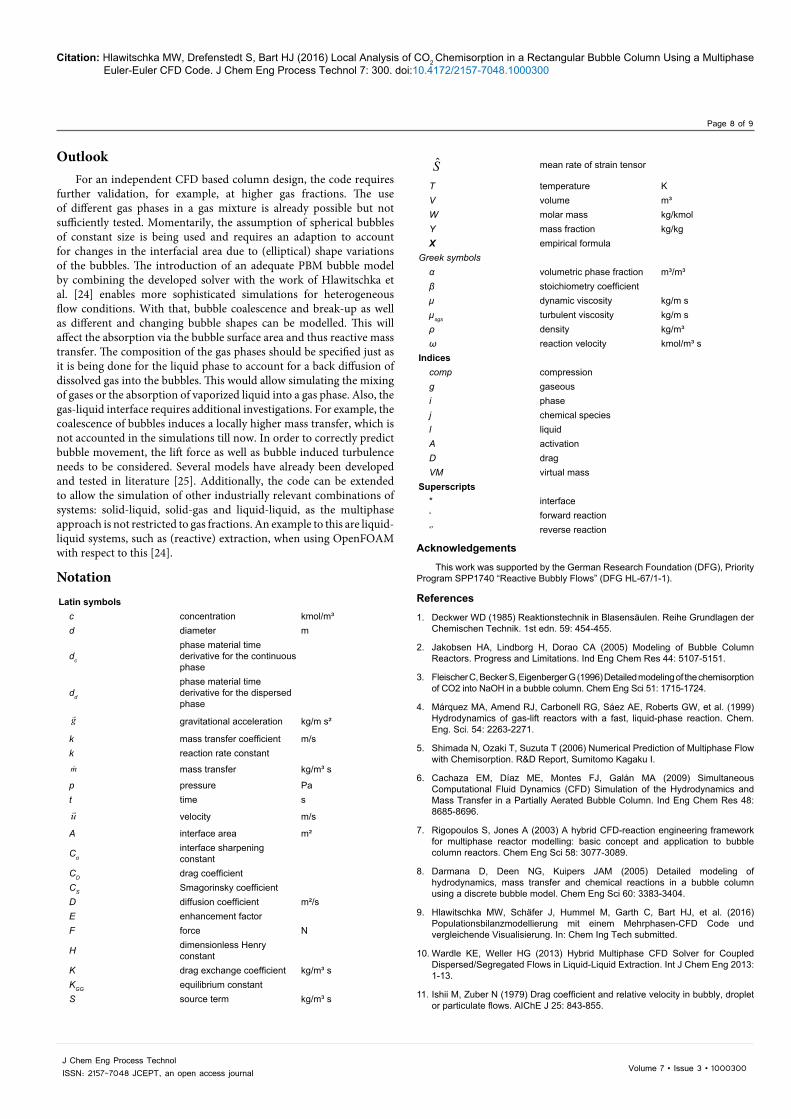
Comparison of pH-value to own experimental results: The capability of the solver to predict evolutions of the pH-value is further tested in comparison to own experiments. Again the chemisorption of carbon dioxide in aqueous sodium hydroxide solution is taken as reference case. The reactor consists of paraglas and measures 0.18 × 0.03 × 1.5 m3. Initially the level of the liquid phase has a height of 1 m and the solution has a pH of 13. The gas is introduced into the reactor through 3 × 7 needles in rectangular position at the center of the bottom plate. The superficial velocity is held constant at 8 mm/s, resulting in a bubble size of approximated 5.5 mm. Every 30 s the pH value is determined with the help of the portable measuring device SP80PI VWR sympHony. Before the measurements, the column is gassed with nitrogen and to start chemisorption, the gas feed is instantaneously shifted by a valve to carbon dioxide. Initially both the liquid and gaseous phase are at room temperature. During the experiment a rise in temperature from 294.5 K to 296.6 K is being measured.
A simulation is performed accordingly to the first case (chapter 4.3.1) with adapted boundary conditions as inlet velocity and mesh geometry. The mesh consists of 27 × 4 × 200 (width × depth ×height) regular hexahedrons resulting in a total cell number of 21.600 cells. As in the first case and corresponding to the injection of N2 in the experiments, pure hydrodynamic movement is simulated till 120 s as a starting point for the CO2 injection.
Figure 11 shows the temporal evolution of the pH-value observed in the performed experiment and simulation. The pH values decrease over time from their initial value of 13 to approximately 10 pH after 250 s. Compared to the first presented case, the higher starting pH-value leads to a change of the temporal reaction progress. While OH- and CO3
2- were totally converted after 250 s in the first case, in this second case, this reaction is in the middle of the process.
While the simulation slightly underestimates the experiment after 120 s, the deviation is never higher than 3%. Hence, for this period of reaction, the simulation results are in very good agreement with the experimental ones. The overall computational time on 10 cores for a simulation of 250 s is 72 h considering a mesh size of 21600 cells.
ConclusionsA new CFD multiphase solver enabling reactive mass transfer has
been developed. The solver enables for the first time a simulation of different bubble sizes or different gases in a single computational cell using Euler-Euler framework. The solver has been applied to study
reactive mass transfer in bubble column. The results were compared to experimental and simulative data from literature [8] as well as own experiments. At no point, model parameters were fitted to match results with literature. The correct prediction of the hydrodynamic behavior of the phases was shown in comparison to the results of Deen et al. [15]. It could be shown, that the evolution of concentration changes due to absorption and chemical reaction is in very good agreement with the simulative data from Deen et al. [8] for an initial pH value of 12.5, who used Euler-Lagrangian framework. A small time delay between own results and literature is being attributed to differences in the models for bubble size and the enhancement factor E. It could be shown, that accounting a variable enhancement factor in the simulation improves significantly the agreement with experimental results. The first time comparison to a second a second case experimental setup, showed a temporal delay in the overall reaction process, which is related to the higher pH-starting value. In conclusion, a very good agreement between simulation and experiment can be observed without any further adjustment, with exception of the initial starting values that must fit to the experimental setup.
5
6
7
8
9
10
11
12
13
14
0 50 100 150 200 250
pH-v
alue
Time t [s]
Figure 10: Evolution of pH-value over time due to chemical reaction. Experimental data from literature (Darmana et al.) (—); own simulations with variable enhancement factor (-∙∙-); and constant factor (E=1) (····).
5
6
7
8
9
10
11
12
13
14
0 50 100 150 200 250
pH-v
alue
Time t [s]
Figure 11: Evolution of pH-value over time due to chemical reaction. Own experimental data (▪); simulation results (····).
Page 8 of 9
Citation: Hlawitschka MW, Drefenstedt S, Bart HJ (2016) Local Analysis of CO2 Chemisorption in a Rectangular Bubble Column Using a Multiphase Euler-Euler CFD Code. J Chem Eng Process Technol 7: 300. doi:10.4172/2157-7048.1000300
Volume 7 • Issue 3 • 1000300J Chem Eng Process Technol ISSN: 2157-7048 JCEPT, an open access journal
OutlookFor an independent CFD based column design, the code requires
further validation, for example, at higher gas fractions. The use of different gas phases in a gas mixture is already possible but not sufficiently tested. Momentarily, the assumption of spherical bubbles of constant size is being used and requires an adaption to account for changes in the interfacial area due to (elliptical) shape variations of the bubbles. The introduction of an adequate PBM bubble model by combining the developed solver with the work of Hlawitschka et al. [24] enables more sophisticated simulations for heterogeneous flow conditions. With that, bubble coalescence and break-up as well as different and changing bubble shapes can be modelled. This will affect the absorption via the bubble surface area and thus reactive mass transfer. The composition of the gas phases should be specified just as it is being done for the liquid phase to account for a back diffusion of dissolved gas into the bubbles. This would allow simulating the mixing of gases or the absorption of vaporized liquid into a gas phase. Also, the gas-liquid interface requires additional investigations. For example, the coalescence of bubbles induces a locally higher mass transfer, which is not accounted in the simulations till now. In order to correctly predict bubble movement, the lift force as well as bubble induced turbulence needs to be considered. Several models have already been developed and tested in literature [25]. Additionally, the code can be extended to allow the simulation of other industrially relevant combinations of systems: solid-liquid, solid-gas and liquid-liquid, as the multiphase approach is not restricted to gas fractions. An example to this are liquid-liquid systems, such as (reactive) extraction, when using OpenFOAM with respect to this [24].
NotationLatin symbols
c concentration kmol/m³d diameter m
dc
phase material time derivative for the continuous phase
dd
phase material time derivative for the dispersed phase
g gravitational acceleration kg/m s²
k mass transfer coefficient m/sk reaction rate constantm mass transfer kg/m³ s
p pressure Pat time s
u velocity m/s
A interface area m²
Cαinterface sharpening constant
CD drag coefficientCS Smagorinsky coefficientD diffusion coefficient m²/sE enhancement factorF force N
H dimensionless Henry constant
K drag exchange coefficient kg/m³ sKGG equilibrium constantS source term kg/m³ s
S mean rate of strain tensor
T temperature KV volume m³W molar mass kg/kmolY mass fraction kg/kgX empirical formula
Greek symbolsα volumetric phase fraction m³/m³β stoichiometry coefficientµ dynamic viscosity kg/m sµsgs turbulent viscosity kg/m sρ density kg/m³ω reaction velocity kmol/m³ s
Indicescomp compressiong gaseousi phasej chemical speciesl liquidA activationD dragVM virtual mass
Superscripts* interface‘ forward reaction‘’ reverse reaction
Acknowledgements
This work was supported by the German Research Foundation (DFG), Priority Program SPP1740 “Reactive Bubbly Flows” (DFG HL-67/1-1).
References
1. Deckwer WD (1985) Reaktionstechnik in Blasensäulen. Reihe Grundlagen der Chemischen Technik. 1st edn. 59: 454-455.
2. Jakobsen HA, Lindborg H, Dorao CA (2005) Modeling of Bubble Column Reactors. Progress and Limitations. Ind Eng Chem Res 44: 5107-5151.
3. Fleischer C, Becker S, Eigenberger G (1996) Detailed modeling of the chemisorption of CO2 into NaOH in a bubble column. Chem Eng Sci 51: 1715-1724.
4. Márquez MA, Amend RJ, Carbonell RG, Sáez AE, Roberts GW, et al. (1999) Hydrodynamics of gas-lift reactors with a fast, liquid-phase reaction. Chem. Eng. Sci. 54: 2263-2271.
5. Shimada N, Ozaki T, Suzuta T (2006) Numerical Prediction of Multiphase Flow with Chemisorption. R&D Report, Sumitomo Kagaku I.
6. Cachaza EM, Diaz ME, Montes FJ, Galán MA (2009) Simultaneous Computational Fluid Dynamics (CFD) Simulation of the Hydrodynamics and Mass Transfer in a Partially Aerated Bubble Column. Ind Eng Chem Res 48: 8685-8696.
7. Rigopoulos S, Jones A (2003) A hybrid CFD-reaction engineering framework for multiphase reactor modelling: basic concept and application to bubble column reactors. Chem Eng Sci 58: 3077-3089.
8. Darmana D, Deen NG, Kuipers JAM (2005) Detailed modeling of hydrodynamics, mass transfer and chemical reactions in a bubble column using a discrete bubble model. Chem Eng Sci 60: 3383-3404.
9. Hlawitschka MW, Schäfer J, Hummel M, Garth C, Bart HJ, et al. (2016) Populationsbilanzmodellierung mit einem Mehrphasen-CFD Code und vergleichende Visualisierung. In: Chem Ing Tech submitted.
10. Wardle KE, Weller HG (2013) Hybrid Multiphase CFD Solver for Coupled Dispersed/Segregated Flows in Liquid-Liquid Extraction. Int J Chem Eng 2013: 1-13.
11. Ishii M, Zuber N (1979) Drag coefficient and relative velocity in bubbly, droplet or particulate flows. AIChE J 25: 843-855.
Page 9 of 9
Citation: Hlawitschka MW, Drefenstedt S, Bart HJ (2016) Local Analysis of CO2 Chemisorption in a Rectangular Bubble Column Using a Multiphase Euler-Euler CFD Code. J Chem Eng Process Technol 7: 300. doi:10.4172/2157-7048.1000300
Volume 7 • Issue 3 • 1000300J Chem Eng Process Technol ISSN: 2157-7048 JCEPT, an open access journal
12. Tomiyama A, Katiaka I, Zun I, Sakaguchi T (1998) Drag coefficients of single bubbles under normal and micro gravity conditions. JSME International Journal Series B 41: 472-479.
13. Leonard A (1975) Energy Cascade in Large-Eddy Simulations of TurbulentFluid Flows. Advances in geophysics 18: 237-248.
14. Smagorinsky J (1963) General circulation experiments with the primitiveequations. 1. The basic experiment. Monthly Weather Review 91: 99-164.
15. Deen NG, Solberg T, Hjertager BH (2001) Large eddy simulation of the Gas–Liquid flow in a square cross-sectioned bubble column. Chem Eng Sci 56: 6341-6349.
16. Darmana D, Henket RLB, Deen NG, Kuipers JAM (2007) Detailed modellingof hydrodynamics, mass transfer and chemical reactions in a bubble columnusing a discrete bubble model: Chemisorption of into NaOH solution, numerical and experimental study. Chem. Eng. Sci. 62: 2556-2575.
17. Bird RB, Stewart WE, Lightfoot EN (2007) Transport Phenomena. 2nd edn.New York: John Wiley.
18. Versteeg GF, van Swaalj WPM (1988) Solubility and diffusivity of acid gases (carbon dioxide, nitrous oxide) in aqueous alkanolamine solutions. J Chem Eng Data 33: 29-34.
19. Pohorecki R, Moniuk W (1988) Kinetics of reaction between carbon dioxide and hydroxyl ions in aqueous electrolyte solutions. Chem Eng Sci 43: 1677-1684.
20. Edwards TJ, Maurer G, Newman J, Prausnitz JM (1978) Vapor-liquid equilibria in multicomponent aqueous solutions of volatile weak electrolytes. AIChE J.24: 966-976.
21. Tsonopoulos C, Coulson DM, Inman LB (1976) Ionization constants of waterpollutants. J Chem Eng Data 21: 190-193.
22. Eigen M (1954) Methods for investigation of ionic reactions in aqueous solutions with half-times as short as 10-9 sec. Application to neutralization and hydrolysis reactions. Discuss Faraday Soc 17: 194-205.
23. Hikita H, Asai S, Takatsuka T (1976) Absorption of carbon dioxide into aqueous sodium hydroxide and sodium carbonate-bicarbonate solutions. Chem Eng J11: 131-141.
24. Hlawitschka MW, Attarakih MM, Alzyod SS, Bart HJ (2015) CFD basedextraction column design - Chances and challenges. Chin J Chem Eng S, pp:259-263.
25. Hibiki T, Ishii M (2007) Lift force in bubbly flow systems. Chem Eng Sci 62: 6457-6474.