LMS Solution: Evidence of Google Classroom Usage in Higher ...
13
31 Business Systems Research | Vol. 9 No. 1 |2018 LMS Solution: Evidence of Google Classroom Usage in Higher Education Lejla Abazi-Bexheti, Arbana Kadriu, Marika Apostolova-Trpkovska South East European University, Tetovo, Macedonia Edmond Jajaga University for Business and Technology, Pristina, Kosovo Hyrije Abazi-Alili Affiliate Fellow at CERGE-EI, Prague, Czech Republic Abstract Background: Learning Management Systems (LMS) represent one of the main technology to support learning in HE institutions. However, every educational institution differs in its experience with the usage of these systems. South East European University’s LMS experience is longer than a decade. From last year SEE – University is adopting Google Classroom (GC) as an LMS solution. Objectives: Identifying factors which encourage LMS activities, with special emphasis on SEEU, might be of crucial importance for Higher Education academic leaders as well as software developers who design tools related to fostering LMS. Methods/Approach: This paper introduces new approach of investigating the usage of LMS, i.e. identifying the determinants of increasing usage of LMS activities, by conducting empirical analysis for the case of SEEU. We apply appropriate estimation technique such as OLS methodology. Results: Using SEEU Usage Google Classroom Report & Analysis Data for spring semester (2016–2017) and winter semester (2017–2018) - SUGCR dataset 2017, we argue that (i) LMS activities are affected by demographic characteristics and (ii) the students’ LMS usage is affected by level and resources of instructors’ LMS usage. Conclusions: The empirical results show positive relationship between student and instructors’ LMS usage. Keywords: e-learning, LMS, learning content, HE, Google Classroom, LMS usage JEL classification: O30, D83, I21 Paper type: Research article, Case Study Received: Dec 01, 2017 Accepted: Mar 07, 2018 Citation: Abazi-Bexheti, L., Kadriu, A., Apostolova-Trpkovska, M., Jajaga, E., Abazi-Hilli, H. (2018), “LMS Solution: Evidence of Google Classroom Usage in Higher Education”, Business Systems Research, Vol. 9, No. 1, pp. 31-43. DOI: 10.2478/bsrj-2018-0003 Introduction The most important issue about e-Learning is the technology that makes it possible. The major aim of this research is about the effectual application of that technology. In this direction, LMS maybe are not the latest innovative technology in recent years, but they are one of the most pervasive in higher education.
Transcript of LMS Solution: Evidence of Google Classroom Usage in Higher ...

31
Business Systems Research | Vol. 9 No. 1 |2018
LMS Solution: Evidence of Google Classroom
Usage in Higher Education
Lejla Abazi-Bexheti, Arbana Kadriu, Marika Apostolova-Trpkovska
South East European University, Tetovo, Macedonia
Edmond Jajaga
University for Business and Technology, Pristina, Kosovo
Hyrije Abazi-Alili
Affiliate Fellow at CERGE-EI, Prague, Czech Republic
Abstract
Background: Learning Management Systems (LMS) represent one of the main
technology to support learning in HE institutions. However, every educational
institution differs in its experience with the usage of these systems. South East
European University’s LMS experience is longer than a decade. From last year SEE –
University is adopting Google Classroom (GC) as an LMS solution. Objectives:
Identifying factors which encourage LMS activities, with special emphasis on SEEU,
might be of crucial importance for Higher Education academic leaders as well as
software developers who design tools related to fostering LMS. Methods/Approach:
This paper introduces new approach of investigating the usage of LMS, i.e.
identifying the determinants of increasing usage of LMS activities, by conducting
empirical analysis for the case of SEEU. We apply appropriate estimation technique
such as OLS methodology. Results: Using SEEU Usage Google Classroom Report &
Analysis Data for spring semester (2016–2017) and winter semester (2017–2018) -
SUGCR dataset 2017, we argue that (i) LMS activities are affected by demographic
characteristics and (ii) the students’ LMS usage is affected by level and resources of
instructors’ LMS usage. Conclusions: The empirical results show positive relationship
between student and instructors’ LMS usage.
Keywords: e-learning, LMS, learning content, HE, Google Classroom, LMS usage
JEL classification: O30, D83, I21
Paper type: Research article, Case Study
Received: Dec 01, 2017
Accepted: Mar 07, 2018
Citation: Abazi-Bexheti, L., Kadriu, A., Apostolova-Trpkovska, M., Jajaga, E., Abazi-Hilli,
H. (2018), “LMS Solution: Evidence of Google Classroom Usage in Higher Education”,
Business Systems Research, Vol. 9, No. 1, pp. 31-43.
DOI: 10.2478/bsrj-2018-0003
Introduction
The most important issue about e-Learning is the technology that makes it possible.
The major aim of this research is about the effectual application of that technology.
In this direction, LMS maybe are not the latest innovative technology in recent years,
but they are one of the most pervasive in higher education.
32
Business Systems Research | Vol. 9 No. 1 |2018
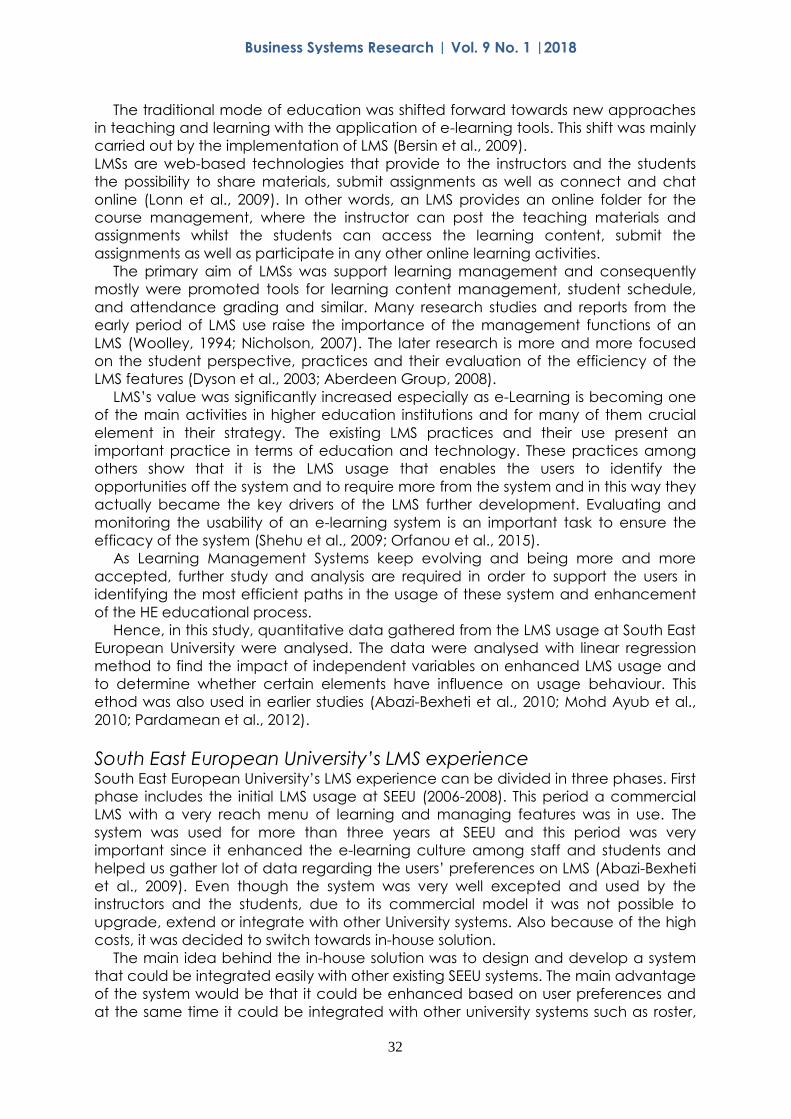
The traditional mode of education was shifted forward towards new approaches
in teaching and learning with the application of e-learning tools. This shift was mainly
carried out by the implementation of LMS (Bersin et al., 2009).
LMSs are web-based technologies that provide to the instructors and the students
the possibility to share materials, submit assignments as well as connect and chat
online (Lonn et al., 2009). In other words, an LMS provides an online folder for the
course management, where the instructor can post the teaching materials and
assignments whilst the students can access the learning content, submit the
assignments as well as participate in any other online learning activities.
The primary aim of LMSs was support learning management and consequently
mostly were promoted tools for learning content management, student schedule,
and attendance grading and similar. Many research studies and reports from the
early period of LMS use raise the importance of the management functions of an
LMS (Woolley, 1994; Nicholson, 2007). The later research is more and more focused
on the student perspective, practices and their evaluation of the efficiency of the
LMS features (Dyson et al., 2003; Aberdeen Group, 2008).
LMS’s value was significantly increased especially as e-Learning is becoming one
of the main activities in higher education institutions and for many of them crucial
element in their strategy. The existing LMS practices and their use present an
important practice in terms of education and technology. These practices among
others show that it is the LMS usage that enables the users to identify the
opportunities off the system and to require more from the system and in this way they
actually became the key drivers of the LMS further development. Evaluating and
monitoring the usability of an e-learning system is an important task to ensure the
efficacy of the system (Shehu et al., 2009; Orfanou et al., 2015).
As Learning Management Systems keep evolving and being more and more
accepted, further study and analysis are required in order to support the users in
identifying the most efficient paths in the usage of these system and enhancement
of the HE educational process.
Hence, in this study, quantitative data gathered from the LMS usage at South East
European University were analysed. The data were analysed with linear regression
method to find the impact of independent variables on enhanced LMS usage and
to determine whether certain elements have influence on usage behaviour. This
ethod was also used in earlier studies (Abazi-Bexheti et al., 2010; Mohd Ayub et al.,
2010; Pardamean et al., 2012).
South East European University’s LMS experience South East European University’s LMS experience can be divided in three phases. First
phase includes the initial LMS usage at SEEU (2006-2008). This period a commercial
LMS with a very reach menu of learning and managing features was in use. The
system was used for more than three years at SEEU and this period was very
important since it enhanced the e-learning culture among staff and students and
helped us gather lot of data regarding the users’ preferences on LMS (Abazi-Bexheti
et al., 2009). Even though the system was very well excepted and used by the
instructors and the students, due to its commercial model it was not possible to
upgrade, extend or integrate with other University systems. Also because of the high
costs, it was decided to switch towards in-house solution.
The main idea behind the in-house solution was to design and develop a system
that could be integrated easily with other existing SEEU systems. The main advantage
of the system would be that it could be enhanced based on user preferences and
at the same time it could be integrated with other university systems such as roster,
33
Business Systems Research | Vol. 9 No. 1 |2018
grading and similar. Therefore, in the second phase an in-house solution (Libri) was
designed, developed and integrated with other existing University e-systems (Abazi-
Bexheti et al., 2008). This phase lasted from 2008-2016. The initial version of Libri
consisted of the tools that staff and students found as most important for their
teaching and learning experience in the first phase (Abazi-Bexheti et al., 2009).
This is in fact one of the main reasons for the in-house approach: to design a LMS
that would be in step with the up-to-date technologies and further on to explore,
analyse and enhance it, based on users’ experiences (Shehu et al., 2009).
The third phase of the LMS experience at SEEU started by the end of 2016, when
on one side the LMS storage expenses started to increase and on the other side the
in-house advancement and development of the system could not reach the pace
of tools and developments that are coming from manufacturers and huge
companies offered for free. The first advancement was done by integrating Libri with
Google Drive. The purpose for this change was the issue that SEEU was dealing with
the lack of storage for the learning contents. When it comes to storing data, cloud
storage, more precisely Google Drive file repository system, was quickly seen as one
of the best possible solution.
Google Classroom - LMS solution is in use at SEEU from sept 2016 to present, as a
solution for the financial barriers and user’ requirements in the past decade. In
addition to this, the developed tool at SEEU, tracks the activity of the instructors in the
system and on the system usage. Moreover, it generates reports which are further on
analysed to identify the factors that maximize its usage.
Assessment of a LMS usage Another perspective which raises considerable attention in HE institutions is how to
be able to evaluate the actual level of LMS usage by the teaching staff. Actually,
although the students are seen as the main drivers of the further system
development, still the research shows that the teachers are the main drivers of the
system usage (Alshamari, 2015). Hence, it’s normal the focus of HE institutions on
evaluation of the LMS usage by the teaching staff. The evaluation of the extend of
LMS usage is complex process and in this direction, there are many research papers
that study and analyse variety of aspects of LMS usage and employment
(McQuiggan, 2007). The assessment method that we used is built upon the metric
model for LMS evaluation proposed by Janossy, in which different value (level) is
assigned for each certain group of activities on a LMS (Janossy, 2008). The metric
model is simplified in four basic levels of usage based on the history of LMS usage
data that we had at SEEU. The metric level model uses a different value for each
certain group of activities on a LMS. In the proposed model:
Level 0, is the null situation of LMS use. This level actually is the level of non-use of
the system. It is the situation when the teaching staff does not post learning content
on the system and the doesn’t invite the students to enrol on the course, unless the
course is created automatically for the students based on their schedule.
Level 1, is identified if the teacher is using the system for basic activities in terms of
uploading Syllabi, lesson contents and assignments. At this level, students use the
system for downloading learning materials and submitting assignments.
Level 2, includes the elements from the previous level and in addition to this the
use of communication and assessment tools is identified. This level of LMS usage
includes the usage of features such as quizzes, testes, surveys and similar by both
teachers and students in this level.

34
Business Systems Research | Vol. 9 No. 1 |2018
Level 3, covers more advanced use of the LMS which includes recording lessons
and applying more innovative methodologies in course delivery such as flipping
classroom
Research objectives
SEEU Usage Google Classroom Report & Analysis Data has been developed as a tool
for two purposes: (i) to track the activity of the instructors in the system and (ii) to
analyse the factors that maximize its usage. The data generated from this tool,
SUGCR dataset 2017, will be employed to empirically investigate the issue of the
level of LMS usage, in order to identify the factors that enhance the LMS (GC) usage.
Hence, Table 1 presents the identified factors employed in the model as
determinants affecting level of LMS engagement.
Table 1
Description of the identified factors employed in the model
List of Variables Definition of the Variable
Students Number of students enrolled
Level Level 0, 1 and 2
Resources Number of resources published
Title Academic title of the teaching staff
Age Instructors’ Age
Age square Square of Age variable
Ethnicity Instructors’ ethnicity
Gender Instructors’ Gender
Semester Dummy = 1 if Summer semester and 0 otherwise.
Students’ Semester Semesters 1-9
Source: Authors’ work
Methodology The methodology section consists of two parts: (i) system design and implementation
– presents the developed tool and its possibilities; and (ii) identifying factors that
enhance LMS (GC) usage.
System Design and Implementation The conceptual design of the proposed approach includes three main modules:
o dashboard, which displays individual instructors’ course records
o reporting and analysis module, which is used to generate real-time and
accurate reports about the activities within courses, and
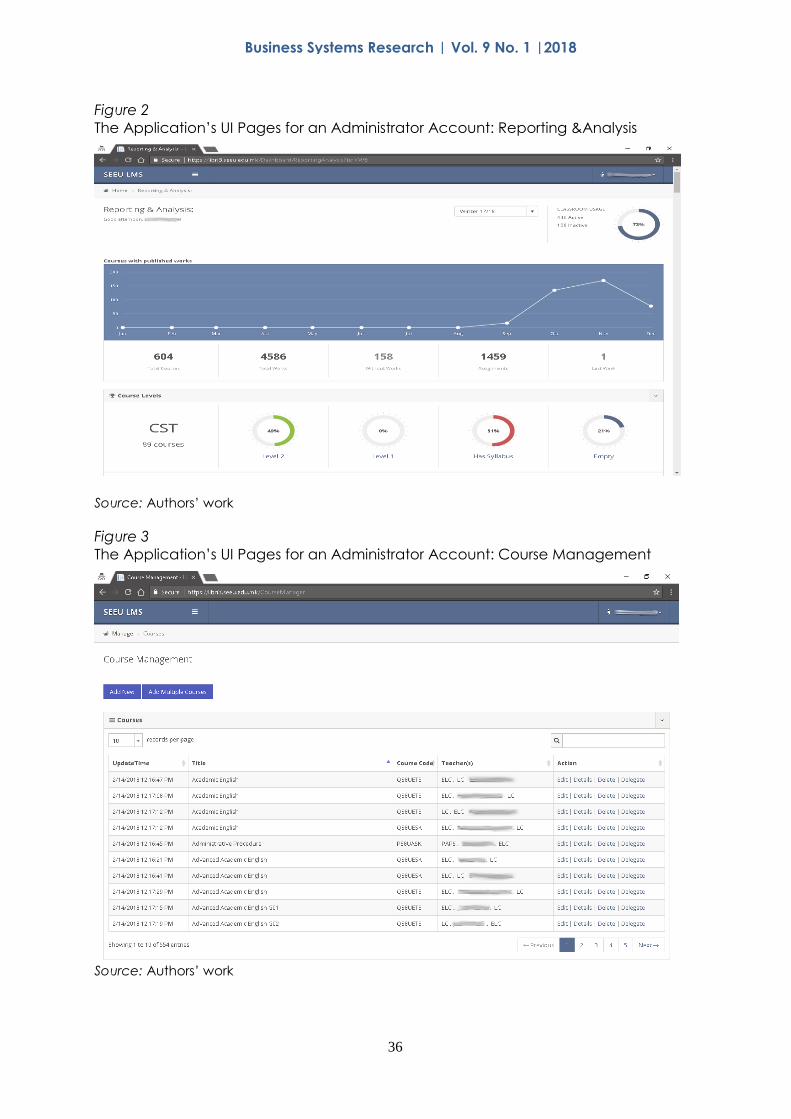
o management module, which allows privileged system users to manage
courses, course users’ delegation and system users.
The solution was implemented as ASP.NET MVC application using Entity Framework
(version 6) for dynamic management of database design and Google Classroom
API for .NET for Classroom courses management. To have a single point of interaction
between our server and Google servers, the Google OAuth 2.0 service account
scenario was approached. Namely, a G Suite domain administrator account was
used to access user data on behalf of users in the SEEU Classroom domain.
In UI perspective, the application was designated to include a page for the user’s
Dashboard (Figure 1), Reporting & Analysis (Figure 2) and Course Management
(Figure 3). The system can also provide data for reports such as the one shown in
Figure 1a. In this report can be compared the start of uploading contents by the

35
Business Systems Research | Vol. 9 No. 1 |2018
instructors between the initial summer semester and the second semester of the LMS
(GC) usage.
Figure 1
The Application’s UI Pages for an Administrator Account: Dashboard
Source: Authors’ work
Figure 1.a
Number of courses started to publish content
Source: Authors’ work
0
20
40
60
80
100
120
140
160
180
Jan Feb Mar Apr May Jun Jul Aug Sep Oct Nov Dec
Winter 17/18 Summer 16/17
36
Business Systems Research | Vol. 9 No. 1 |2018
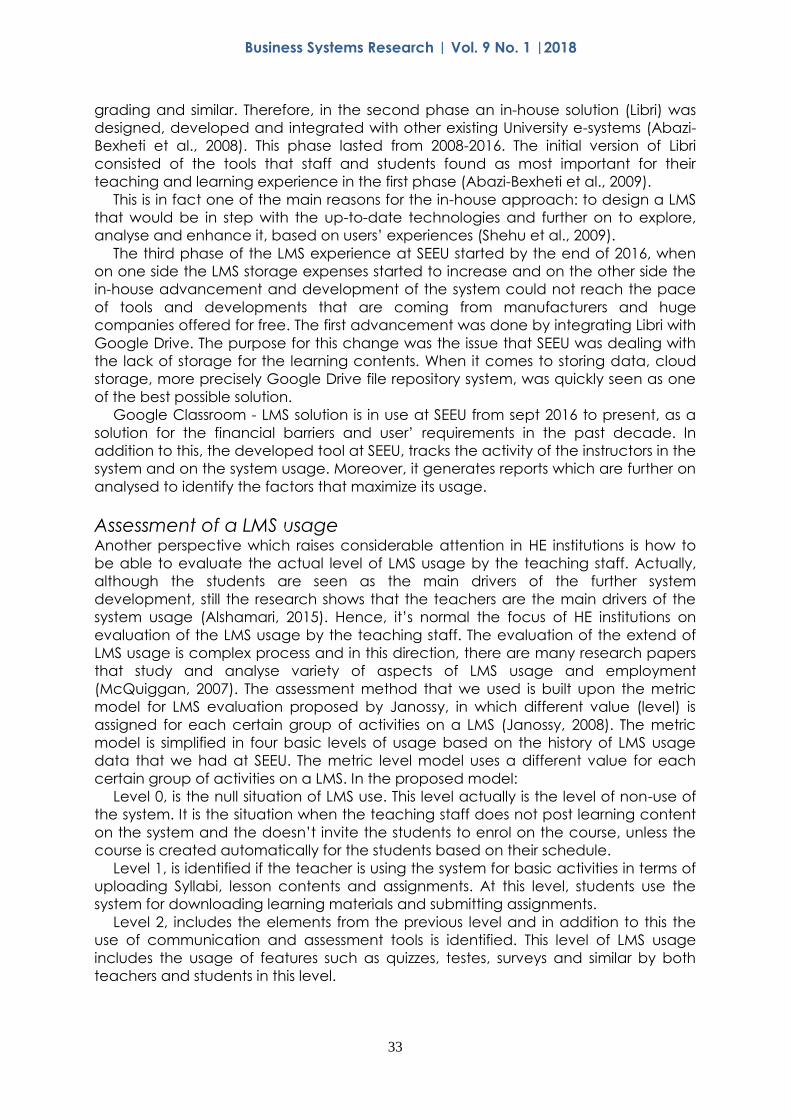
Figure 2
The Application’s UI Pages for an Administrator Account: Reporting &Analysis
Source: Authors’ work
Figure 3
The Application’s UI Pages for an Administrator Account: Course Management
Source: Authors’ work

37
Business Systems Research | Vol. 9 No. 1 |2018
The system is used by three kinds of users: administrators, university academic
leaders and faculty deans or directors of specific departments. Based on user role,
the:
Dashboard page is divided into three columns, where the first one lists the
instructor names, the second one the course list and the third one the course works
(feeds) list or course stats. On first page load the three columns are populated based
on specific user e.g. if the logged user is a dean of a faculty he/she will see the list of
the instructor names on the first column, the list of the registered courses of the
faculty on the second column and the list of published feeds of the faculty courses.
After loading the initial lists, whenever a user clicks on an instructor name the course
lists becomes populated with his/her courses and the course works lists includes the
instructor’s works across all course engagements. Moreover, if one wants to see the
instructor’s work on a specific course, he/she may click on the course name and the
feeds list will become updated with only the records published within that particular
course. Moreover, a link is provided for each course which displays the most current
statistics of the selected course on the third column.
Reporting & Analysis page consists of a set of reporting diagrams that enables
deeper insight of course works for high management, deans and directors.
Moreover, these users can observe course activities in near real-time. In the previous
version of our system user requests were performed directly through Classroom API to
consume real-time data. Because of the quotas for Google Services and for
improving system performance, it was decided to build a local database with
“offline” data i.e. data with maximum one-day delay. The synchronization algorithms
run every night to update implicit and explicit course information. Moreover, a grid
view of course level statistics within every department is also displayed for admins
and university’s high management, while deans and directors see only their
department related information.
Identifying factors that enhance LMS usage
Since there are few studies investigating empirically the usage of LMS, this
exploratory paper uses research questions (rather than hypotheses) to examine LMS
Usage and its determinants:
o RQ1: What are the determinants that influence the decision of students’
enrolment in LMS (GC) at SEEU?
o RQ2: How can these determinants be reflected in enhanced usage of LMS
(GC) by both students and instructors?
The effects of the identified factors employed in the previous research (Abazi-
Bexheti et al., 2009), of LMS level of usage will be estimated using data generated
from the tool, i.e. SUGCR dataset 2017. The data consists of 1011 observations, which
at the same time presents the number of courses created on the GC. Out of these
data, 74 courses that where ‘tutoring’ with no learning contents were deleted from
the sample, thus the final sample consist of 937 courses.
The empirical methodology involves Ordinary Least Square (OLS) Regression
model, where Yi is an unobserved continuous variable, described as dependent
variable, and Xi are described as the explanatory variables (Menard, 2009):
(1)
In the context of this research Yi is the dependent defined by the enrolled students
in GC, whereas Xi are the explanatory variables presented at Table 1. The program

38
Business Systems Research | Vol. 9 No. 1 |2018
used for the estimation is STATA 11 and the respective command for the estimation
of this model is reg.
The unobserved continuous variable used in the model is enrolled students in GC,
which takes values of minimum 0, and maximum 30 students. Whereas the
independent variables are resources, instructors’ age, level of LMS usage, ethnicity,
academic staff title, students‘ semester and gender. The summary statistics of the
variables employed are presented in Table 2a and 2b.
This research employs the OLS model to investigate the usage of LMS (GC) at
SEEU, using SUGCR data 2017, by identifying the categorical variables in the model.
The results provide evidence on the LMS (GC) learning activities and estimates their
joint impact on GC usage.
Table 2a
Description of the Variables
Variable name Observations Mean Standard
Deviation
Minimum Maximum
Students 937 13.99 10.78 0 30
Resources 937 7.12 9.71 0 70
Instructors’ Age 937 45.09 8.98 25 68
Age square 937 2114.57 861.97 625 4624
Students’ semester 937 3.88 2.25 1 9
Source: Authors’ work
Table 2b
Descriptive statistics of dichotomous variables
Variables Obs. Categories %
Gender 937 Male 64.03
Female 35.97
Semester 937 Winter 59.02
Summer 40.98
Level 937 Level 0 36.50
Level 1 40.45
Level 2 23.05
Ethnicity 937 Albanian 81.00
Macedonian 149
Foreign 3.09
Title 937 Part-time Lecturers 18.36
Lector 0.85
PhD Assistant 5.55
High Lector 15.37
Docent 13.34
Associate Professor 27.21
Full Professor 19.32
Source: Authors’ work
Results The results of the OLS regression estimations are presented in the following Table
(Table 3). The results presented include regression coefficient estimations of the the
independent variables employed in the model. The variables level, ethnicity, title
and students’ semester are treated as categorical variables.
39
Business Systems Research | Vol. 9 No. 1 |2018
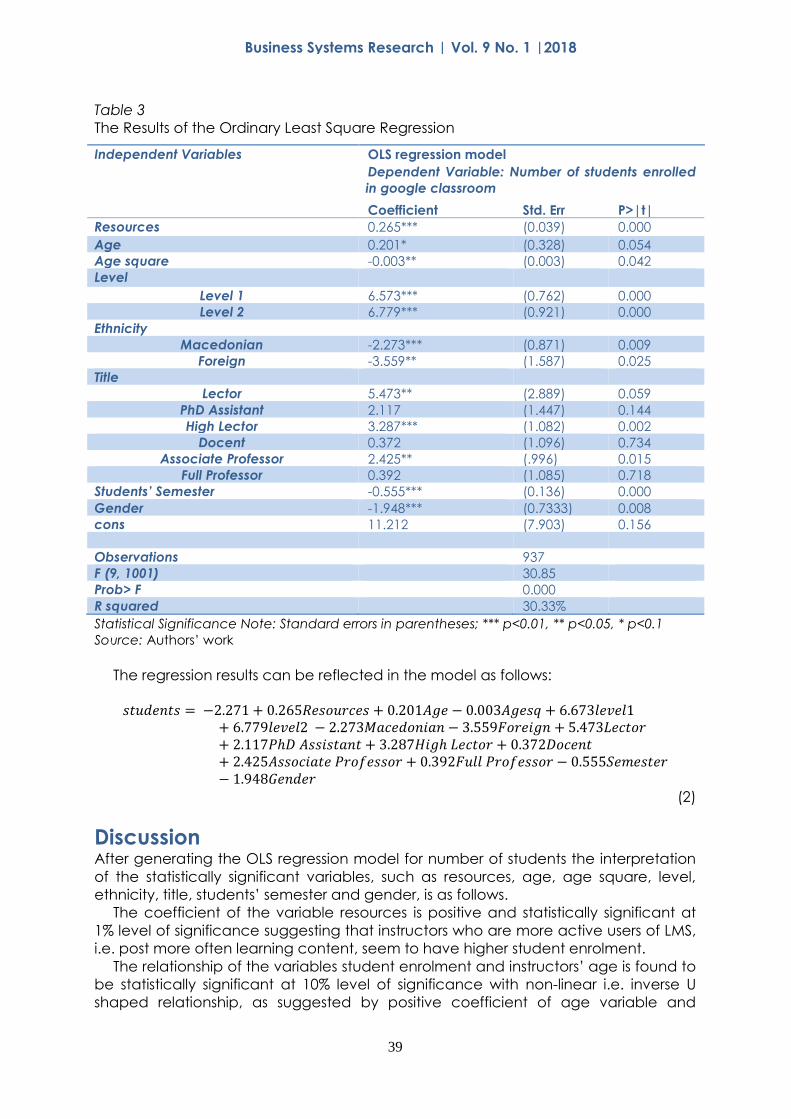
Table 3
The Results of the Ordinary Least Square Regression
Statistical Significance Note: Standard errors in parentheses; *** p<0.01, ** p<0.05, * p<0.1
Source: Authors’ work
The regression results can be reflected in the model as follows:
𝑠𝑡𝑢𝑑𝑒𝑛𝑡𝑠 = −2.271 + 0.265𝑅𝑒𝑠𝑜𝑢𝑟𝑐𝑒𝑠 + 0.201𝐴𝑔𝑒 − 0.003𝐴𝑔𝑒𝑠𝑞 + 6.673𝑙𝑒𝑣𝑒𝑙1
+ 6.779𝑙𝑒𝑣𝑒𝑙2 − 2.273𝑀𝑎𝑐𝑒𝑑𝑜𝑛𝑖𝑎𝑛 − 3.559𝐹𝑜𝑟𝑒𝑖𝑔𝑛 + 5.473𝐿𝑒𝑐𝑡𝑜𝑟+ 2.117𝑃ℎ𝐷 𝐴𝑠𝑠𝑖𝑠𝑡𝑎𝑛𝑡 + 3.287𝐻𝑖𝑔ℎ 𝐿𝑒𝑐𝑡𝑜𝑟 + 0.372𝐷𝑜𝑐𝑒𝑛𝑡+ 2.425𝐴𝑠𝑠𝑜𝑐𝑖𝑎𝑡𝑒 𝑃𝑟𝑜𝑓𝑒𝑠𝑠𝑜𝑟 + 0.392𝐹𝑢𝑙𝑙 𝑃𝑟𝑜𝑓𝑒𝑠𝑠𝑜𝑟 − 0.555𝑆𝑒𝑚𝑒𝑠𝑡𝑒𝑟− 1.948𝐺𝑒𝑛𝑑𝑒𝑟
(2)
Discussion After generating the OLS regression model for number of students the interpretation
of the statistically significant variables, such as resources, age, age square, level,
ethnicity, title, students’ semester and gender, is as follows.
The coefficient of the variable resources is positive and statistically significant at
1% level of significance suggesting that instructors who are more active users of LMS,
i.e. post more often learning content, seem to have higher student enrolment.
The relationship of the variables student enrolment and instructors’ age is found to
be statistically significant at 10% level of significance with non-linear i.e. inverse U
shaped relationship, as suggested by positive coefficient of age variable and
Independent Variables OLS regression model
Dependent Variable: Number of students enrolled
in google classroom
Coefficient Std. Err P>|t|
Resources 0.265*** (0.039) 0.000
Age 0.201* (0.328) 0.054
Age square -0.003** (0.003) 0.042
Level
Level 1 6.573*** (0.762) 0.000
Level 2 6.779*** (0.921) 0.000
Ethnicity
Macedonian -2.273*** (0.871) 0.009
Foreign -3.559** (1.587) 0.025
Title
Lector 5.473** (2.889) 0.059
PhD Assistant 2.117 (1.447) 0.144
High Lector 3.287*** (1.082) 0.002
Docent 0.372 (1.096) 0.734
Associate Professor 2.425** (.996) 0.015
Full Professor 0.392 (1.085) 0.718
Students’ Semester -0.555*** (0.136) 0.000
Gender -1.948*** (0.7333) 0.008
cons 11.212 (7.903) 0.156
Observations 937
F (9, 1001) 30.85
Prob> F 0.000
R squared 30.33%

40
Business Systems Research | Vol. 9 No. 1 |2018
negative coefficient of the age variable squared. In particular, student enrolment
initially rises with instructors’ age and reaches a maximum at the age of 39 (the
turning point is calculated using the approach of Wooldridge (2002). In the
estimated equation with B>0 (age in our case) and B2<0 (age squared), the turning
point is calculated as follows: X* = |B1/(2B2)|= |0.201/(2*0.0026)|= 39. Amongst the
instructors who are aged more than thirty nine, the age effect is negative. The
findings are reliable with our expectations of having younger generations of
instructors being more IT literate. Even though age is found to be proxy of IT literacy,
the findings of different studies diverge from positive result (Coşkunçay et al., 2013),
through insignificant findings (Alghamdi et al., 2016), to those that found negative
effect of age on LMS usage (Morris et al., 2000). Their findings indicate that with age
the self-confidence of the technology usage is decreasing.
The coefficients of level 1 and level 2 are positive and significant. This indicates
that instructors’ enhanced usage of LMS (GC) increases the student enrolment.
The coefficients of different faculty titles are statistically significant. The base
category is Part-Time engagement. As the positive and significant coefficients of
lector, high lector, and associate professor suggest, given title of full-time engaged
staff brings to better student enrolment.
The coefficient of the variable students’ semester is negative and significant, thus
suggests that earlier semesters tend to have higher enrolment of students in GC
rather than the later ones.
The results show negative and statistically significant coefficient for gender. This
means that the usage of GC i.e. number of students enrolled is better for female
than for male. Study by Wichadee (2015), found no difference among instructors’
gender differences in their attitude toward LMS, no matter what subject they were
teaching. The following section provides the concluding remarks of the paper.
Conclusion E-learning is equally treated as reason and outcome of important changes in the
nature of the education concept, as well as changes in the understanding of how it
should be successfully established. With the e-learning arrival and progress, SEEU
started to deal with diverse activities to address emerging challenges that go
beyond educational issues. The new advanced LMS solution included all the
elements in respect to learning, teaching, communication, creation and
management. It was a planned process that required digital skills, competences and
techniques of designing the course and course instruction, communication methods
through electronic and other technologies, along with crucial organizational and
administrative procedures.
In this paper was introduced a new approach of investigating the usage of GC
(LMS), i.e. identifying the determinants of the usage of GC activities, by conducting
empirical analysis for the case of SEEU.
Using OLS Regression model we found that: (i) the level of usage GC has positive
impact on the number of students enrolled; (ii) the resources posted by the
academic staff also confirm the appropriateness of the usage of GC, where without
significant number of resources there is no increase in the student enrolment; (iii)
there is an inverse U-shaped relationship between age and the usage of LMS
reaching a maximum at the age of 39, which is in accordance with our expectations
due to the IT literacy needed for the use of technologies. Older members of the
academic staff have lower level in IT literacy; (iv) females are more prone to the LMS
usage. Thus, in order to enhance LMS usage by students, instructors should consider
adding additional resources and increase their Level of LMS usage.

41
Business Systems Research | Vol. 9 No. 1 |2018
This study limitation is the time span of the data. These data reflect two semester
observation and usage which is limited time period. Once the data for the next
academic year will be generated, one can consider trend and suggestions for
further developments.
References 1. Abazi-Bexheti, L., Dika, Z., Alili, H. (2009), “Analysis Report of Survey Results About The
Usage Of A Learning Management System”, International Conference on e-Education
and eLearning, Vol. 54, World Academy of Science, Engineering and Technology, Paris,
pp. 225-229.
2. Abazi-Bexheti, L., Dika, Z., Besimi, A. (2008), “In house Development of Learning
Managment Systems Using Modular Approach”, Proceedings of Ed-Media World
Conference on Educational Multimedia, Hypermedia & Telecommunications, Association
for the Advancement of Computing in Education, Vienna, pp. 5915-5920.
3. Abazi-Bexheti, L., Kadriu, A., Ahmedi, L. (2010), “Measurement and Assessment of
Learning Management System Usage”, 6th WSEAS/IASME International Conference on
educational technologies (EDUTE '10), Kantaoui, Sousse, Tunisia, pp. 183-186.
4. Aberdeen Group (2008). Research brief: The rice of Learning Management Systems in
Talent Management Systems, Abeerden, Boston.
5. Alghamdi, S. R., Bayaga, A. (2016), “Use and attitude towards Learning Management
Systems (LMS) in Saudi Arabian universities“, Eurasia Journal of Mathematics, Science &
Technology Education, Vol. 12, No. 9, pp. 2309-2330.
6. Alshammari, M. S. (2015), „Academics' Adoption and Usage of Learning Management
Systems“, available at:
https://www.dora.dmu.ac.uk/bitstream/handle/2086/11123/Thesis_Mohammed%20S.%20
Alshammari_26May2015.pdf (30 March 2017)
7. Bersin, J., Howard, C., O’ Leonard, K., Mallon, D. (2009). Learning Management
Systems2009: Facts, Practice Analysis, Trends and Provider Profiles, Bersin & Associates.
8. Coşkunçay, D. F., Özkan, S. (2013), “A Model for Instructors’ Adoption of Learning
Management Systems: Empirical Validation in Higher Education Context”, Turkish Online
Journal of Educational Technology, Vol. 12, No. 2, pp. 13-25.
9. Dyson, M. C., Baretto Campello, S. (2003), “Evaluating Virtual Learning Environments: what
are we measuring?”, Electronic Journal of e-Learning, Vol. 1, No. 1, pp. 11-20.
10. Janossy, J. (2008), “Proposed Model for Evaluating C/LMS Faculty Usage in Higher
Education Institutions”, Immersed In Learning, 13th Annual Instructional Technology
Conference, Middle Tennessee State University, Murfreesboro.
11. Lonn, S., Teasley, S. D. (2009), “Saving time or innovating practice: Investigating
perceptions and uses of Learning Management Systems”, Computers & Education, Vol.
53, No. 3, pp. 686-694.
12. McQuiggan, C. A. (2007), “The role of faculty development in online teaching’s potential
to question teaching beliefs and assumptions”, Online Journal of Distance Learning
Administration, Vol. 10, No. 3.
13. Menard, S. (2009). Logistic Regression: From Introductory to Advanced Concepts and
Applications, SAGE Publications.
14. Mohd Ayub, A. F., Tarmizi, R. A., Wan J., Wan M., Wan A., Wan Z., Luan, W.S. (2010),
“Factors Influencing Students’ Use a Learning Management System Portal: Perspective
from Higher Education Students”, International Journal of Education and Information
Technologies, Vol. 2, No. 4, pp. 101-108.
15. Morris, M. G., Venkatesh, V. (2000), “Age differences in technology adoption decisions:
implications for a changing work force”, Personnel Psychology, Vol. 53, No. 2, pp. 375-403.
16. Nicholson, P. (2007), ”A history of E-learning”, in Fernández-Manjón, B., Sánchez-Pérez, J.
M., Gómez-Pulido, J. A., Vega-Rodríguez, M. A., Bravo-Rodríguez, J. (Eds), Computers and
education, Springer, Dordrecht, pp. 1-11.

42
Business Systems Research | Vol. 9 No. 1 |2018
17. Orfanou, K., Tselios, N., Katsanos, C. (2015), "Perceived usability evaluation of learning
management systems: Empirical evaluation of the System Usability Scale”, International
Review of Research in Open and Distributed Learning, Vol. 16, No. 2, pp. 227-246.
18. Pardamean B., Susanto M. (2012), “Assessing User Acceptance toward Blog Technology
Using the UTAUT Model”, International Journal of Mathematics and Computers in
Simulation, Vol. 6, No. 1, pp. 203-212.
19. Shehu, V., Besimi, A., Abazi-Bexheti, L., Shaqiri, M. (2009), “Usability Issues While Building A
New LMS”, Proceedings of the 31st International Conference on Information Technology
Interfaces, SRCE, Cavtat, Croatia, pp. 317-322.
20. Wichadee, S. (2015), “Factors Related to Faculty Members’ Attitude and Adoption of a
Learning ManagementSystem”, Turkish Online Journal of Educational Technology, Vol. 14,
No. 4, pp. 53-61.
21. Woolley, D. R. (1994), “PLATO: The Emergence of Online Community”, available at
http://www.thinkofit.com/plato/dwplato.htm (15 December 2008)

43
Business Systems Research | Vol. 9 No. 1 |2018
About the authors
Lejla Abazi-Bexheti is Associate Professor at the Faculty of Contemporary Sciences
and Technologies at South East European University in Macedonia. She holds a PhD
Degree in Computer Science and has been part of the CST teaching staff since
2002. Her main research activity is in the area of Learning Systems and eLearning
and she has been involved in many international projects and research activities
from this area. At SEE University she was involved on resolving issue of the Learning
Management System. Currently she is Pro-rector for academic issues at SEEU. The
author can be contacted at [email protected]
Edmond Jajaga is an assistant professor at the Department of Computer Engineering
of the University of Business and Technology in Kosovo. He received his PhD in 2017 in
Computer Science from South East European University, Macedonia. He has
published in renowned international venues in the areas of Semantic Web,
eLearning, Stream Reasoning and Databases. He has been involved on a couple of
international projects including InWaterSense and DISCO. Since 2011, he has been
working as a software engineer at the eLearning Center of the South East European
University. In the past he has worked as a teaching assistant at the State University of
Tetova and University of Prishtina. The author can be contacted at
Dr. Hyrije Abazi-Alili is a Lecturer Assistant of Economics, Quantitative Methods and
Corporate Finance modules at the Faculty of Business and Economics at South East
European University since 2005. She finished her PhD at Staffordshire University in 2013.
She is affiliate fellow at CERGE-EI, Prague since 2014. Her field of research is on
microeconomics such as ownership change, innovation, entrepreneurship,
education, gender issues, etc., in transition economies. She has participated in
numerous international projects (EU projects, UNDP, RRPP, etc) as project manager,
senior researcher, and other engagements. She is also active in publishing her
academic research work. The author can be contacted at [email protected]
Arbana Kadriu holds a PhD degree in Computer Sciences from Ss. Cyril and
Methodius University in Skopje from 2008, with focus on natural language processing
and information retrieval. She is associate professor at the Faculty of Contemporary
Sciences and Technologies at SEE University in Macedonia. She has also background
in artificial intelligence, machine learning, programming paradigms, software
engineering and e-learning. Also, she is mentoring several master theses that involve
the web information retrieval and e-learning. She is author of more than 30 research
papers. The author can be contacted at [email protected]
Marika Apostolova-Trpkovska, Assist. Professor at the Faculty of Contemporary
Sciences and Technologies, SEE University in Macedonia. She has been part of the
CST teaching staff since 2006. During her teaching experience, she has taught
courses from the area of Data structures and algorithms, C++ programming, Web
programming, Software Engineering, Strategic Information Technology Project
Management, Interactive system design and Microsoft IT courses. Her main PHD
research activity was in the area of e-Medical services based on Semantic web and
eLearning. She acted as coordinator of DISCO - Erasmus+ international project, and
senior researcher on several national and international projects. She was also
coordinator of integrated study programmes that were part of a valuable project
between German Federal Government of Development Cooperation and SEEU. The
author can be contacted at [email protected]