Light-Rail Transit in America Light-Rail Transit in America - Federal
TOD Resident Survey Results
www.RTAChicago.org 1
LIVING A TRANSITLIFESTYLE
Transit-Oriented Developm
ent Resident Survey Results Report
December 2014
TOD Resident Survey Results
www.RTAChicago.org 1
WHAT IS THE RTA?
PURPOSE:The Regional Transportation Authority (RTA) is charged with financial oversight, funding and planning for the Chicago Transit Authority (CTA) bus and rail, Metra commuter rail, Pace suburban bus and Pace ADA paratransit service. The Agency was created in 1974 by a referendum of Cook, DuPage, Kane, Lake, McHenry and Will county residents in Northeastern Illinois. The RTA also provides customer services including online and telephone travel planning assistance, and travel training for seniors and people with disabilities. The RTA’s mission is to ensure a financially sound, comprehensive and coordinated public transportation system for Northeastern Illinois.
FACTS AND FIGURES:The RTA public transportation system, with 7,200 route miles of transit service, is the third largest in the nation by ridership, providing more than two million rides each weekday to a regional population of approximately 8.4 million people throughout six counties.
TOD Resident Survey Results
www.RTAChicago.org 2
ACKNOWLEDGEMENTSThis survey report was a collaborative effort among RTA staff, our partners at the Service Boards (Metra, CTA and Pace) and the Regional Transit-Oriented Development (TOD) Working Group. We would like to thank all members involved for their efforts, guidance, technical assistance and support.
REGIONAL TRANSPORTATION AUTHORITY OF NORTHEASTERN ILLINOIS STAFF:Jessica Hector-Hsu, P.E., Division Manager, Strategic Planning and ProgramsHeather Tabbert, AICP, Manager, Local Planning and ProgramsMichael Horsting, AICP, Principal Analyst, Local Planning and ProgramsTony Manno, Project Manager, Local Planning and ProgramsHersh Singh, Strategic Analyst, Strategic Planning and PolicyBrooks Hansen, Assistant to the Senior Deputy Executive Director, Planning & Market DevelopmentJasmine Jackson, Creative Arts Intern, Communications and Public Affairs
REGIONAL TOD WORKING GROUP:Active Transportation AllianceChicago Department of TransportationChicago Metropolitan Agency for PlanningChicago Transit AuthorityChicago Department of Planning and DevelopmentCenter for Neighborhood TechnologyCook County Illinois Department of TransportationMetra Commuter RailMetropolitan Planning CouncilNational Association of REALTORS®Pace Suburban BusUrban Land Institute

TOD Resident Survey Results
www.RTAChicago.org 3
TABLE OF CONTENTSLIST OF FIGURES AND TABLES....................................................4 EXECUTIVE SUMMARY................................................................5
INTRODUCTION AND BACKGROUND.........................................7 METHODOLOGY..........................................................................8 SURVEY FINDINGS....................................................................11 CONCLUSIONS...........................................................................29
RECOMMENDATIONS................................................................31
FURTHER RESEARCH.................................................................35
APPENDICES..............................................................................36

TOD Resident Survey Results
www.RTAChicago.org 4
LIST OF FIGURES AND TABLESFigure 1: TOD Areas Surveyed....................................................................................................8
Figure 2: TOD Survey Postcard....................................................................................................9
Table 1: Demographic Data.......................................................................................................12
Figure 3: Respondent’s Age Distribution...................................................................................13
Figure 4: Respondent’s Previous Addresses..............................................................................14
Figure 5: Respondent’s Current Addresses................................................................................14
Figure 6: Number of Years in Current Residence.......................................................................15
Figure 7: Average Number of Years in Current Residence.........................................................16
Figure 8: Previous Employment Status......................................................................................17
Figure 9: Current Employment Status ......................................................................................17
Figure 10: Home Ownership......................................................................................................18
Figure 11: Residential Building Type..........................................................................................19
Figure 12: Previous Work Location............................................................................................20
Figure 13: Current Work Location..............................................................................................20
Figure 14: Top 5 Reasons to Live in Current Neighborhood.......................................................21
Figure 15: Reasons to Live in Current TOD Neighborhood.........................................................22
Figure 16: Transportation Mode for Work Trips.........................................................................23
Figure 17: Transportation Mode for Non-Work Trips.................................................................24
Figure 18: Average Number of Automobiles Owned..................................................................25
Figure 19: Dedicated Parking Availability...................................................................................26
Figure 20: Decreased Number of Vehicles and Change in Parking.............................................27
Figure 21: Same Number of Vehicles and Change in Parking.....................................................28
Figure 22: Increased Number of Vehicles and Change in Parking..............................................28

TOD Resident Survey Results
www.RTAChicago.org 5
EXECUTIVE SUMMARYThere is limited research in the Chicago region identifying which factors motivate people to move to a transit-oriented development (TOD). This research is necessary to inform and enhance planning for TOD areas.
In early 2014, the RTA administered a 32-question online survey that was sent to 38,000+ residents of 14 suburban TOD areas throughout the region. [“Region,” in this context, does not include residents of the City of Chicago. The City was not
included in this survey primarily because the majority of the City falls within a half-mile radius of a transit station therefore making most City residents TOD residents.] Residential addresses within a ½ mile radius of each of the 14 targeted transit stations were identified and an informational postcard was sent via US mail inviting recipients to take the survey. Recipients were directed to a URL address printed on the postcard to take the survey.
The survey yielded 661 valid responses. The results provide a better understanding of why individuals chose to live in a TOD area and how their travel habits differ from when they lived at their previous residence. The survey also collected information about how the availability of transit service and living in a TOD area may impact lifestyle choices and travel behaviors. This information can help inform local planning and land use decisions.
KEY FINDINGSThe survey collected valuable information about the respondents including demographic information, why they chose to live in a TOD and how their lifestyles have changed since moving from their previous address. Highlights include:
Respondents have fewer children, are older, and own fewer cars than regional suburban averages:
• 80% of respondents have no children living at home compared to 65% of regional households who report having no children living at home.
• The average respondent is 48 years old compared to the regional average age of 37 years old.
• The average number of vehicles per respondent household is 1.3, which is 20% lower than the overall regional average of 1.62.
Transit was one of the top reasons that respondents chose to move to a TOD:
• The top five reasons respondents chose to live in a TOD are 1) for their safety, 2) proximity to transit service, 3) the ability to walk to destinations, 4) to be near shops and services and 5) to be less dependent on a car.
Respondents use transit and walk more than they did at their previous residence:
• 30% of respondents said they drove to work alone as part of their commute from their current residence compared to 44% who said they drove to work alone from their previous residence.
• 77% of respondents said that they walk or use transit for some or all of their non-work trips from their current residence compared to 51% who walked or used transit for non-work trips from their previous residence.

TOD Resident Survey Results
www.RTAChicago.org 6
RECOMMENDATIONSBased on the survey responses, five main recommendations were developed and are discussed in detail later in this report. The recommendations are:
Right-Size Residential Parking TOD residents may require less parking than residents living in areas with lower levels of transit availability. Excess parking can drive up development costs, lowering the return on investment for developers and ultimately impacting the affordability of housing and commercial space. If less parking is required in TODs, such projects can be built more affordably, attracting a wider range of people in search of housing locations that promote a lifestyle less dependent on private vehicle use.
Improve TOD Marketing Efforts to Target Specific Market Demographics Municipalities and developers should market TODs to the specific demographics that are attracted to TOD areas. These include retirees, Chicago residents looking for an urban lifestyle in the suburbs, residents currently living in auto-oriented suburban neighborhoods, and households with no children living at home.
Invest In or Improve Walkability, Safety and Pedestrian Access to TransitRespondents indicated that walking to complete errands and other non-work trips nearly doubled after moving into a TOD area. Communities and developers should plan for, fund and build pedestrian infrastructure that ensures safe pedestrian mobility and access to transit throughout their TOD area.
Encourage Employers to be Transit-SupportiveThe survey results suggest that TOD residents increasingly are interested in taking transit to their place of employment; therefore, it is important for employers to be transit-supportive and to ensure that they locate near transit. This can be accomplished by providing education to business owners, incentivizing employers at the municipal level, and highlighting the added health benefits and commute cost savings that transit use offers employees.
Focus on Including Neighborhood Amenities in TODMunicipalities should ensure that their TOD areas offer a full range of uses at a scale appropriate for the market that address the everyday needs of residents. These can include a local grocery, restaurants, pharmacies and other services while avoiding offering only limited services, such as a coffee shop and dry cleaner.
1.
2.
3.
4.
5.

TOD Resident Survey Results
www.RTAChicago.org 7
NEED FOR TOD RESIDENT SURVEYWhile a substantial amount of research has been conducted in the areas of transit-supportive urban design, land-use densities needed to support transit and the real estate market for TOD, there has been little research on why residents move to TOD areas and if living in a TOD impacts their travel habits. To better understand this, the RTA conducted a survey of select TOD residents in the region to gather empirical data on the lifestyles and travel habits of TOD residents. The survey aimed to answer several research questions, such as: • What are the demographics of those who live in TOD areas? • Does living near transit influence travel habits? • Are residents relocating to TODs making lifestyle changes? • What are the main motivating factors for residents to move to a TOD area?
The answers to these questions can help inform land use planning, private sector investment in communities, real estate marketing and transportation investments throughout the region. Results from the survey were analyzed and translated into valuable information and recommendations that can be used by transit agencies, municipalities, private developers and real estate professionals.
INTRODUCTION AND BACKGROUNDWHAT IS TOD?Transit-oriented development (TOD) is defined by the RTA as a moderate to high-density, mixed-use community generally located within a half-mile radius (10-minute walk) of a rail or bus station designed to maximize walkability and transit access. TOD provides residents, workers and other transit users with increased mobility options and a variety of retail or commercial outlets within a short distance of their homes or places of
employment. Interest in TOD is driven by changing demographics, a growing desire to live in mixed-use, sustainable and walkable communities and a need to reduce traffic congestion.
The RTA supports TOD because it maximizes the use of the existing transit system by improving access to transit and increasing the number of jobs and housing units located within walking distance of a transit station, ultimately leading to
increases in ridership. The RTA actively supports TOD in the region through a combination of planning, implementation and education. Most notably, the RTA provides funding and technical assistance for TOD planning and implementation efforts through its Community Planning program.

TOD Resident Survey Results
www.RTAChicago.org 8
METHODOLOGYSURVEY APPROACH The survey was developed and administered by RTA Staff. It was vetted through the RTA’s Regional TOD Working Group, a forum of local and regional governmental and non-profit agencies and the RTA’s three Service Boards (Metra, Pace and CTA) that meets quarterly to discuss TOD initiatives and strategies. The survey targeted a sample of 14 TOD areas within the suburban RTA region, shown in Figure 1. The City of Chicago (the City) was not included in the sample for two main reasons: First, the majority of the City falls within a half-mile radius of a transit station therefore making the majority of City residents TOD residents; and second, there are many additional factors that residents consider when deciding to live in the City versus a suburb, such as for the proximity to cultural events, education resources and healthcare options. The 14 station areas selected for surveying include a wide variety of suburban areas along the eleven Metra commuter rail lines. The selected TOD areas represent a cross section of suburban TOD densities and characteristics. They include high, medium and low levels of TOD development density, as well as areas with more recent (1-5 years) development, areas with development that occurred approximately 5-10 years ago, and well-established areas with development in place for a number of decades.
FIGURE 1: TOD AREAS SURVEYED

TOD Resident Survey Results
www.RTAChicago.org 9
SURVEY DESIGNThe survey was designed to take 5-10 minutes to complete. Question topics included demographics, previous and current home and work address, reasons for choosing current home, how respondents traveled to complete commute and non-commute trips, automobile ownership and the availability of parking dedicated to their use. Many of the non-demographic questions were asked twice, once for their previous address and once for their current address, in order to obtain information about what may have changed when respondents moved to a TOD area. For example, “What type of building did you live in at your previous address?” “What type of building do you currently live in?” The survey instrument was web-based and accessible via any internet browser. Respondents could use any type of web-enabled device to complete the survey including a desktop, laptop, tablet or smart phone. The 32-question survey was created using the Survey Monkey® platform and included a mix of open-ended text, multiple-choice, ranking and yes/no questions.
SURVEY ADMINISTRATIONAfter survey design was completed, residential addresses within a ½ mile radius of each of the 14 targeted stations were obtained via a United States Post Office third-party distributor. An informational postcard (Figure 2) inviting recipients to take the survey was designed to catch the recipient’s eye and get them interested in taking the survey. Details on the purpose of the survey and how the results would be used were on the back of the postcard. Recipients of the postcard were directed to a URL address printed on the postcard to take the survey.
On January 31, 2014 the postcards were mailed out to the 37,980 targeted household addresses within the selected TOD areas. As an incentive to take the survey, a sweepstakes was offered for one of two $100 Visa gift cards, which were awarded after the survey closed.
The online survey was open for approximately five weeks from January 31 to March 10 and a total of 6611 valid responses were received. A copy of the survey can be found in Appendix B.
1 At 661 valid responses, the survey has a 99% confidence level with a 5% margin of error
FIGURE 2: TOD SURVEY POSTCARD

TOD Resident Survey Results
www.RTAChicago.org 10
TOD Resident Survey Results
www.RTAChicago.org 11
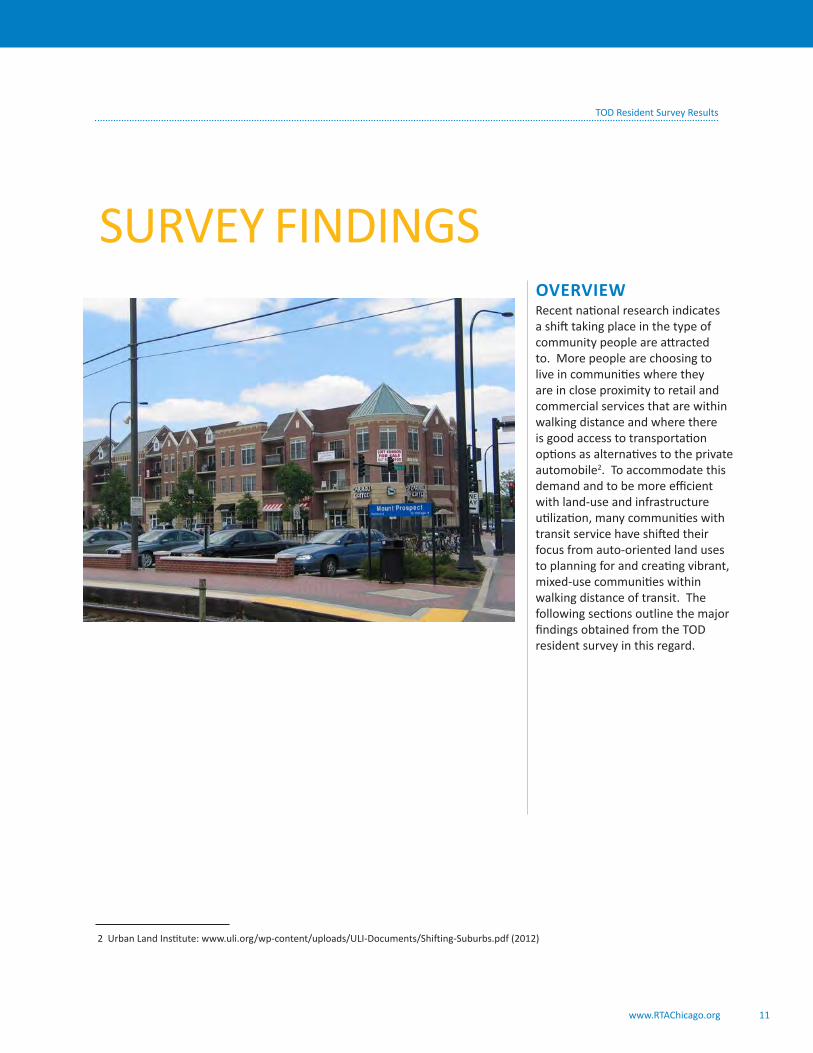
SURVEY FINDINGSOVERVIEWRecent national research indicates a shift taking place in the type of community people are attracted to. More people are choosing to live in communities where they are in close proximity to retail and commercial services that are within walking distance and where there is good access to transportation options as alternatives to the private automobile2. To accommodate this demand and to be more efficient with land-use and infrastructure utilization, many communities with transit service have shifted their focus from auto-oriented land uses to planning for and creating vibrant, mixed-use communities within walking distance of transit. The following sections outline the major findings obtained from the TOD resident survey in this regard.
2 Urban Land Institute: www.uli.org/wp-content/uploads/ULI-Documents/Shifting-Suburbs.pdf (2012)

TOD Resident Survey Results
www.RTAChicago.org 12
RESPONDENT DEMOGRAPHICSData collection and analysis of the demographic makeup of residents in TOD areas is common with TOD-related research, and much of the research indicates that younger adults as well as adults nearing retirement are particularly attracted to living in TOD areas. To gain an understanding of who is living in TOD areas locally,
respondents were asked to provide basic demographic information about themselves which was then benchmarked against regional demographic data. The results indicate that the majority of TOD respondents belong to one of two generations, the Millennial Generation (generally those between the ages of 15 and 33) or to the Baby Boomer
Generation (those between the ages of 50 and 68). Survey respondents also have smaller than average households, have few or no children, have a higher than average age and represent a range of income brackets. Table 1 summarizes the demographic respondent data as it compares to data averages of the suburban six County RTA region.
RESPONDENTS SURVEYED
SUBURBAN RTA REGION
Gender Female 56% 51% Male 44% 49%
Households with No Children 80% 65%
Average Household Size 2.09 2.53
Age 17 or Younger 0.2% 25.7%18-20 Year Olds 0.5% 4.1%21-24 Year Olds 2.9% 4.8%25-29 Year Olds 9.7% 5.5%30-44 Year Olds 25.3% 21.2%45-64 Year Olds 37.8% 26.2%65-74 Year Olds 11.3% 5.7%
75 or Older 2.9% 4.9%Average Age 48 37
Household IncomeUp to $25,000 12% 20%
$25,000-75,000 39% 39%More than $75,000 49% 42%
3
4 5
3 2007-2008 CMAP Household Travel Tracker Survey utilizing RTA Weights and excluding the City of Chicago4 No children under 17 years of age5 No children under 18 years of age
TABLE 1: DEMOGRAPHIC DATA

TOD Resident Survey Results
www.RTAChicago.org 13
AGE DISTRIBUTIONA more detailed age distribution analysis of respondent data further defines the ages of respondents living in Chicago-area TOD’s. Of the respondents who provided their age, the youngest respondent is 19 years old and the oldest respondent is 92 years old. The mean age and the median age are both 48 years,
and the mode age is 57. The two most frequently occurring ages are 22 respondents who indicated they are 56 years old (within the Baby Boomer Generation) and 21 respondents who indicated they are 26 years old (within the Millennial Generation). Figure 3 below shows the distribution of respondents by age.
FIGURE 3: RESPONDENT AGE DISTRIBUTION
# Responses
Ages

TOD Resident Survey Results
www.RTAChicago.org 14
REGIONAL RELOCATIONTo understand if survey respondents were moving from one TOD area to another or from a non-TOD to a TOD area, respondents were asked to provide their previous and current home addresses or the nearest intersection to their addresses. Approximately 65% of respondents provided this information, and of these, 66% of the address information provided was sufficient to geocode and map. The results (Figures 4 and 5) show a wide distribution of previous address locations throughout the region with 21% of previous
addresses within the City of Chicago. Three notable clusters of previous address locations were identified: one cluster along Lake Michigan from Downtown Chicago north to Evanston, one in Oak Park and the third cluster in the Elgin area. Of those addresses geocoded, approximately 1 in 3 previous addresses were not in TOD areas (within a ½ mile of a Metra station or within the City of Chicago), meaning that 30% or more of respondents had relocated from a non-TOD to a TOD area.
FIGURE 4: RESPONDENTS’ PREVIOUS ADDRESSES
FIGURE 5: RESPONDENTS’ CURRENT ADDRESSES
TOD Resident Survey Results
www.RTAChicago.org 15
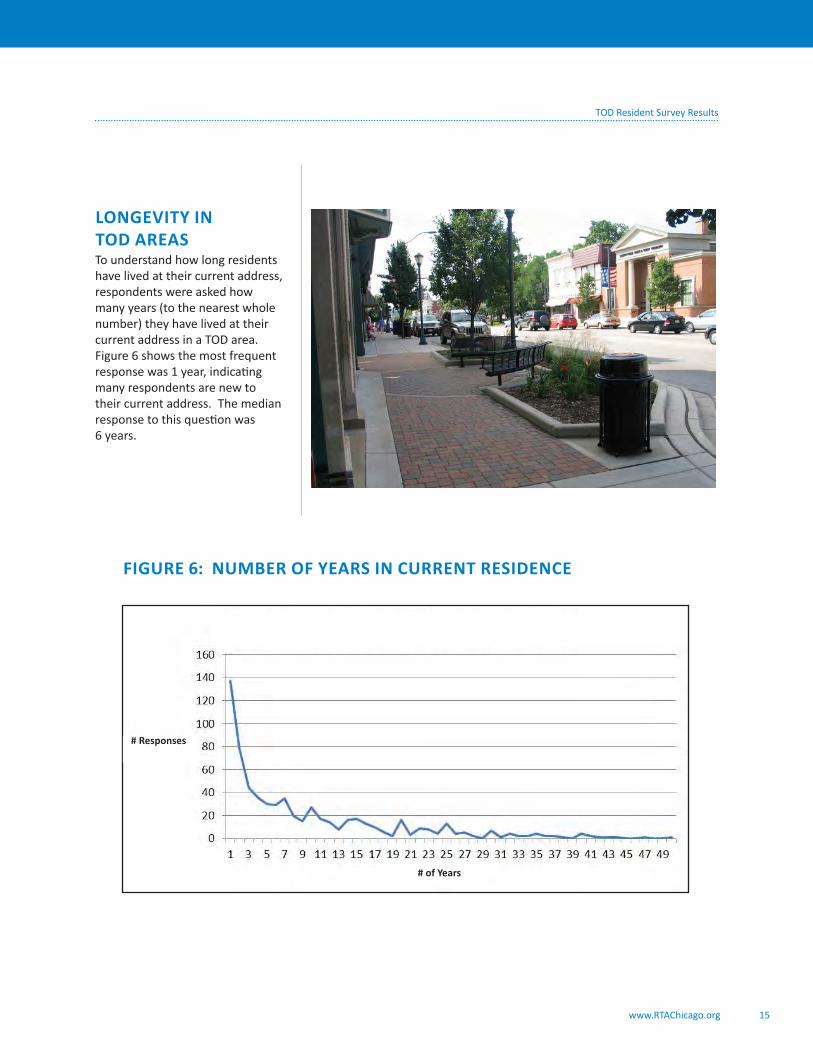
LONGEVITY IN TOD AREAS To understand how long residents have lived at their current address, respondents were asked how many years (to the nearest whole number) they have lived at their current address in a TOD area. Figure 6 shows the most frequent response was 1 year, indicating many respondents are new to their current address. The median response to this question was 6 years.
FIGURE 6: NUMBER OF YEARS IN CURRENT RESIDENCE
# Responses
# of Years

TOD Resident Survey Results
www.RTAChicago.org 16
The respondents’ tenure at their current address, when arranged in age cohorts, shows older respondents living at their current address longer, on average, than younger respondents. The average length of time living at their current address reported by respondents age 65+ was 14 years. For those between the ages of 45-64, the average length of time living at their current address was 12 years. Respondents 44 and younger reported living at their current address an average of approximately 4 years. Average number of years in their current residence by age cohort is shown in Figure 7.
FIGURE 7: AVERAGE NUMBER OF YEARS IN CURRENT RESIDENCE
Aver
age
# of
Yea
rs in
TO
D Ar
ea
Age

TOD Resident Survey Results
www.RTAChicago.org 17
EMPLOYMENT STATUSIn order to inform whether employment status was different between their current and previous place of residence, respondents were asked their employment status both when living at their previous address as well as living at their current address in a TOD area. The majority of respondents reported that they were working full-time at both their previous and current addresses; however fewer respondents
reported working while at their current address compared to when at their previous address. 88% of respondents reported working full or part time at their previous address whereas 79% reported working at their current address. Meanwhile, 3% of respondents reported being retired at their previous address whereas 14% reported being retired at their current address. Figures 8 and 9 show the changes in employment status of respondents.
FIGURE 8: PREVIOUS EMPLOYMENT STATUS
FIGURE 9: CURRENT EMPLOYMENT STATUS
Full time
Part time
Not Working
Retired

TOD Resident Survey Results
www.RTAChicago.org 18
HOME OWNERSHIPResidents were asked questions related to home ownership while living at their previous address as well as at their current address. Respondents reported a change in home ownership from previous to current address with 49% of respondents renting at their previous address but only 39% renting at their current address. 45% reported owning at their previous address however 60% reported they own at their current address. Figure 10 shows the changes in renting and in home ownership of respondents.
FIGURE 10: HOME OWNERSHIP
Live w/Friends or Family
Rent
Own

TOD Resident Survey Results
www.RTAChicago.org 19
HOME CHARACTERISTICS Compact, multi-story, mixed-use residential developments that allow for increased population density while utilizing less land area are typical of TOD areas. To understand whether residents currently live in these types of homes, respondents were asked the type of building they lived in at their previous address as well as at their current address (Figure 11). 30% of the respondents reported living in a mid-rise building at their previous address,
compared to 47% at their current address. Meanwhile, the number of respondents living in single family homes lowered from 40% to 30% at their current address. The number of respondents living in townhomes or row homes stayed fairly similar between the previous and current address location.
The shift from living in a single family detached home to living in a mid-rise, multi-unit residential building is more pronounced when
analyzing the responses to this question by the five categories of residential building type. Regardless of the type of building respondents lived in previously, the most frequently answered question to current building type is a mid-rise, multi-unit building. Conversely, regardless of the type of building respondents currently live in (except for two-flat, three-flat), respondents indicated the most frequently that they lived in a single family home previously.
FIGURE 11: RESIDENTIAL BUILDING TYPE
High-Rise
Mid-Rise Multi-Unit
2 or 3-Flat
Townhome (or Rowhome
Single Family Home

TOD Resident Survey Results
www.RTAChicago.org 20
A shorter commute and more transportation options are typically important considerations for many people searching for a new place to live6. Therefore, it is useful to understand if respondents changed employment locations or their modes of commuting when they moved to their current address. A geospatial analysis was completed for previous and current employment addresses that were
provided by respondents. The employment addresses provided were mapped to show a wide distribution of employment locations throughout the region, with approximately 1/3 of respondents commuting from their previous address to the downtown Chicago area (especially the Loop), and a smaller cluster of employment locations in Evanston. This general breakdown remained the same for
respondents commuting from their current address, with approximately 1/3 of all commuters traveling to downtown Chicago work locations. Of respondents’ previous and current employment addresses, 63% were located within TOD areas. Figures 12 and 13 show the changes in respondent employment locations.
EMPLOYMENT LOCATION
FIGURE 12: PREVIOUS WORK LOCATION
FIGURE 13: CURRENT WORK LOCATION
6 National Association of REALTORS: National Community Preference Survey www.realtor.org/sites/default/files/reports/2013/2013-community-preference-analysis-slides.pdf (2013)
TOD Resident Survey Results
www.RTAChicago.org 21
KEY ATTRACTORS TO TOD NEIGHBORHOODS The concept of moderate to high-density, mixed-use walkable communities is not a recent development. In fact, this traditional type of development was the norm prior to the mass-production of the automobile and the highway system. Prior to then, the majority of people lived in highly compact cities and towns with an intermingling of residences and workplaces with a short journey to work on public transit7. It is assumed that close proximity to public transportation is one of the key attractors to a TOD neighborhood in the Chicago region, even by those who may not use transit. A recent study8 suggests
that while transit (especially rail service) is an important motivating factor to live in a TOD, many residents also consider walkability, proximity to jobs and other amenities when choosing a place to live.
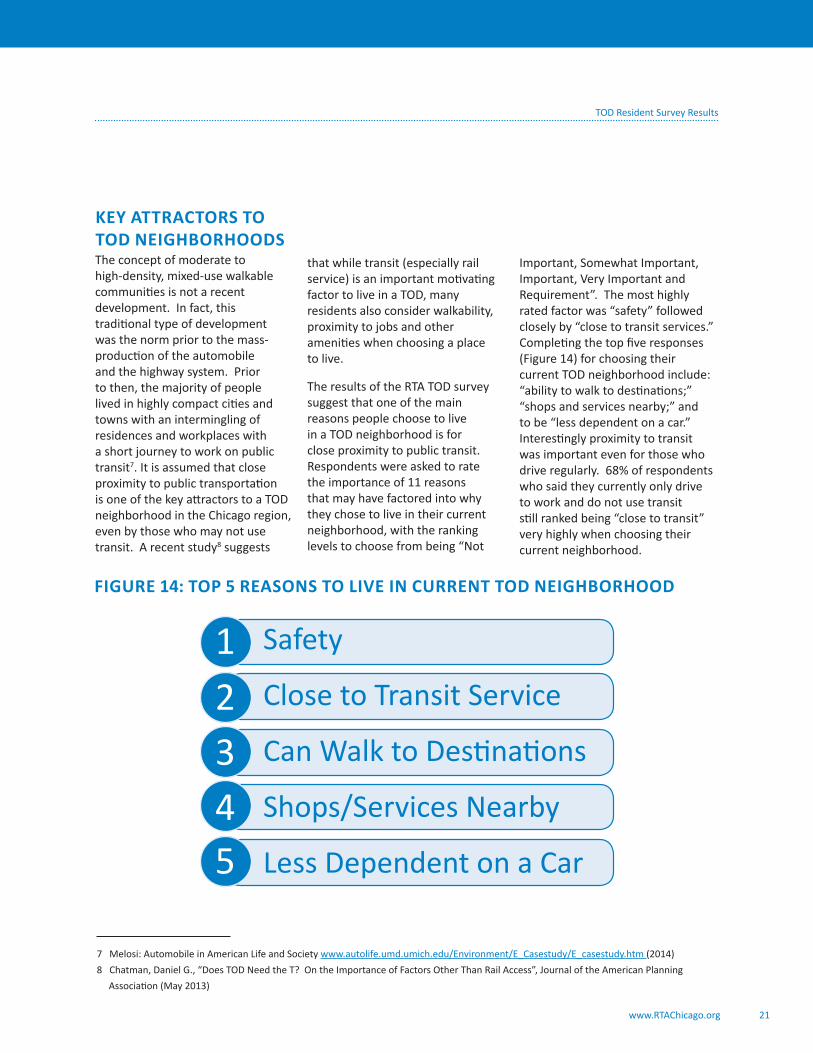
The results of the RTA TOD survey suggest that one of the main reasons people choose to live in a TOD neighborhood is for close proximity to public transit. Respondents were asked to rate the importance of 11 reasons that may have factored into why they chose to live in their current neighborhood, with the ranking levels to choose from being “Not
Important, Somewhat Important, Important, Very Important and Requirement”. The most highly rated factor was “safety” followed closely by “close to transit services.” Completing the top five responses (Figure 14) for choosing their current TOD neighborhood include: “ability to walk to destinations;” “shops and services nearby;” and to be “less dependent on a car.” Interestingly proximity to transit was important even for those who drive regularly. 68% of respondents who said they currently only drive to work and do not use transit still ranked being “close to transit” very highly when choosing their current neighborhood.
12345
Safety
Close to Transit Service
Can Walk to Destinations
Shops/Services Nearby
Less Dependent on a Car
7 Melosi: Automobile in American Life and Society www.autolife.umd.umich.edu/Environment/E_Casestudy/E_casestudy.htm (2014)8 Chatman, Daniel G., “Does TOD Need the T? On the Importance of Factors Other Than Rail Access”, Journal of the American Planning Association (May 2013)
FIGURE 14: TOP 5 REASONS TO LIVE IN CURRENT TOD NEIGHBORHOOD

TOD Resident Survey Results
www.RTAChicago.org 22
A cross tab of family size, age and annual income cohorts with the results of this analysis results in only minor variances from the aggregate data. For respondents who have one or more children under the age of 17 living at home with them, the importance of the school district replaced the ability to be less dependent on an automobile in the top five reasons they chose their current residence. The responses of all age and annual income cohorts were well aligned for this question, with most respondent groups ranking the neighborhood
attractors similarly to the aggregate as a whole.
Alternatively, the ratings also reveal what is not necessarily important for residents who choose to live in a TOD. This does not necessarily mean that these items are not important to residents; they simply are not as important as the top five. The bottom three rated factors include “Can Bike to Destinations,” “School District,” and “High Density Development.” Figure 15 shows how all categories were rated.
FIGURE 15: REASONS TO LIVE IN CURRENT TOD NEIGHBORHOOD
Mixture

TOD Resident Survey Results
www.RTAChicago.org 23
INCREASED USE OF THE TRANSIT SYSTEM From a transit-agency perspective, planning for and implementing TOD are tools for increasing the use of public transit. However, it is difficult to quantify changes in ridership due to TOD because many other factors influence transit ridership such as economic conditions, unemployment and weather. That said, the survey data suggests that a higher use of transit may be occurring in TOD areas. Survey respondents indicated they are driving less in their current neighborhood than in their previous neighborhood, while choosing to use transit and to walk more often. This difference was true for both work and non-work trips.
In a series of four questions, respondents were asked to choose
up to two, from a list of eight, transportation modes that were their primary transportation modes for both their work commute trips and for non-work trips. They were asked this question for both when they lived at their previous address and their current address (Figure 16).
For commute trips the results indicate that 44% of respondents who commuted to work from their previous address drove to work and did not use transit at all. However, this percentage lowered to 30% of respondents at their current address; a “drive only” decline of 14 percentage points. Conversely, commuters using transit to complete all or part of their work trip is higher by 17 percentage points, from 42% of respondents
at their previous address to 59% at their current address, with the highest increases being the use of Metra followed by CTA rail.
Further analysis indicates that 58% of respondents who indicated they only drove to work at their previous address and used no other mode to commute to work now use transit or walk to commute to work at least some of the time, with 46% using transit to commute to work and 12% walking. Similar statistics were observed when analyzing these results against the various household sizes surveyed and suggests that residents may now be using transit more frequently for commuting to work.
FIGURE 16: TRANSPORTATION MODE FOR WORK TRIPS
Carpooled Drive Alone Walked Bicycled Transit Work at
Home
Not
EmployedOther

TOD Resident Survey Results
www.RTAChicago.org 24
Notable mode changes were also identified in respondents’ mode choice for non-work related trips, such as running errands, attending social engagements, etc. (Figure 17). The results for non-work trips show 52% of respondents drove and never used transit when living at their previous address. However, this percentage lowered to 31% of respondents at their current address, a “drive only” decline of 21 percentage points. Conversely, residents using transit to complete all or part of their non-work trips rose 9 percentage points, from 27% of respondents at their previous address to 36% at their current address.
While active means of transportation such as biking and walking remained relatively unchanged as a commuting mode, respondents who walk to complete non-work trips rose 17 percentage points in current locations. At their previous address 24% of respondents indicated they walked for some or all of their non-work trips, and 41% reported walking for some or all of their non-work trips at their current address. Conversely, respondents who bike to complete commute trips as well as non-commute trips decreased when comparing previous address to current address.
FIGURE 17: TRANSPORTATION MODE FOR NON-WORK TRIPS

TOD Resident Survey Results
www.RTAChicago.org 25
VEHICLE OWNERSHIPIN A TOD National research has shown a correlation between living near transit and lower auto ownership. A study of both commute mode and auto distance traveled using data from a subset of 114 U.S. metropolitan areas in the National Household Travel Survey found that living in communities with rail access, bus access, and walkable urban form were all associated with lower auto use9. A study of travel diary data from New York City found that subway lines near home and work were correlated with lower auto use and more walking, while noting that subway lines might be a proxy for walkable neighborhoods.10
Locally, the RTA TOD Resident Survey results show fewer personal
automobiles owned by respondents at their current address compared to their previous. Respondents were asked to indicate the number (whole number) of motorized vehicles available to their household at their previous and current address. The results show (Figure 18) the average number of vehicles owned previously by respondents is 1.5. This number lowered to an average of 1.3 vehicles owned currently. These averages are less (in both previous and current address locations) than the average number of vehicles per household in the suburban Chicago Metro Area, which is 1.6211.
1.31.5
1.62
FIGURE 18: AVERAGE NUMBER OF AUTOMOBILES OWNED
9 Bento , A. M. , Cropper , M. L. , Mobarak , A. M. and Vinha , K. 2005. The impact of urban spatial structure on travel demand in the United States. Review of Economics and Statistics, 87(3): 466–478. 10 Salon , D. 2009. Neighborhoods, cars, and commuting in New York City: A discrete choice approach. Transportation Research Part A: Policy and Practice, 43(2): 180–196. 11 U.S. Census Bureau, Special Tabulation: Census Transportation Planning Products
Current Previous Region Average

TOD Resident Survey Results
www.RTAChicago.org 26
AVAILABILITY OF DEDICATED PARKING IN A TODIn 2010, the RTA Board adopted a TOD Policy12 which includes several objectives, including creating livable communities at and around transit stations and corridors that support quality walking environments and promote multi-modal access. One specific strategy is to encourage appropriate and innovative parking solutions in the context of the development. This can be done by providing bicycle and pedestrian connections to transit facilities, implementing scaled-back parking codes, shared parking, variable pricing, and maximizing on-street parking.
Survey results indicate respondents have more parking spaces reserved and dedicated to their personal use (e.g. in a garage or driveway) at their current address compared to at their previous address. Respondents were asked if they had off-street, non-commuter parking available exclusively to them (including garages, parking lots and driveways) at their previous and current addresses. 74% percent of respondents indicated they had dedicated parking spaces available for their use at their previous address, whereas 79% reported having a dedicated space available at their current address (Figure 19).
26%
74%
21%
79%
12 http://web.rtachicago.org/images/stories/Initiatives/landuse_tod/TOD%20Policy.pdf
Available
Not Available
FIGURE 19: DEDICATED PARKING AVAILABILITY
Previous Address Current Address

TOD Resident Survey Results
www.RTAChicago.org 27
With respondents indicating on average they own fewer vehicles but have the same or more parking available to them could suggest that TOD areas are being developed with more dedicated residential parking than what might be needed.
A more detailed analysis of vehicle ownership shows only 18% of respondents increased the number of vehicles after moving to their current address whereas 81% of respondents either own fewer or maintained the same
number of vehicles after moving to their current address (24% of respondents owning fewer vehicles than before and 57% owning the same number of vehicles).
Of the 24% of respondents who reduced the number of vehicles in their household after moving to their current address, 76% indicated they maintained or gained dedicated parking available to them despite owning fewer vehicles. Only 24% of respondents indicated they no longer have dedicated
parking available to them, which corresponds well with a decrease in the number of vehicles owned (Figure 20).
COMPARING VEHICLE OWNERSHIP AND DEDICATED PARKING IN A TOD
FIGURE 20: DECREASED NUMBER OF VEHICLES AND CHANGE IN PARKING
TOD Resident Survey Results
www.RTAChicago.org 28
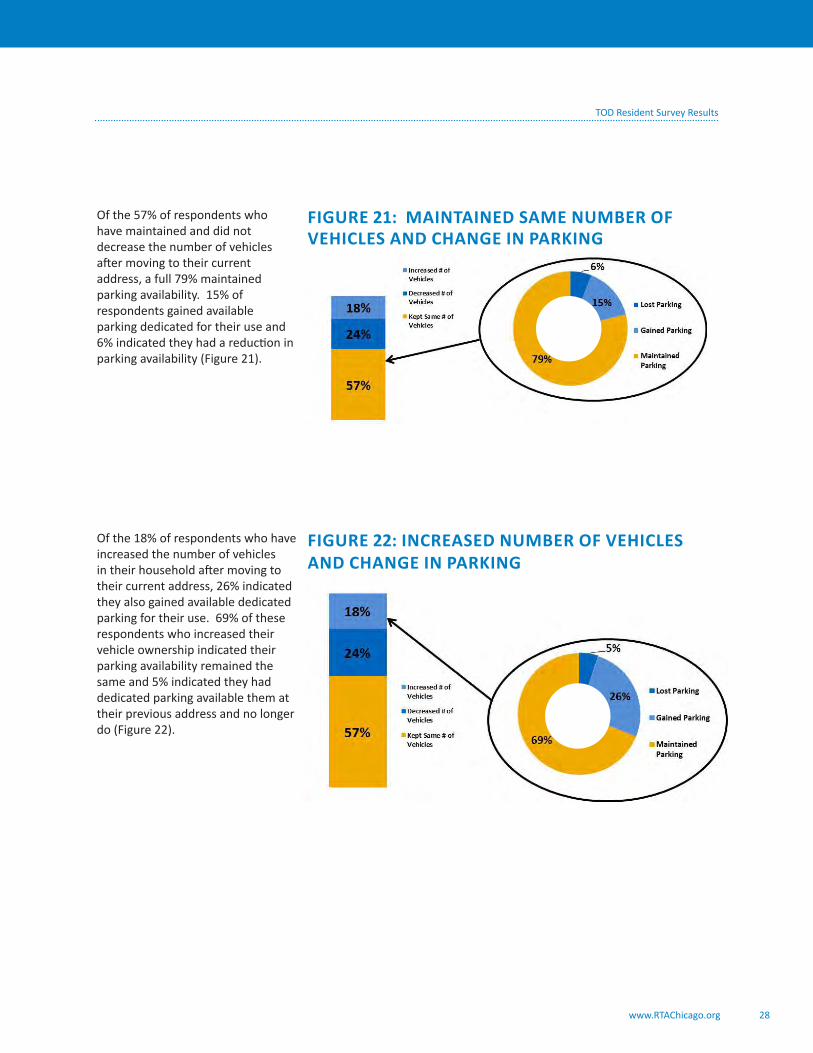
Of the 57% of respondents who have maintained and did not decrease the number of vehicles after moving to their current address, a full 79% maintained parking availability. 15% of respondents gained available parking dedicated for their use and 6% indicated they had a reduction in parking availability (Figure 21).
FIGURE 21: MAINTAINED SAME NUMBER OF VEHICLES AND CHANGE IN PARKING
Of the 18% of respondents who have increased the number of vehicles in their household after moving to their current address, 26% indicated they also gained available dedicated parking for their use. 69% of these respondents who increased their vehicle ownership indicated their parking availability remained the same and 5% indicated they had dedicated parking available them at their previous address and no longer do (Figure 22).
FIGURE 22: INCREASED NUMBER OF VEHICLES AND CHANGE IN PARKING

TOD Resident Survey Results
www.RTAChicago.org 29
CONCLUSIONSA CHANGING MINDSETThe findings of this TOD survey support the national trends of people showing more interest in moving into transit-rich areas13 that are walkable and have a mix of land uses. TOD residents surveyed have a smaller than average household size, have few or no children and many are new to their current residence. The highest number of respondents indicated that they currently reside in a multi-family building. Home ownership was higher for the respondent population in the TOD areas surveyed when compared to respondents’ previous address locations, perhaps indicating life changes that made purchasing a home more attractive. The survey
responses also indicated a higher number of retired respondents, illustrating that the attractiveness of living in a walkable, compact neighborhood near transit is growing in the older adult population.
The survey findings largely support and strengthen what planners know about why people choose to live in a TOD area and how the travel habits of TOD residents may be different from those who live in auto-oriented neighborhoods. The survey results indicate that respondents who live in TOD areas in suburban Chicago chose to live there for their perceived safety, to take advantage
of the proximity to transit service and for improved mobility options that make them less dependent on driving. Additionally, these respondents find TOD areas attractive for their walkability and availability of shops, restaurants and other convenience services. According to the survey results, TOD respondents walk and use transit more and drive less for trips now compared to at their previous address. Respondents indicate their driving has trended downward, especially for commute trips, while walking and using transit have trended upward, especially for non-commute trips.
13 American Public Transportation Association “Millennials and Mobility; Understanding the Millennial Mindset” (2014)

TOD Resident Survey Results
www.RTAChicago.org 30
The analysis also indicates many respondents’ work locations have not changed after moving to their current address, while their use of transit to commute is on the rise. This change in respondents using transit more and driving less to get to work, combined with the finding that work locations remained relatively stable between respondents’ previous and current addresses, could suggest that respondents are moving into TOD areas more for the ability to shift their commute mode than for a change in work location. Respondents owned fewer vehicles on average after moving to their
current TOD area, but parking availability was slightly higher. This represents a potential mismatch of residential parking availability to actual vehicle ownership and usage. While the TOD residents surveyed may still require a vehicle for certain trips, they own fewer vehicles and choose other modes of transport over driving more frequently than the regional average. Often the most contentious aspect of proposed TOD projects is the amount of parking proposed or required in a development. Developers respond to market demands for parking while communities evaluate
proposed parking ratios based on how the new development will affect current parking availability in the surrounding area. The nature of this dichotomy may produce more parking than is needed, as suggested by the responses to this survey. Developments in the TOD areas surveyed may be providing parking in excess of what is needed based on reported lower vehicle ownership, lower vehicle usage and higher transit usage for commute and non-commute travel, however, further analysis may be required to better understand this issue.
TOD Resident Survey Results
www.RTAChicago.org 31
RECOMMENDATIONS
Survey respondents reported owning fewer vehicles than at their previous addresses and fewer vehicles than the regional average. Additionally, survey respondents indicated that they are driving less and using transit and walking more than at their previous address. This suggests that, according to survey responses, less residential parking may be needed in TOD areas than is currently provided. It is important to note that this recommendation is focused on residential parking, as that was the focus of the survey, but the issue could also be investigated further for commercial uses.
Municipalities and developers should explore innovative parking strategies that reduce required parking spaces when assessing potential development in TOD areas. Traditional parking requirements created based on
standards rather than market analysis and usage characteristics may result in too much parking in the TOD areas surveyed, thereby using space that could be made available for other development opportunities, degrading the pedestrian environment and adding costs to residential homes.
The RTA published an Access and Parking Strategies for TOD Guide14 as a resource for municipal officials looking for innovative strategies to support multi-modal access to their transit station and TOD area. Other resources available for use include the “Step-by-Step Guide to Municipal Reform of Parking Policies” published by the Chicago Metropolitan Agency for Planning, as well as studies and other tools developed by the Congress for New Urbanism and the Center for Neighborhood Technology.
Implementing a variety of multi-modal access improvements and parking strategies can influence community development and travel behavior. A lesser-known impact is that on the economics of private development; excess parking can drive up development costs lowering the return on investment for developers and ultimately impacting the affordability of housing and commercial space. If less parking is required in TODs, such projects can attract those people in search of affordable housing that promotes a lifestyle less dependent on private vehicle use.
RIGHT-SIZE RESIDENTIAL PARKINGTarget Audience: Municipalities, Developers
14 RTA Access and Parking Strategies for TOD: web.rtachicago.org/images/stories/Initiatives/landuse_tod/TOD%20Parking%20and%20 Access%20Report%20Web_Final.pdf (2011)
1

TOD Resident Survey Results
www.RTAChicago.org 32
The survey demographics show an increasing amount of retirees choosing to move into TOD areas as well as people who have no children under the age of 17 living in the household. Twenty-one percent of respondents also reported previously living in the City of Chicago before moving to a suburban TOD area.
Municipalities and developers should market their TOD communities to the specific
demographics that are attracted to TOD areas, including retirees, Chicago residents looking for an urban lifestyle in the suburbs, residents currently living in auto-oriented suburban neighborhoods, and households with no children living at home.
Successful suburban TOD areas can attract urban residents by offering amenities similar to an urban setting, such as a pedestrian-friendly environment close to transit. This
can be achieved through targeted marketing campaigns or outreach to developers that specialize in active adult and senior housing development.
IMPROVE TOD MARKETING EFFORTS TO TARGET SPECIFIC MARKET DEMOGRAPHICSTarget Audience: Communities, Developers
2
TOD Resident Survey Results
www.RTAChicago.org 33
Survey responses illustrate the importance of safety, walkability and access to transit in TOD areas. The top three reasons respondents choose to live in their TOD area are safety, to be close to transit service and to be able to walk to destinations. Respondents also indicated that walking to complete errands and other non-work trips nearly doubled after moving into a TOD area.
Communities and developers should plan for, fund and build pedestrian infrastructure that ensures safe pedestrian mobility and access to transit throughout their TOD area.
Walkable TODs should include a pedestrian infrastructure that prioritizes walking above all other modes. This can be achieved by providing continuous and connecting sidewalks, crosswalks, pedestrian signal heads, pedestrian
refuges at intersections, and clear wayfinding signage, all while complying with ADA requirements. These items are all vital factors in providing accessibility to transit for all TOD residents. Improved access can be achieved through planning efforts that identify necessary improvements and by allocating or pursuing capital funding sources to implement improvements.
FURTHER INVEST IN OR IMPROVE WALKABILITY, SAFETY AND PEDESTRIAN ACCESS TO TRANSITTarget Audience: Communities, Transit Agencies, Developers
ENCOURAGE EMPLOYERS TO BE TRANSIT-SUPPORTIVETarget Audience: Communities, Developers, Employers
Survey respondents indicated that their places of employment remained largely unchanged despite moving. This is evidenced by one third of all respondent employment locations remaining in downtown Chicago and two thirds remaining in close proximity to train stations. Additionally, respondents who indicate that they use transit to get to and from their places of employment increased 17% after moving into a TOD area. These results suggest that TOD residents increasingly are interested in taking transit to their place of employment, which is only feasible if their work location is accessible via transit as well.
Both the origin and destination of a work trip need to be in close proximity to transit in order for transit to be an attractive mode for commuting to work. People living in TOD areas have convenient access to transit, therefore it is important for employers to be transit-supportive and to ensure that employers locate and remain located near transit. This can be accomplished through providing education to business owners, incentivizing employers at the municipal level, and highlighting the added health benefits and commute cost savings that transit use offers employees.
Employers should make every effort to support their employee’s use of transit as a commuting priority. Employers can help make public transit a commute option for employees by locating their offices and facilities within close proximity to transit to enable convenient and quick access to jobs via transit for their employees. Employers can also improve access infrastructure to their locations from transit stations, provide pre-tax transit benefits to employees, and consider providing or subsidizing transit services, such as shuttles, when the nearest transit station is too distant from their location to walk.
3
4

TOD Resident Survey Results
www.RTAChicago.org 34
ADDITIONAL FOCUS ON INCLUDING NEIGHBORHOOD AMENITIES IN TOD AREAS Target Audience: Communities, Developers
The survey data indicates respondents choose to live in TOD areas for many reasons, including proximity to a mix of uses such as shops, commercial destinations, and other community and neighborhood amenities. They also are choosing to walk more to these destinations.
Municipalities should ensure that their TOD areas offer a full range of uses, at a scale appropriate for the market, that address the everyday needs of residents. These can include a local grocery, restaurants,
pharmacies and other services, while avoiding offering limited services, such as only a coffee shop and dry cleaner.
Local land use policies (such as zoning regulations) should allow these types of uses in TOD areas. Additionally, communities may consider focusing marketing efforts and providing incentives to attract these types of uses in their TOD areas. The development community could also focus efforts on creating mixed-use
developments that include uses that address unmet needs in the TOD area. This not only helps to drive the local economy, but also encourages residents to support local business, use their car less and spend money in their community. A wide range of neighborhood amenities can be attractive to those interested in living in a more compact, walkable community.
5

TOD Resident Survey Results
www.RTAChicago.org 35
FURTHER RESEARCHAdditional research and analysis is needed to further confirm and strengthen the findings of the RTA TOD resident survey. Listed below are tasks that could be undertaken to provide more detail to the survey findings and further inform TOD planning and implementation efforts.
PARKING UTILIZATIONParking utilization data will lead to a better understanding of parking utilization in TOD areas. Data collection to observe the use of available parking spaces by residents helps to develop an understanding of how existing parking is being used. This, combined with the survey data about decreased vehicle ownership and an increase in dedicated parking availability, would be beneficial to municipalities and developers when exploring innovative parking strategies that reduce required parking spaces in TOD areas.
SHIFTS IN COMMUTE MODEFurther study and data collection regarding individual shifts in commute mode for work trips would provide better information about individual behavioral changes in mode choice when moving from a non-TOD area to a TOD area. This could be accomplished through more in-depth analysis of the existing TOD resident survey data and by conducting follow-up surveys asking more pointed questions about commuting behaviors.
COMMUTER RAIL RIDERSHIP ANALYSISAnalysis of boarding and alighting data at the station level as well as data regarding mode of access to a station will help to better understand the impact that residents living in a TOD area have on transit ridership over time. Metra conducted on-board surveys across their entire system in early 2014 which can be used to conduct station level boarding and mode of access analysis.
TOD VS. NON-TOD ANALYSISData similar to the data collected for this report could be obtained for areas not considered to be TOD areas. The data can then be analyzed to make comparisons of TOD residents to those who live in Non-TOD areas.
BUSINESS LOCATION DATA COLLECTION In order for commuters to choose to use transit to get to and from work not only do they need good access to transit from their homes but also good access to transit from their places of work. Additional data could be obtained to further understand how business owners choose to locate their businesses thereby informing not only future comprehensive and TOD planning efforts but also transit service planning.
TOD Resident Survey Results
www.RTAChicago.org 36
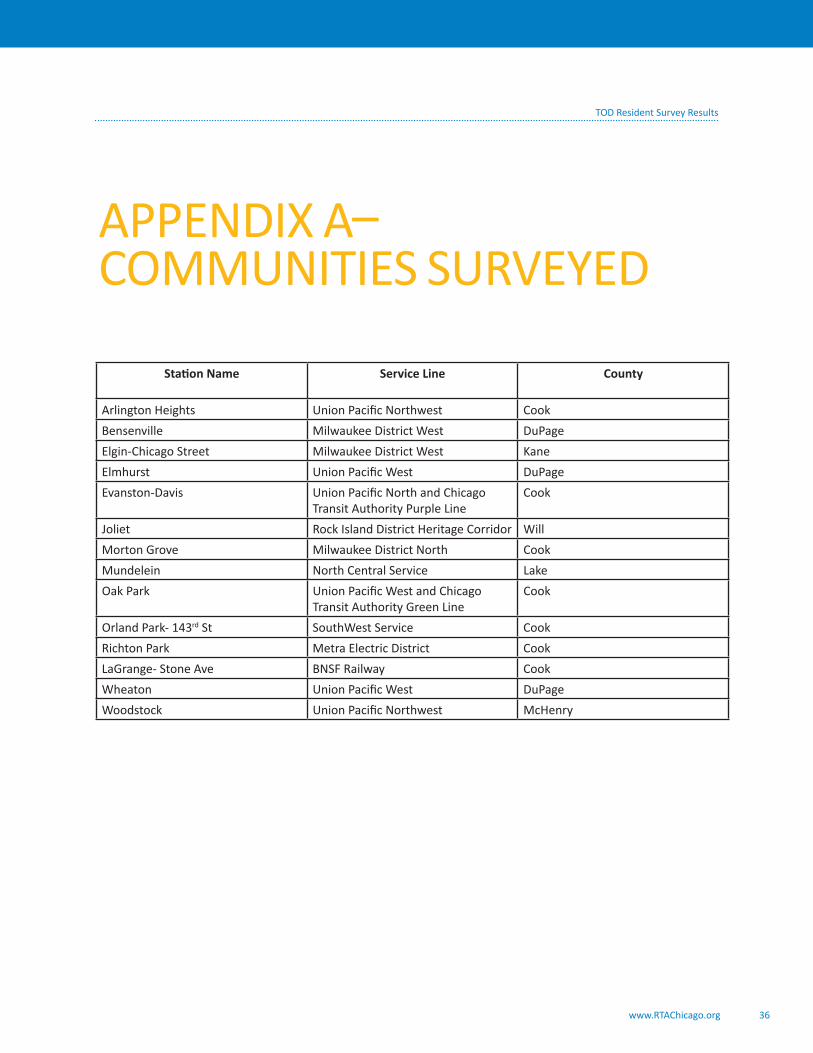
APPENDIX A– COMMUNITIES SURVEYED
Station Name Service Line County
Arlington Heights Union Pacific Northwest CookBensenville Milwaukee District West DuPageElgin-Chicago Street Milwaukee District West KaneElmhurst Union Pacific West DuPageEvanston-Davis Union Pacific North and Chicago
Transit Authority Purple LineCook
Joliet Rock Island District Heritage Corridor WillMorton Grove Milwaukee District North CookMundelein North Central Service LakeOak Park Union Pacific West and Chicago
Transit Authority Green LineCook
Orland Park- 143rd St SouthWest Service CookRichton Park Metra Electric District CookLaGrange- Stone Ave BNSF Railway CookWheaton Union Pacific West DuPageWoodstock Union Pacific Northwest McHenry

TOD Resident Survey Results
www.RTAChicago.org 37
APPENDIX B – SURVEY INSTRUMENT

The Regional Transportation Authority (RTA) is inviting you to participate in a 5 to 10 minute survey as part of a study on the effect that living in a neighborhood designed around transit has on an individual’s travel behaviors. The goal of this research is to gain a better understanding of how travel patterns change when an individual moves from a neighborhood that is primarily designed around the assumption its residents will travel by car, to a neighborhood that is designed with convenient access to public transportation. You will be asked questions about your household and your current travel and transportation habits compared to your former travel and transportation habits at your previous home. Participating in this survey is completely voluntary. If you choose to participate you may elect to skip any questions that you do not wish to answer. Participation in this survey is completely anonymous. Any information you choose to share with the RTA will be kept strictly confidential, and used only for the purpose of this study. At the end of the survey you will have the opportunity to register for the opportunity to win 1 of 2 $100 gift cards. Please use the "Next" and "Previous" buttons at the bottom of the screen to navigate the survey. Please do not use your web browser's "forward" and "back" buttons. Please click "Next" to begin.
1. Approximately how many years have you lived in your current home? (nearest whole number)
2. What factors prompted you to move from your previous home to your current home? (check all that apply)
Copy of page: Please tell us about yourself.
New Job
gfedc
Growing Family Size
gfedc
Newly Retired
gfedc
Closer to School
gfedc
Recent “EmptyNester”
gfedc
Close to Friends / Relatives
gfedc
Other (please specify)
gfedc

4. Including yourself, how many people currently live in your household?
5. How many children age 17 or younger live in your household?
Answer the following questions based on where you resided prior to your current home, (left side of page) and then based on your current home (right side of page).
3. People’s reasons for selecting a new neighborhood may vary. Please rate the following factors that attracted you to your current neighborhood.
Not Important
Somewhat Important
ImportantVery
ImportantRequirement
Shops / services are nearby nmlkj nmlkj nmlkj nmlkj nmlkj
Close to transit service nmlkj nmlkj nmlkj nmlkj nmlkj
Mixture of retail/residential/commercial
nmlkj nmlkj nmlkj nmlkj nmlkj
Close to leisure activities nmlkj nmlkj nmlkj nmlkj nmlkj
High density development nmlkj nmlkj nmlkj nmlkj nmlkj
Neighborhood architecture nmlkj nmlkj nmlkj nmlkj nmlkj
Can walk to destinations nmlkj nmlkj nmlkj nmlkj nmlkj
Safety nmlkj nmlkj nmlkj nmlkj nmlkj
Can bike to destinations nmlkj nmlkj nmlkj nmlkj nmlkj
Less dependent on a car nmlkj nmlkj nmlkj nmlkj nmlkj
School district nmlkj nmlkj nmlkj nmlkj nmlkj
Please tell us about your household.
Please tell us about your living situation.
None
nmlkj
1
nmlkj
2
nmlkj
3
nmlkj
4
nmlkj
More than 4
nmlkj

6. What is your previous home address? (Supply as much information as you're comfortable with.)
7. What is your current home address? (Supply as much information as you're comfortable with.)
8. What type of building did you live in at your previous address?
9. What type of building do you currently live in?
10. Was your previous home....
Street Address
OR Nearest Intersection
City
State
Street Address
OR Nearest Intersection
City
State
Detached singlefamily house
nmlkj
Rowhouse or townhouse
nmlkj
TwoFlat or ThreeFlat
nmlkj
MidRise MultiUnit Building
nmlkj
HighRise
nmlkj
Other (please specify)
Detached singlefamily house
nmlkj
Rowhouse or Townhouse
nmlkj
Twoflat or Threeflat
nmlkj
Midrise multiunit building
nmlkj
Highrise
nmlkj
Other (please specify)
Owned by you or someone in your household
nmlkj
Rented
nmlkj
Occupied without payment of rent (for example, lived with friends or relatives)
nmlkj

11. Is your current home...
12. At your previous home you worked...
13. Currently you work
Answer the following questions based on where you resided prior to your current home, (left side of page) and then based on your current home (right side of page).
14. What is the address of your WORK location at your previous home? (skip if you were not working)
15. What is the address of your current WORK location? (skip if you are not working)
Please tell us about your workrelated transportation.
Street address
OR Nearest intersection
City
State
Street address
OR Nearest Intersection
City
State
Owned by you or someone in your household
nmlkj
Rented
nmlkj
Occupied without payment of rent (for example, lived with friends or relatives)
nmlkj
Full time
nmlkj
Part time
nmlkj
Was not working at the time
nmlkj
Retired
nmlkj
Full time
nmlkj
Part time
nmlkj
Currently not working
nmlkj
Retired
nmlkj

16. For the primary, largest portion of your commute, how did you USUALLY commute throughout the year to work from your previous home? (Select up to two)
17. For the primary, largest portion of your commute, how do you USUALLY commute throughout the year to work from your current home? (Select up to two)
Carpooled
gfedc
Drove alone
gfedc
Walked
gfedc
Bicycled
gfedc
Rode Metra
gfedc
Rode a CTA bus
gfedc
Rode a CTA train (L)
gfedc
Rode a Pace bus
gfedc
Worked at home
gfedc
Was not employed
gfedc
Other / Out of this region (please specify)
Carpool
gfedc
Drive alone
gfedc
Walk
gfedc
Bike
gfedc
Ride Metra
gfedc
Ride a CTA bus
gfedc
Ride a CTA train (L)
gfedc
Ride a Pace bus
gfedc
Work at home
gfedc
Am not employed
gfedc
Other (please specify)

18. If you usually drove to work from your previous home, did you have a transit option that you could have used and that worked for your daily schedule?
19. If you usually drive to work now, do you have a transit option that you can use and that works for your daily schedule?
Answer the following questions based on where you resided prior to your current home, (left side of page) and then based on your current home (right side of page).
20. At your previous home how many trips in a typical week, including weekends, did you make other than for work? (For example, a trip for children's activities, grocery/clothing/household shopping, drycleaner, school, doctor, visiting friends/family, religious activities, social activities, recreation, etc.)
21. How many trips in a typical week, including weekends, do you currently make other than for work? (For example, a trip for children's activities, grocery/clothing/household shopping, drycleaner, school, doctor, visiting friends/family, religious activities, social activities, recreation etc.)
Please tell us about your transportation not related to work.
Yes, transit could have worked for my commute but I chose not to use it.
nmlkj
Yes, transit was available but the service schedule didn't work for my schedule.
nmlkj
Yes, transit was available but a physical barrier (missing sidewalks, no elevator, etc.) prevented me from using the service.
nmlkj
No, transit service was not available.
nmlkj
N/A I didn't drive to work.
nmlkj
Yes, transit could work for my commute but I choose not to use it.
nmlkj
Yes, transit is available but the service schedule doesn't work for my schedule.
nmlkj
Yes, transit is available but a physical barrier (missing sidewalks, no elevator, etc.) prevents me from using the service.
nmlkj
No, transit service is not available.
nmlkj
N/A I don't drive to work.
nmlkj
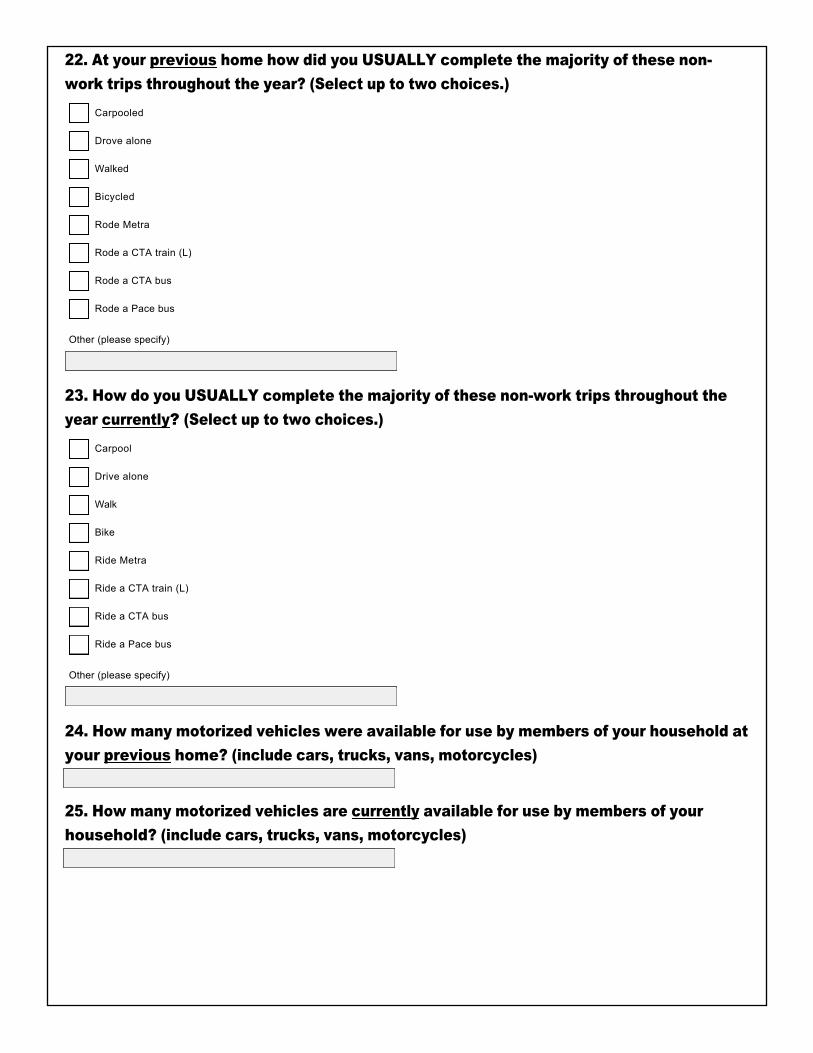
22. At your previous home how did you USUALLY complete the majority of these nonwork trips throughout the year? (Select up to two choices.)
23. How do you USUALLY complete the majority of these nonwork trips throughout the year currently? (Select up to two choices.)
24. How many motorized vehicles were available for use by members of your household at your previous home? (include cars, trucks, vans, motorcycles)
25. How many motorized vehicles are currently available for use by members of your household? (include cars, trucks, vans, motorcycles)
Carpooled
gfedc
Drove alone
gfedc
Walked
gfedc
Bicycled
gfedc
Rode Metra
gfedc
Rode a CTA train (L)
gfedc
Rode a CTA bus
gfedc
Rode a Pace bus
gfedc
Other (please specify)
Carpool
gfedc
Drive alone
gfedc
Walk
gfedc
Bike
gfedc
Ride Metra
gfedc
Ride a CTA train (L)
gfedc
Ride a CTA bus
gfedc
Ride a Pace bus
gfedc
Other (please specify)

26. At your previous home did you have offstreet parking spaces available exclusively for your household use? (Include your garage, driveway, or spaces in a parking lot that were reserved for you.)
27. Do you currently have offstreet parking spaces available exclusively for your household use? (Include your garage, driveway, or spaces in a parking lot that were reserved for you.)
28. At your previous home were you a member of a carsharing program? (such as Zipcar, iGo)
29. Are you currently a member of a carsharing program? (such as Zipcar, iGo)
30. What is your age?
31. What is your gender?
Demographic Questions
Yes, I had one or more parking spaces dedicated to me for my use.
nmlkj
No, I did not have a parking space dedicated for only my use.
nmlkj
Yes, I have one or more parking spaces dedicated to me for my use.
nmlkj
No, I do not have a parking space dedicated for only my use.
nmlkj
Yes private membership
nmlkj
Yes corporate membership
nmlkj
No
nmlkj
Yes private membership
nmlkj
Yes corporate membership
nmlkj
No
nmlkj
Female
nmlkj
Male
nmlkj
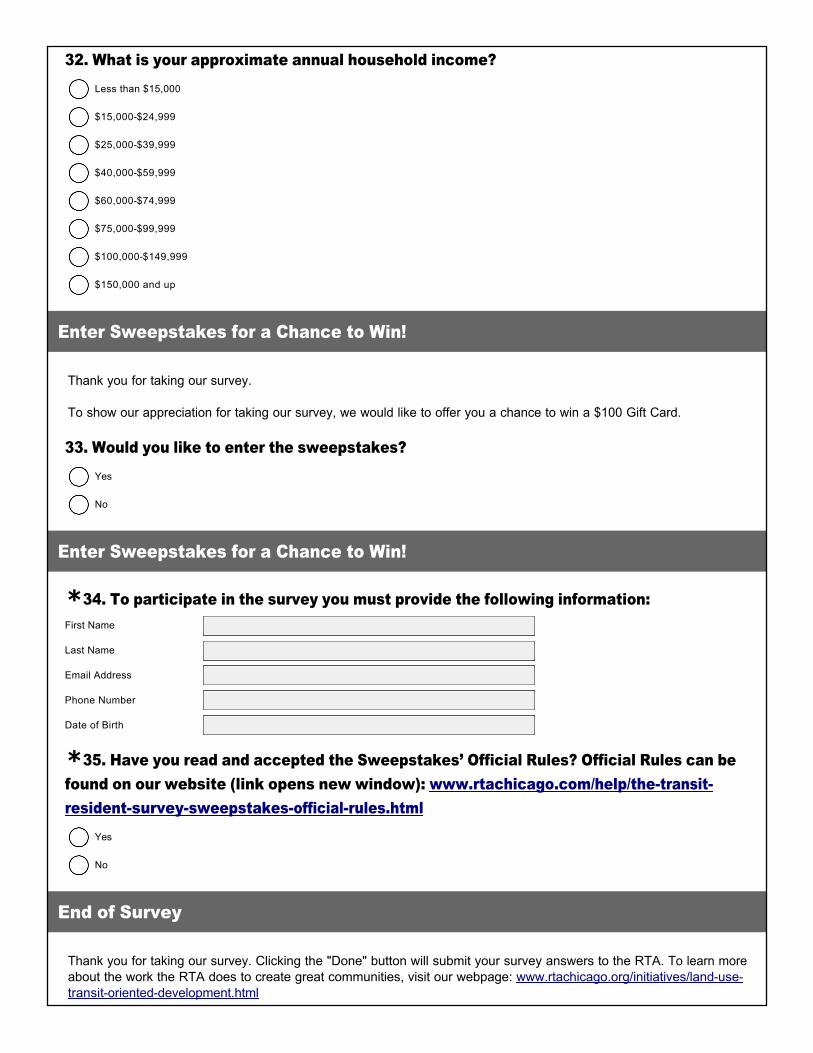
32. What is your approximate annual household income?
Thank you for taking our survey. To show our appreciation for taking our survey, we would like to offer you a chance to win a $100 Gift Card.
33. Would you like to enter the sweepstakes?
34. To participate in the survey you must provide the following information:
35. Have you read and accepted the Sweepstakes’ Official Rules? Official Rules can be found on our website (link opens new window): www.rtachicago.com/help/thetransitresidentsurveysweepstakesofficialrules.html
Thank you for taking our survey. Clicking the "Done" button will submit your survey answers to the RTA. To learn more about the work the RTA does to create great communities, visit our webpage: www.rtachicago.org/initiatives/landusetransitorienteddevelopment.html
Enter Sweepstakes for a Chance to Win!
Enter Sweepstakes for a Chance to Win!
*First Name
Last Name
Email Address
Phone Number
Date of Birth
*
End of Survey
Less than $15,000
nmlkj
$15,000$24,999
nmlkj
$25,000$39,999
nmlkj
$40,000$59,999
nmlkj
$60,000$74,999
nmlkj
$75,000$99,999
nmlkj
$100,000$149,999
nmlkj
$150,000 and up
nmlkj
Yes
nmlkj
No
nmlkj
Yes
nmlkj
No
nmlkj