Liu Weilin 2011 Thesis
121
REAL-TIME INTERROGATION OF FIBER BRAGG GRATING SENSORS BASED ON CHIRPED PULSE COMPRESSION By Weilin Liu Thesis submitted to the Faculty of Graduate and Postdoctoral Studies In partial fulfillment of t he requirements of Master of Applied Science Ottawa-Carleton Institute of Electrical and Computer Engineering School of Electrical Engineering and Computer Science University of Ottawa © Weilin Liu, Ottawa, Canada, 2011
-
Upload
thiago-coelho -
Category
Documents
-
view
221 -
download
0
Transcript of Liu Weilin 2011 Thesis
8/2/2019 Liu Weilin 2011 Thesis
http://slidepdf.com/reader/full/liu-weilin-2011-thesis 1/121
REAL-TIME INTERROGATION OF FIBER BRAGG GRATING
SENSORS BASED ON CHIRPED PULSE COMPRESSION
By
Weilin Liu
Thesis submitted to the
Faculty of Graduate and Postdoctoral Studies
In partial fulfillment of the requirements of Master of Applied Science
Ottawa-Carleton Institute of Electrical and Computer Engineering
School of Electrical Engineering and Computer Science
University of Ottawa
© Weilin Liu, Ottawa, Canada, 2011

8/2/2019 Liu Weilin 2011 Thesis
http://slidepdf.com/reader/full/liu-weilin-2011-thesis 2/121
i
ACKNOWLEDGEMENTS
First of all, I would like to express my great gratitude to my thesis advisor,
Professor Jianping Yao, for providing me with excellent research environment,
valuable directions and delicate guidance throughout this research work. His
meticulous scholarship impresses me. His great passion towards scientific
research work inspires me to work hard. His rich knowledge has made him as a
constant source of ideas. Without his encouragement and patience, this work
would have never been finished.
I would also like to thank the present and former colleagues in the Microwave
Photonics Research Laboratory: Shilong Pan, Chao Wang, Ming Li, Wangzhe Li,
Ze Li, Honglei Guo, Yichen Han, Hiva Shahoei, Hongqian Mu and Junqiang
Zhou. Their strong supports and generous help greatly improved my research
work. The memory of working with them is one of the precious treasures in my
life.
Finally I am greatly indebted to my beloved family: my father Fanping Liu, my
mother Suying Zuo, and my sister Yihua Liu. They have always been the biggest
support, physically and mentally, to my life and study.

8/2/2019 Liu Weilin 2011 Thesis
http://slidepdf.com/reader/full/liu-weilin-2011-thesis 3/121
ii
TABLE OF CONTENTS
ACKNOWLEDGEMENTS ...................................................................................... i TABLE OF CONTENTS ........................................................................................ ii LIST OF ACRONYMS ........................................................................................... v
LIST OF FIGURES .............................................................................................. vii ABSTRACT ............................................................................................................ xi Chapter 1 Introduction ............................................................................................. 1
1.1 Background review ........................................................................................ 1 1.2 Major contributions........................................................................................ 7 1.3 Organization of this thesis ............................................................................. 9
Chapter 2 Review of FBG sensor Interrogation .................................................... 10 2.1 FBG Sensor Structure .................................................................................. 10 2.2 Interrogation Techniques ............................................................................. 14
2.2.1 Edge filter ............................................................................................. 15 2.2.2 Tunable filter ......................................................................................... 18 2.2.3 Interferometric scanning ....................................................................... 21 2.2.4 Dual-cavity interferometric scanning ................................................... 25 2.2.5 Direct spectrum analysis ....................................................................... 28
8/2/2019 Liu Weilin 2011 Thesis
http://slidepdf.com/reader/full/liu-weilin-2011-thesis 4/121
iii
a. Agilent Technologies: http://www.home.agilent.com ................................... 28 b. HORIBA Scientific: http://www.horiba.com 2.3 Discrimination of strain and
temperature ........................................................................................................ 28 2.4 Summary ...................................................................................................... 34
Chapter 3 Theoretical Model: Chirped Pulse Generation with Encoded
Measurement Information...................................................................................... 35 3.1 Basic Concepts ............................................................................................. 35 3.2 Photonic Generation of a Linearly Chirped Pulse ....................................... 38 3.3 Chirped Pulse Compression Technique ....................................................... 45 3.4 Summary ...................................................................................................... 57
Chapter 4 Real-Time Interrogation of an LCFBG Sensor ..................................... 58 4.1 Interrogation System Introduction ............................................................... 58 4.2 Numerical Simulation .................................................................................. 59 4.3 Experiment ................................................................................................... 65 4.4 Summary ...................................................................................................... 71
Chapter 5 Simultaneously Measurement of Temperature and Strain .................... 72 5.1 Interrogation System Introduction ............................................................... 72 5.2 Experiment ................................................................................................... 78 5.3 Summary ...................................................................................................... 84
Chapter 6 Conclusions and Future Work ............................................................... 85

8/2/2019 Liu Weilin 2011 Thesis
http://slidepdf.com/reader/full/liu-weilin-2011-thesis 5/121
iv
6.1 Conclusions .................................................................................................. 85 6.2 Future work .................................................................................................. 88
REFERENCES ...................................................................................................... 90 LIST OF PUBLICATIONS ................................................................................. 108
8/2/2019 Liu Weilin 2011 Thesis
http://slidepdf.com/reader/full/liu-weilin-2011-thesis 6/121
v
LIST OF ACRONYMS
A
A/D analogue-to-digital
convertor
B
BPF bandpass filter
BTP bandwidth-time product
C
CCD charge coupled device
CRC Communications Research
Center
D
DCF dispersion compensating
fiber
DL delay line
E
EMI immunity to
electromagnetic interference
F
FBG Fiber Bragg grating
FSR increasing free spectral
range
FWHM full-width at
half-maximum
H
Hi-Bi LCFBG high-birefringence
LCFBG
I
IMG index matching gel
L
LCFBG linearly chirped fiber
Bragg grating
LPG long-period fiber grating
M
MLL mode-locked laser
MZI Mach-Zehnder
interferometer
O
OSA optical spectrum analyzer
8/2/2019 Liu Weilin 2011 Thesis
http://slidepdf.com/reader/full/liu-weilin-2011-thesis 7/121
vi
P
PC polarization controller
PD photodetectorPMF polarization maintaining
fiber
PZT piezoelectric transducer
S
SIWS stepped Michelson
interferometric wavelengthscanning
SLD super-luminescent diode
SMF single-mode fibers
SNR signal-to-noise ratio
SS-WTT spectral-shaping and
wavelength-to-time
T
TOF tunable optical filter
W
WDM wavelength division
multiplexing
WTT wavelength-to-time

8/2/2019 Liu Weilin 2011 Thesis
http://slidepdf.com/reader/full/liu-weilin-2011-thesis 8/121
vii
LIST OF FIGURES
Number Page
Fig. 2.1. Types of fiber gratings………………………………………………….14
Fig. 2.2. Principle of edge filter method…………………………………………18
Fig. 2.3. Block diagram of an interrogation system based on a linear edge filter
[39].………………………………………………………………………………19
Fig. 2.4. Principle of the tunable filter method…………………………………..21
Fig. 2.5. Schematic diagram of an FBG interrogator based on a tunable
Fabry-Pérot filter [46]………………………………………………..………….22
Fig. 2.6. Principle of the interferometric scanning method……………………...24
Fig. 2.7. Schematic diagram of an interferometric scanning scheme [56].0
is
the initial phase difference between the signal and the modulation waveform;
B is the optical phase change induced by a strain or temperature
change……………………………………………………………….…………...26
Fig. 2.8. Principle of the dual-cavity interferometric scanning scheme…………28
Fig. 2.9. An interrogator based on the dual-cavity interferometer scanning scheme
[65]: SLED, superluminescent light-emitting diode; SIWS, stepped Michelson
8/2/2019 Liu Weilin 2011 Thesis
http://slidepdf.com/reader/full/liu-weilin-2011-thesis 9/121
viii
interferometric wavelength scanning; BPF, bandpass filter; A/D,
analogue-to-digital convertor…………………………………………..………...29
Fig. 3.1. Schematic of a chirped pulse generation system based on SS-WTT
mapping………..…………………………………………………………………38
Fig. 3.2. The definition of the rectangular functions…………………………….47
Fig. 4.1. The reference microwave waveform which has an instantaneous
frequency range from 0 GHz to 47.6 GHz……………………………………….58
Fig. 4.2. A linear chirped microwave waveform with 300c
t ps ………..…...59
Fig. 4.3. A linear chirped microwave waveform with 300c
t ps ...………...59
Fig. 4.4. The correlation outputs…………………………………………………61
Fig. 4.5. The waveform in Fig. 4.2 with an added stationary white noise………61
Fig. 4.6. The correlation with the noisy waveform shown in Fig. 4.5…………..62
Fig. 4.7. The experimented special reference waveform………………………...63
Fig. 4.8. A linearly chirped microwave waveform when a strain of 71.5 µ is
applied to the LCFBG…………………………………………………………....64
Fig. 4.9. A linearly chirped microwave waveform when a strain of 406.9 µ is
applied to the LCFBG…………………………………………………………....64
Fig. 4.10. A linearly chirped microwave waveform when a strain of 484.2 µ is
applied to the LCFBG……………………………………………………………65

8/2/2019 Liu Weilin 2011 Thesis
http://slidepdf.com/reader/full/liu-weilin-2011-thesis 10/121
ix
Fig. 4.11. Correlation outputs for the microwave waveforms shown in Fig. 4.8,
Fig. 4.9 and Fig. 4.10………………………………………………………...…..66
Fig. 4.12. Correlation peak position vs the applied strain, the circles are the
experimental data, and the solid line shows the linear fitting of the experimental
data…………………………………………………………………………...…..66
Fig. 5.1. Schematic of the proposed sensor interrogation system. DL: delay
line..........................................................................................................................71
Fig. 5.2. The special reference waveform………………………………...…...76
Fig. 5.3. A linearly chirped microwave waveform corresponding to the
polarization direction of the ultrashort pulse aligned with the fast axis, when a
strain of 50 μ is applied to the LCFBG at 25
ºC………………………………………………………………………………....76
Fig. 5.4. A linearly chirped microwave waveform corresponding to the
polarization direction of the ultrashort pulse aligned with the slow axis, when a
strain of 50 μ is applied to the LCFBG at 25
ºC.…………………………………………………..............................................77
Fig. 5.5. Experimental results. Correlation of the waveforms shown in Fig. 5.3 and
Fig. 5.4 with the special reference waveform .…………………..…………….. 77
Fig. 5.6. Correlation peak position vs the temperature for a given strain of 50 µ
The triangular and circles indicate the experimental data corresponding to the

8/2/2019 Liu Weilin 2011 Thesis
http://slidepdf.com/reader/full/liu-weilin-2011-thesis 11/121
x
polarization direction of the ultrashort pulse aligned with the fast axis and slow
axis, respectively, and the solid line shows the linear fitting of the experimental
data.…………………………………………………………………………….78
Fig. 5.7. Correlation peak position vs the applied strain for a temperature of 60 ºC.
The triangular and circles indicate the experimental data corresponding to the
polarization direction of the ultrashort pulse aligned with the fast axis and slow
axis, respectively, and the solid line shows the linear fitting of the experimental
data.………………………………………………………………………………79
8/2/2019 Liu Weilin 2011 Thesis
http://slidepdf.com/reader/full/liu-weilin-2011-thesis 12/121
xi
ABSTRACT
Theoretical and experimental studies of real-time interrogation of fiber Bragg
grating (FBG) sensors based on chirped pulse compression with increased
interrogation resolution and signal-to-noise ratio are presented. The sensing
information encoded in the spectrum of an FBG is converted to the temporal
domain as a chirped microwave waveform based on spectral-shaping and
wavelength-to-time (SS-WTT) mapping. The sensing information is then decoded
by correlation between the chirped microwave waveform and a reference
waveform. Specifically, two interrogation systems are studied.
In the first interrogation system, a linearly chirped FBG (LCFBG) is employed as
the sensing element. By incorporating the LCFBG in an optical interferometer, a
spectral response with an increasing free spectral range (FSR) is obtained and the
sensing information is encoded in the spectral response as a change in the FSR.
When an ultra-short pulse is applied to the interferometer, a shaped spectrum is
obtained which is mapped to the temporal domain as a linearly chirped microwave
waveform. The correlation of the linearly chirped microwave waveform with a
chirped reference waveform would provide a sharp correlation peak with its
8/2/2019 Liu Weilin 2011 Thesis
http://slidepdf.com/reader/full/liu-weilin-2011-thesis 13/121
xii
position indicating the wavelength shift of the LCFBG. A theoretical analysis is
carried out, which is validated by numerical simulations and an experiment. The
experimental results show that the proposed system can provide an interrogation
resolution as high as 0.25 μ at a speed of 48.6 MHz.
The second interrogation system is designed to provide the ability to interrogate
simultaneously strain and temperature. In the system, a high-birefringence
LCFBG (Hi-Bi LCFBG) is employed as a sensing element. By employing the
Hi-Bi LCFBG in a Mach-Zehnder interferometer (MZI), two spectral responses
corresponding to the two orthogonal polarization axes are obtained and the
sensing information is encoded in the spectral responses. When an ultra-short
pulse is sent to the MZI, two shaped spectra are obtained which are mapped to
two linearly chirped microwave waveforms in a dispersive fiber. By using chirped
microwave pulse compression, two correlation peaks with the locations containing
the strain and temperature information are generated. A theoretical model is
developed, which is validated by an experiment. The experimental results show
that the proposed system can provide a resolution better than ±1.2 ºC and ±13.3
µ at an interrogation speed of 48.6 MHz.
8/2/2019 Liu Weilin 2011 Thesis
http://slidepdf.com/reader/full/liu-weilin-2011-thesis 14/121
1
Chapter 1
Introduction
1.1 Background review
Fiber Bragg grating (FBG) sensors have been investigated extensively in the last
few decades which could find numerous applications such as structural health
monitoring [1-5], molecular dynamics sensing [6] [7] and aircraft engine
diagnostics [8-12]. Compared with conventional electro-mechanical sensors, FBG
sensors possess a number of distinguishing advantages, such as immunity to
electromagnetic interference (EMI), high resistance to chemical corrosion, light
weight, and ease in signal transmission. Most of the FBG sensors are interrogated
by monitoring the wavelength shift. Technically, the wavelength-encoded
characteristic of an FBG sensor presents high robustness to noise and power
fluctuations, which also makes wavelength division multiplexing (WDM) [13]
[14] in FBG sensor array systems achievable. Based on these essential attributes,
numerous demodulation or interrogation techniques have been proposed and
demonstrated in the last few years.
8/2/2019 Liu Weilin 2011 Thesis
http://slidepdf.com/reader/full/liu-weilin-2011-thesis 15/121
2
For an FBG sensor that is interrogated by monitoring the wavelength shift, an
optical spectrum analyzer (OSA) is usually used. Conventional spectrometers
have a typical resolution of 0.01 nm, hence they are normally used for evaluation
of the optical properties of FBGs during the fabrication process rather than for
high-precision wavelength-shift detection. Research on high-resolution
interrogation has been a very active topic in recent years. These techniques can be
implemented based on passive detection [15-21] or active detection [22-24].
Passive detection is usually realized based on optical power monitoring using an
optical edge filter which has a linear relationship between the wavelength shift
and the change of the output intensity [15] [16], a tunable filter such as a
Fabry-Pérot filter [17] [18], which can be used to measure the wavelength shift of
the FBG and the output is a convolution between the spectrum of the tunable filter
and that of the FBG, or a charge coupled device (CCD) spectrometer [19] [20].
Technically, an edge filter functions as a static frequency discriminator to convert
the wavelength shift into an intensity change or an intensity spatial displacement.
The advantage of passive detection is that the system is simple and less costly, but
the power variations from the light source would be reflected as a change at the
detector output, making the interrogation have poor accuracy.
8/2/2019 Liu Weilin 2011 Thesis
http://slidepdf.com/reader/full/liu-weilin-2011-thesis 16/121
3
The use of active detection could eliminate the impact of power fluctuations on
the measurement accuracy. In general, an active detection scheme is implemented
based on an interferometric scanner and the wavelengths shift in the FBG sensor
is usually reflected as a change in an optical phase. Therefore, the measurement
resolution is much improved compared with the passive detection schemes. In
active detection schemes, the interference structure could be an unbalanced
Mach-Zehnder interferometer (MZI) [22-25], a Michelson interferometer [26], or
an interferometer based on a long-period fiber grating (LPG) pair [27].
However, an active scheme based on an optical interferometer is sensitive to
environmental changes, such as temperature change, subtle vibrations, or even air
fluctuations, which would deteriorate significantly the system stability. In
addition, a piezoelectric transducer (PZT) is usually employed as the scanning
device [22][28][29]. The speed of a PZT is in the range of kilo Hertz. For
applications where an ultra-fast interrogation is needed, the active schemes may
not fulfill the task.
To improve the interrogation speed, a technique was proposed and experimentally
demonstrated to measure the wavelength shift in the temporal domain based on
spectral-shaping and wavelength-to-time (SS-WTT) mapping [30]. It is known
that an ultra-short pulsed source through a dispersive element would experience
8/2/2019 Liu Weilin 2011 Thesis
http://slidepdf.com/reader/full/liu-weilin-2011-thesis 17/121
4
pulse broadening. If the pulse is ultra-short, the output from the dispersive
element would be a Fourier transformed version of the input pulse [31] [32]. The
operation is called real-time Fourier transformation or wavelength-to-time (WTT)
mapping [33]. Following this concept, Xia at al. [30] demonstrated an
interrogation system at a high speed. In the system, the spectrum of an ultra-short
pulse is shaped by an FBG or FBG array, and the shaped-spectrum is then mapped
to the time domain in a dispersive element. The measurement is then done in the
time domain using a high speed oscilloscope. The major limitation of using an
FBG or FBG array in this technique is that the spectrum of an FBG is narrow;
after WTT mapping, the temporal pulse has a low power level, leading to poor
signal-to-noise ratio (SNR). The use of an FBG with a wider spectrum would
increase the SNR, but the interrogation resolution would be poorer. Therefore,
there is a trade-off between the SNR and the resolution [30].
In this thesis, we propose two novel techniques to interrogate an FBG sensor
based on SS-WTT mapping using a linearly chirped FBG (LCFBG), with both
improved SNR and resolution.
In the first interrogation system, the LCFBG is incorporated in one arm of a
Mach-Zehnder interferometer (MZI). Due to the wavelength dependent nature of
the length of the arm with the incorporated LCFBG, the MZI would have a
8/2/2019 Liu Weilin 2011 Thesis
http://slidepdf.com/reader/full/liu-weilin-2011-thesis 18/121
5
spectral response with an increasing free spectral range (FSR). An optical pulse
from a mode-locked laser source is spectrally shaped by the MZI and its spectrum
is then mapped to the temporal domain by the dispersive element. Due to the
linear WTT mapping, a chirped microwave waveform with its shape that is a
scaled version of the shaped spectrum is generated. The chirped waveform is
detected by a photodetector (PD) and sent to a digital processor to perform pulse
compression.
It is known that a chirped waveform can be compressed if it is sent to a correlator
in which a reference waveform that is identical to the chirped pulse is correlated
with the chirped waveform [34]. The key significance here is that the wavelength
shift is estimated by measuring the location of the correlation peak, with both
improved resolution and SNR. The correlation is done here by building a special
reference waveform, which is linearly chirped with a chirp rate identical to that of
the generated chirped microwave waveform, but with an instantaneous frequency
extending from the smallest to the largest possible values corresponding to the
generated chirped microwave waveform when the LCFBG is experiencing the
largest and the smallest wavelength shift. Therefore, the location of the correlation
peak would indicate the wavelength shift. In this way, the designed system could
accomplish real-time interrogation with high resolution and improved SNR. The
8/2/2019 Liu Weilin 2011 Thesis
http://slidepdf.com/reader/full/liu-weilin-2011-thesis 19/121
6
technique is theoretically analyzed in Chapter 3 and experimentally demonstrated
in Chapter 4.
The second interrogation system is designed to provide the ability to interrogate
simultaneously strain and temperature. In the system, the strain and temperature
information is encoded in a high-birefringence LCFBG (Hi-Bi LCFBG) as Bragg
wavelength shifts. The Hi-Bi LCFBG is incorporated in one arm of a MZI. Due to
the birefringence in the Hi-Bi LCFBG, the MZI has two spectral responses along
the fast and slow axes with each having an increasing FSR. If an ultra-short
optical pulse is sent to the MZI, the spectrum of the ultra-short optical pulse is
shaped. Two shaped spectra are obtained which are mapped to two chirped
microwave waveforms in a dispersive fiber. By using chirped microwave pulse
compression, two correlation peaks with the locations containing the strain and
temperature information are obtained. Since the correlation operation is equivalent
to matched filtering, the signal-to-noise ratio (SNR) is increased. A theoretical
model is developed, which is validated by an experiment in Chapter 5.
8/2/2019 Liu Weilin 2011 Thesis
http://slidepdf.com/reader/full/liu-weilin-2011-thesis 20/121
7
1.2 Major contributions
In this thesis, the chirped pulse compression technology in radar signal processing
is first employed in an FBG sensor system to increase simultaneously the
resolution and the SNR, as discussed in Chapter 1.1. The major contributions
include
(1) Chirped pulse compression technology is first employed in an FBG sensor
interrogation system to improve both the SNR and resolution. The measurement
information, such as strain or temperature, is encoded as a change of the central
frequency in a chirped microwave waveform, which is obtained by shaping the
spectrum of an ultra-short pulse using an MZI incorporating an LCFBG in one
arm and wavelength-to-time mapping using an optical dispersive element. The
correlation of the linearly chirped microwave waveform with a chirped reference
waveform would provide a sharp correlation peak with its position indicating the
wavelength shift of the LCFBG. The chirped pulse compression technique
provides both an improved SNR and strain resolution. The proposed technique is
investigated theoretically in Chapter 3 and demonstrated experimentally in
Chapter 4. The measurement of a strain with a resolution of 0.25 µ ɛ is achieved.
The performance against embedded noise is also investigated.

8/2/2019 Liu Weilin 2011 Thesis
http://slidepdf.com/reader/full/liu-weilin-2011-thesis 21/121
8
(2) A novel approach to real-time interrogation of a Hi-Bi LCFBG for
simultaneous measurement of strain and temperature based on chirped microwave
pulse compression with increased resolution and SNR is proposed and
experimentally demonstrated. In the system, the sensing information is encoded as
a change of the spectral responses of an MZI incorporating a Hi-Bi LCFBG in one
arm. When an ultra-short pulse is sent to the MZI, due to the birefringence of the
Hi-Bi LCFBG, two shaped spectra are obtained which are mapped to two
temporal waveforms in a dispersive fiber. By using chirped microwave pulse
compression, two correlation peaks with the locations containing the strain and
temperature information are generated. The proposed system is investigated in
Chapter 5. A temperature and strain resolution better than ±1.2 ºC and ±13.3 µ at
an interrogation speed of 48.6 MHz is experimentally demonstrated.
8/2/2019 Liu Weilin 2011 Thesis
http://slidepdf.com/reader/full/liu-weilin-2011-thesis 22/121
9
1.3 Organization of this thesis
The thesis consists of six chapters. In Chapter 1, a brief introduction to typical
interrogation techniques of FBG sensors is presented. A review of the recently
proposed approaches for real-time interrogation is also discussed. Then, the major
contributions of this research are addressed. In Chapter 2, a review of FBG
sensors and interrogation systems is given. In Chapter 3, the principle of chirped
pulse compression for sensor interrogation is presented. The expression for the
generated chirped microwave waveform is developed and the design of the special
reference waveform is provided. The expression for the correlation between the
generated chirped microwave waveform and the special reference waveform is
also derived. In Chapter 4, the investigation of the proposed interrogation system
based on a numerical simulation and an experiment is performed. An interrogation
resolution as high as 0.25 μ at an interrogation speed of 48.6 MHz is
experimentally demonstrated. In Chapter 5, an interrogation system for
simultaneously measurement of strain and temperature based on chirped pulse
compression using a Hi-Bi LCFBG is proposed. A temperature and strain
resolution better than ±1.2 ºC and ±13.3 µ at an interrogation speed of 48.6 MHz
is experimentally demonstrated. Finally, a conclusion is drawn in Chapter 6 with
recommendations for future work.
8/2/2019 Liu Weilin 2011 Thesis
http://slidepdf.com/reader/full/liu-weilin-2011-thesis 23/121
10
Chapter 2
Review of FBG sensor Interrogation
2.1 FBG Sensor Structure
An FBG is a fiber device in which the refractive index in the core of the fiber is
periodically changed along the fiber length. An FBG is formed by exposure of the
fiber core to an intense optical interference pattern at a wavelength in the
ultra-violet (UV) region. Under the phase matching condition, an FBG couples the
forward propagating core mode to the backward propagating core mode. In 1978,
the formation of permanent gratings in an optical fiber was first demonstrated by
Hill at the Communications Research Centre (CRC), Canada [35]. Intensive study
on FBGs for applications such as optical communications and optical sensors
began after this controllable and effective method for FBG fabrication.

8/2/2019 Liu Weilin 2011 Thesis
http://slidepdf.com/reader/full/liu-weilin-2011-thesis 24/121
11
(a)
(b)
Long Short
(c)
k
Main-mode
(d)
Period
(e)
Fig. 2.1. Different types of fiber gratings. (a) Uniform FBG, (b) long-period fiber
grating, (c) chirped FBG, (d) tilted FBG, (e) sampled FBG.
8/2/2019 Liu Weilin 2011 Thesis
http://slidepdf.com/reader/full/liu-weilin-2011-thesis 25/121
12
Fig. 2.1 shows five different types of fiber gratings. A uniform FBG, Fig. 2.1(a),
could couple the forward propagating core mode to the backward propagating
core mode at its Bragg wavelength. A long-period fiber grating (LPG), shown Fig.
2.1(b), could couple the forward propagating core mode to one or a few of the
forward propagating cladding modes. A chirped FBG, shown Fig. 2.1(c), has a
wider reflection spectrum and each wavelength component is reflected at different
positions, which results in a time delay difference for different reflected
wavelengths. A tilted FBG, shown Fig. 2.1(d), could couple the forward
propagating core mode to the backward propagating core mode and a backward
propagating cladding mode. A sampled FBG, Fig. 2.1(e), is produced by sampling
a uniform FBG, which can reflect multiple wavelength components with identical
wavelength spacing when the sampling function is uniform. The use of a
nonuniform sampling function, such as a sampling function with increasing or
decreasing spacing, a reflection spectrum arbitrary spectral response in the 1st
order spectral channel can be generated. Different types of gratings have been
employed for different applications, such as in sensing [18], spectral filtering [36],
and dispersion compensation [37], according to their specific attributes.
The basic principle of operation used in an FBG-based sensor system is to
monitor the wavelength shift of the reflected “Bragg” signal in which the changes
8/2/2019 Liu Weilin 2011 Thesis
http://slidepdf.com/reader/full/liu-weilin-2011-thesis 26/121
13
in the measurands (e.g., strain, temperature) are encoded. The Bragg wavelength
B , which is the wavelength of the reflected light in an FBG, is given by
B2 eff n (2-1)
where is eff n the effective refractive index of the optical fiber core mode and
is the grating period, as shown in Fig. 2.1(a) (d) and (e). From (2-1), it can be seen
that the Bragg wavelength is determined by the effective refractive index and the
grating period. In most FBG sensor applications, the major source leading to the
change of the effective refractive index is the temperature. The typical response of
an FBG to temperature is ~13 pm/ 0C near 1550 nm [38]. A strain applied along
the fiber length would contribute to a change of grating period. The typical Bragg
wavelength shift to a strain is ~1.2 pm/µ ɛ near 1550 nm [38].
8/2/2019 Liu Weilin 2011 Thesis
http://slidepdf.com/reader/full/liu-weilin-2011-thesis 27/121
14
2.2 Interrogation Techniques
Demodulators or interrogators are employed for FBG sensors to extract
measurement information, such as strain or temperature, from the light signals
coming from the sensor heads. Basically, the measurement information is encoded
in the form of a Bragg wavelength shift, which is caused by the effective
refractive index change or grating period change or both as discussed in Chapter
2.1. Therefore, a spectrum analyzer is required to demodulate the sensor signal. In
real FBG sensor systems, optical spectrum analyzers (OSA) are not preferred
because they are expensive and their wavelength scanning speed is too slow. The
general requirements for an ideal interrogation method include
1) High resolution and large measurement range: typically a wavelength-shift
detection resolution ranging from sub-picometers to picometers is required for
most applications; the ratio between the measurement range and the required
resolution is from 10
3
:1 to 10
5
:1.
2) Cost effective: the cost of an interrogation system should be competitive with
conventional optical or electrical sensors.
8/2/2019 Liu Weilin 2011 Thesis
http://slidepdf.com/reader/full/liu-weilin-2011-thesis 28/121
15
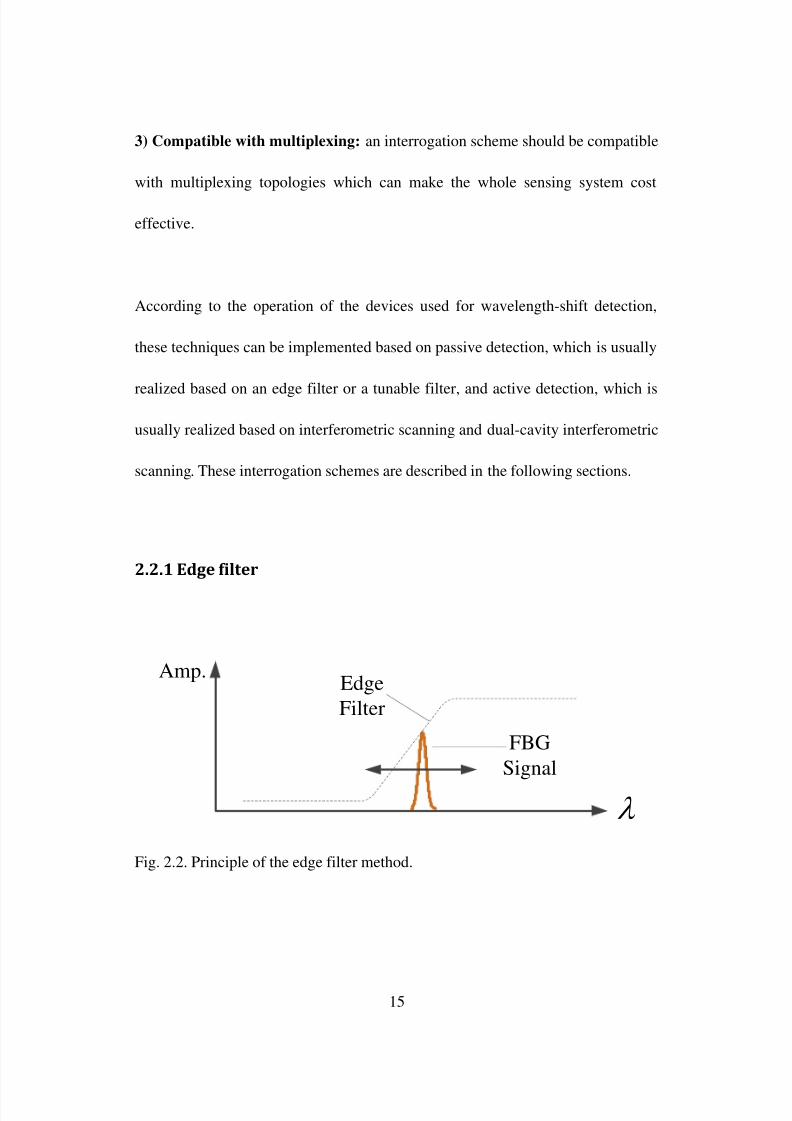
3) Compatible with multiplexing: an interrogation scheme should be compatible
with multiplexing topologies which can make the whole sensing system cost
effective.
According to the operation of the devices used for wavelength-shift detection,
these techniques can be implemented based on passive detection, which is usually
realized based on an edge filter or a tunable filter, and active detection, which is
usually realized based on interferometric scanning and dual-cavity interferometric
scanning. These interrogation schemes are described in the following sections.
2.2.1 Edge filter
FBG
Signal
Edge
Filter
Amp.
Fig. 2.2. Principle of the edge filter method.
8/2/2019 Liu Weilin 2011 Thesis
http://slidepdf.com/reader/full/liu-weilin-2011-thesis 29/121
16
This method is based on the use of an edge filter which has a linear relationship
between the wavelength shifts and the change of the output intensity [17] [18] [39]
[40]. Fig. 2.2 shows the interrogation operation using an edge filter. The intensity
of the reflected light wave is a function of the wavelength change. By measuring
the intensity change, the wavelength shift induced by the measurement
information is obtained [41-45]. The advantage of this technique is its simplicity.
However, the measurement range is inversely proportional to the detection
resolution.
Broadband or
Tunable Source
Detection Electronics
FBG
Signal
Edge
Filter
0
Photodetector Linear edge filter
R I F I
50/50 Fiber
Coupler
50/50 Fiber
Coupler
Fiber Link
FBG Sensor
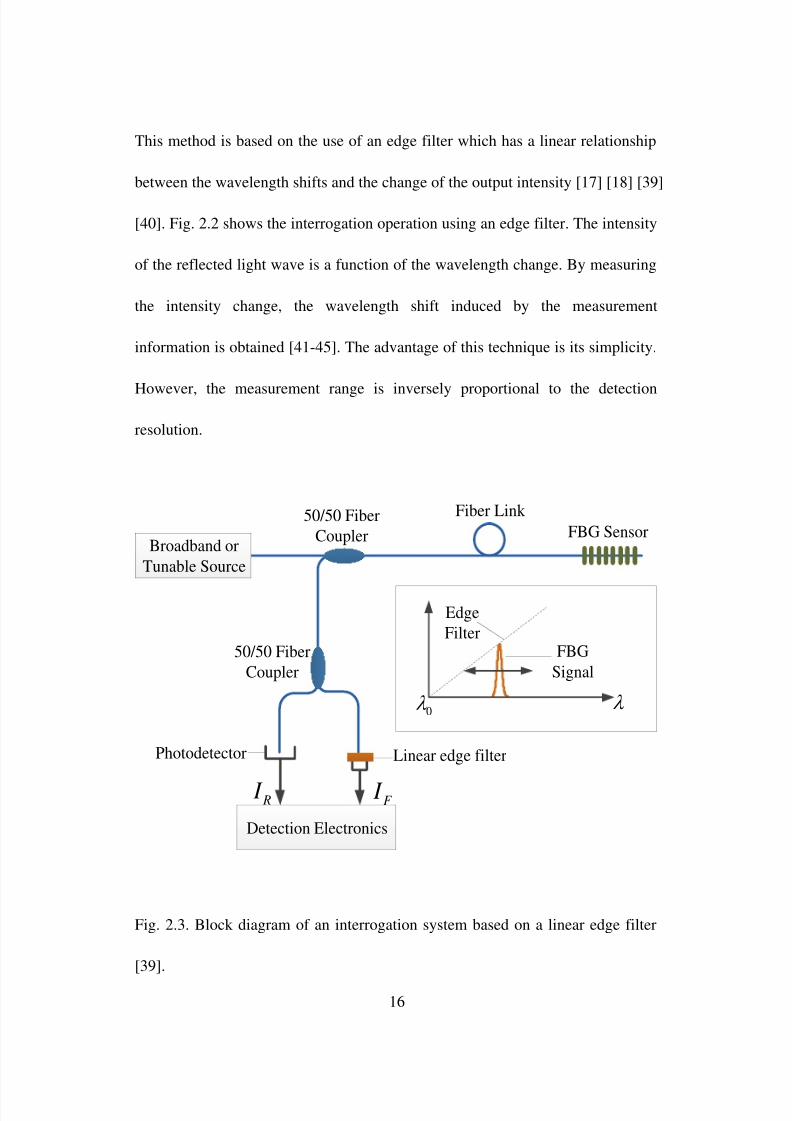
Fig. 2.3. Block diagram of an interrogation system based on a linear edge filter
[39].
8/2/2019 Liu Weilin 2011 Thesis
http://slidepdf.com/reader/full/liu-weilin-2011-thesis 30/121
17
An interrogation system based on an edge filter is shown in Fig. 2.3. The light
reflected back from a fiber Bragg grating sensor is split into two beams of equal
intensity. The couplers in Fig. 2.3 are wavelength-independent over the
wavelength range of interest, which means that the splitting ratio is constant in the
required wavelength range. One of the beams is filtered by the linear edge filter
before detected by a photodetector. The edge filter has a wavelength dependent
transfer function which is linear over the wavelength range. This wavelength
range determines the measurement scale of the system. The other beam, serving as
a reference, is unfiltered and is detected by a similar photodetector. The output
from each photodetector is amplified before fed to an analog divider. Thus, the
ratio of the filtered beam over the reference beam provides the wavelength
information on the reflected peak and serves to eliminate the effect of the intensity
variations due to uneven power distributions of the source spectrum, alignment
uncertainty of the connectors, microbend attenuation in the lead, and power
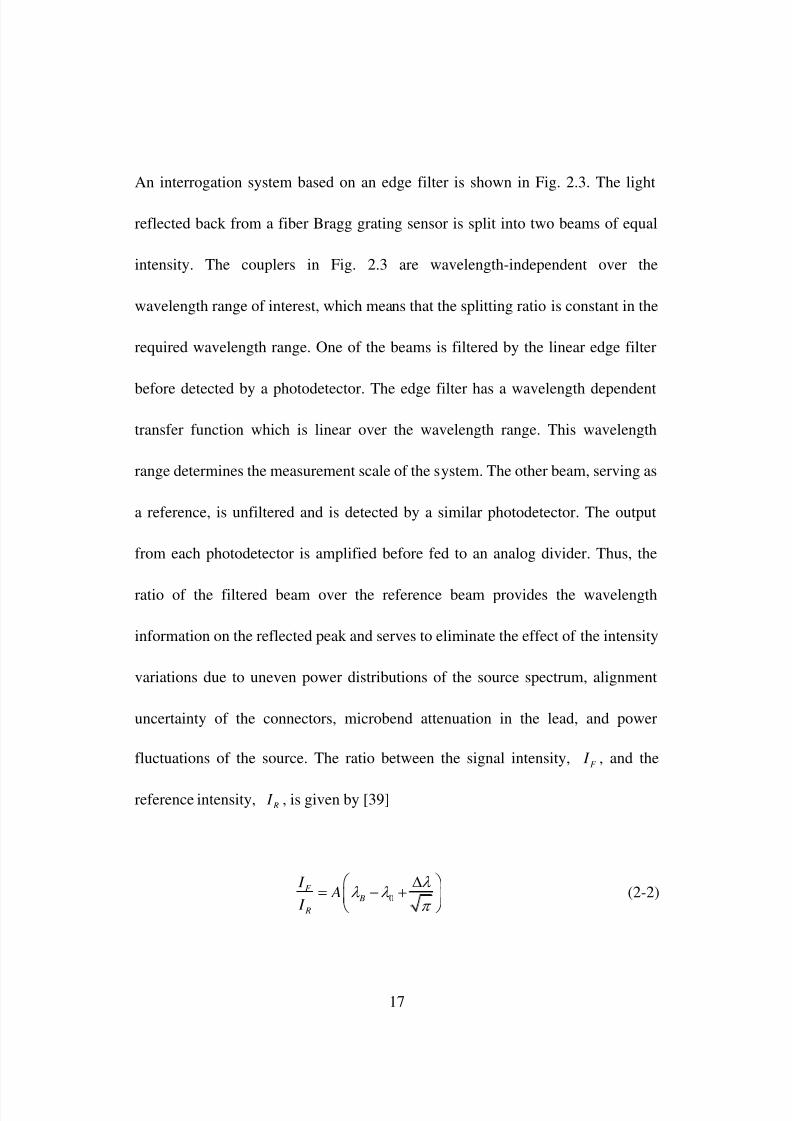
fluctuations of the source. The ratio between the signal intensity,F
I , and the
reference intensity, R
I , is given by [39]
0
F
B
R
I A
I
(2-2)
8/2/2019 Liu Weilin 2011 Thesis
http://slidepdf.com/reader/full/liu-weilin-2011-thesis 31/121
18
where A and0
are the gradient and the starting value of the edge filter, and B
and are the Bragg wavelength and the linewidth of the FBG, respectively. It
can be seen that this system has several advantages, such as low cost, fast
response, and ease of use. A resolution of a few tens of µ ɛ has been demonstrated
with a measurement range of several mɛ [39].
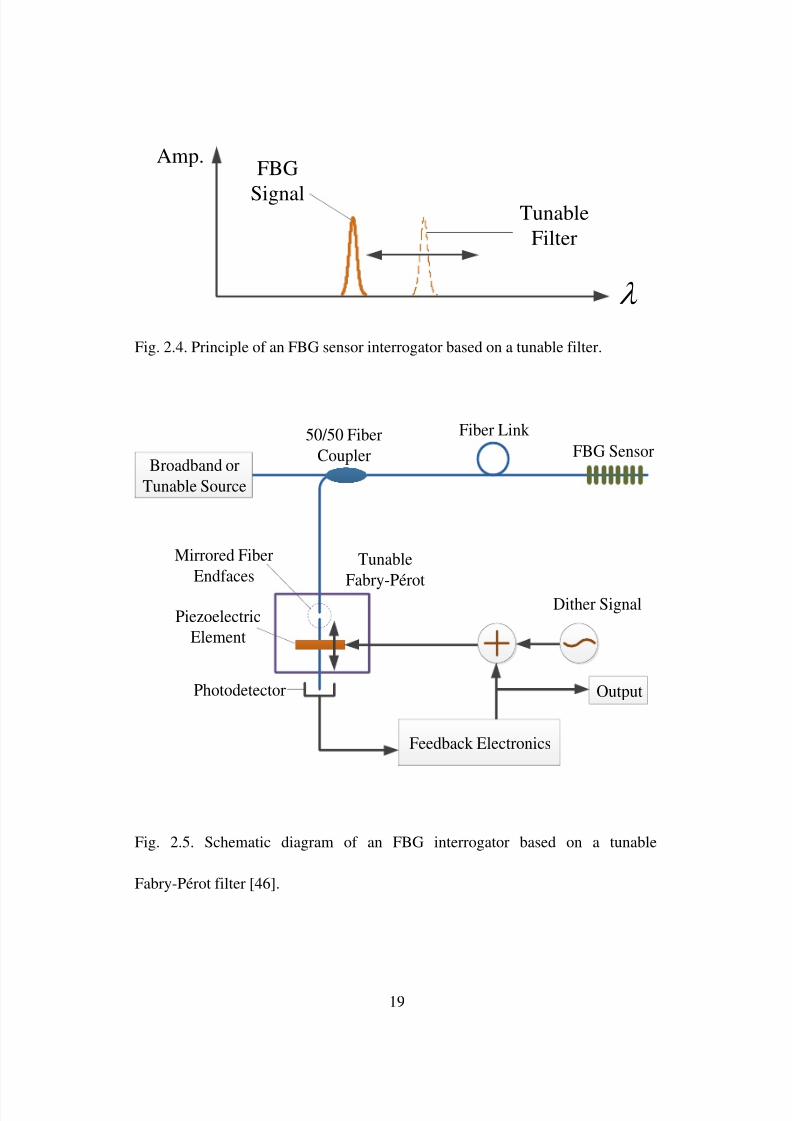
2.2.2 Tunable filter
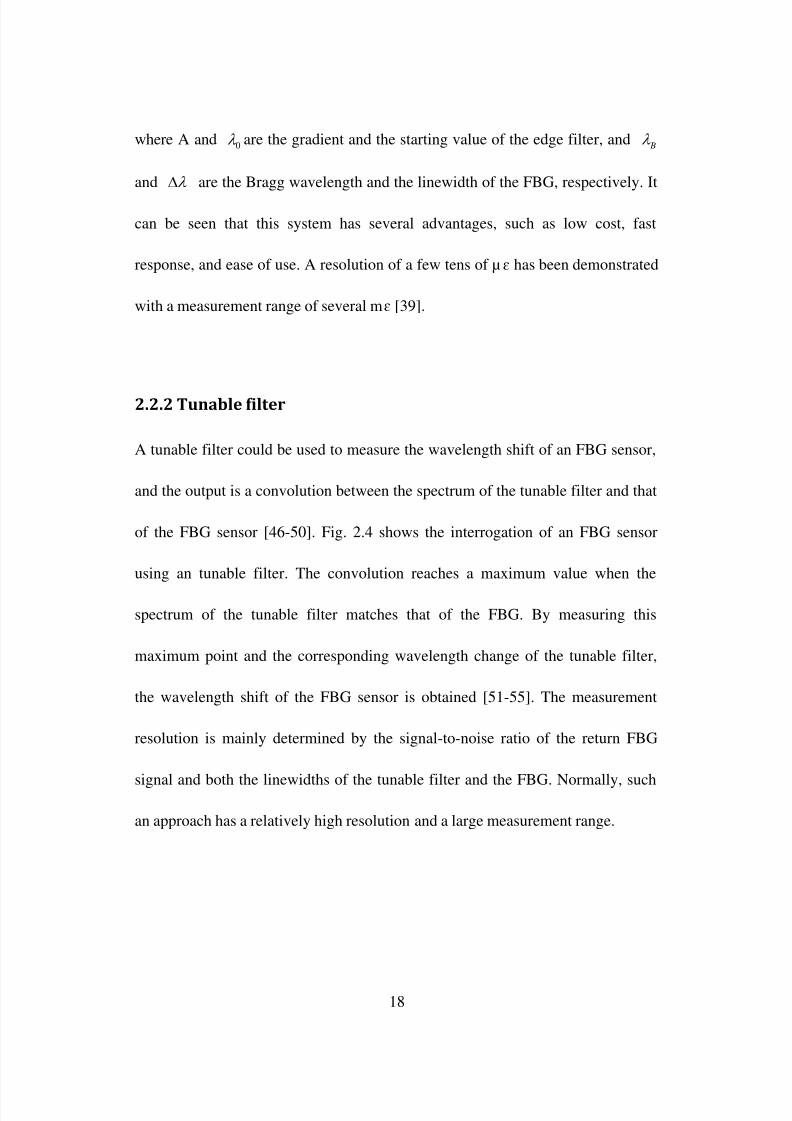
A tunable filter could be used to measure the wavelength shift of an FBG sensor,
and the output is a convolution between the spectrum of the tunable filter and that
of the FBG sensor [46-50]. Fig. 2.4 shows the interrogation of an FBG sensor
using an tunable filter. The convolution reaches a maximum value when the
spectrum of the tunable filter matches that of the FBG. By measuring this
maximum point and the corresponding wavelength change of the tunable filter,
the wavelength shift of the FBG sensor is obtained [51-55]. The measurement
resolution is mainly determined by the signal-to-noise ratio of the return FBG
signal and both the linewidths of the tunable filter and the FBG. Normally, such
an approach has a relatively high resolution and a large measurement range.
8/2/2019 Liu Weilin 2011 Thesis
http://slidepdf.com/reader/full/liu-weilin-2011-thesis 32/121
19
FBG
Signal Tunable
Filter
Amp.
Fig. 2.4. Principle of an FBG sensor interrogator based on a tunable filter.
Broadband or
Tunable Source
Photodetector
Dither Signal
50/50 Fiber
Coupler
Tunable
Fabry-Pérot
Fiber Link
FBG Sensor
Output
Feedback Electronics
Piezoelectric
Element
Mirrored Fiber
Endfaces
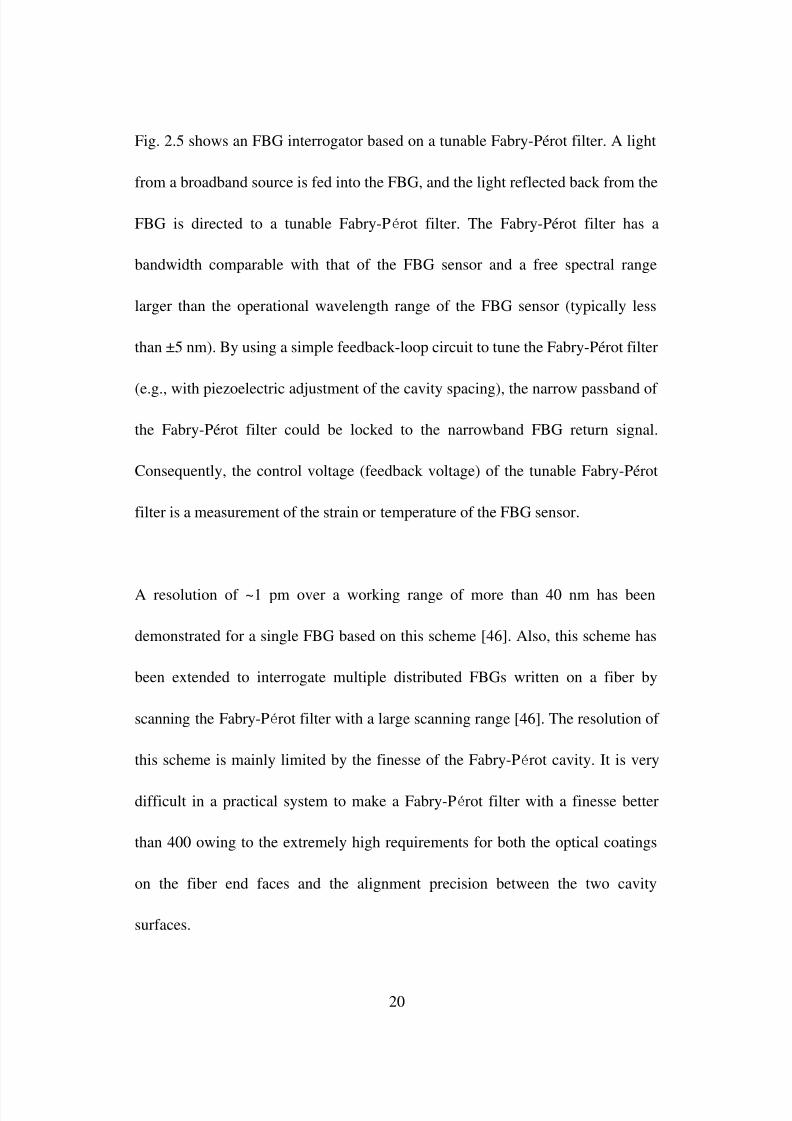
Fig. 2.5. Schematic diagram of an FBG interrogator based on a tunable
Fabry-Pérot filter [46].
8/2/2019 Liu Weilin 2011 Thesis
http://slidepdf.com/reader/full/liu-weilin-2011-thesis 33/121
20
Fig. 2.5 shows an FBG interrogator based on a tunable Fabry-Pérot filter. A light
from a broadband source is fed into the FBG, and the light reflected back from the
FBG is directed to a tunable Fabry-Pérot filter. The Fabry-Pérot filter has a
bandwidth comparable with that of the FBG sensor and a free spectral range
larger than the operational wavelength range of the FBG sensor (typically less
than ±5 nm). By using a simple feedback-loop circuit to tune the Fabry-Pérot filter
(e.g., with piezoelectric adjustment of the cavity spacing), the narrow passband of
the Fabry-Pérot filter could be locked to the narrowband FBG return signal.
Consequently, the control voltage (feedback voltage) of the tunable Fabry-Pérot
filter is a measurement of the strain or temperature of the FBG sensor.
A resolution of ~1 pm over a working range of more than 40 nm has been
demonstrated for a single FBG based on this scheme [46]. Also, this scheme has
been extended to interrogate multiple distributed FBGs written on a fiber by
scanning the Fabry-Pérot filter with a large scanning range [46]. The resolution of
this scheme is mainly limited by the finesse of the Fabry-Pérot cavity. It is very
difficult in a practical system to make a Fabry-Pérot filter with a finesse better
than 400 owing to the extremely high requirements for both the optical coatings
on the fiber end faces and the alignment precision between the two cavity
surfaces.
8/2/2019 Liu Weilin 2011 Thesis
http://slidepdf.com/reader/full/liu-weilin-2011-thesis 34/121
21
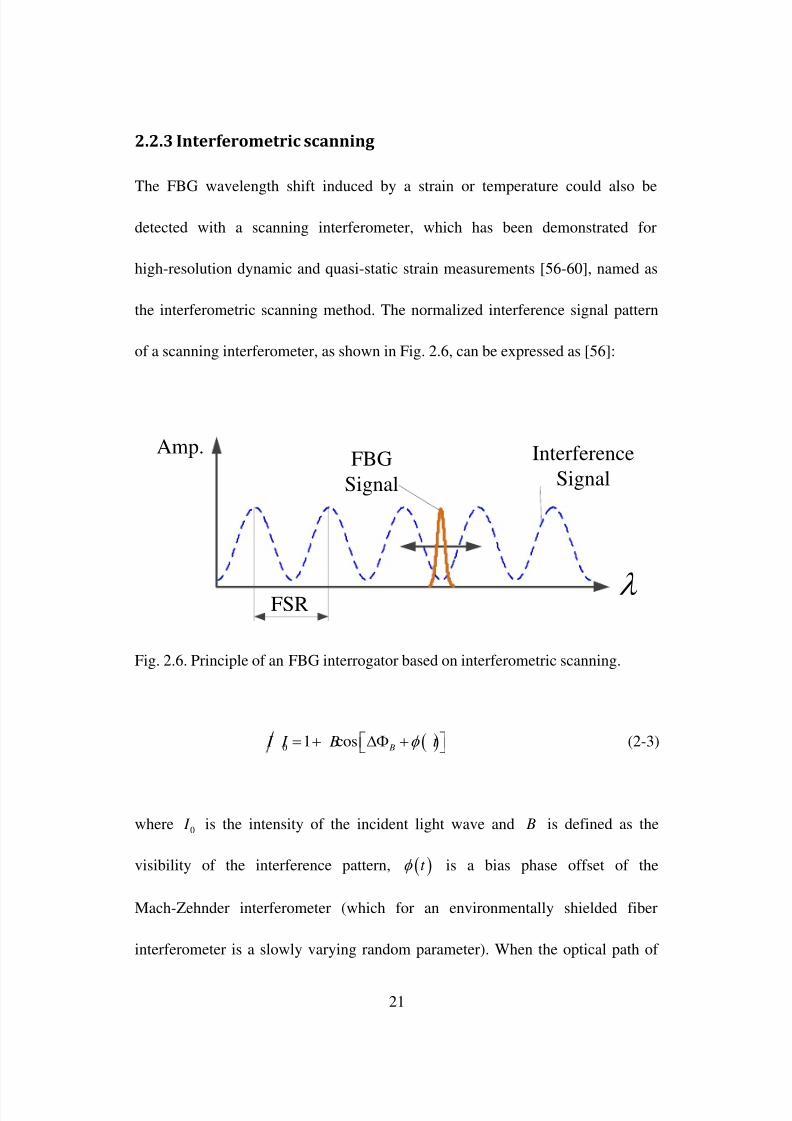
2.2.3 Interferometric scanning
The FBG wavelength shift induced by a strain or temperature could also be
detected with a scanning interferometer, which has been demonstrated for
high-resolution dynamic and quasi-static strain measurements [56-60], named as
the interferometric scanning method. The normalized interference signal pattern
of a scanning interferometer, as shown in Fig. 2.6, can be expressed as [56]:
FBG
Signal
Interference
Signal
FSR
Amp.
Fig. 2.6. Principle of an FBG interrogator based on interferometric scanning.
01 cos
B I I B t (2-3)
where0
I is the intensity of the incident light wave and B is defined as the
visibility of the interference pattern, t is a bias phase offset of the
Mach-Zehnder interferometer (which for an environmentally shielded fiber
interferometer is a slowly varying random parameter). When the optical path of

8/2/2019 Liu Weilin 2011 Thesis
http://slidepdf.com/reader/full/liu-weilin-2011-thesis 35/121
22
the scanning interferometer is modulated (e.g., employing a piezoelectric element
in one arm of the Mach-Zehnder interferometer), the scanning interferometer
would perform as a wavelength scanner for the FBG sensor [61-64]. Therefore,
the wavelength shift of the FBG sensor induced by a strain or temperature would
produce a change in optical phase B
[56], given by
2 2
2 2SI SI
B B g
B B
L L Y
(2-4)
where Y is the variation in strain or temperature applied to the FBG sensor and
SI L is the optical path difference between the two arms of the scanning
interferometer, g is the normalized FBG sensitivity for strain or temperature,
which is given by [56]
1 B
g
BY
(2-5)
It can be seen from (2-4) and (2-5), the phase sensitivity in response to strain or
temperature ( B
Y ) is directly proportional to the optical path difference
( SI L ) in the scanning interferometer. Thus, by measuring B with the
pseudo-heterodyne processing scheme [56], the strain or temperature can be
demodulated.
8/2/2019 Liu Weilin 2011 Thesis
http://slidepdf.com/reader/full/liu-weilin-2011-thesis 36/121
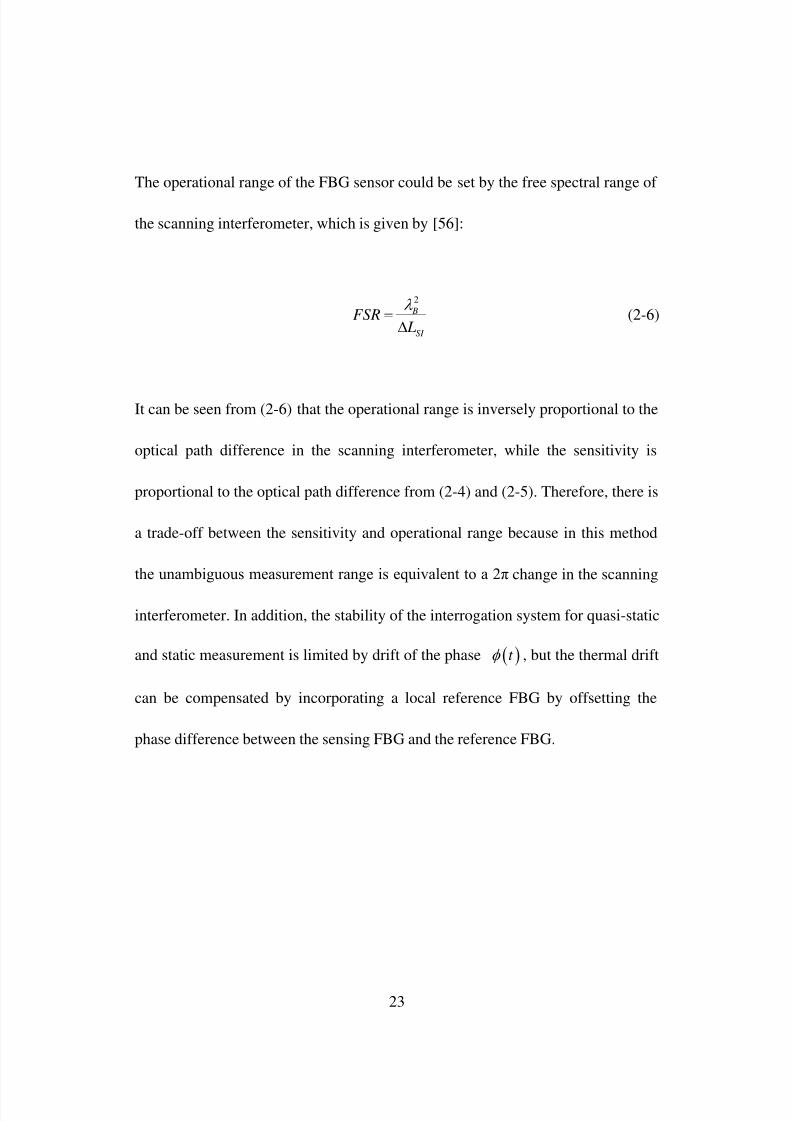
23
The operational range of the FBG sensor could be set by the free spectral range of
the scanning interferometer, which is given by [56]:
2
B
SI
FSR L
(2-6)
It can be seen from (2-6) that the operational range is inversely proportional to the
optical path difference in the scanning interferometer, while the sensitivity is
proportional to the optical path difference from (2-4) and (2-5). Therefore, there is
a trade-off between the sensitivity and operational range because in this method
the unambiguous measurement range is equivalent to a 2π change in the scanning
interferometer. In addition, the stability of the interrogation system for quasi-static
and static measurement is limited by drift of the phase t , but the thermal drift
can be compensated by incorporating a local reference FBG by offsetting the
phase difference between the sensing FBG and the reference FBG.
8/2/2019 Liu Weilin 2011 Thesis
http://slidepdf.com/reader/full/liu-weilin-2011-thesis 37/121
24
Broadband or
Tunable Source
Photodetector
50/50 Fiber
Coupler
Reference
Fiber Link
FBG Sensor
Phase
Meter
Bandpass
Filter( )
Piezoelectric
Element
Unbalanced
Mach-Zehnder
Interferometer
(OPD=nd)
RampGenerator
0 B
2
2 B B Bnd
0cos Bt
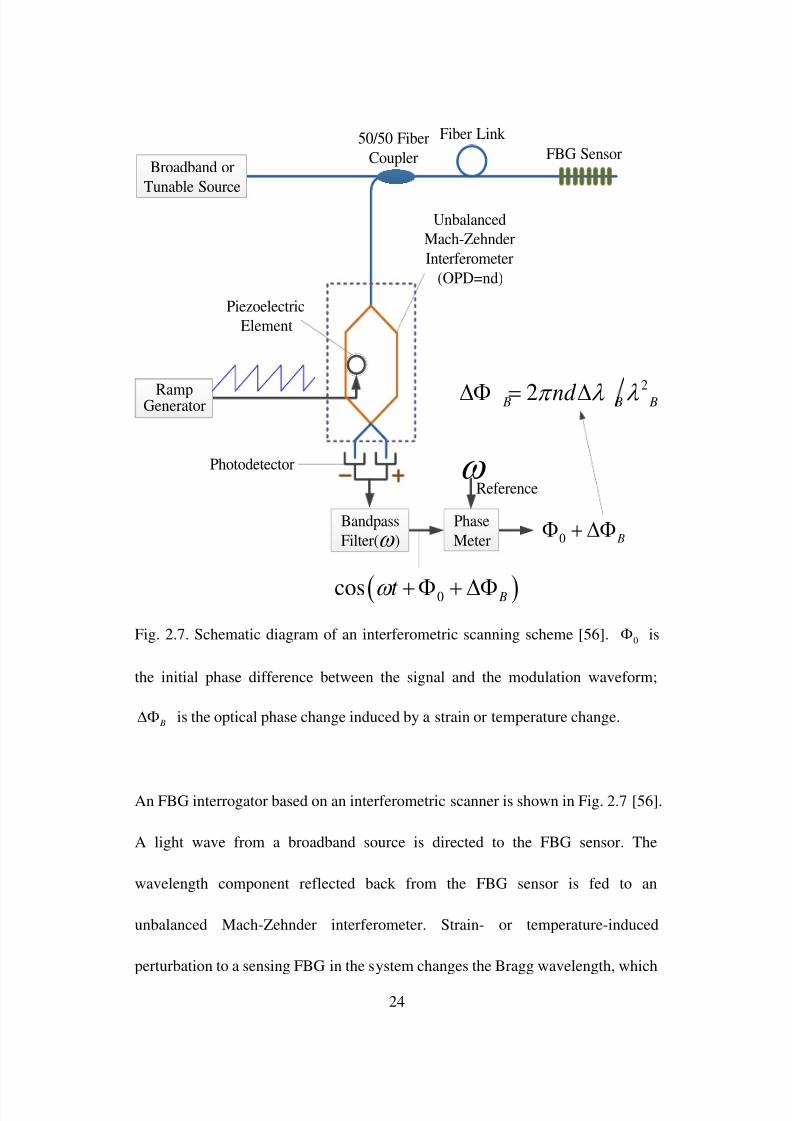
Fig. 2.7. Schematic diagram of an interferometric scanning scheme [56].0
is
the initial phase difference between the signal and the modulation waveform;
B is the optical phase change induced by a strain or temperature change.
An FBG interrogator based on an interferometric scanner is shown in Fig. 2.7 [56].
A light wave from a broadband source is directed to the FBG sensor. The
wavelength component reflected back from the FBG sensor is fed to an
unbalanced Mach-Zehnder interferometer. Strain- or temperature-induced
perturbation to a sensing FBG in the system changes the Bragg wavelength, which
8/2/2019 Liu Weilin 2011 Thesis
http://slidepdf.com/reader/full/liu-weilin-2011-thesis 38/121
25
could be detected at the output of the phase meter, and then related to the
corresponding strain or temperature information. By using this scheme, an
interrogator with a strain resolution of ~6 nɛHz-1/2
at 1Hz and a temperature
resolution of 0.050C with good stability has been demonstrated [56].
2.2.4 Dual-cavity interferometric scanning
In order to increase the unambiguous measurement range of the interferometric
scanning scheme (normally equivalent to a 2π change in the scanning
interferometer scheme), a novel method using two interferometric scanners
equipment realized by stepping the scanning interferometer from a long cavity to
a short cavity has been proposed, which is known as the dual-cavity
interferometric scanning scheme [65][66]. The optical phase output from the
cavity with a larger optical path difference, i.e., range 1, gives a high-resolution
measurement while the output from the cavity with a shorter optical path
difference, i.e., range 2, is used to determine the number of fringes for the longer
cavity within one free spectral range corresponding to the shorter cavity. The
operation of such a scheme is shown in Fig. 2.8. Therefore, the total absolute
value of the phase change is thus given by ( 2 B
N ) (here N is the number of
the interferometric fringes within one free spectral range corresponding to the
shorter cavity). The enhancement factor, M , in the unambiguous range is given by

8/2/2019 Liu Weilin 2011 Thesis
http://slidepdf.com/reader/full/liu-weilin-2011-thesis 39/121
26
the ratio of the dual-cavity lengths used in the stepped interferometer, which is
given as,
B
FSR(short)
π
-π
B
Range 2
B
FSR(long)
π
-π
B
Range 1
Fig. 2.8. Principle of the dual-cavity interferometric scanning scheme.
longshort
long short
LFSR M
FSR L (2-7)
where long L and
short L are the longer and shorter cavity lengths of the stepped
interferometer, respectively. Theoretically, M could be very large as the cavity
length of the stepped interferometer, which could be varied from a few hundred
micrometers to a few hundred millimeters in a well collimated interferometer,
although in practice the value of M is likely to be selected in the range of 10-100.

8/2/2019 Liu Weilin 2011 Thesis
http://slidepdf.com/reader/full/liu-weilin-2011-thesis 40/121
27
Temperature
Controller
50/50 Fiber
Coupler Reference FBG
BPF
Phase Meter
Ramp Generator
SLD
Driver
SIWS Range 1 SIWS Range 2 50/50 Fiber
Coupler FBG Sensor
BPF
A/D
Temperature Sensor
Fig. 2.9. An interrogator based on the dual-cavity interferometer scanning scheme
[65]: SLED, superluminescent light-emitting diode; SIWS, stepped Michelson
interferometric wavelength scanning; BPF, bandpass filter; A/D,
analogue-to-digital convertor.
An interrogator based on the dual-cavity interferometer scanning scheme is shown
in Fig. 2.9. The reference FBG is located in a strain-free and
temperature-stabilized environment, which is used to compensate the thermal drift
of the scanning interferometer. The stepped interferometric wavelength scanner is
a bulk Michelson interferometer with the reference and the sensing FBGs located
in each of the two arms. This concept has been experimentally verified [65] and is
proved of great importance when FBGs are used for static strain measurement as
it would allow a working range to extend from submicrostrain to tens of
millistrains, which is very difficult to achieve using a single interferometer

8/2/2019 Liu Weilin 2011 Thesis
http://slidepdf.com/reader/full/liu-weilin-2011-thesis 41/121
28
scheme. This system is very complicated and the wavelength scanning speed is
still slow, although its range to resolution ratio could be 4×10⁴:1, which is
potentially able to compete with any conventional fiber-optic interferometric
sensors and traditional strain gauges.
2.2.5 Direct spectrum analysis
If an optical spectrometer is employed to analyze the output spectrum of an FBG
sensor, the sensor resolution is basically determined by the resolution of the CCD
spectrometer. A possible commercial model, for example, Agilent 83453B High
Resolution Spectrometera, has a wavelength resolution of 0.008 pm over the 1440
to 1640 nm communication wavelength range, but a single full wavelength scan
needs over 5 minutes. Horiba 1000M (Series II) High Resolution Research
Spectrometerb
can provide a much higher scanning speed in the kilo Hz range,
but the optical resolution is significantly reduced of about 8 pm.
a. Agilent Technologies: http://www.home.agilent.com
b. HORIBA Scientific: http://www.horiba.com
8/2/2019 Liu Weilin 2011 Thesis
http://slidepdf.com/reader/full/liu-weilin-2011-thesis 42/121
29
2.3 Discrimination of strain and temperature
Since an FBG sensor is sensitive to both strain and temperature, it is required that
an interrogation system can discriminate strain and temperature. A considerable
number of strain and temperature discrimination methods for FBG sensors have
been proposed and demonstrated [67]. In general, techniques to provide
interrogation of an FBG sensor that can discriminate strain and temperature can be
classified into six categories
(1) Reference FBG method [68-74]
To eliminate the influence of temperature, the most straightforward way is to use
an identical, but separated and strain-free FBG (or strain/temperature insensitive
material in the sensor head) as a temperature (temperature/strain) sensor to
compensate (avoid) the temperature-induced error. Technically, this reference
FBG is located in the same thermal environment as the strain sensor but is
strain-free. By subtracting the wavelength shift induced by the temperature
variation from the total wavelength shift obtained with the strain sensor, the strain
error could be compensated. The scheme using a reference FBG has the
advantages, such as a simple structure and low cost of the sensor head, however,
the measurement accuracy is limited due to the difficulty in fabricating two FBGs
with exactly identical characteristics.

8/2/2019 Liu Weilin 2011 Thesis
http://slidepdf.com/reader/full/liu-weilin-2011-thesis 43/121
30
(2) Superimposed FBG method [75-78]
Discrimination of strain and temperature can also be achieved using
dual-wavelength superimposed FBGs written at the same location in the fiber, in
which the wavelength shift data are obtained from the two superimposed FBGs.
Because of the different strain and temperature responsivity in the two FBGs, the
strain and temperature information could be obtained by using the two wavelength
shift data. This concept has been demonstrated using two FBGs with central
wavelengths of 850 and 1300nm [75]. The advantage of this approach is its high
accuracy. However, this method needs two light sources and demodulation
systems, making the system more costly.
(3) Combined FBG and LPG method [79-84]
It is different from the superimposed FBG method where two FBGs are employed,
in this approach an FBG and an LPG are used in the sensor head. Generally, an
LPG has much larger temperature responsivity than an FBG. Due to the different
responsivities, the combination of the FBG and LPG would provide the ability to
discriminate the strain and temperature, but with a better accuracy. Compared to
the dual-wavelength superimposed FBG method, a broadband optical source and
an OSA rather than two sets of independent detection systems are used. However,
there are also several limitations. First, the physical length of the LPG is much
8/2/2019 Liu Weilin 2011 Thesis
http://slidepdf.com/reader/full/liu-weilin-2011-thesis 44/121
31
longer (typically a few centimeters) than the FBG, so it may experience a
significant non-uniform strain field along a grating length. Second, the LPG’s
sensitivity to bends in the fiber needs a separation of the wavelength changes
caused by the bend and the longitudinal strain, which forms a new problem.
Finally, the bandwidth of the LPG is relatively large, which would limit
measurement accuracy of the interrogation system and also limit the total number
of sensors based on WDM.
(4) Different cladding-diameter FBG method [84-87]
It is found that the strain/temperature responses of an FBG with different cladding
diameters are not the same [84]. This attribute could be employed in an
interrogation system to discriminate of strain and temperature. By fusion-splicing
two FBGs with different cladding diameters, two sets of wavelength-shift data are
obtained, which can be used to determine the strain and temperature. In the
proposed approach [86], the Bragg wavelengths of the two FBGs may differ by a
few nanometers, allowing them to be measured independently based on WDM.
The advantage of this scheme is that the WDM capacity can be increased, but the
problem of low strength and high loss due to splice may deteriorate the system
performance.
(5) FBG Fabry-Pérot cavity method [88-93]

8/2/2019 Liu Weilin 2011 Thesis
http://slidepdf.com/reader/full/liu-weilin-2011-thesis 45/121
32
In this method, two identical FBGs form a Fabry-Pérot cavity with a cavity length
of 1 mm are used in the sensor. The sensor exhibits a few unique properties. First,
it possesses two spectral peaks within its main reflection band, and the
wavelength difference of the two peaks changes linearly with strain or
temperature. Second, the normalized peak power difference, in addition to its peak
wavelength shift, changes linearly with strain or temperature. As a result, the
spectral peak power of the reflected light from the sensor, in addition to its
wavelength shift, varies linearly with strain or temperature. Therefore, the
measurement of the peak wavelength shifts as well as the change in the peak
power permits simultaneous determination of strain and temperature. The main
limitation of the technique is that the FBG based Fabry-Pérot cavity is quite
difficult to fabricate.
(6) Birefringence method [94-102]
Generally, two schemes have been demonstrated for simultaneous measurement
of strain and temperature based on birefringence. The first one is to use an optical
Sagnac loop mirror incorporating a high birefringence fiber and an FBG as the
sensor head [97] [102]. Because the sensing head presents different sensitivities
for strain and temperature measurands, the physical parameters such as strain and
temperature could be discriminated. The second one is to use a FBG written in a
high birefringence fiber [101]. Therefore, two Bragg wavelengths corresponding

8/2/2019 Liu Weilin 2011 Thesis
http://slidepdf.com/reader/full/liu-weilin-2011-thesis 46/121
33
to the fast-axis and slow-axis mode could be observed. It is known that the
wavelength space between the center wavelengths of the FBGs in the two axes
would change linearly to the temperature, but remain unchanged to the strain.
Therefore, the strain and temperature applied to the FBG sensor could be
demodulated simultaneously.
8/2/2019 Liu Weilin 2011 Thesis
http://slidepdf.com/reader/full/liu-weilin-2011-thesis 47/121
34
2.4 Summary
Compared with conventional fiber-optic sensors, FBG sensors have a number of
distinguishing advantages and significant progress has been made in the last few
years. In this chapter, a systematic overview of FBG sensors and the interrogation
techniques was performed. The key limitations of the current interrogation
systems are the slow interrogation speed or low interrogation resolution. For many
applications, such as the monitoring of the operation of an airplane engine, an
interrogator with a much higher speed is needed to detect the engine vibrations. A
solution to achieve high speed interrogation is to transfer the spectral information
to the time domain, which can be processed at a very high speed using
state-of-the-art digital signal processing technology.

8/2/2019 Liu Weilin 2011 Thesis
http://slidepdf.com/reader/full/liu-weilin-2011-thesis 48/121
35
Chapter 3
Theoretical Model: Chirped Pulse Generation with
Encoded Measurement Information
3.1 Basic Concepts
(1) Linearly chirped pulse
Mathematically, a linearly chirped waveform, namely a linearly frequency
modulated waveform, is given by
2
0cos 2 0 t x t kt f t (3-1)
where k is the chirp rate,0
f is the initial frequency, and is the time duration.
The instantaneous frequency of this waveform is the first-order derivative of the
phase term, given by
0
10 t
2i
d t f t kt f
dt
(3-2)
The bandwidth of the waveform, B, can be found as B k . Clearly i f t
sweeps linearly across a total bandwidth of B Hz during the τ– second pulse

8/2/2019 Liu Weilin 2011 Thesis
http://slidepdf.com/reader/full/liu-weilin-2011-thesis 49/121
36
duration. When k is positive, the pulse is an up chirped; if k is negative, it is a
down chirped. The bandwidth-time product (BWTP) of the chirped waveform is
given by 2 B k . Since 1 B ? , the employment of a chirped pulse could
achieve pulse compression with a compression ratio being approximately the
BWTP.
(2) Pulse compression
A chirped pulse (or a phase coded pulse with a Barker code) could be compressed
by autocorrelation, which has been widely used in modern radar systems to
increase the range resolution. The correlation of a chirped waveform has a shape
of sinc-function which gives a narrow peak determined by the first zero points.
For a linearly chirped pulse, the first zero point of its autocorrelation is at
1 1
zero f
B k . If the chirp bandwidth increased the zero points would shift in a
way that the mainlobe of the autocorrelation function would narrow and thus
increase the resolution for pulse detection.
(3) Wavelength-to-time mapping
Wavelength-to-time mapping, or dispersive Fourier transformation, is a fast and
effective way to measure optical spectrum in the time domain. In theory, the
temporal waveform at the output of a dispersive element has a shape that is a
scaled version of the spectrum of an ultra-short input pulse [31] [32]. Based on

8/2/2019 Liu Weilin 2011 Thesis
http://slidepdf.com/reader/full/liu-weilin-2011-thesis 50/121
37
this time-space duality, an equivalent time-domain Fraunhofer approximation
could be used to carry out a real-time optical spectrum analysis.
8/2/2019 Liu Weilin 2011 Thesis
http://slidepdf.com/reader/full/liu-weilin-2011-thesis 51/121
38
3.2 Photonic Generation of a Linearly Chirped Pulse
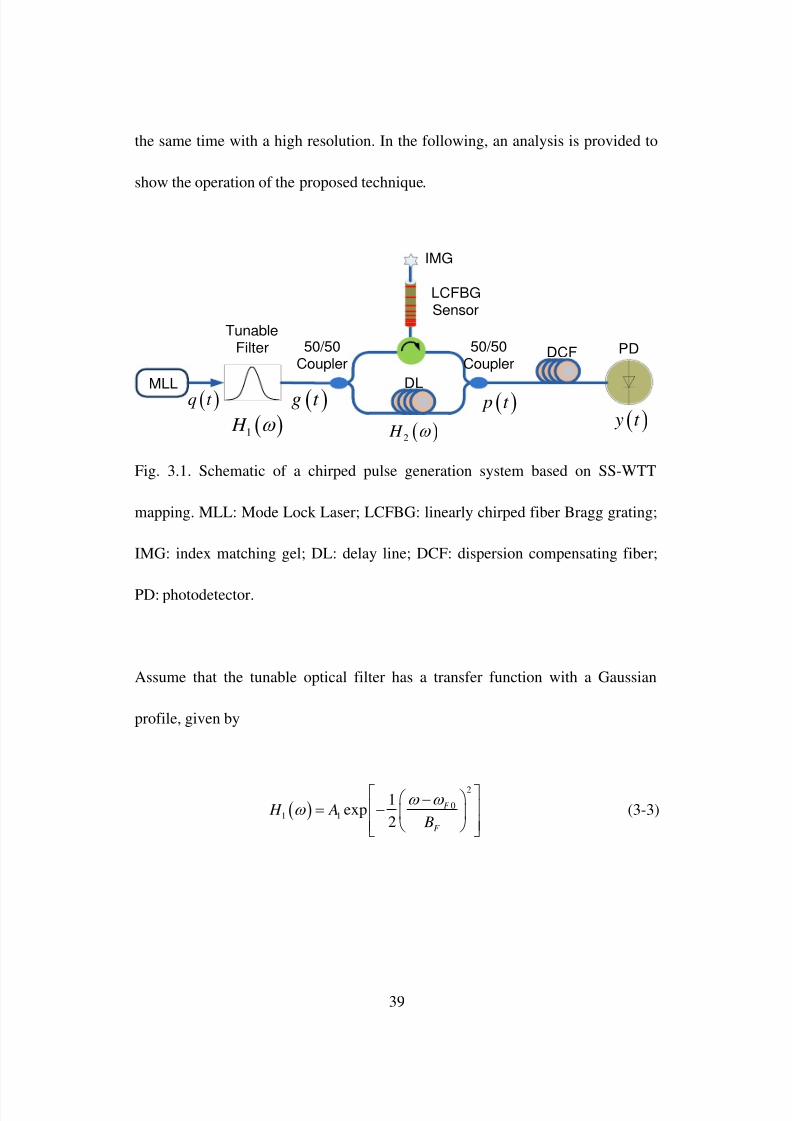
A typical chirped pulse generation system is shown in Fig. 3.1. It consists of a
mode-locked laser source, a tunable optical filter, an MZI incorporating an
LCFBG in one arm of the MZI, a dispersion compensating fiber (DCF) serving as
a dispersive element for linear WTT mapping, and a PD. An ultra-short pulse
generated by the mode-locked laser is sent to the MZI through a tunable optical
filter. The tunable optical filter is employed to control the temporal width of the
pulse to the MZI. The spectrum of the pulse from the tunable optical filter is then
shaped by the MZI. At the output of the MZI, an optical spectrum with increasing
FSR is generated. After WTT mapping in the DCF, a linearly chirped microwave
waveform is obtained at the output of the PD. Note that an offset of the FSR
profile would be resulted if the wavelength of the LCFBG is shifted. Thus, the
information, such as a strain applied to the LCFBG, is coded in the shaped
spectrum. After WTT mapping in the DCF, a linearly chirped microwave
waveform is obtained at the output of the PD. The chirped microwave waveform
is then sent to a digital processor to perform a correlation with a special reference
waveform. The location of the correlation peak would indicate the wavelength
shift of the LCFBG. Since the spectrum of the LCFBG is much wider than a
uniform FBG, the proposed interrogation system would provide a better SNR, at
8/2/2019 Liu Weilin 2011 Thesis
http://slidepdf.com/reader/full/liu-weilin-2011-thesis 52/121
39
the same time with a high resolution. In the following, an analysis is provided to
show the operation of the proposed technique.
DCF
DL
LCFBGSensor
50/50Coupler
TunableFilter
IMG
PD
1 H
q t g t
2 H
p t
y t
50/50Coupler
MLL
Fig. 3.1. Schematic of a chirped pulse generation system based on SS-WTT
mapping. MLL: Mode Lock Laser; LCFBG: linearly chirped fiber Bragg grating;
IMG: index matching gel; DL: delay line; DCF: dispersion compensating fiber;
PD: photodetector.
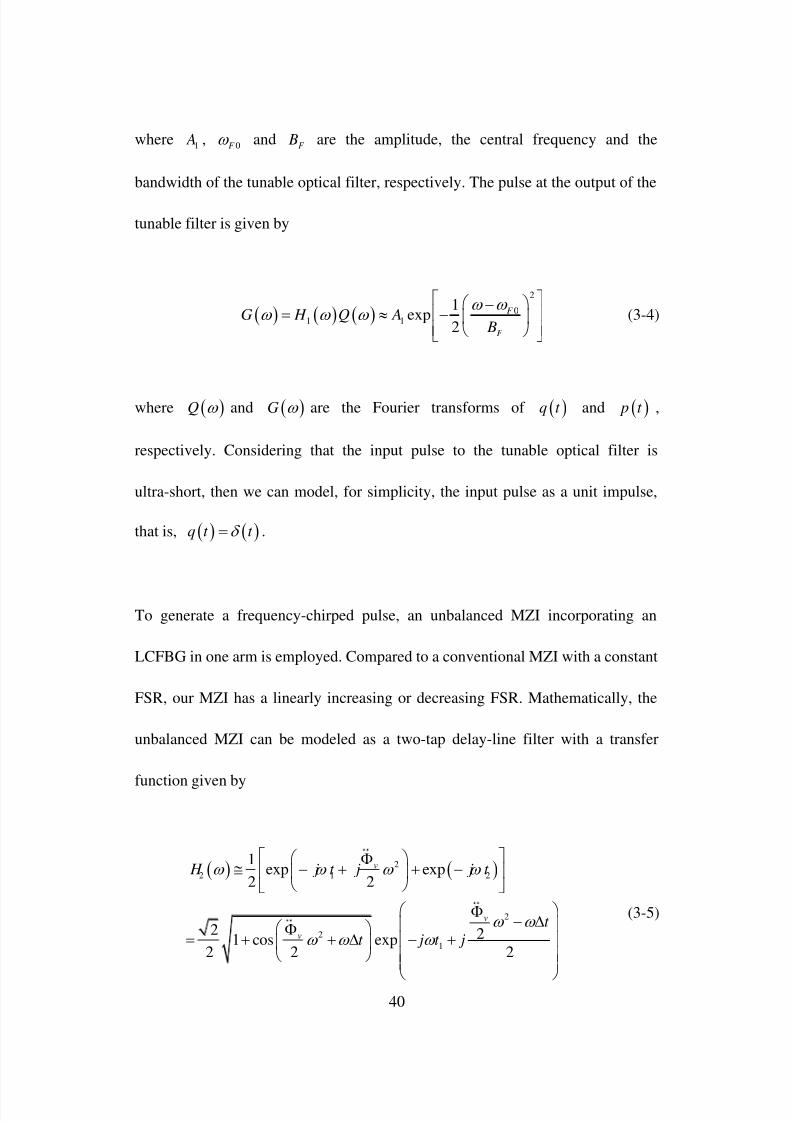
Assume that the tunable optical filter has a transfer function with a Gaussian
profile, given by
2
01 1
1exp
2
F
F
H A B
(3-3)
8/2/2019 Liu Weilin 2011 Thesis
http://slidepdf.com/reader/full/liu-weilin-2011-thesis 53/121
40
where1
A ,0F
andF
B are the amplitude, the central frequency and the
bandwidth of the tunable optical filter, respectively. The pulse at the output of the
tunable filter is given by
2
01 1
1exp
2
F
F
G H Q A B
(3-4)
where Q and G are the Fourier transforms of q t and p t ,
respectively. Considering that the input pulse to the tunable optical filter is
ultra-short, then we can model, for simplicity, the input pulse as a unit impulse,
that is, q t t .
To generate a frequency-chirped pulse, an unbalanced MZI incorporating an
LCFBG in one arm is employed. Compared to a conventional MZI with a constant
FSR, our MZI has a linearly increasing or decreasing FSR. Mathematically, the
unbalanced MZI can be modeled as a two-tap delay-line filter with a transfer
function given by
2
2 1 2
2
2
1
1exp exp
2 2
2 21 cos exp2 2 2
v
v
v
H j t j j t
t
t j t j
(3-5)

8/2/2019 Liu Weilin 2011 Thesis
http://slidepdf.com/reader/full/liu-weilin-2011-thesis 54/121
41
where1
t and2
t are the time delays in the two MZI arms,
0
2 2
vd d
(ps2) is the first-order dispersion coefficient of the
LCFBG, and2 1
t t t is the time delay difference between the two arms of the
unbalanced MZI. Since the higher order dispersion is small, only the first-order
dispersion of the LCFBG is considered.
Assume that the length difference between the two arms without a strain applied
to the LCFBG is L , the additional length difference caused by a strain is then
given by 2 / C , where is the wavelength shift of the LCFBG, which is
also a function of the applied strain, and C (nm/cm) is the chirp parameter of the
LCFBG. Thus, the total time difference is given by
2 / / eff t L C n c (3-6)
where eff n is the effective refractive index of the optical fiber, and c is the speed
of light in vacuum.
The magnitude response of the transfer function (3-5) could be simplified as
2cos
4 2
vt
, which determines the interference fringe pattern of the MZI.

8/2/2019 Liu Weilin 2011 Thesis
http://slidepdf.com/reader/full/liu-weilin-2011-thesis 55/121
42
The first-order dispersionv
determines the frequency chirp rate, and the
time-delay difference t consists of two parts: the first one, / eff
Ln c , is
wavelength-independent, which determines an offset central frequency; the
second part, 2 / / eff
Cn c , is wavelength-dependent, which determines the
central frequency shift of the generated chirped pulse due to the sensing
information change. Therefore, the MZI accomplishes two functions: spectral
shaping for chirped pulse generation and sensing information encoding.
The pulse at the output of the tunable optical filter is then sent to the MZI to
perform spectral shaping. At the output of the MZI, we have
2
2
201 1
2
2
1
2 1exp 1 cos exp
4 2 2 2
exp4
exp4
F v
F
v
v
P H G
t A t j t
B
j
P j
(3-7)
where

8/2/2019 Liu Weilin 2011 Thesis
http://slidepdf.com/reader/full/liu-weilin-2011-thesis 56/121
43
2
201 1 1
2 1exp 1 cos exp
4 2 2 2
F v
F
t P A t j t
B
(3-8)
Since the effect of the first-order dispersionv
in (3-7) is large and cannot be
ignored. In the following treatment, considering the system is linear and
time-invariant, the dispersion from the LCFBG can be combined with the
dispersion of the DCF, to perform jointly the WTT mapping. The total dispersion
for the WTT mapping is 2v D
, where D is the first-order dispersion
of the DCF. The temporal waveform at the output of the DCF is given [32]
2
1 /
1
exp 2 t y t j t P
(3-9)
By applying the waveform at the output of the DCF to a PD, we have a
photocurrent, given by
2
ps t R y t (3-10)
where R is the responsivity of the PD.
8/2/2019 Liu Weilin 2011 Thesis
http://slidepdf.com/reader/full/liu-weilin-2011-thesis 57/121
44
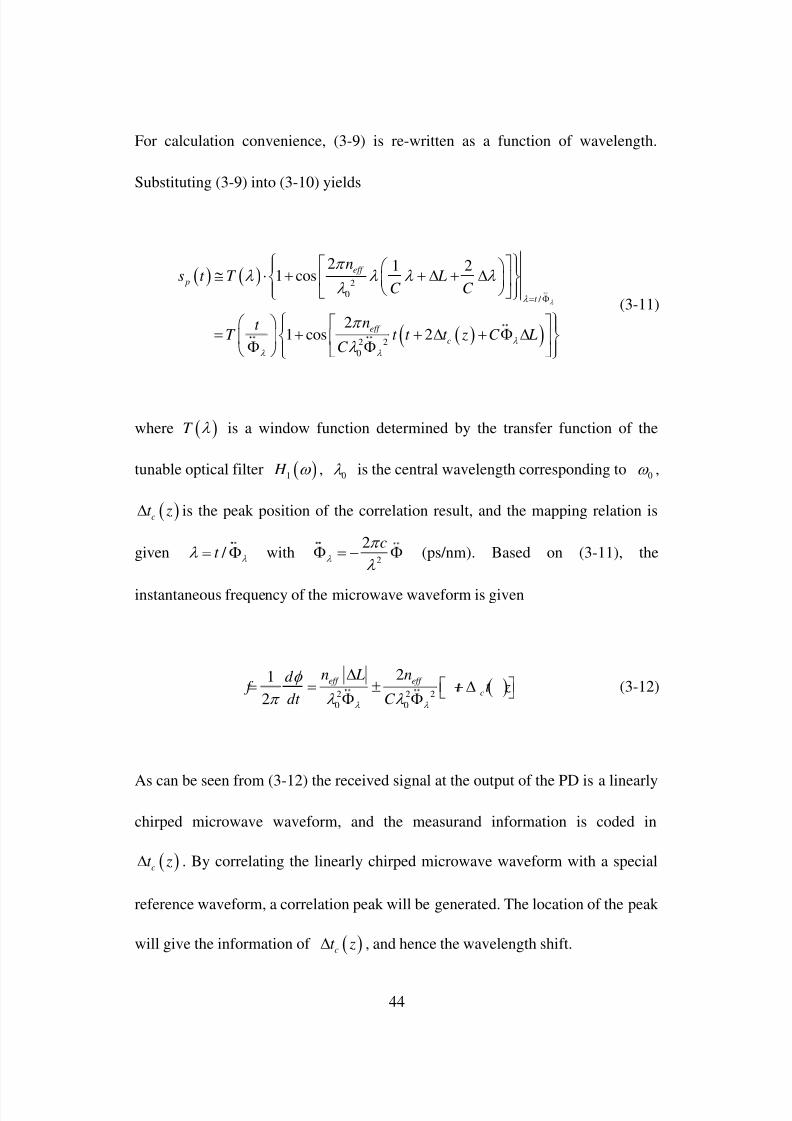
For calculation convenience, (3-9) is re-written as a function of wavelength.
Substituting (3-9) into (3-10) yields
2
0 /
2 2
0
2 1 21 cos
21 cos 2
eff
p
t
eff
c
ns t T L
C C
nt T t t t z C L
C
(3-11)
where T is a window function determined by the transfer function of the
tunable optical filter 1 H ,
0 is the central wavelength corresponding to
0 ,
c
t z is the peak position of the correlation result, and the mapping relation is
given / t
with2
2 c
(ps/nm). Based on (3-11), the
instantaneous frequency of the microwave waveform is given
2 2 2
0 0
21
2
eff eff
c
n L nd f t t z
dt C
(3-12)
As can be seen from (3-12) the received signal at the output of the PD is a linearly
chirped microwave waveform, and the measurand information is coded in
c
t z . By correlating the linearly chirped microwave waveform with a special
reference waveform, a correlation peak will be generated. The location of the peak
will give the information of ct z , and hence the wavelength shift.
8/2/2019 Liu Weilin 2011 Thesis
http://slidepdf.com/reader/full/liu-weilin-2011-thesis 58/121
45
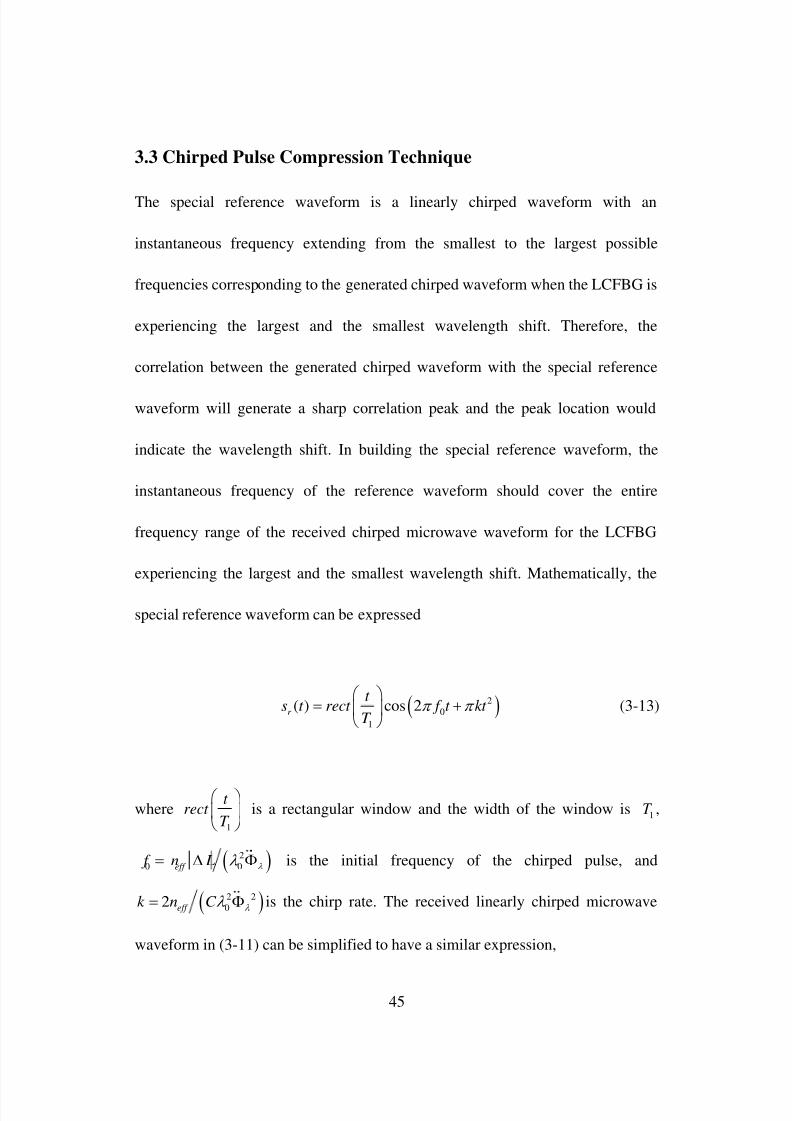
3.3 Chirped Pulse Compression Technique
The special reference waveform is a linearly chirped waveform with an
instantaneous frequency extending from the smallest to the largest possible
frequencies corresponding to the generated chirped waveform when the LCFBG is
experiencing the largest and the smallest wavelength shift. Therefore, the
correlation between the generated chirped waveform with the special reference
waveform will generate a sharp correlation peak and the peak location would
indicate the wavelength shift. In building the special reference waveform, the
instantaneous frequency of the reference waveform should cover the entire
frequency range of the received chirped microwave waveform for the LCFBG
experiencing the largest and the smallest wavelength shift. Mathematically, the
special reference waveform can be expressed
2
0
1
( ) cos 2r
t s t rect f t kt
T
(3-13)
where1
t rect
T
is a rectangular window and the width of the window is1
T ,
2
0 0eff f n L is the initial frequency of the chirped pulse, and
2 2
02 eff
k n C is the chirp rate. The received linearly chirped microwave
waveform in (3-11) can be simplified to have a similar expression,

8/2/2019 Liu Weilin 2011 Thesis
http://slidepdf.com/reader/full/liu-weilin-2011-thesis 59/121
46
2
02
( ) cos 2 p c
t
s t rect f t k t z t kt T
(3-14)
where2
T (2 1
T T ) is the time duration of the received linearly chirped
microwave waveform. Note that the envelope of the generated chirped waveform
is Gaussian-shaped. In (3-12) we use a rectangular envelope to replace the
Gaussian envelope, which will simplify the mathematical derivations.
Rewrite (3-11) and (3-12), we have
0
1
2( ) Re ( )
j f t
r T s t s t e
(3-15)
where 2
1
1
j k t
T
t s t rect e
T
.
0
2
2Re
j f t
p T s t s t e
(3-16)
where 2
2
2
c j k t z t t
T
t s t rect e
T
.
Hence, the correlation between the generated chirped microwave waveform and
special reference is given,
8/2/2019 Liu Weilin 2011 Thesis
http://slidepdf.com/reader/full/liu-weilin-2011-thesis 60/121
47
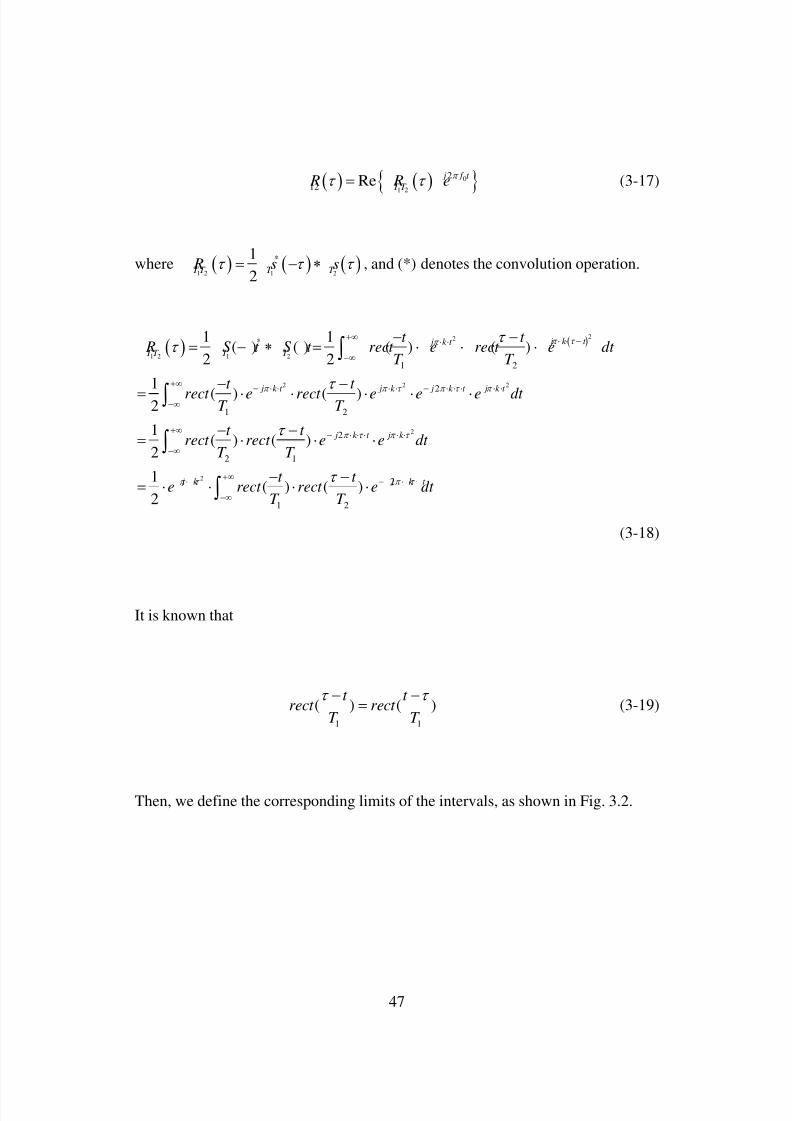
0
1 2
2
12Re
j f t
T T R R e
(3-17)
where 1 2 1 2
*1
2T T T T
R s s , and (*) denotes the convolution operation.
22
1 2 1 2
2 2 2
2
*
1 2
2
1 2
2
2 1
1 1( ) ( ) ( ) ( )
2 2
1( ) ( )
2
1( ) ( )
2
j k t j k t
T T T T
j k t j k j k t j k t
j k t j k
t t R S t S t rect e rect e dt
T T
t t rect e rect e e e dt
T T
t t rect rect e e dt
T T
22
1 2
1( ) ( )
2
j k j k t t t e rect rect e dt
T T
(3-18)
It is known that
1 1
( ) ( )t t
rect rect T T
(3-19)
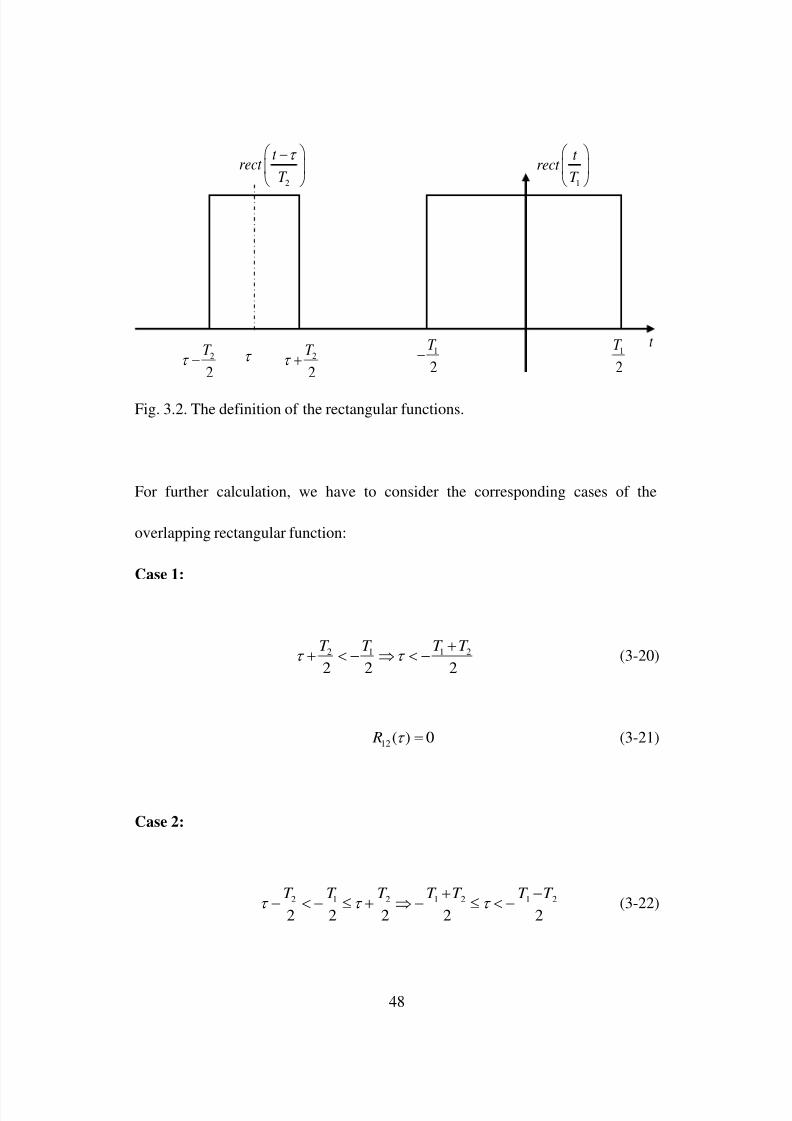
Then, we define the corresponding limits of the intervals, as shown in Fig. 3.2.
8/2/2019 Liu Weilin 2011 Thesis
http://slidepdf.com/reader/full/liu-weilin-2011-thesis 61/121
48
Fig. 3.2. The definition of the rectangular functions.
For further calculation, we have to consider the corresponding cases of the
overlapping rectangular function:
Case 1:
2 1 1 2
2 2 2
T T T T
(3-20)
12( ) 0 R (3-21)
Case 2:
2 1 2 1 2 1 2
2 2 2 2 2
T T T T T T T
(3-22)
2
2
T 2
2
T
1
2
T
1
2
T t
2
t rect
T
1
t rect
T
8/2/2019 Liu Weilin 2011 Thesis
http://slidepdf.com/reader/full/liu-weilin-2011-thesis 62/121
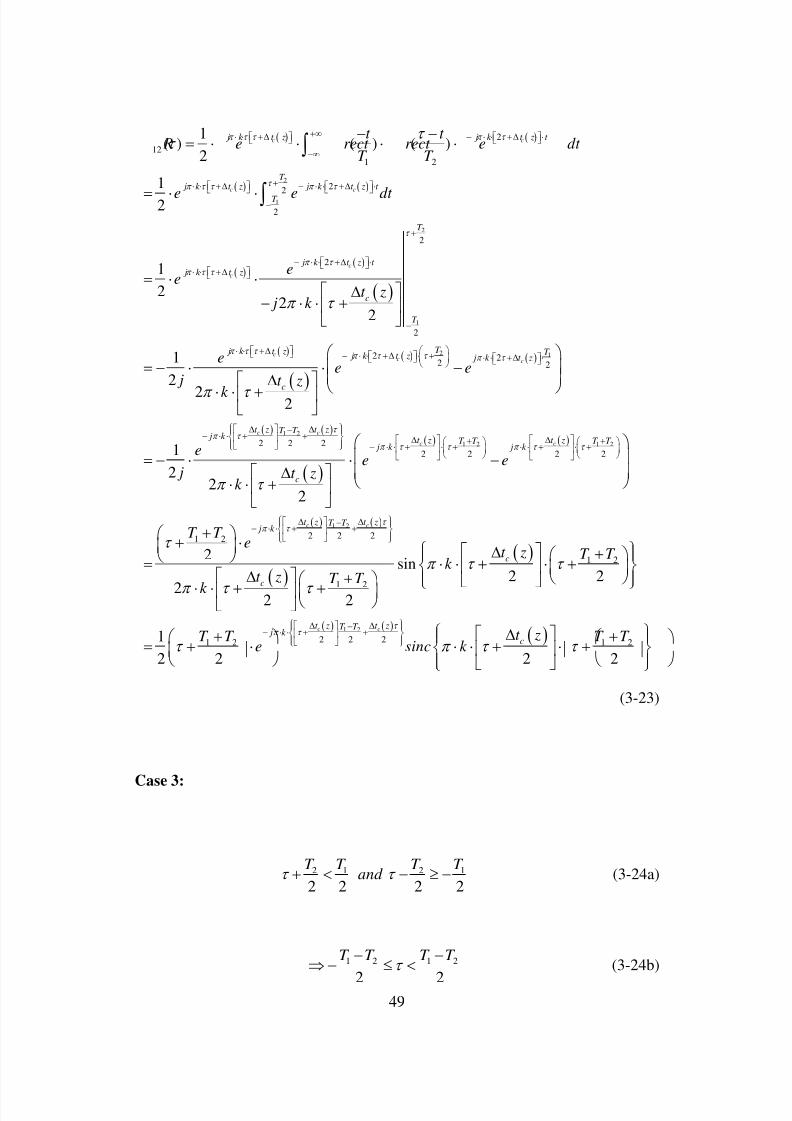
49
2
1
1
2
12
1 2
22
2
2
2
1( ) ( ) ( )
2
1
2
1
22
2
c c
c c
c
c
j k t z j k t z t
T j k t z j k t z t
T
j k t z t j k t z
c
T
t t R e rect rect e dt
T T
e e dt
ee
t z j k
2
2 1
1 2
1
2
2 22 2
2 2 2
2
1
2
2 2
1
22
2
cc c
c c
c
T
T j k t z T j k t z j k t z
c
t z t zT T j k t z T T
j k
c
ee e
j t z
k
ee
j t zk
2 1 2
1 2
2 2 2
2 2 21 2
1 2
1 2
1 2
2sin
2 2
2 2 2
1
2 2
c
c c
t z T T j k
t z t zT T j k
c
c
e
T T e
t z T T k
t z T T k
T T
1 2
2 2 2 1 2
2 2
c ct z t zT T j k
ct z T T
e sinc k
(3-23)
Case 3:
2 1 2 1
2 2 2 2
T T T T and (3-24a)
1 2 1 2
2 2
T T T T
(3-24b)
8/2/2019 Liu Weilin 2011 Thesis
http://slidepdf.com/reader/full/liu-weilin-2011-thesis 63/121
50
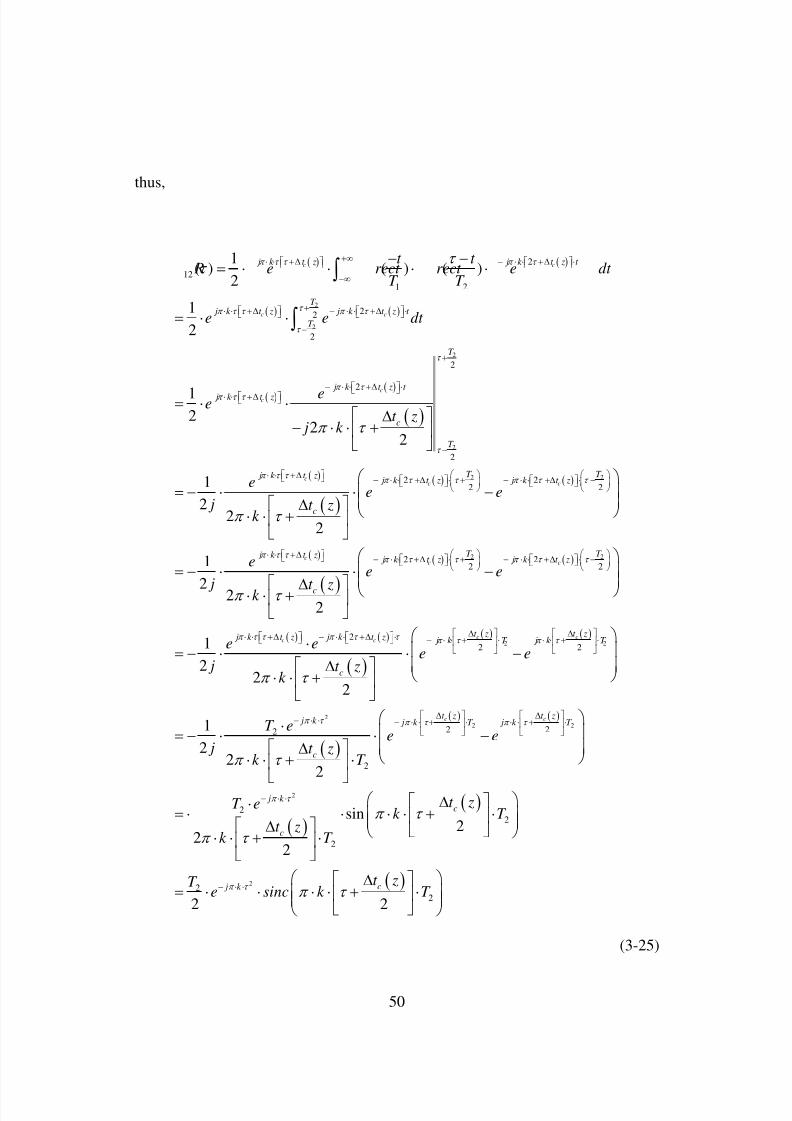
thus,
2
2
2
2
12
1 2
22
2
2
2
1( ) ( ) ( )
2
1
2
12
22
c c
c c
cc
j k t z j k t z t
T j k t z j k t z t
T
j k t z t j k t z
c
T
t t R e rect rect e dt
T T
e e dt
eet z
j k
2
2 2
2
2
2 22 2
2 22
1
22
2
1
2 22
cc c
cc
T
T T j k t z j k t z j k t z
c
T j k t z j k t z j k
c
ee e
j t zk
ee e
j t zk
2
2 2
2
2
2
2 2
22
2
1
22
2
1
22
2
c
c cc c
c
T t z
t z t z j k t z j k t z j k T j k T
c
t z j k j k
c
e ee e
j t zk
T ee
j t zk T
2 2
2
2
2
22
2
2
2
sin2
22
2 2
ct zT j k T
j k c
c
c j k
e
t zT ek T
t zk T
t zT e sinc k T
(3-25)
8/2/2019 Liu Weilin 2011 Thesis
http://slidepdf.com/reader/full/liu-weilin-2011-thesis 64/121
51
Case 4:
2 1 2
2 2 2
T T T (3-26a)
1 2 1 2
2 2
T T T T
(3-26b)
8/2/2019 Liu Weilin 2011 Thesis
http://slidepdf.com/reader/full/liu-weilin-2011-thesis 65/121
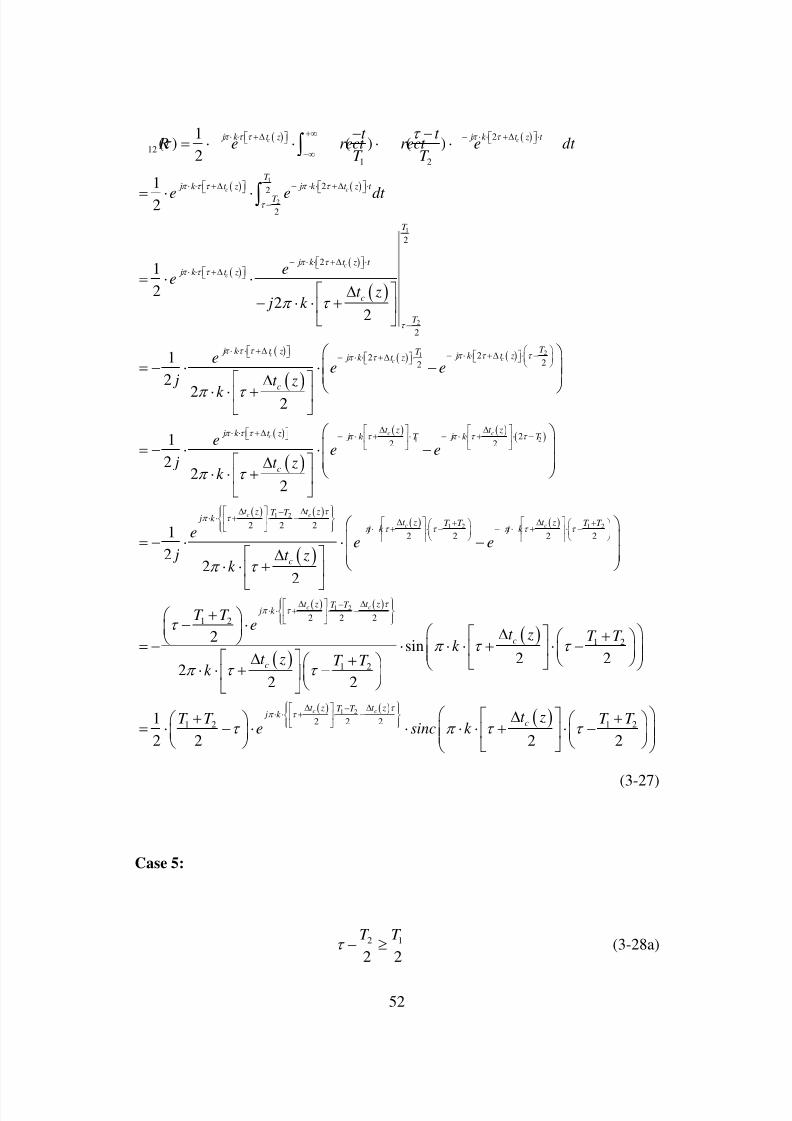
52
1
2
1
2
2
12
1 2
22
2
2
2
1( ) ( ) ( )
2
1
2
1
22
2
c c
c c
c
c
j k t z j k t z t
T j k t z j k t z t
T
T
j k t z t j k t z
c
T
t t R e rect rect e dt
T T
e e dt
ee
t z j k
21
1 2
2
2222
22 2
1
2
2 2
1
22
2
ccc
c cc
T j k t z T j k t z j k t z
c
t z t z j k t z j k T j k T
c
ee e
j t z
k
ee e
j t zk
1 2
1 2 1 2
1 2
2 2 2
2 2 2 2
2 21 2
1
22
2
2
c c
c c
c c
t z t zT T j k t z t zT T T T
j k j k
c
t z t zT T j k
ee e
j t zk
T T e
1 2
2
1 2
1 2
2 2 21 2 1 2
sin2 2
22 2
1
2 2 2 2
c c
c
c
t z t zT T j k
c
t z T T k
t z T T k
t zT T T T e sinc k
(3-27)
Case 5:
2 1
2 2
T T (3-28a)

8/2/2019 Liu Weilin 2011 Thesis
http://slidepdf.com/reader/full/liu-weilin-2011-thesis 66/121
53
1 2
2
T T
(3-28b)
12( ) 0 R (3-29)
Summary of case 2, 3 and 4:
1 2 1 2
2 2
T T T T
(3-30)
Case 2:
1 2
2 2 21 212
1 2
1( )
2 2
2 2
c ct z t zT T j k
c
T T R e
t z T T sinc k
(3-31)
Case 3:
22
12 2( )
2 2
c j k t zT
R e sinc k T
(3-32)
Case 4:

8/2/2019 Liu Weilin 2011 Thesis
http://slidepdf.com/reader/full/liu-weilin-2011-thesis 67/121
54
1 2
2 2 21 2
12
1 2
1( )
2 2
2 2
c ct z t zT T j k
c
T T R e
t z T T sinc k
(3-33)
Equation (3-15) can be further written as
12
1( ) cos 2
2 2
c
e
t z R w sinc k w f
(3-34)
where w ,e
f and are respectively given by,
1 2 1 2 1 2
2 1 2 1 2
1 2 1 2 1 2
,2 2 2
,2 2 2
,2 2 2
0,
T T T T T T
T T T T T
w
T T T T T T
otherwise
(3-35)
1 2 1 2 1 2
0
1 2 1 2
0
1 2 1 2 1 2
0
,2 2 2 2 2
,2 2 2
,2 2 2 2 2
0,
c
e
c
t zT T T T T T k f
T T T T k f
f
t zT T T T T T k f
otherwise
(3-36)

8/2/2019 Liu Weilin 2011 Thesis
http://slidepdf.com/reader/full/liu-weilin-2011-thesis 68/121
55
and
1 2 1 2
1 2
1 2 1 2
1 2
1,
4 2 2
1,
4 2 2
0,
c
c
T T T T k T T C t z
T T T T k T T C t z
otherwise
(3-37)
The correlation function in (3-34) establishes a straightforward mathematical
relationship between the peak location and the time difference caused by the
wavelength shift of the LCFBG. The correlation function is a Sinc function, and
the first zero points are at 2 1c r
t z B , where2r
B kT is the
bandwidth of the received microwave signal. If the chirp bandwidth increases the
first zero points would shift in a way such that the mainlobe of the correlation
function would be narrow and thus increasing the resolution of the LCFBG
sensor. For example, to obtain a compression ratio of 100 for a 400 ps pulse, the
bandwidth of the microwave pulse should be 5 GHz, which means the chirp rate
of the microwave pulse should be 0.0125 GHz/ps. In addition, the relationship
between the applied strain and wavelength shift is given by [36]
01
c (3-38)

8/2/2019 Liu Weilin 2011 Thesis
http://slidepdf.com/reader/full/liu-weilin-2011-thesis 69/121
56
where is the photoelastic coefficient of the LCFBG fiber. This coefficient is
determined by the refractive index and the fiber-optic strain tensor. Considering
(3-6), (3-12), (3-18), and (3-34), we have,
0
1
2 1c
t z
(3-39)
From (3-39) we can see that the wavelength shift is a linear function of the peak
location of the correlation.
8/2/2019 Liu Weilin 2011 Thesis
http://slidepdf.com/reader/full/liu-weilin-2011-thesis 70/121
57
3.4 Summary
In this chapter, the principle of real-time interrogation of a LCFBG with chirped
pulse compression to increase the resolution and signal to noise ratio was
presented. The expression for the generated chirped microwave waveform was
developed and the design of the special reference waveform was provided. The
expression for the correlation between the generated chirped microwave
waveform and the special reference waveform was also derived.
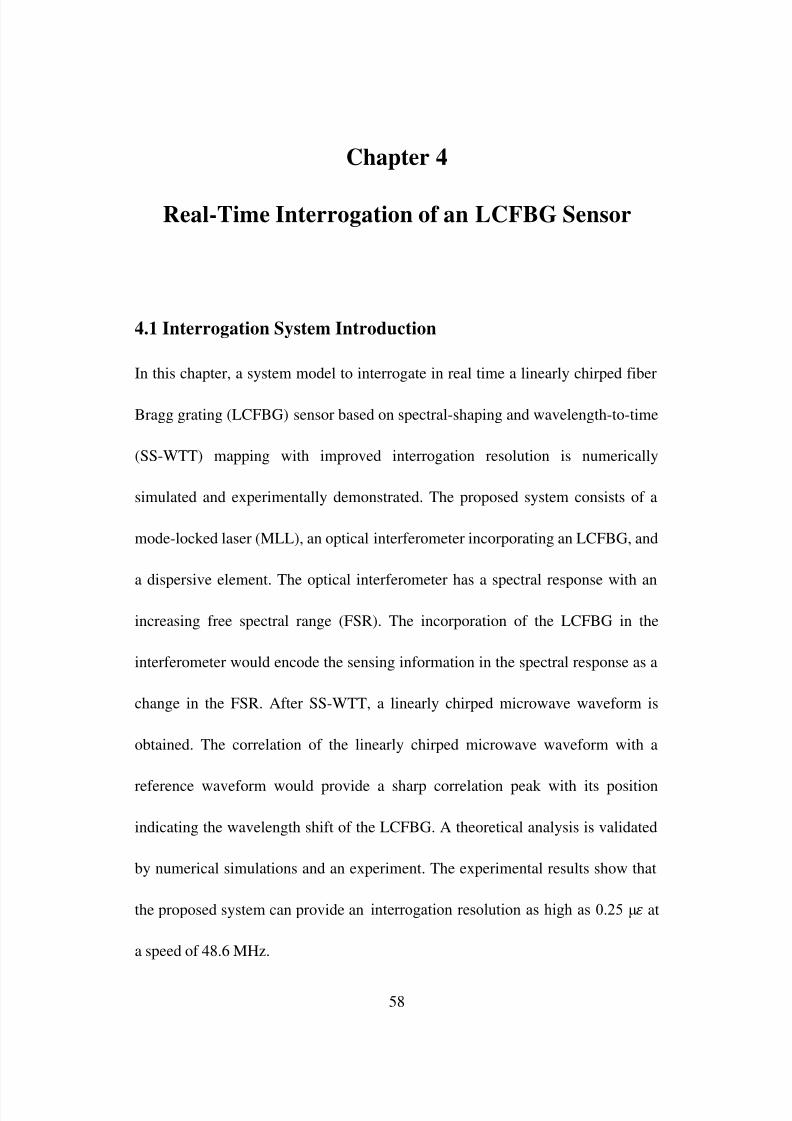
8/2/2019 Liu Weilin 2011 Thesis
http://slidepdf.com/reader/full/liu-weilin-2011-thesis 71/121
58
Chapter 4
Real-Time Interrogation of an LCFBG Sensor
4.1 Interrogation System Introduction
In this chapter, a system model to interrogate in real time a linearly chirped fiber
Bragg grating (LCFBG) sensor based on spectral-shaping and wavelength-to-time
(SS-WTT) mapping with improved interrogation resolution is numerically
simulated and experimentally demonstrated. The proposed system consists of a
mode-locked laser (MLL), an optical interferometer incorporating an LCFBG, and
a dispersive element. The optical interferometer has a spectral response with an
increasing free spectral range (FSR). The incorporation of the LCFBG in the
interferometer would encode the sensing information in the spectral response as a
change in the FSR. After SS-WTT, a linearly chirped microwave waveform is
obtained. The correlation of the linearly chirped microwave waveform with a
reference waveform would provide a sharp correlation peak with its position
indicating the wavelength shift of the LCFBG. A theoretical analysis is validated
by numerical simulations and an experiment. The experimental results show that
the proposed system can provide an interrogation resolution as high as 0.25 μ at
a speed of 48.6 MHz.

8/2/2019 Liu Weilin 2011 Thesis
http://slidepdf.com/reader/full/liu-weilin-2011-thesis 72/121
59
4.2 Numerical Simulation
In the proposed real-time LCFBG sensor interrogation system, the correlation
between the linearly chirped microwave waveform and the special reference
would demodulate the measurement information in which the wavelength shift is
obtained by measuring the location of the correlation peak. Since the correlation
peak is narrow due to the pulse compression, the resolution is improved. In
addition, it is well known for a waveform that is embedded in a stationary white
noise, the correlation between the waveform and its reference would provide a
maximum SNR. Therefore, the trade-off between the resolution and SNR existing
in [30] will no longer exist here.
In the following, a simulation is performed to demonstrate the operation of the
proposed system for the LCFBG sensor interrogation with an improved resolution
and SNR.
First, we build a special reference waveform. The special reference waveform is a
linearly chirped waveform with a chirp rate of -0.068 GHz/ps, which is identical
to that of the generated chirped microwave waveform, but with an instantaneous
frequency extending from the smallest to the largest possible values

8/2/2019 Liu Weilin 2011 Thesis
http://slidepdf.com/reader/full/liu-weilin-2011-thesis 73/121
60
corresponding to the generated chirped microwave waveform when the LCFBG is
experiencing the largest and the smallest wavelength shift. Since the central
frequency of the special reference waveform can be controlled by tuning the time
delay in the lower arm of the MZI, to ease the need for high frequency
components, the central frequency of the special reference waveform is controlled
zero. Thus, the special reference waveform has a chirp rate that is -0.068 GHz/ps
for 0t and 0.068 GHz/ps for 0t , as shown in Fig. 4.1. The time duration of
the special reference waveform is 1400 ps, covering an instantaneous frequency
from 47.6 GHz to 0 GHz for 0t and 0 GHz to 47.6 GHz for 0t .
-800 -600 -400 -200 0 200 400 600 800-1
-0.8
-0.6
-0.4
-0.2
0
0.2
0.4
0.6
0.8
1
Time (ps)
N o r m a l i z e d A p m p l i t u d e
Fig. 4.1. The reference microwave waveform which has an instantaneous
frequency range from 0 GHz to 47.6 GHz.
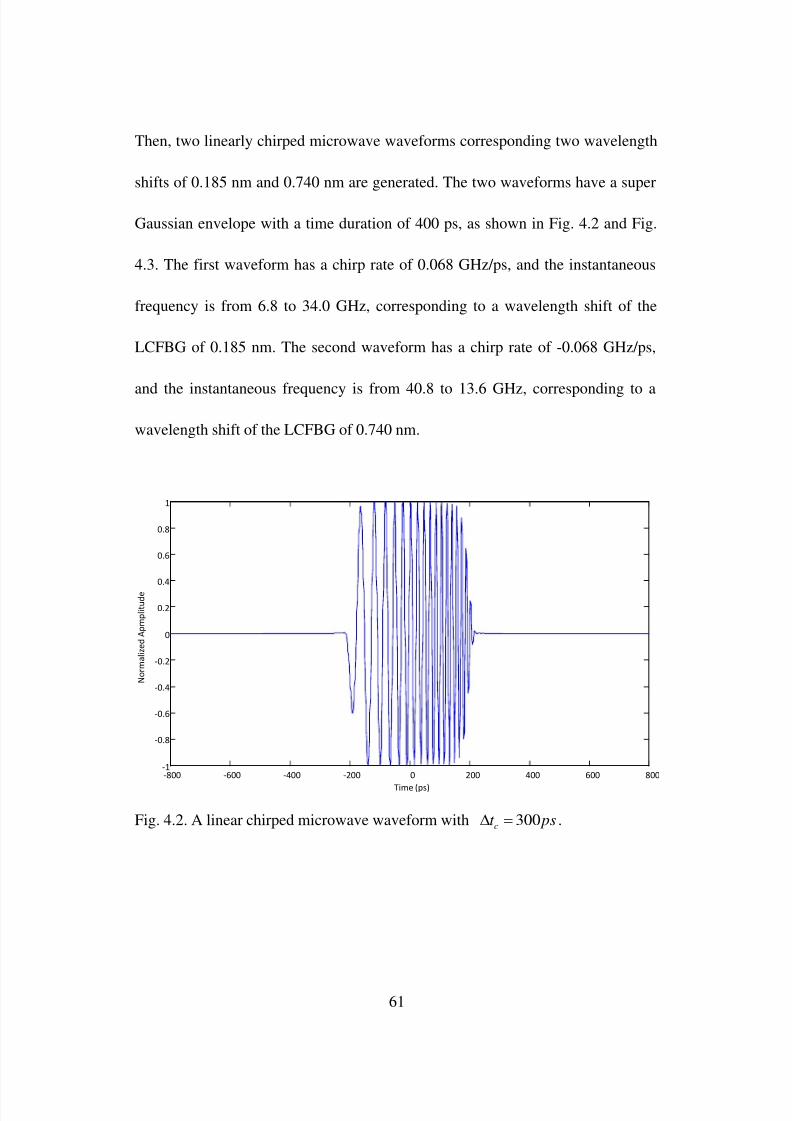
8/2/2019 Liu Weilin 2011 Thesis
http://slidepdf.com/reader/full/liu-weilin-2011-thesis 74/121
61
Then, two linearly chirped microwave waveforms corresponding two wavelength
shifts of 0.185 nm and 0.740 nm are generated. The two waveforms have a super
Gaussian envelope with a time duration of 400 ps, as shown in Fig. 4.2 and Fig.
4.3. The first waveform has a chirp rate of 0.068 GHz/ps, and the instantaneous
frequency is from 6.8 to 34.0 GHz, corresponding to a wavelength shift of the
LCFBG of 0.185 nm. The second waveform has a chirp rate of -0.068 GHz/ps,
and the instantaneous frequency is from 40.8 to 13.6 GHz, corresponding to a
wavelength shift of the LCFBG of 0.740 nm.
-800 -600 -400 -200 0 200 400 600 800-1
-0.8
-0.6
-0.4
-0.2
0
0.2
0.4
0.6
0.8
1
Time (ps)
N o r m a l i z e d A p m p l i t u d e
Fig. 4.2. A linear chirped microwave waveform with 300c
t ps .

8/2/2019 Liu Weilin 2011 Thesis
http://slidepdf.com/reader/full/liu-weilin-2011-thesis 75/121
62
-800 -600 -400 -200 0 200 400 600 800-1
-0.8
-0.6
-0.4
-0.2
0
0.2
0.4
0.6
0.8
1
Time (ps)
N o r m a l i z e d A p m p l i t u d e
Fig. 4.3. A linear chirped microwave waveform with 300c
t ps .
The two generated linearly chirped microwave waveforms are then correlated
with the special reference waveform. The results are shown in Fig. 4.4. As can be
seen, two correlation peaks corresponding to the two linearly chirped microwave
waveforms are observed. The locations of the two peaks reveal the wavelength
shift information. Since the pulse is compressed by 133 times, the resolution is
improved by 133 times. To evaluate the robustness of the interrogation system to
noise, a stationary white noise is added to the waveform shown in Fig. 4.2, to
make the linearly chirped microwave waveform have an SNR of 0 dB. The
waveform with an added noise is shown in Fig. 4.5. The correlation of the noisy
waveform with the special reference waveform is shown in Fig. 4.6. As expected,
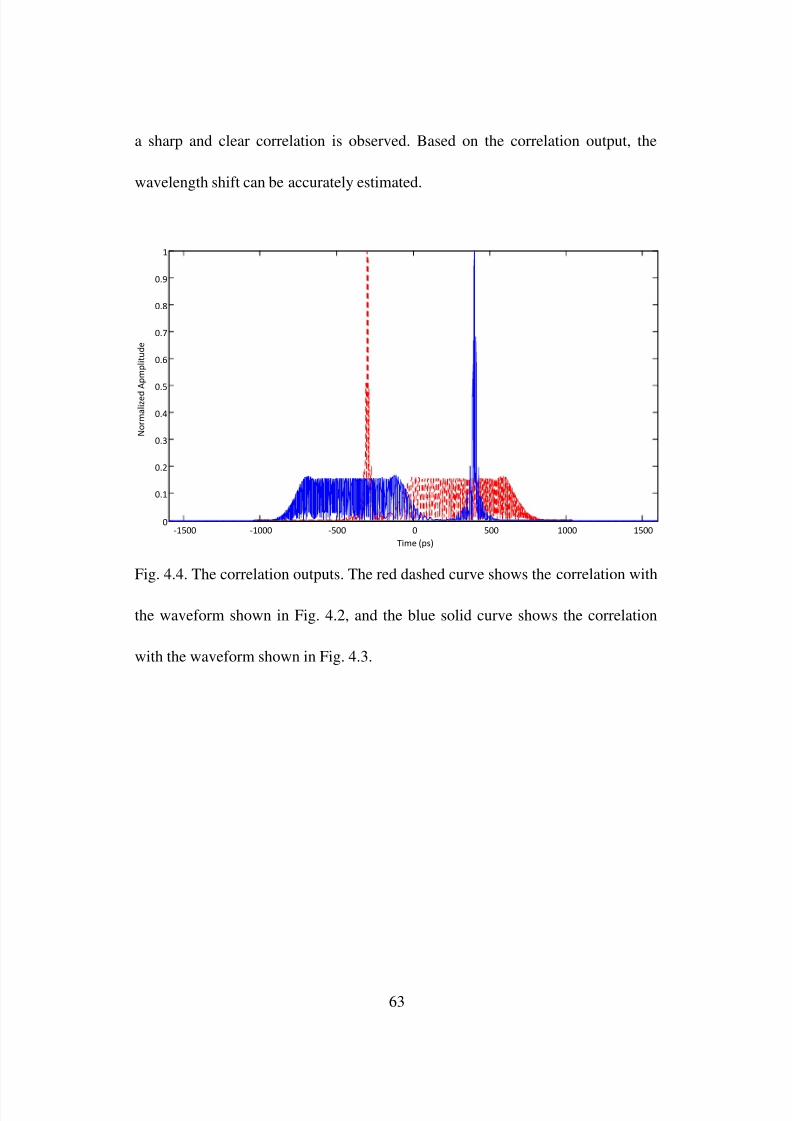
8/2/2019 Liu Weilin 2011 Thesis
http://slidepdf.com/reader/full/liu-weilin-2011-thesis 76/121
63
a sharp and clear correlation is observed. Based on the correlation output, the
wavelength shift can be accurately estimated.
-1500 -1000 -500 0 500 1000 15000
0.1
0.2
0.3
0.4
0.5
0.6
0.7
0.8
0.9
1
Time (ps)
N o r m a l i z e d
A p m p l i t u d e
Fig. 4.4. The correlation outputs. The red dashed curve shows the correlation with
the waveform shown in Fig. 4.2, and the blue solid curve shows the correlation
with the waveform shown in Fig. 4.3.
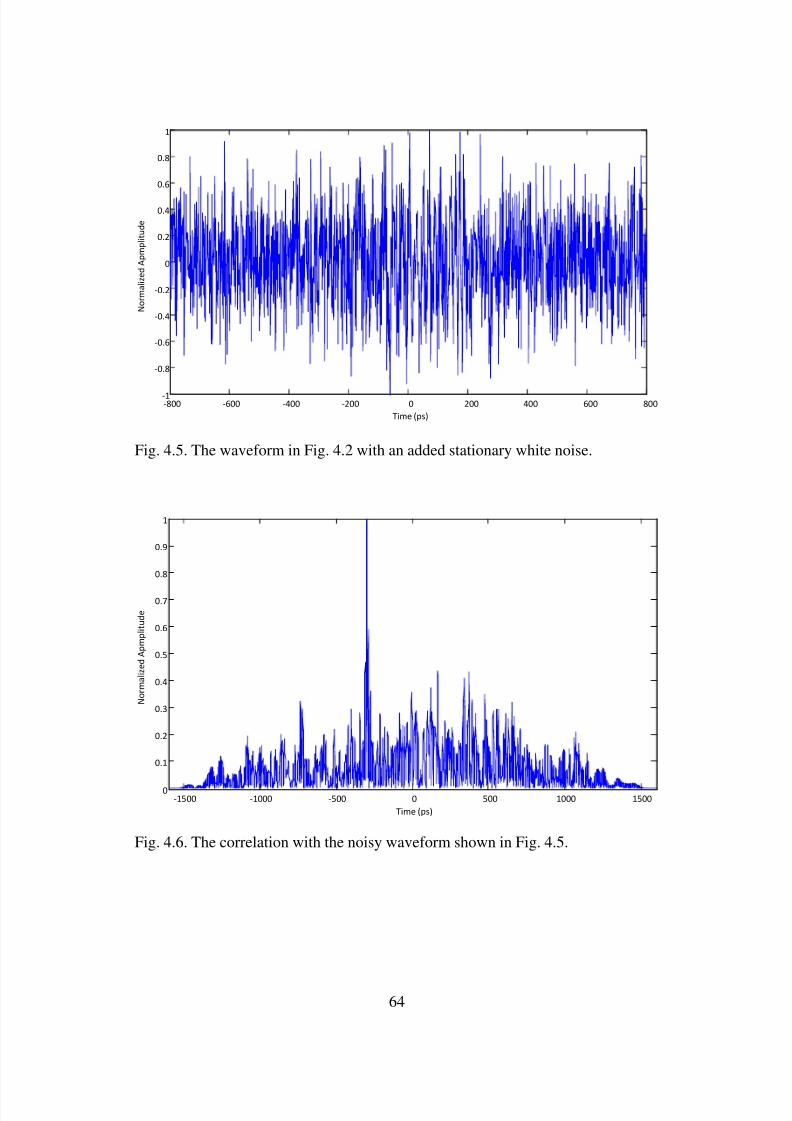
8/2/2019 Liu Weilin 2011 Thesis
http://slidepdf.com/reader/full/liu-weilin-2011-thesis 77/121
64
-800 -600 -400 -200 0 200 400 600 800-1
-0.8
-0.6
-0.4
-0.2
0
0.2
0.4
0.6
0.8
1
Time (ps)
N o r m a l i z e d A p m p l i t u d e
Fig. 4.5. The waveform in Fig. 4.2 with an added stationary white noise.
-1500 -1000 -500 0 500 1000 15000
0.1
0.2
0.3
0.4
0.5
0.6
0.7
0.8
0.9
1
Time (ps)
N o r m a l i z e d A p m p l i t u d e
Fig. 4.6. The correlation with the noisy waveform shown in Fig. 4.5.
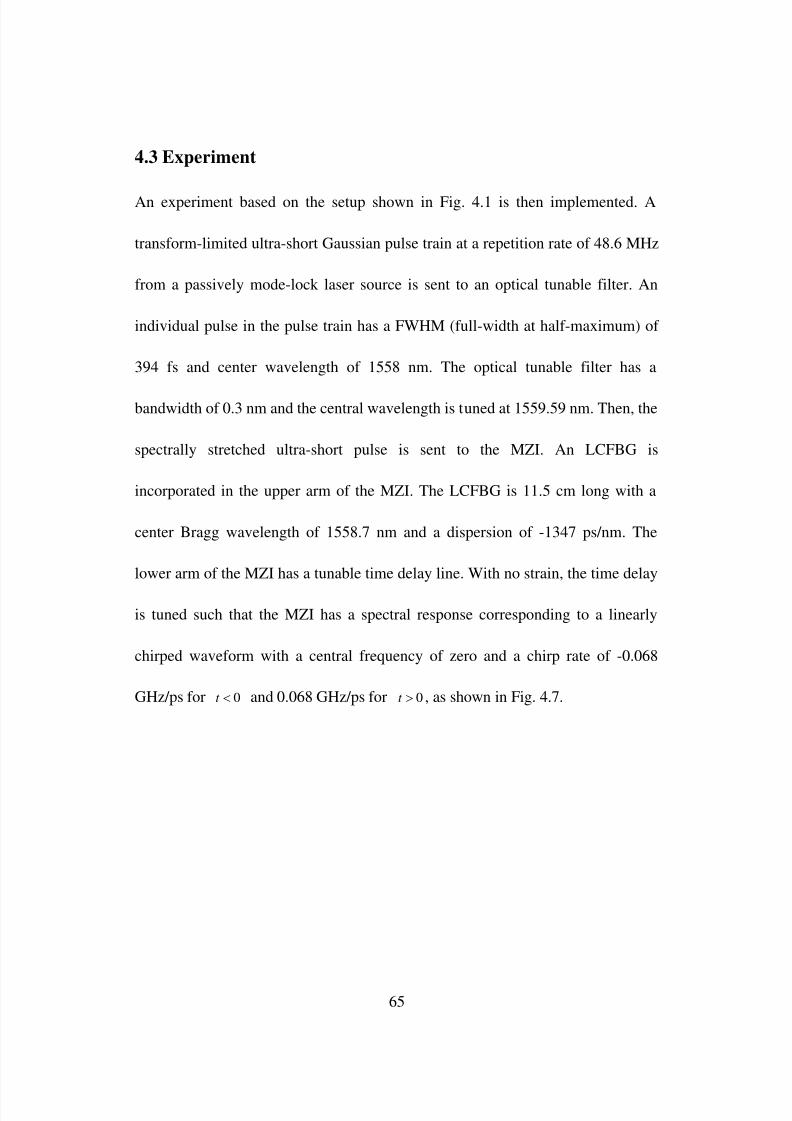
8/2/2019 Liu Weilin 2011 Thesis
http://slidepdf.com/reader/full/liu-weilin-2011-thesis 78/121
65
4.3 Experiment
An experiment based on the setup shown in Fig. 4.1 is then implemented. A
transform-limited ultra-short Gaussian pulse train at a repetition rate of 48.6 MHz
from a passively mode-lock laser source is sent to an optical tunable filter. An
individual pulse in the pulse train has a FWHM (full-width at half-maximum) of
394 fs and center wavelength of 1558 nm. The optical tunable filter has a
bandwidth of 0.3 nm and the central wavelength is tuned at 1559.59 nm. Then, the
spectrally stretched ultra-short pulse is sent to the MZI. An LCFBG is
incorporated in the upper arm of the MZI. The LCFBG is 11.5 cm long with a
center Bragg wavelength of 1558.7 nm and a dispersion of -1347 ps/nm. The
lower arm of the MZI has a tunable time delay line. With no strain, the time delay
is tuned such that the MZI has a spectral response corresponding to a linearly
chirped waveform with a central frequency of zero and a chirp rate of -0.068
GHz/ps for 0t and 0.068 GHz/ps for 0t , as shown in Fig. 4.7.
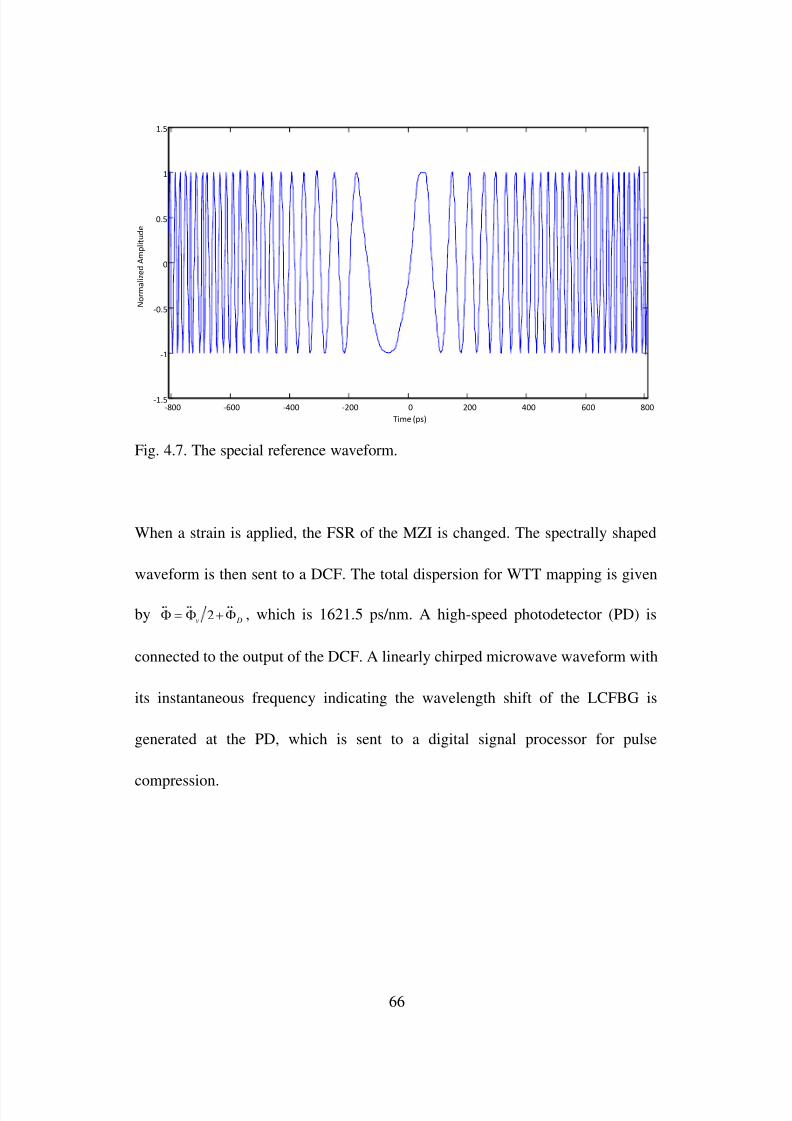
8/2/2019 Liu Weilin 2011 Thesis
http://slidepdf.com/reader/full/liu-weilin-2011-thesis 79/121
66
-800 -600 -400 -200 0 200 400 600 800-1.5
-1
-0.5
0
0.5
1
1.5
Time (ps)
N o r m a l i z e d A m p l i t u d e
Fig. 4.7. The special reference waveform.
When a strain is applied, the FSR of the MZI is changed. The spectrally shaped
waveform is then sent to a DCF. The total dispersion for WTT mapping is given
by 2v D
, which is 1621.5 ps/nm. A high-speed photodetector (PD) is
connected to the output of the DCF. A linearly chirped microwave waveform with
its instantaneous frequency indicating the wavelength shift of the LCFBG is
generated at the PD, which is sent to a digital signal processor for pulse
compression.
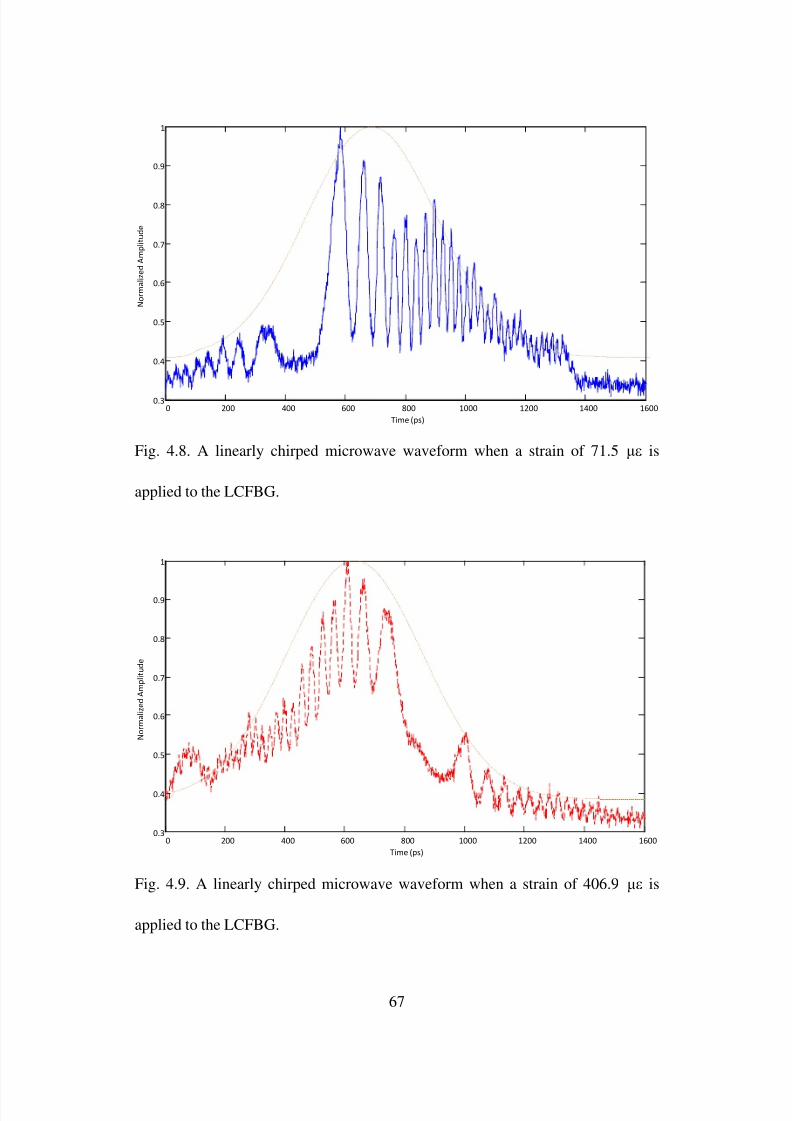
8/2/2019 Liu Weilin 2011 Thesis
http://slidepdf.com/reader/full/liu-weilin-2011-thesis 80/121
67
0 200 400 600 800 1000 1200 1400 16000.3
0.4
0.5
0.6
0.7
0.8
0.9
1
Time (ps)
N o r m a l i z e d A m p l i t u d e
Fig. 4.8. A linearly chirped microwave waveform when a strain of 71.5 μ is
applied to the LCFBG.
0 200 400 600 800 1000 1200 1400 16000.3
0.4
0.5
0.6
0.7
0.8
0.9
1
Time (ps)
N o r m a l i z e d A m p l i t u d e
Fig. 4.9. A linearly chirped microwave waveform when a strain of 406.9 μ is
applied to the LCFBG.
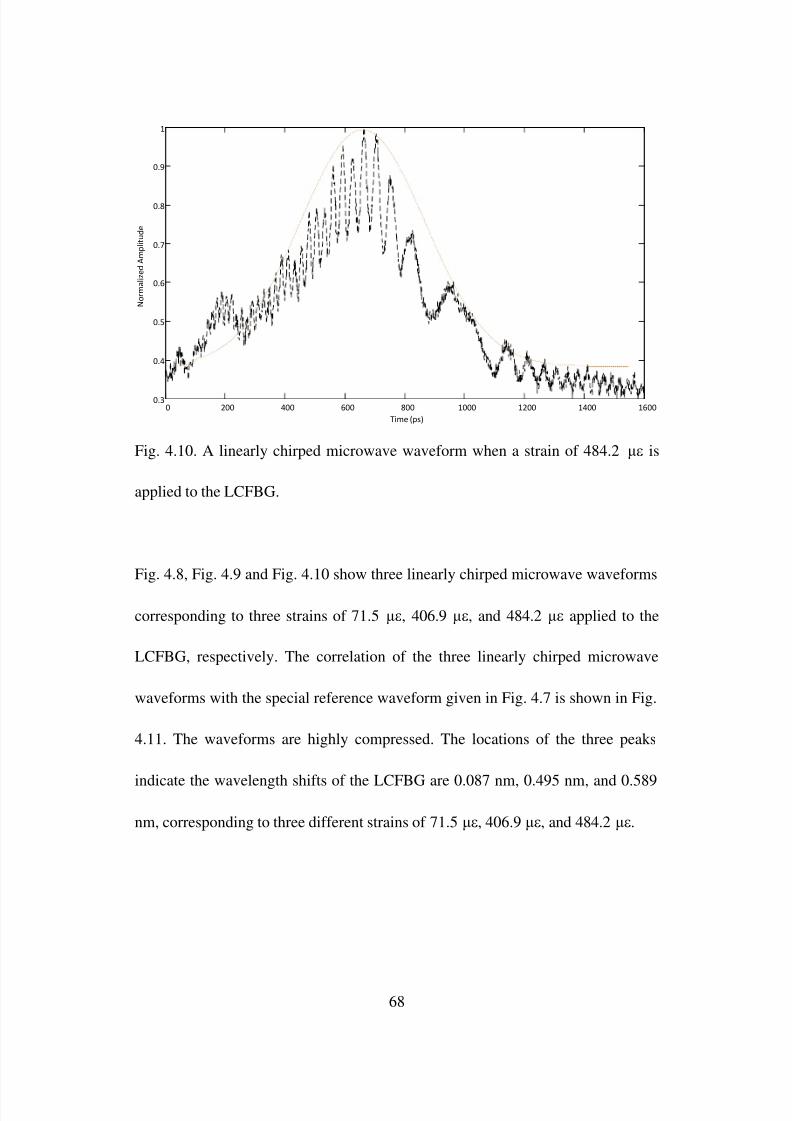
8/2/2019 Liu Weilin 2011 Thesis
http://slidepdf.com/reader/full/liu-weilin-2011-thesis 81/121
68
0 200 400 600 800 1000 1200 1400 16000.3
0.4
0.5
0.6
0.7
0.8
0.9
1
Time (ps)
N o r m a l i z e d A m p l i t u d e
Fig. 4.10. A linearly chirped microwave waveform when a strain of 484.2 μ is
applied to the LCFBG.
Fig. 4.8, Fig. 4.9 and Fig. 4.10 show three linearly chirped microwave waveforms
corresponding to three strains of 71.5 μ, 406.9 μ, and 484.2 μ applied to the
LCFBG, respectively. The correlation of the three linearly chirped microwave
waveforms with the special reference waveform given in Fig. 4.7 is shown in Fig.
4.11. The waveforms are highly compressed. The locations of the three peaks
indicate the wavelength shifts of the LCFBG are 0.087 nm, 0.495 nm, and 0.589
nm, corresponding to three different strains of 71.5 μ, 406.9 μ, and 484.2 μ.

8/2/2019 Liu Weilin 2011 Thesis
http://slidepdf.com/reader/full/liu-weilin-2011-thesis 82/121
69
-1500 -1000 -500 0 500 1000 15000
0.1
0.2
0.3
0.4
0.5
0.6
0.7
0.8
0.9
1
Time (ps)
N o r m a l i z e d A m p l i t u d e
Fig. 4.11. Correlation outputs for the microwave waveforms shown in Fig. 4.8,
Fig. 4.9 and Fig. 4.10.
-400 -300 -200 -100 0 100 200 300 400 5000
100
200
300
400
500
600
700
800
Correlation Peak Position (ps)
A p p l i e d S t r a i n (
)
Fig. 4.12. Correlation peak position vs the applied strain, the circles are the
8/2/2019 Liu Weilin 2011 Thesis
http://slidepdf.com/reader/full/liu-weilin-2011-thesis 83/121
70
experimental data, and the solid line shows the linear fitting of the experimental
data. The fitting function is y 0.7925 316.3909 x .
Since the highest temporal resolution of the oscilloscope is about 1 ps and the
sensitivity is 1.262 ps/ μ, and the compression ratio is calculated to be 50.2, the
measurement resolution is 0.25 μ by (21). Compared with the results reported in
[22], where the static resolution was 0.83 μ with a uniform FBG, the approach
here clearly demonstrates an increased resolution. Fig. 4.12 shows the correlation
peak position vs the applied strain. As can be seen the peak position is highly
linear with the applied strain, which validates the theoretical conclusion given by
(21). The sensitivity of the proposed system is also measured, which is 1.262
ps/μ. The responsivity of the LCFBG is measured by an OSA, which is 0.001217
nm/μ. According to (21), the sensitivity of our proposed system is determined by
both the first-order dispersion coefficient and the photoelastic coefficient
of the LCFBG. In our proposed system, a practical way to increase the sensitivity
is to increase the dispersion . By increasing the dispersion value of the DCF in
our system, the sensitivity would be improved. However, the temporal width of
the stretched pulse will be increased by using a longer DCF. As a result, the
compressed pulse would be broader, which would lead to a lower temporal
resolution. Therefore, there is a trade-off between sensitivity and resolution.
8/2/2019 Liu Weilin 2011 Thesis
http://slidepdf.com/reader/full/liu-weilin-2011-thesis 84/121
71
4.4 Summary
We have experimentally demonstrated a novel approach to interrogating an
LCFBG sensor based on SS-WTT mapping with both increased resolution and
SNR. In the proposed system, an LCFBG was incorporated in one arm of an MZI,
making the MZI have a spectral response with increasing or decreasing FSR.
When the LCFBG was experiencing a strain, the strain information was conveyed
to a wavelength shift, which was further transferred to the change of the FSR. If
an ultra-short pulse was spectrum shaped by the MZI, the shaped spectrum would
contain the information of the wavelength shift. The demodulation was performed
in the time domain by mapping the spectrally shaped waveform to the temporal
domain using a dispersive element. The generated temporal waveform was then
correlated with a special reference waveform, with the location of the correlation
peak indicating the wavelength shift of the LCFBG. The key significance of the
proposed technique is that the generated waveform is compressed, thus the
interrogation resolution is greatly improved. In addition, since an LCFBG has a
broader bandwidth, the use of the LCFBG as a sensing element would make the
output waveform have a broader temporal duration, which again leads to an
increased SNR. The proposed approach has the advantages of real-time
interrogation, high resolution and improved SNR, which can find applications
where high-speed and high precision sensing is required.
8/2/2019 Liu Weilin 2011 Thesis
http://slidepdf.com/reader/full/liu-weilin-2011-thesis 85/121
72
Chapter 5
Simultaneously Measurement of Temperature and
Strain
5.1 Interrogation System Introduction
In this chapter, a technique to real-time interrogation of a high-birefringence
linearly chirped fiber Bragg grating (Hi-Bi LCFBG) for simultaneous
measurement of strain and temperature is proposed. In the proposed system, the
strain and temperature information is encoded in the Hi-Bi LCFBG as Bragg
wavelength shifts. The Hi-Bi LCFBG is incorporated in one arm of a MZI. Due to
the birefringence in the Hi-Bi LCFBG the MZI has two spectral responses along
the fast and slow axes with each having an increasing FSR. If an ultra-short
optical pulse is sent to the MZI, the spectrum of the ultra-short optical pulse is
shaped. Two shaped spectra are obtained which are mapped to two chirped
microwave waveforms in a dispersive fiber. By using chirped microwave pulse
compression, two correlation peaks with the locations containing the strain and
temperature information are obtained. In addition, since the correlation operation
here is equivalent to matched filtering, the SNR is increased. A theoretical model
is developed, which is validated by an experiment.
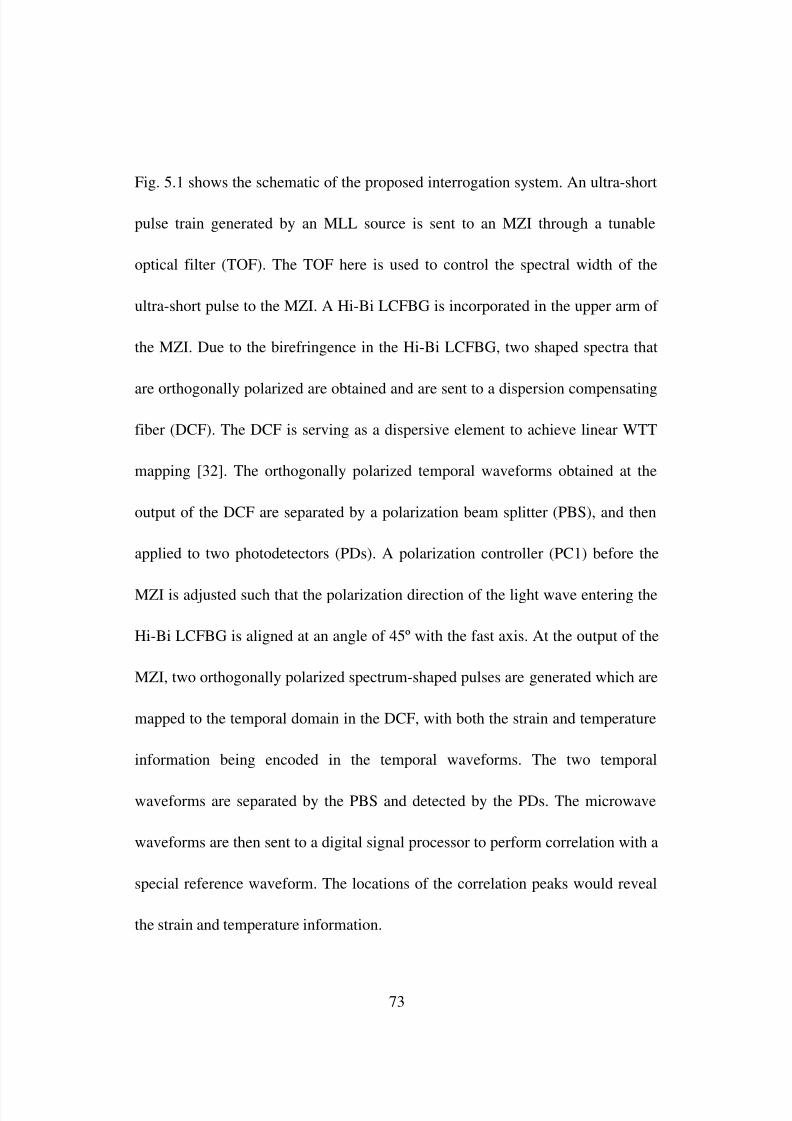
8/2/2019 Liu Weilin 2011 Thesis
http://slidepdf.com/reader/full/liu-weilin-2011-thesis 86/121
73
Fig. 5.1 shows the schematic of the proposed interrogation system. An ultra-short
pulse train generated by an MLL source is sent to an MZI through a tunable
optical filter (TOF). The TOF here is used to control the spectral width of the
ultra-short pulse to the MZI. A Hi-Bi LCFBG is incorporated in the upper arm of
the MZI. Due to the birefringence in the Hi-Bi LCFBG, two shaped spectra that
are orthogonally polarized are obtained and are sent to a dispersion compensating
fiber (DCF). The DCF is serving as a dispersive element to achieve linear WTT
mapping [32]. The orthogonally polarized temporal waveforms obtained at the
output of the DCF are separated by a polarization beam splitter (PBS), and then
applied to two photodetectors (PDs). A polarization controller (PC1) before the
MZI is adjusted such that the polarization direction of the light wave entering the
Hi-Bi LCFBG is aligned at an angle of 45º with the fast axis. At the output of the
MZI, two orthogonally polarized spectrum-shaped pulses are generated which are
mapped to the temporal domain in the DCF, with both the strain and temperature
information being encoded in the temporal waveforms. The two temporal
waveforms are separated by the PBS and detected by the PDs. The microwave
waveforms are then sent to a digital signal processor to perform correlation with a
special reference waveform. The locations of the correlation peaks would reveal
the strain and temperature information.
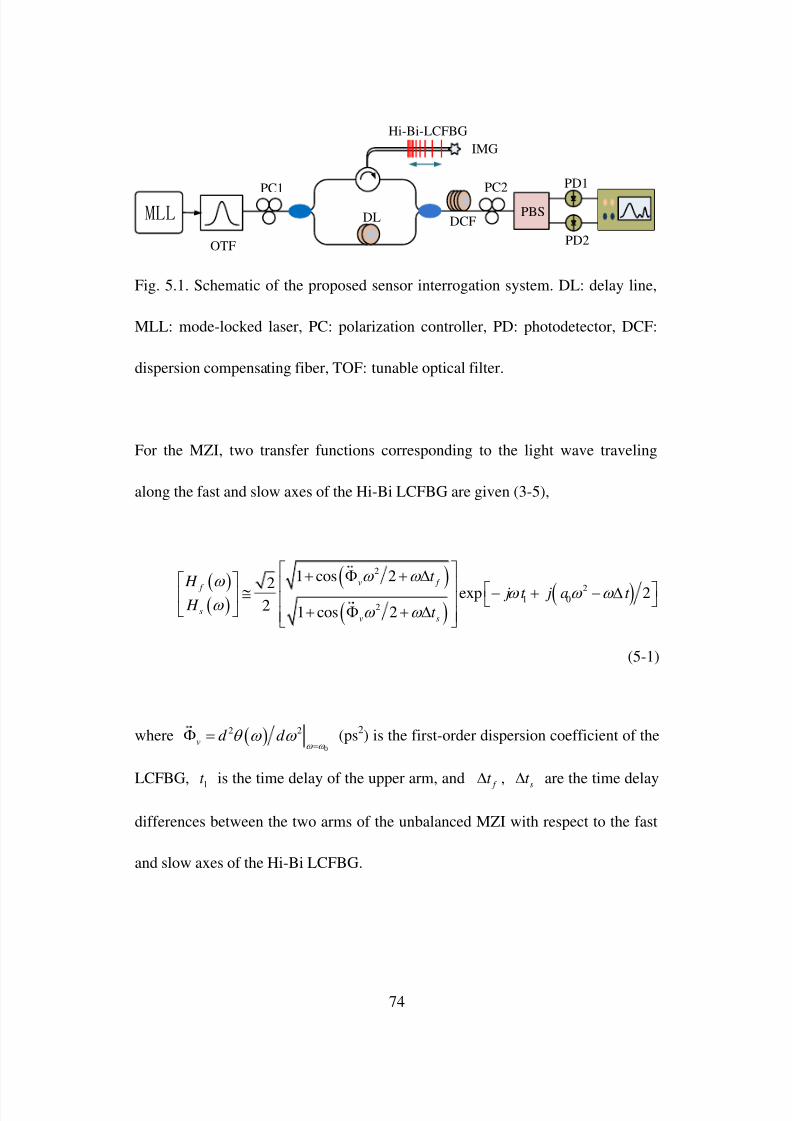
8/2/2019 Liu Weilin 2011 Thesis
http://slidepdf.com/reader/full/liu-weilin-2011-thesis 87/121
74
DL
OTF
MLL PBS
PC1 PC2
DCF
IMG
Hi-Bi-LCFBG
PD1
PD2
Fig. 5.1. Schematic of the proposed sensor interrogation system. DL: delay line,
MLL: mode-locked laser, PC: polarization controller, PD: photodetector, DCF:
dispersion compensating fiber, TOF: tunable optical filter.
For the MZI, two transfer functions corresponding to the light wave traveling
along the fast and slow axes of the Hi-Bi LCFBG are given (3-5),
2
21 0
2
1 cos 2
2 exp 22 1 cos 2
v f
f
sv s
t
H j t j a t H
t
(5-1)
where 0
2 2
vd d
(ps2) is the first-order dispersion coefficient of the
LCFBG, 1
t
is the time delay of the upper arm, and f t
, s
t
are the time delay
differences between the two arms of the unbalanced MZI with respect to the fast
and slow axes of the Hi-Bi LCFBG.
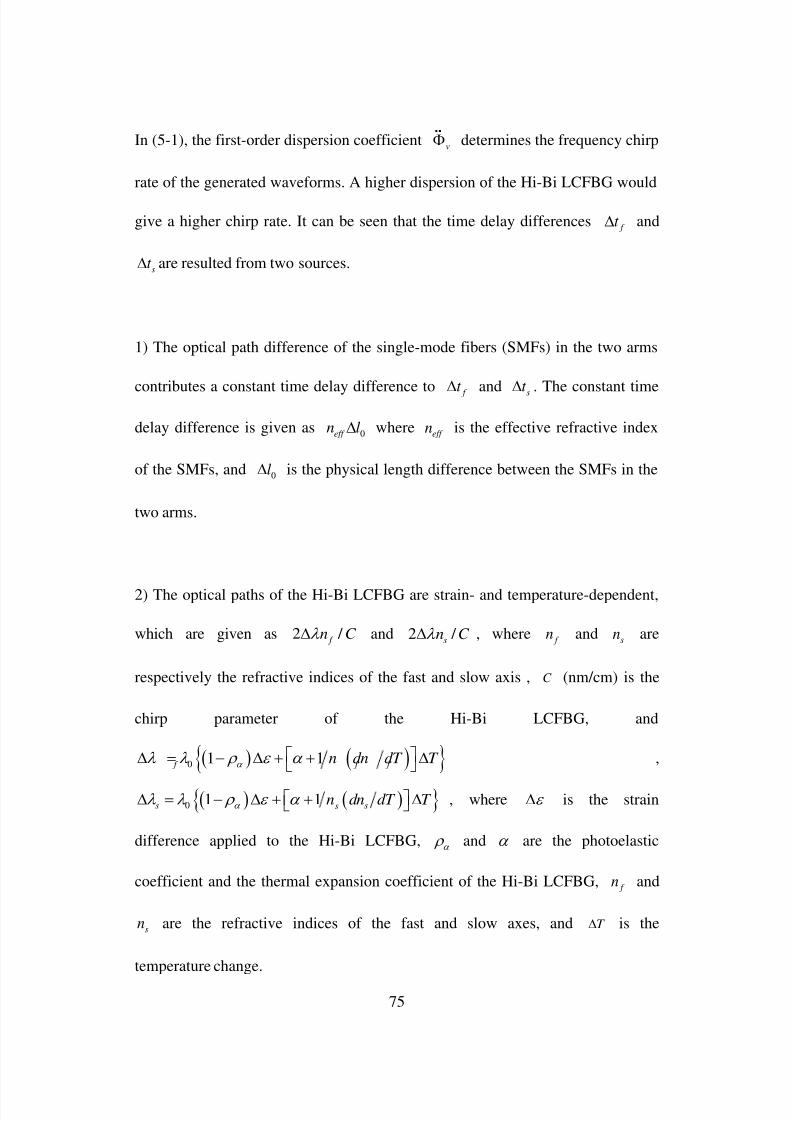
8/2/2019 Liu Weilin 2011 Thesis
http://slidepdf.com/reader/full/liu-weilin-2011-thesis 88/121
75
In (5-1), the first-order dispersion coefficientv
determines the frequency chirp
rate of the generated waveforms. A higher dispersion of the Hi-Bi LCFBG would
give a higher chirp rate. It can be seen that the time delay differences f t and
st are resulted from two sources.
1) The optical path difference of the single-mode fibers (SMFs) in the two arms
contributes a constant time delay difference to f t
and s
t . The constant time
delay difference is given as0eff
n l whereeff n is the effective refractive index
of the SMFs, and0
l is the physical length difference between the SMFs in the
two arms.
2) The optical paths of the Hi-Bi LCFBG are strain- and temperature-dependent,
which are given as 2 / f
n C and 2 / s
n C , where f
n ands
n are
respectively the refractive indices of the fast and slow axis , C (nm/cm) is the
chirp parameter of the Hi-Bi LCFBG, and
01 1 f f f
n dn dT T ,
01 1
s ssn dn dT T , where is the strain
difference applied to the Hi-Bi LCFBG,
and are the photoelastic
coefficient and the thermal expansion coefficient of the Hi-Bi LCFBG, f n and
sn are the refractive indices of the fast and slow axes, and T is the
temperature change.
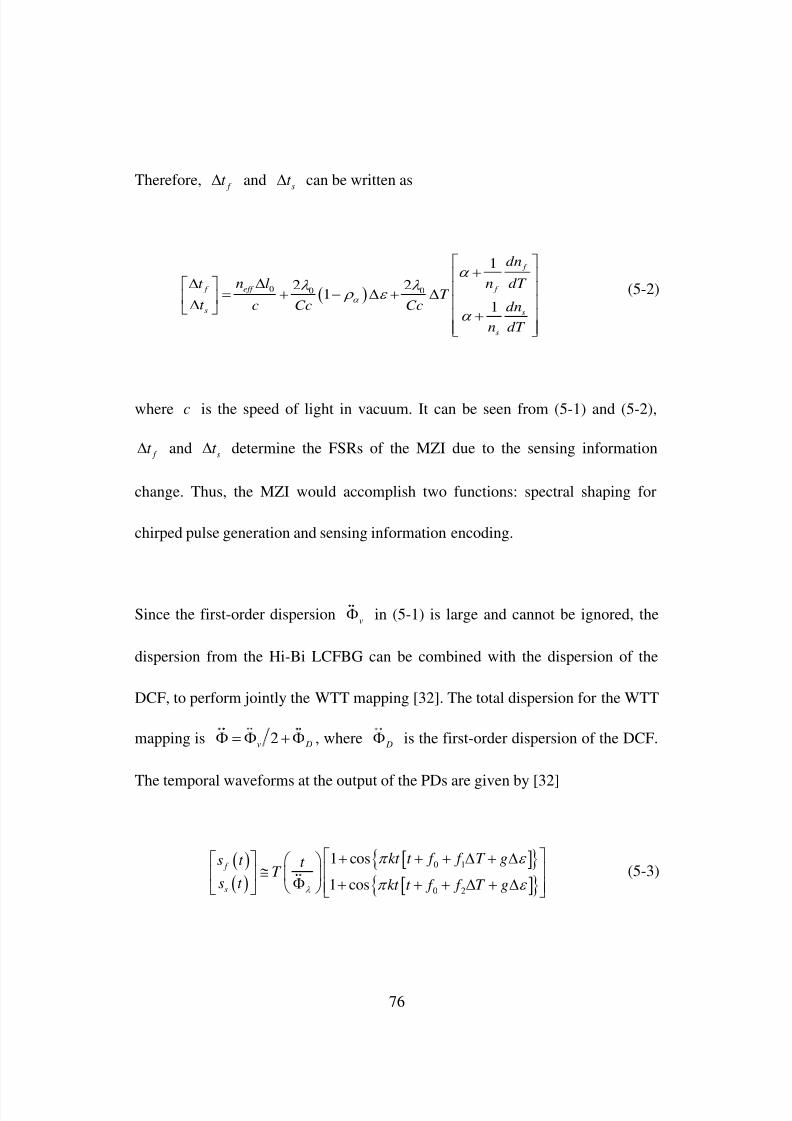
8/2/2019 Liu Weilin 2011 Thesis
http://slidepdf.com/reader/full/liu-weilin-2011-thesis 89/121
76
Therefore, f
t ands
t can be written as
0 0 0
1
2 21
1
f
f eff f
s s
s
dn
n dT n lt T
t c Cc Cc dn
n dT
(5-2)
where c is the speed of light in vacuum. It can be seen from (5-1) and (5-2),
f t ands
t determine the FSRs of the MZI due to the sensing information
change. Thus, the MZI would accomplish two functions: spectral shaping for
chirped pulse generation and sensing information encoding.
Since the first-order dispersionv
in (5-1) is large and cannot be ignored, the
dispersion from the Hi-Bi LCFBG can be combined with the dispersion of the
DCF, to perform jointly the WTT mapping [32]. The total dispersion for the WTT
mapping is 2v D , where D is the first-order dispersion of the DCF.
The temporal waveforms at the output of the PDs are given by [32]
0 1
0 2
1 cos
1 cos
f
s
kt t f f T gs t t T
s t kt t f f T g
(5-3)
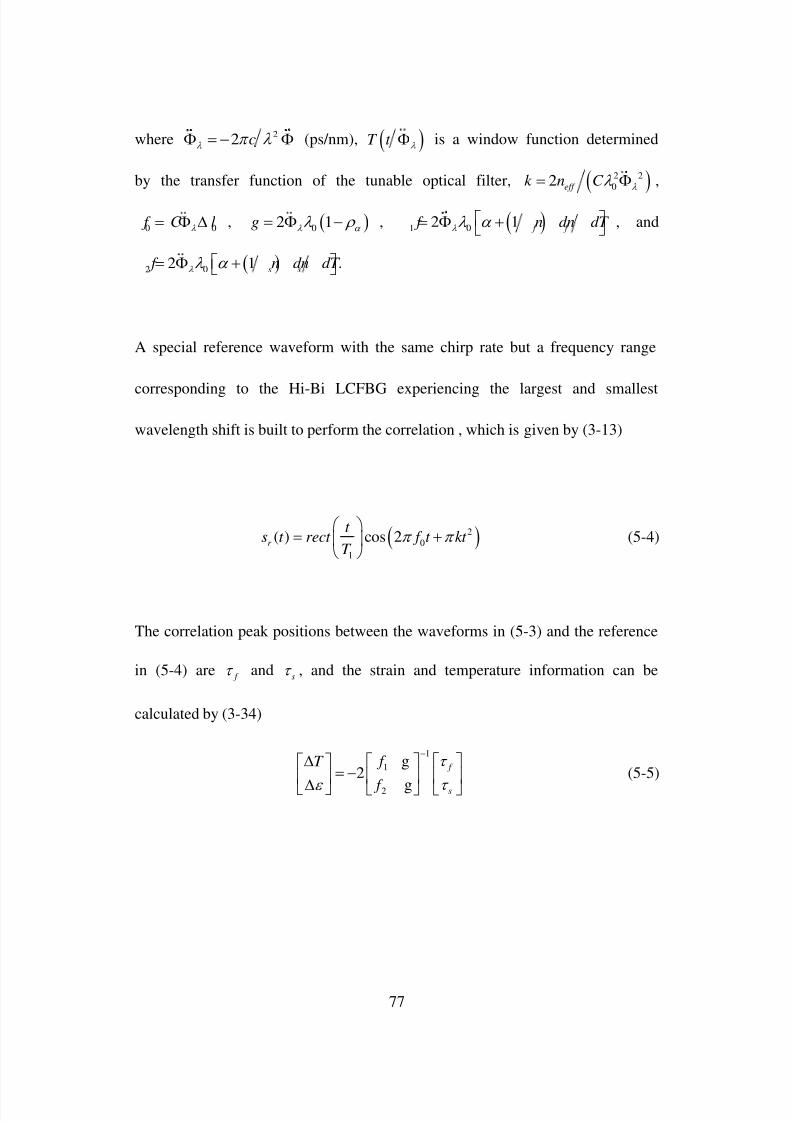
8/2/2019 Liu Weilin 2011 Thesis
http://slidepdf.com/reader/full/liu-weilin-2011-thesis 90/121
77
where 22 c
(ps/nm), T t
is a window function determined
by the transfer function of the tunable optical filter, 2 2
02 eff
k n C
,
0 0 f C l
, 0
2 1g , 1 02 1 f f f n dn dT , and
2 02 1 s s
f n dn dT .
A special reference waveform with the same chirp rate but a frequency range
corresponding to the Hi-Bi LCFBG experiencing the largest and smallest
wavelength shift is built to perform the correlation , which is given by (3-13)
2
0
1
( ) cos 2r
t s t rect f t kt
T
(5-4)
The correlation peak positions between the waveforms in (5-3) and the reference
in (5-4) are f
ands
, and the strain and temperature information can be
calculated by (3-34)
1
1
2
g2
g
f
s
f T
f
(5-5)

8/2/2019 Liu Weilin 2011 Thesis
http://slidepdf.com/reader/full/liu-weilin-2011-thesis 91/121
78
5.2 Experiment
An experiment based on the setup shown in Fig. 5.1 is implemented. Due to the
lack of a Hi-Bi LCFBG, in the experiment, we use a regular LCFBG and a
polarization maintaining fiber (PMF), which functions equivalently as a Hi-Bi
LCFBG. In the experiment, a transform-limited ultra-short Gaussian pulse train at
a repetition rate of 48.6 MHz from a mode-locked laser (MLL) source is sent to a
tunable optical filter (TOF). A pulse in the pulse train has a full-width at
half-maximum (FWHM) of 394 fs and a center wavelength of 1558.3 nm. The
TOF has a bandwidth of 0.58 nm. The ultra-short pulse after the TOF is sent to the
MZI. An LCFBG, which is 11.5 cm long with a center Bragg wavelength of
1560.8 nm and a dispersion of -1347 ps/nm, is incorporated in the upper arm of
the MZI. The lower arm of the MZI has a tunable time delay line and a length of
PMF with a beat length of 3.75 mm. Before applying strain or heating the LCFBG,
we tune PC1 to make the pulse polarization direction align at 45º with respect to
the fast axis of the PMF to make the interference pattern have the highest
visibility. At room temperature (25 ºC), the time delay in the lower arm is tuned
such that the MZI has a spectral response corresponding to a linearly chirped
waveform with a central frequency of zero and a chirp rate of -0.068 GHz/ps for
0t and 0.068 GHz/ps for 0t , as shown in Fig. 5.2.
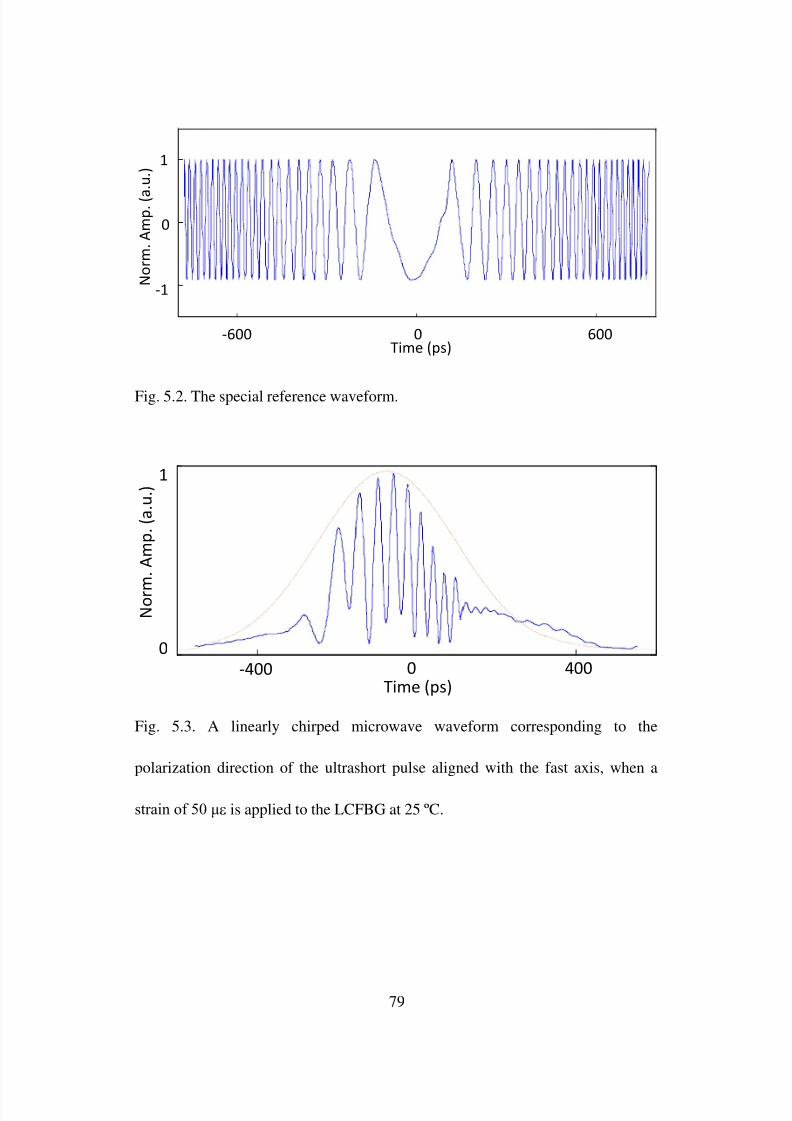
8/2/2019 Liu Weilin 2011 Thesis
http://slidepdf.com/reader/full/liu-weilin-2011-thesis 92/121
79
-600 0 600
-1
0
1
Time (ps)
N o r m . A m p . ( a
. u . )
Fig. 5.2. The special reference waveform.
-400 0 400
0
1
Time (ps)
N o r m
. A m p .
( a . u . )
Fig. 5.3. A linearly chirped microwave waveform corresponding to the
polarization direction of the ultrashort pulse aligned with the fast axis, when a
strain of 50 μ is applied to the LCFBG at 25 ºC.
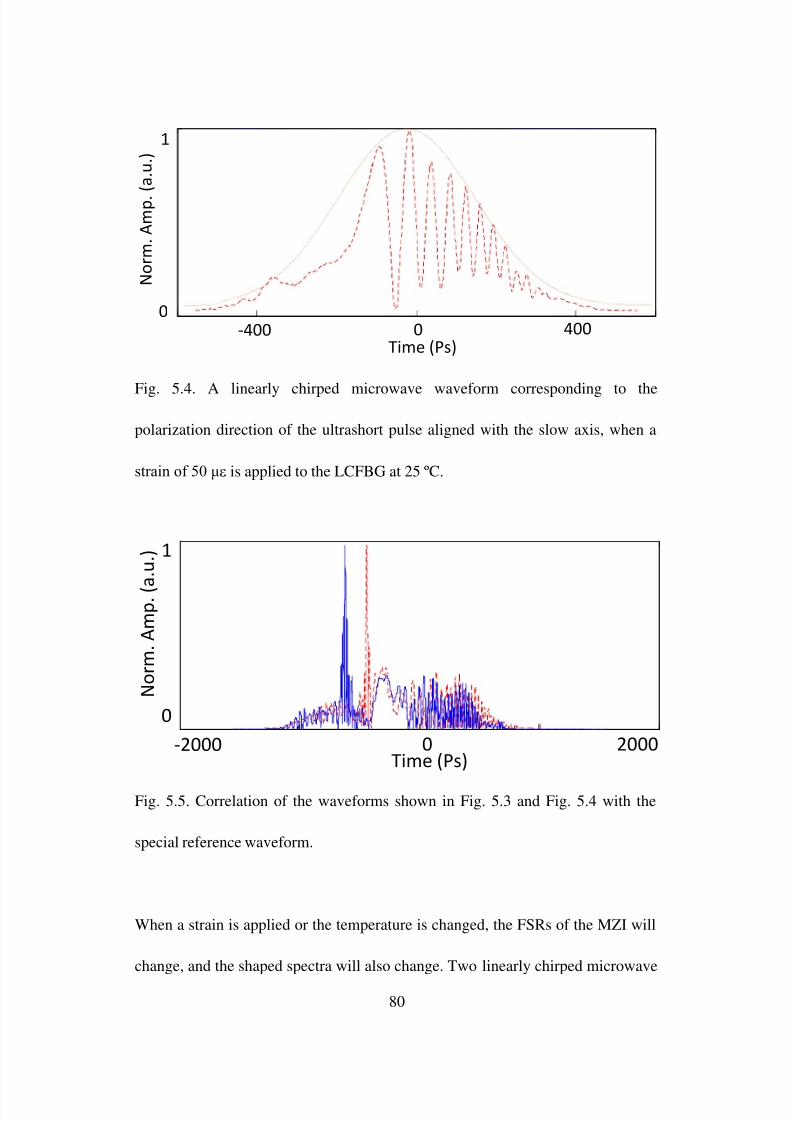
8/2/2019 Liu Weilin 2011 Thesis
http://slidepdf.com/reader/full/liu-weilin-2011-thesis 93/121
80
-400 0 4000
1
Time (Ps)
N o r m .
A m p .
( a . u . )
Fig. 5.4. A linearly chirped microwave waveform corresponding to the
polarization direction of the ultrashort pulse aligned with the slow axis, when a
strain of 50 μ is applied to the LCFBG at 25 ºC.
-2000 0 2000
0
1
Time (Ps)
N o r m . A m p . ( a . u . )
Fig. 5.5. Correlation of the waveforms shown in Fig. 5.3 and Fig. 5.4 with the
special reference waveform.
When a strain is applied or the temperature is changed, the FSRs of the MZI will
change, and the shaped spectra will also change. Two linearly chirped microwave

8/2/2019 Liu Weilin 2011 Thesis
http://slidepdf.com/reader/full/liu-weilin-2011-thesis 94/121
81
waveforms with their instantaneous frequencies indicating the wavelength shift of
the LCFBG and the phase difference induced by the PMF is generated at the
output of the PDs, which are sent to a digital signal processor for pulse
compression. The strain and temperature information are obtained by solving
(5-5).
-100 0 100
-1000
-400
0
Temperature (oC)
C o
r r e l a t i o n P
e a k
P o s i t i o n (
p s )
Strain=50
Fig. 5.6. Correlation peak position vs the temperature for a given strain of 50 µ .
The triangular and circles indicate the experimental data corresponding to the
polarization direction of the ultrashort pulse aligned with the fast axis and slow
axis, respectively, and the solid line shows the linear fitting of the experimental
data. The fitting function of the red-dash line is 7.4351 57.5700 f T , which
has a slope of 7.4351 ps/ºC, and the fitting function of the blue-solid line is
6.6747 57.5700 f T
, which has a slope of 6.6747 ps/ ºC.
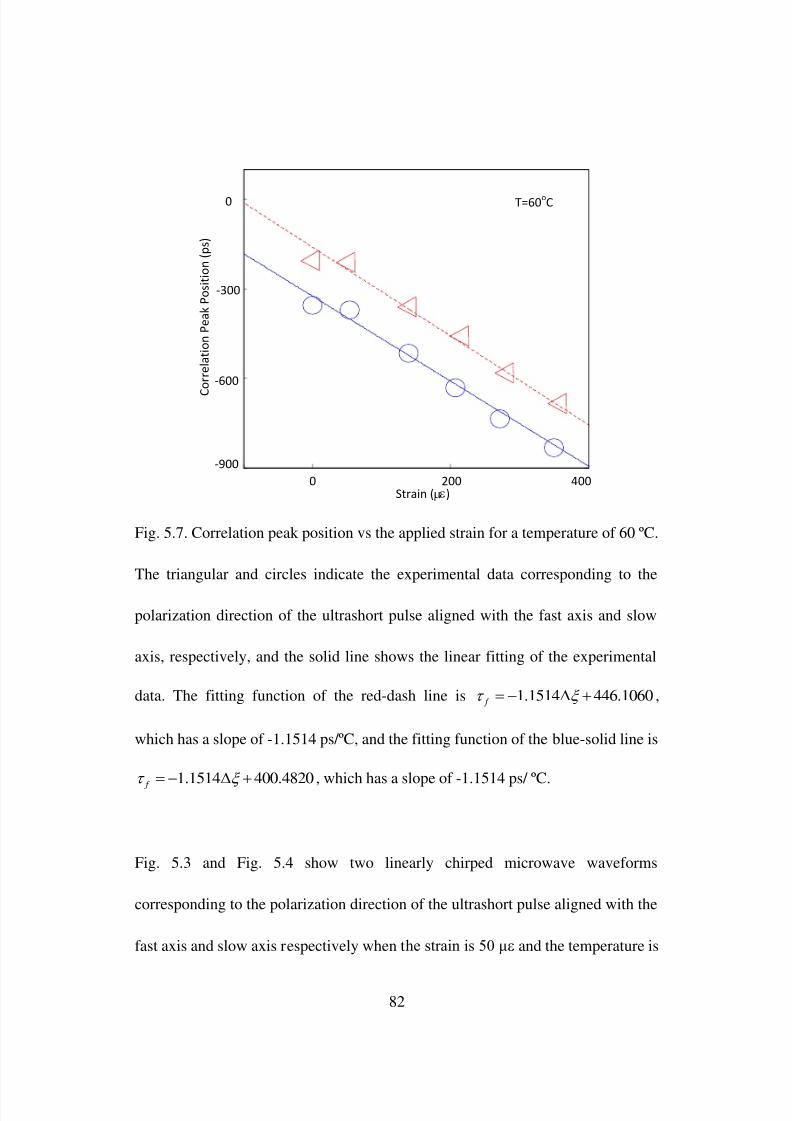
8/2/2019 Liu Weilin 2011 Thesis
http://slidepdf.com/reader/full/liu-weilin-2011-thesis 95/121
82
0 200 400
-900
-600
-300
0
C
o r r e l a t i o n P
e a k
P o s i t i o n (
p s )
Strain ( )
T=60oC
Fig. 5.7. Correlation peak position vs the applied strain for a temperature of 60 ºC.
The triangular and circles indicate the experimental data corresponding to the
polarization direction of the ultrashort pulse aligned with the fast axis and slow
axis, respectively, and the solid line shows the linear fitting of the experimental
data. The fitting function of the red-dash line is 1.1514 446.1060 f ,
which has a slope of -1.1514 ps/ºC, and the fitting function of the blue-solid line is
1.1514 400.4820 f
, which has a slope of -1.1514 ps/ ºC.
Fig. 5.3 and Fig. 5.4 show two linearly chirped microwave waveforms
corresponding to the polarization direction of the ultrashort pulse aligned with the
fast axis and slow axis respectively when the strain is 50 μ and the temperature is
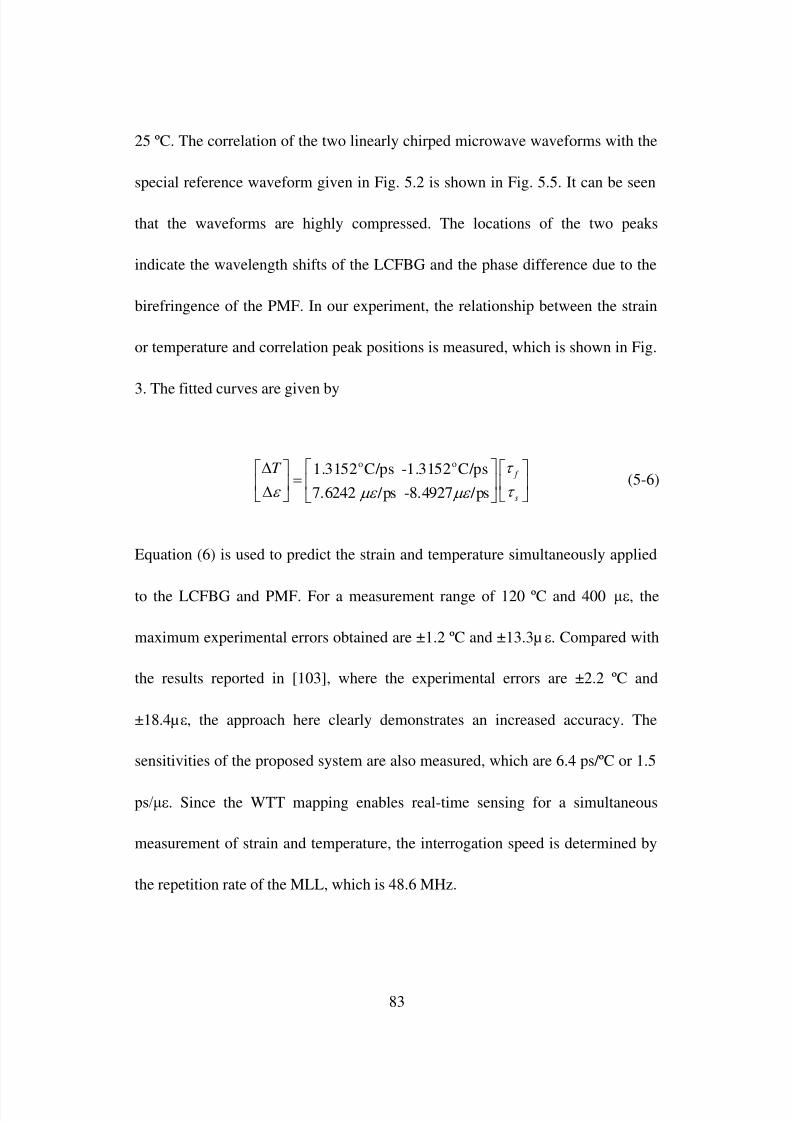
8/2/2019 Liu Weilin 2011 Thesis
http://slidepdf.com/reader/full/liu-weilin-2011-thesis 96/121
83
25 ºC. The correlation of the two linearly chirped microwave waveforms with the
special reference waveform given in Fig. 5.2 is shown in Fig. 5.5. It can be seen
that the waveforms are highly compressed. The locations of the two peaks
indicate the wavelength shifts of the LCFBG and the phase difference due to the
birefringence of the PMF. In our experiment, the relationship between the strain
or temperature and correlation peak positions is measured, which is shown in Fig.
3. The fitted curves are given by
o o1.3152 C/ps -1.3152 C/ps
7.6242 /ps -8.4927 /ps
f
s
T
(5-6)
Equation (6) is used to predict the strain and temperature simultaneously applied
to the LCFBG and PMF. For a measurement range of 120 ºC and 400 μ, the
maximum experimental errors obtained are ±1.2 ºC and ±13.3µ . Compared with
the results reported in [103], where the experimental errors are ±2.2 ºC and
±18.4µ , the approach here clearly demonstrates an increased accuracy. The
sensitivities of the proposed system are also measured, which are 6.4 ps/ºC or 1.5
ps/μ. Since the WTT mapping enables real-time sensing for a simultaneous
measurement of strain and temperature, the interrogation speed is determined by
the repetition rate of the MLL, which is 48.6 MHz.

8/2/2019 Liu Weilin 2011 Thesis
http://slidepdf.com/reader/full/liu-weilin-2011-thesis 97/121
84
5.3 Summary
We have proposed and experimentally demonstrated a new approach to measuring
strain and temperature simultaneously with an increased resolution and SNR. The
key device in the system is the MZI that was designed to include a Hi-Bi LCFBG
in one arm, which enables the encoding of both the strain and temperature
information in the generated chirped microwave waveforms. By correlating the
temporal waveforms with a special reference waveform, two correlation peaks
with the locations indicating the strain and temperature induced wavelength shifts
of the Hi-Bi LCFBG was obtained.
8/2/2019 Liu Weilin 2011 Thesis
http://slidepdf.com/reader/full/liu-weilin-2011-thesis 98/121
85
Chapter 6
Conclusions and Future Work
6.1 Conclusions
The objectives of this work: 1) to interrogate a LCFBG with improved resolution
and SNR by employing chirped pulse compression, and 2) to simultaneously
measure the strain and temperature a LCFBG sensor with improved resolution and
SNR by employing chirped pulse compression. The objectives have been met.
In Chapter 2, a background review of FBG sensors and interrogation systems was
presented. The advantages and limitations of the previous interrogation
technologies were discussed.
In Chapter 3, the theory model for real-time interrogation for an LCFBG sensor
was presented. The expression for the generated chirped microwave waveform
was developed and the design of the special reference waveform was provided.
The expression for the correlation between the generated chirped microwave
waveform and the special reference waveform was also derived.
8/2/2019 Liu Weilin 2011 Thesis
http://slidepdf.com/reader/full/liu-weilin-2011-thesis 99/121
86
In Chapter 4, an experimental demonstration of the prosed approach to
interrogating an LCFBG sensor based on SS-WTT mapping with both increased
resolution and SNR was performed. In the proposed system, an LCFBG was
incorporated in one arm of an MZI, making the MZI have a spectral response with
increasing or decreasing FSR. When the LCFBG was experiencing a strain, the
strain information was conveyed to a wavelength shift, which was further
transferred to the change of the FSR and reflected in the spectral of an ultra-short
pulse. The demodulation was performed in the time domain by mapping the
spectrally shaped waveform to the temporal domain using a dispersive element.
The proposed approach has the advantages of real-time interrogation, high
resolution and improved SNR, which can find applications where high-speed and
high precision sensing is required.
Finally, an approach to measuring strain and temperature simultaneously with an
increased resolution and SNR based on the proposed interrogation system was
proposed and experimentally demonstrated in Chapter 5. The key device in the
system is the MZI that was designed to include a Hi-Bi LCFBG in one arm, which
enables the encoding of both the strain and temperature information in the
generated chirped microwave waveforms. By correlation the temporal waveforms
with a special reference waveform, two correlation peaks with the locations

8/2/2019 Liu Weilin 2011 Thesis
http://slidepdf.com/reader/full/liu-weilin-2011-thesis 100/121
87
indicating the strain and temperature induced wavelength shifts of the Hi-Bi
LCFBG was obtained.

8/2/2019 Liu Weilin 2011 Thesis
http://slidepdf.com/reader/full/liu-weilin-2011-thesis 101/121
88
6.2 Future work
FBG sensor technology has been proven to be a powerful tool for
quasi-distributed measurements of strain and temperature and has found a number
of applications. In this thesis, a real-time interrogation scheme with improved
resolution and SNR was proposed and demonstrated. The work can be further
improved from the following three aspects.
1) A further improvement of the resolution in the proposed interrogation system is
limited due to the tradeoff between the sensor resolution and sensitivity. In our
proposed system, a practical way to increase the sensitivity is to increase the
dispersion
. By increasing the dispersion value of the DCF in our system, the
sensitivity would be improved. However, the temporal width of the stretched
pulse will be increased by using a longer DCF. As a result, the compressed pulse
would be broader, which would lead to a lower temporal resolution. Therefore,
there is a trade-off between sensitivity and resolution. Since the compression ratio
could be improved by increasing the chirp rate of the chirped microwave
waveform, an alternative way to improve the resolution is using an LCFBG with
higher chirp rate. In this way, a super high-speed photodetector should be used to
receive the chirped microwave waveform with higher frequency range, but the
8/2/2019 Liu Weilin 2011 Thesis
http://slidepdf.com/reader/full/liu-weilin-2011-thesis 102/121
89
resolution could be improved and the tradeoff between the sensitivity and
resolution is avoided.
2) The interrogation speed in the proposed system is determined by the repetition
rate of mode-locked laser. A higher interrogation speed than 48.6 MHz is
achievable by replacing an optical pulse source with higher repetition rate.
However, the output pulse will be overlapped once the pulse repetition rate
reaches its limitation. In the proposed system, the output pulse should have a
duration of 1500ps, which promises the highest interrogation speed of 0.67 GHz.
3) In order to make the proposed system more stable for practical applications,
photonic integrated circuit (PIC) technique could be used to improve the system
robustness and minimize the system size. In our proposed system, the optical
source, tunable filter and dispersive element can be developed on a photonic s
chip with improved stability and smaller size.
4) Other applications based on the proposed interrogation could be investigated.
Since the approach in this thesis presents a high sensing resolution and improved
SNR, it could be used in other applications, such as real-time detection of
multi-crack-position.
8/2/2019 Liu Weilin 2011 Thesis
http://slidepdf.com/reader/full/liu-weilin-2011-thesis 103/121
90
REFERENCES
[1] H. Li, D. Li, and G. Song, “Recent applications of fiber optic sensors to health
monitoring in civil engineering,” Engineering Structures, vol. 26, no. 11, pp.
1647-1657, Sep. 2004.
[2] R. C. Tennyson, T. Coroy, G. Duck, G. Manuelpillai, P. Mulvihill, D. J. F.
Cooper, P. W. E. Smith, A. A. Mufti, and S. J. Jalali, “Fiber optic sensors in
civil engineering structures,” Canadian Journal of Civil Engineering, vol. 27,
no. 5, pp. 880-889, Jan. 2000.
[3] P. Moyo, J. M. W. Brownjohn, R. Suresh, and S. C. Tjin, “Development of
fiber Bragg grating sensors for monitoring civil infrastructure,” Engineering
Structures, vol. 27, no. 12, pp. 1828-1834, Oct. 2005.
[4] R. C. Tennyson, A. A. Mufti, S. Rizkalla, G. Tadros, and B. Benmokrane,
“Structural health monitoring of innovative bridges in Canada with fiber optic
sensors,” Smart Materials and Structures, vol. 10, no. 3, pp.560-573, Jun.
2001.
[5] J. M. Ko and Y. Q. Ni, “Technology developments in structural health
monitoring of large-scale bridges,” Engineering Structures, vol. 27, no. 12,
pp. 1715-1725, Oct. 2005.
8/2/2019 Liu Weilin 2011 Thesis
http://slidepdf.com/reader/full/liu-weilin-2011-thesis 104/121
91
[6] G. T. Kanellos, G. Panaioannou, D. Tsiokos, C. Mitrogiannis, G. Nianios, and
N. Pleros, “Two dimensional polymer-embedded quasidistributed FBG
pressure sensor for biomedical applications,” Optics Express, vol. 18, no. 1,
pp. 179-186, Dec. 2009.
[7] B. M. Cowie, D. J. Webb, B. Tam, P. Slack, and P. N. Brett, “Distributive
tactile sensing using fibre Bragg grating sensors for biomedical a pplications,”
The First IEEE/RAS-EMBS International Conference on Biomedical Robotics
and Biomechatronics, 2006, pp. 312-317, Feb. 2006.
[8] G. Fusiek, P. Niewczas, and J. R. McDonald, “Concept level evaluation of the
optical voltage and current sensors and an arrayed waveguide grating for
aero-electrical systems' applications,” IMTC 2007. IEEE, Instrumentation and
Measurement Technology Conference Proceedings, 2007, pp. 1-5. May 2007.
[9] A. Kumar and A. Nayak, “Sensor system for crack initiation and crack growth
monitoring in aeroengine components,” Canadian Conference on Electrical
and Computer Engineering, 2007. CCECE, pp. 1452-1455, Apr. 2007.
[10] G. Fusiek, P. Niewczas, and J. R. McDonald, “Feasibility study of the
application of optical voltage and current sensors and an arrayed waveguide
grating for aero-electrical systems,” Sensor and Actuators A: Physical, vol.
147, no. 1, pp. 177-182, Sep. 2008.
[11] C. Ryu, J. Lee, C. Kim, and C. Hong, “Buckling behavior monitoring of a
composite wing box using multiplexed and multi-channeled built-in fiber
8/2/2019 Liu Weilin 2011 Thesis
http://slidepdf.com/reader/full/liu-weilin-2011-thesis 105/121
92
Bragg grating strain sensors,” NDT & E International, vol. 41, no. 7, pp.
534-543, Oct. 2008.
[12] E. Udd, W. L. Schulz, J. Seim, M. Morrell, T. Weaver, J. Bush, and G.
Adamovsky, “Fiber optic distributed sensing systems for harsh aerospace
environments,” in Industrial and Commercial Applications of Smart Structures
Technologies, J. H. Jacobs, ed., Proc. SPIE 3674, pp. 136-147,1999.
[13] K. K. P. Koo, A. B. Tveten, and S. T. Vohra, “Dense wavelength division
multiplexing of fibre Bragg grating sensors using CDMA,” Electronics
Letters, vol. 35, no. 2, pp. 165 – 167, Jan. 1999.
[14] P. K. C. Chan, W. Jin, J. M. Gong, and M. S. Demokan, “Multiplexing of
fiber Bragg grating sensors using an FMCW technique,” IEEE Photonics
Technology Letters, vol. 11, no. 11, pp. 1470-1472, Nov. 1999.
[15] S. M. Melle, K. Liu, and R. M. Measures, “A passive wavelength
demodulation system for guided-wave Bragg grating sensors,” IEEE
Photonics Technology Letters, vol. 4, no. 5, pp. 516-518, May 1992.
[16] Q. Zhang, D. A. Brown, H. Kung, J. E. Townsend, M. Chen, L. J. Reinhart,
and T.F. Morse, “Use of highly overcoupled couplers to detect shifts in Bragg
wavelength,” Electronics Letters, vol. 31, no.6, pp. 480-482, Mar. 1995
[17] H. Xia, C. Zhang, H. Mu, and D. Sun, “Edge technique for direct detection of
strain and temperature based on optical time domain reflectometry,” Applied
Optics, vol. 48, no. 2, pp. 189-197, Jan. 2009.
8/2/2019 Liu Weilin 2011 Thesis
http://slidepdf.com/reader/full/liu-weilin-2011-thesis 106/121
93
[18] A. D. Kersey, M. A. Davis, H. J. Patrick, M. LeBlanc, K. P. Koo, C.G.
Askins, M.A.Putnam, and E. J. Friebele, “Fiber grating sensors,” Journal of
Lightwave Technology, vol. 15, no. 8, pp. 1442-1463, Aug. 1997.
[19] C. G. Askins, M. A. Putnam, G. M. Williams, and E. J. Friebele,
“Stepped-wavelength optical fiber Bragg grating arrays fabricated in line on a
draw tower,” Optics Letters, vol. 19 no. 2, pp. 147-149, Jan. 1994.
[20] R. Willsch, W. Ecke, and H. Bartelt, “Optical fiber grating sensor networks
and their application in electric power facilities, aerospace and geotechnical
engineering,” in the 15th Optical Fiber Sensors Conference Technical Digest,
Portland, OR, Aug. 7, 2002, Paper TuA1, Aug. 2002.
[21] M. LeBlanc, S. Y. Huang, M. Ohn, R. M. Measures, A. Guemes, and A.
Othonos, “Distributed strain measurement based on a fiber Bragg grating and
its reflection spectrum analysis,” Optics Letters, vol. 21, no. 17, pp.
1405-1407, Sep. 1996.
[22] A. D. Kersey and T. A. Berkoff, “Fiber -optic Bragg grating
differential-temperature sensor,” IEEE Photonics Technology Letters, vol. 4,
no. 10, pp. 1183-2285, Oct. 1992.
[23] T. Allsop, R. Reeves, D. J. Webb, I. Bennion, and R. Neal, “A high
sensitivity refractometer based upon a long period grating Mach – Zehnder
interferometer,” Review of Scientific Instruments, vol. 73, no. 4, pp.
1702-1705, Apr. 2002.

8/2/2019 Liu Weilin 2011 Thesis
http://slidepdf.com/reader/full/liu-weilin-2011-thesis 107/121
94
[24] P. Lu, L. Men, K. Sooley, and Q. Chen, “Tapered fiber Mach – Zehnder
interferometer for simultaneous measurement of refractive index and
temperature,” Applied Physics Letters, vol. 94, no. 13, pp.
131110-1-131110-3, Apr. 2009.
[25] Z. Tian, S. S. H. Yam, J. Barnes, W. Bock, P. Greig, J. M. Fraser, H. P.
Loock, and R. D. Oleschuk, “Refractive index sensing with Mach – Zehnder
interferometer based on concatenating two single-mode fiber tapers,” IEEE
Photonics Technology Letters, vol. 20, no. 8, pp. 626-628, Apr. 2008.
[26] Y. J. Rao, D. A. Jackson, L. Zhang, and I. Bennion, “Dual-cavity
interferometric wavelength-shift detection for in-fiber Bragg grating sensors,”
Optics Letters, vol. 21, no. 19, pp. 1556-1558, Oct. 1996.
[27] B. Lee, Y. W. Lee, and J. Jung, “Applications of long-period fiber grating
pair interferometers for sensors and communications,” in the 15th Annual
Meeting of the IEEE: Lasers and Electro-Optics Society, vol.1, pp. 171-172,
2002.
[28] Y. Yang, V. G. M. Annamdas, C. Wang, and Y. Zhou, “Application of
multiplexed FBG and PZT impedance sensors for health monitoring of rocks,”
Sensors, vol. 8, pp. 271-289, Jan. 2008.
[29] S. Komatsuzaki, S. Kojima, A. Hongo, N. Takeda, and T. Sakurai,
“Small-diameter optical fiber and high-speed wavelength interrogator for
FBG/PZT hybrid sensing system,” Sensor Systems and Networks:
8/2/2019 Liu Weilin 2011 Thesis
http://slidepdf.com/reader/full/liu-weilin-2011-thesis 108/121
95
Phenomena, Technology, and Applications for NDE and Health Monitoring
2007, Mar. 2007.
[30] H. Xia, C. Wang, S. Blais, and J. P. Yao, “Ultrafast and precise interrogation
of fiber Bragg grating sensor based on wavelength-to-time mapping
incorporating higher order dispersion,” Journal of Lightwave Technology, vol.
28, no. 3, pp. 254-261, Feb. 2010.
[31] T. Jannson, “Real-time Fourier transformation in dispersive optical fibers,”
Optics Letters, vol. 8, no. 4, pp. 232-234, Apr. 1983.
[32] M. A. Muriel, J. Azana, and A. Carballar, “Real-time Fourier transformer
based on fiber gratings,” Optics Letters, vol. 24, no. 1, pp. 1 – 3, Jan. 1999.
[33] K. Goda, K. K. Tsia, and B. Jalali, “Serial time -encoded amplified imaging
for real-time observation of fast dynamic phenomena,” Nature, vol. 458, pp.
1145 – 1150, Apr. 2009.
[34] C. Wang and J. P. Yao, “Chirped microwave pulse generation based on
optical spectral shaping and wavelength-to-time mapping using a Sagnac loop
mirror incorporating a chirped fiber Bragg grating,” Journal of Lightwave
Technology, vol. 27, no. 16, pp. 3336-3341, Aug. 2009
[35] K. O. Hill, Y. Fujii, D. C. Johnson, and B. S. Kawasaki, “Photosensitivity in
optical fiber waveguides: Application to reflection filter fabrication,” Applied
Physics Letters, vol. 32, no. 10, pp. 647 – 649, 1978.
8/2/2019 Liu Weilin 2011 Thesis
http://slidepdf.com/reader/full/liu-weilin-2011-thesis 109/121
96
[36] X. Chen, J. P. Yao, and Z. Deng, “Ultranarrow dual-transmission-band fiber
Bragg grating filter and its application in a dual-wavelength
single-longitudinal-mode fiber ring laser”, Optics Letters, vol. 30, no. 16, pp.
2068-2070, Aug. 2005.
[37] K. O. Hill, F. Bilodeau, B. Malo, T. Kitagawa, S. Thériault, D. C. Johnson, J.
Albert, and K. Takiguchi, “Chirped in-fiber Bragg gratings for compensation
of optical-fiber dispersion”, Optics Letters, vol. 19, no. 17, pp. 1314-1316,
Sep. 1994.
[38] Y. J. Rao, “Fiber Bragg grating sensors: principles and applications,” in K. T.
V. Grattan, B. T. Meggitt (Eds.), Optical Fiber Sensor Technology, vol. 2,
Chapman & Hall, London, 1998, pp. 355-389, 1998.
[39] S. M. Melle, K. Liu, and R. M. Measures, “A passive wavelength
demodulation system for guided-wave Bragg grating sensors,” IEEE
Photonics Technology Letters, vol. 4, no. 5, pp. 1370-1372, May 1992.
[40] S. M. Melle, A. T. Alavie, S. Karr, T. Coroy, K. Liu, and R.M. Measures, “A
Bragg grating-tuned fiber laser strain sensor system,” IEEE. Photonics
Technology Letters, vol. 5, no. 2, pp. 263-266, Feb. 1993.
[41] X. Wu and J. Jaccquet, “Steep and flat bandpass filter using linearly chirped
and apodized fiber Bragg grating,” Optical Components and Materials VII,
San Francisco, California, USA, Jan. 2010.
8/2/2019 Liu Weilin 2011 Thesis
http://slidepdf.com/reader/full/liu-weilin-2011-thesis 110/121
97
[42] S. Liang, S. C. Tjin, N. Q. Ngo, C. Zhang, and L. Li, “Novel tunable fiber
optic edge filter based on modulating chirp rate of pi-phase-shifted fiber
Bragg grating,” Optics Communications, vol. 282, no. 7, pp. 1363-1369, Jan.
2009.
[43] Q. Wu, G. Farrell, and Y. Semenova, “Simple design technique for a
triangular FBG filter based on a linearly chirped grating,” Optics
Communications, vol. 283, no. 6, pp. 985-992, Mar. 2010.
[44] Q. Wu, P. Wang, Y. Semenova, and G. Farrell, “A study of the effect of the
position of an edge filter within a ratiometric wavelength measurement
system,” Measurement Science and Technology, vol. 21, no. 9, pp. 233-238,
Sep. 2010.
[45] S. Bandyopadhyay, P. Biswas, A. Pal, S. K. Bhadra, and K. Dasgupta,
“Empirical relations for design of linear edge filters using apodized linearly
chirped fiber Bragg grating,” Journal of Lightwave Technology, vol. 26, no.
24, pp. 3853-3859, Dec. 2008.
[46] A. D. Kersey, T. A. Berkoff, and W. W. Morey, “Multiplexed fiber Bragg
grating strain-sensor system with a fiber Fabry-Pérot wavelength filter,”
Optics Letters, vol. 18, no. 16, pp. 516-518, Aug. 1993.
[47] G. A. Ball, W. W. Morey, and P. K. Cheo, “Fiber laser source/analyzer for
Bragg grating sensor array interrogation,” Journal of Lightwave Technology,
vol. 12, no. 4, pp. 700-703, Apr. 1994.
8/2/2019 Liu Weilin 2011 Thesis
http://slidepdf.com/reader/full/liu-weilin-2011-thesis 111/121
98
[48] M. G. Xu, H. Geiger, and J. P. Dakin, “Modeling and performance analysis of
a fiber Bragg grating interrogation system using an acousto-optic tunable
filter,” Journal of Lightwave Technology, vol. 14, no. 3, pp. 391-396, Mar.
1996.
[49] C. Boulet, D. J. Webb, M. Douay, and P. Niay, “Simultaneous interrogation
of fiber Bragg grating sensors using an acoustooptic tunable filter,” IEEE
Photonics Technology Letters, vol.13, no. 11, pp. 1215-1217, Nov. 2001.
[50] Y. J. Rao, M. R. Cooper, D. A. Jackson, C. N. Pannell, and L. Reekie,
“Absolute strain measurement using an in-fiber-Bragg-grating-based
Fabry-Pérot sensor,” Electronics Letters, vol. 36, no. 8, pp. 708-709, Apr.
2000.
[51] A. S. Paterno, V. de Oliveira, T. S. Figueredo, and H. J. Kalinowski,
“Multiplexed fiber bragg grating interrogation system using a modulated fiber
Bragg grating and the tunable-filter method,” Sensors Journal, vol. 6. no. 6,
pp. 1662-1668, Dec. 2006.
[52] N. Mohammad, W. Szyszkowski, W. J. Zhang, E. I. Haddad, J. Zou, W.
Jamroz, and R. Kruzelecky, “Analysis and development of a tunable fiber
Bragg grating filter based on axial tension/compression,” Journal of
Lightwave Technology, vol. 22, no. 8, pp. 2001-2013, Aug. 2004.
[53] S. Liang, S. C. Tjin, N. Q. Ngo, C. Zhang, and L. Li, “Novel tunable
fiber-optic edge filter based on modulating the chirp rate of a pi-phase-shifted

8/2/2019 Liu Weilin 2011 Thesis
http://slidepdf.com/reader/full/liu-weilin-2011-thesis 112/121
99
fiber Bragg grating in transmission,” Optics Communications, vol. 282, no. 7,
pp. 1363-1369, Jan. 2009.
[54] Y. Semenova, G. Farrell, and G. Rajan, “Fabry-Pérot liquid crystal tunable
filter for interrogation of multiple fibre Bragg grating sensors ,” Liquid
Crystals and Applications in Optics, Prague, Czech Republic, Apr. 2007.
[55] C. M. Tay, K. M. Tan, S. C. Tjin, C. C. Chan, N. Q. Ngo, and X. Y. Dong, “A
high-resolution tunable fiber Bragg grating filter,” Microwave and Optical
Technology Letters, vol. 42, no. 2, pp. 89-92, Jul. 2004.
[56] A. D. Kersey, T. A. Berkoff, and W. W. Morey, “High-Resolution
fiber-grating based strain sensor with interferometric wavelength-shift
detection,” Electronics Letters, vol. 28, no. 3, pp. 236-238, Jan. 1992.
[57] G. A. Ball, W. W. Morey, and W. H. Glenn, “Standing-wave monomode
erbium fiber laser”, IEEE Photonics Technology Letters, vol. 3, no. 7, pp.
613-615, Jul. 1991.
[58] K. P. Koo and A. D. Kersey, “Fiber laser sensor with ultrahigh strain
resolution using interferometric interrogation,” Electronics Letters, vol. 31,
no. 14, pp. 1180-1182, Jul. 1995.
[59] K. P. Koo and A. D. Kersey, “Bragg grating-based laser sensors systems with
interferometric interrogation and wavelength division multiplexing,” Journal
of Lightwave Technology, vol. 13, no. 7, pp. 1243-1249, Jul. 1995.
8/2/2019 Liu Weilin 2011 Thesis
http://slidepdf.com/reader/full/liu-weilin-2011-thesis 113/121
100
[60] M. D. Todd, G. A. Johnson, and B. L. Althouse, “A novel Bragg grating
sensor interrogation system utilizing a scanning filter, a Mach-Zehnder
interferometer and 3x3 coupler,” Measurement Science and Technology, vol.
12, no. 7, pp. 771-777, Jul. 2001.
[61] D. F. Murphy, A. Flavin, R. McBride, and J. D. C. Jones, “Interferometric
interrogation of in-fiber Bragg grating sensors without mechanical path length
scanning,” Journal of Lightwave Technology, vol. 19, no. 7, pp. 1004-1009,
Jul. 2001.
[62] K. T. O’Mahoney, R. P. O’Byrne, S. V. Sergeyev, L. Zhang, and I. Bennion,
“Short-scan fiber interferometer for high-resolution Bragg grating array
interrogation,” Sensors Journal, vol. 9, no. 10, pp. 1277-1281, Oct. 2009.
[63] W. Liu, G. Z. Guang, G. Liu, C. Yan, and S. He, “Optical low-coherence
reflectometry for a distributed sensor array of fiber Bragg gratings ,” Sensors
and Actuators A: Physical, vol. 144, no. 1, pp. 64-68, May 2008.
[64] L. Dziuda, G. Fusiek, P. Niewczas, G. M. Burt and J. R. McDonald,
“Laboratory evaluation of the hybrid fiber-optic current sensor,” Sensors and
Actuators A: Physical, vol. 136, no. 1, pp. 184-190, May 2007.
[65] Y. J. Rao and D. A. Jackson, "Universal Fiber-Optic Point Sensor System for
Quasic-static absolute measurements of multiparameters exploiting low
coherence interrogation," Journal of Lightwave Technology, vol. 14, no. 4, pp.
592-600, Apr. 1996.

8/2/2019 Liu Weilin 2011 Thesis
http://slidepdf.com/reader/full/liu-weilin-2011-thesis 114/121
101
[66] Y. J. Rao, D. A. Jackson, L. Zhang, and I. Bennion, “Extended dynamic range
detection system for in-fibre Bragg grating strain sensors based on two
cascaded interferometric wavelength scanners,” Measurement Science and
Technology, vol. 8, no. 10, pp. 1043-1049, Oct. 1997.
[67] J. D. C. Jones, “ Review of fiber sensor techniques for temperature-strain
discrimination,” in Proceedings 12th International Conference of Optical Fiber
Sensors, Williamsburg, VA, 1997, pp. 36-39.
[68] Y. J. Rao, “In-fibre Bragg grating sensors,” Measurement Science
Technology, vol. 8, no. 4, pp. 355 – 375, Apr. 1997.
[69] F. M. Haran, J. K. Rew, and P. D. Foote, “A strain-isolated fibre Bragg
grating sensor for temperature compensation of fibre Bragg grating strain
sensors,” Measurement Science and Technology, vol. 9, no. 8, pp. 1163-1166,
Aug. 1998.
[70] Y. J. Rao, D. A. Jackson, L. Zhang, and I. Bennion, “Strain sensing of
modern composite materials with a spatial/wavelength-division multiplexed
fiber grating network ,” Optics Letters, vol. 21, no. 9, pp. 683-685, May 1996.
[71] H. L. Ho, W. Jin, C. C. Chan, Y. Zhou, and X. W. Wang, “A fiber Bragg
grating sensor for static and dynamic measurands,” Sensors and Actuators A:
Physical, vol. 96, no. 1, pp. 21-24, Jan. 2002.
[72] Y. J. Rao, A. B. L. Ribeiro, D. A. Jackson, L. Zhang, and I. Bennion,
“Combined spatial- and time-division-multiplexing scheme for fiber grating
8/2/2019 Liu Weilin 2011 Thesis
http://slidepdf.com/reader/full/liu-weilin-2011-thesis 115/121
102
sensors with drift-compensated phase-sensitive detection,” Optics Letters, vol.
20, no. 20, pp. 2149-2151, Oct. 1995.
[73] M. J. O’Dwyer, C. Ye, Stephen W. James, and R. P. Tatam, “Thermal
dependence of the strain response of optical fibre Bragg gratings,”
Measurement Science and Technology, vol. 15, no. 8, pp. 1607-1613, Jul.
2004.
[74] C. F. Valdivielso, I. R. Matias, and F. J. Arregui, “Simultaneous measurement
of strain and temperature using a fiber Bragg grating and a thermochromic
material,” Sensor and Actuators A: Physical, vol. 101, no. 1-2, pp. 107-116,
Sep. 2002.
[75] M. G. Xu, J. L. Archambault, L. Reekie, and J. P. Dakin, “Discrimination
between strain and temperature effects using dual-wavelength fibre grating
sensors,” Electronics Letters, vol. 30, no. 13, pp. 1085-1087, Jun. 1994.
[76] Y. Han, S. B. Lee, C. S. Kim, J. U. Kang, U. Paek, and Y. Chung,
“Simultaneous measurement of temperature and strain using dual long-period
fiber gratings with controlled temperature and strain sensitivities,” Optics
Express, vol. 11, no. 5, pp. 476-481, Mar. 2003.
[77] M. Song, S. B. Lee, S. S. Choi, and B. Lee, “Simultaneous measurement of
temperature and strain using two fiber bragg gratings embedded in a glass
tube,” Optical Fiber Technology, vol. 3, no. 2, pp. 194-196, Apr. 1997.
8/2/2019 Liu Weilin 2011 Thesis
http://slidepdf.com/reader/full/liu-weilin-2011-thesis 116/121
103
[78] B. O. Guan, H. Y. Tam, X. M. Tao, and X. Y. Dong, “Simultaneous strain
and temperature measurement using a superstructure fiber Bragg grating,”
Photonics Technology Letters, vol. 12, no. 6, pp. 675-677, Jun. 2000.
[79] V. Bhatia, “Applications of long-period gratings to single and
multi-parameter sensing,” Optics Express, vol. 4, no. 11, pp. 457-466, May
1999.
[80] V. Bhatia and A. M. Vengsarkar, “Optical fiber long-period grating sensors,”
Optics Letters, vol. 21, no. 9, pp. 692-694, May 1996.
[81] H. J. Patrick, G. M. Williams, A. D. Kersey, J. R. Pedrazzani, and A. M.
Vengsarkar, “Hybrid fiber Bragg grating/long period fiber grating sensor for
strain/temperature discrimination,” IEEE Photonics Technology Letters, vol.
8, no. 9, pp. 1223-1225, Sept. 1996.
[82] R. W. Fallon, L. Zhang, L. A. Everall, J. A. R. Williams, and I. Bennion,
“All-fibre optical sensing system: Bragg grating sensor interrogated by a
long-period grating,” Measurement Science and Technology, vol. 9, no. 12,
pp. 1969-1973, Dec. 1998.
[83] X. Shu, D. Zhao, L. Zhang, and I. Bennion, “Use of dual-grating sensors
formed by different types of fiber Bragg gratings for simultaneous temperature
and strain measurements,” Applied Optics, vol. 43, no. 10, pp. 2006-2012,
Apr. 2004.

8/2/2019 Liu Weilin 2011 Thesis
http://slidepdf.com/reader/full/liu-weilin-2011-thesis 117/121
104
[84] S. W. James, M. L. Dockney, and R. P. Tatam, “Independent measurement of
temperature and strain using in fiber Bragg grating sensors,” Proceedings of
the 11th International Conference on Optical Fiber Sensors, Sapporo, Japan,
Postdeadline, paper: Fr3-3, 1996.
[85] S. W. James, M. L. Dockney, and R. P. Tatam, “Simultaneous independent
temperature and strain measurement using in-fibre Bragg grating sensors ,”
Electronics Letters, vol. 32, no. 12, pp. 1133-1134, Jun. 1996.
[86] H. B. Liu, H. Y. Liu, G. D. Peng, and P. L. Chu, “Strain and temperature
sensor using a combination of polymer and silica fibre Bragg gratings,” Optics
Communications, vol. 219, no. 1-6, pp. 139-142, Apr. 2003.
[87] X. Shu, Y. Liu, D. Zhao, B. Gwandu, F. Floreani, L. Zhang, and I. Bennion,
“Dependence of temperature and strain coefficients on fiber grating type and
its application to simultaneous temperature and strain measurement ,” Optics
Letters, vol. 27, no. 9, pp. 701-703, May 2002.
[88] W. C. Du, X. M. Tao, and H. Y. Tam, “Fiber Bragg grating cavity sensor for
simultaneous measurement of strain and temperature,” IEEE Photonics
Technology Letters, vol. 11, no. 1, pp. 105- 107, Jan. 1999.
[89] Y. J. Rao, “Recent progress in fiber-optic extrinsic Fabry – Perot
interferometric sensors,” Optical Fiber Technology, vol. 12, no. 3, pp.
227-237, Jul. 2006.
8/2/2019 Liu Weilin 2011 Thesis
http://slidepdf.com/reader/full/liu-weilin-2011-thesis 118/121
105
[90] Y. J. Rao, X. K. Zeng, Y. P. Wang, T. Zhu, Z. L. Ran, L. Zhang, and I.
Bennion, “Temperature-strain discrimination using a
wavelength-division-multiplexed chirped in-fibre-Bragg-grating/extrinsic
Fabry-Pérot sensor system,” Optical Fiber Sensor Conference Technical
Digest, 2002, OFS 2002, 15th, paper TuP21, Aug. 2002.
[91] T. Liu, G. F. Fernando, Z. Y. Zhang, and K. T. V. Grattan, “Simultaneous
strain and temperature measurements in composites using extrinsic
Fabry – Perot interferometric and intrinsic rare-earth doped fiber sensors ,”
Sensors and Actuators A: Physical, vol. 80, no. 3, pp. 208-215, Mar. 2000.
[92] Y. J. Rao, S. F. Yuan, X. K. Zeng, D. K. Lian, Y. Zhu, Y. P. Wang, S. L.
Huang, T. Y. Liu, G. F. Fernando, L. Zhang, and I. Bennion, “Simultaneous
strain and temperature measurement of advanced 3-D braided composite
materials using an improved EFPI/FBG system,” Optics and Lasers in
Engineering, vol. 38, no. 6, pp. 557-566, Dec. 2002.
[93] W. Du, X. Tao, and H. Y. Tam, “Temperature independent strain
measurement with a fiber grating tapered cavity sensor ,” IEEE Photonics
Technology Letters, vol.11, no. 5, pp. 596-589, May 1999.
[94] W. Zou, Z. He, and K. Hotate, “Complete discrimination of strain and
temperature using Brillouin frequency shift and birefringence in a
polarization-maintaining fiber,” Optics Express, vol. 17, no. 3, pp. 1248-1255,
Feb. 2009.

8/2/2019 Liu Weilin 2011 Thesis
http://slidepdf.com/reader/full/liu-weilin-2011-thesis 119/121
106
[95] S. T. Oh, W. T. Han, U. C. Paek, and Y. Chung, “Discrimination of
temperature and strain with a single FBG based on the birefringence effect,”
Optics Express, vol. 12, no. 4, pp. 724-729, Feb. 2004.
[96] O. Frazao, L. M. Marques, S. Santos, J. M. Baptista, and J. L. Santos,
“Simultaneous measurement for strain and temperature based on a long-period
grating combined with a high-birefringence fiber loop mirror,” IEEE
Photonics Technology Letters, vol. 18, no. 22, Nov. 2006.
[97] O. Frazao, J. L. Santos, and J. M. Baptista, “Strain and temperature
discrimination using concatenated high-birefringence fiber loop mirrors,”
IEEE Photonics Technology Letters, vol. 19, no. 16, pp. 1260-1262, Aug.
2007.
[98] G. Sun, D. S. Moon, and Y. Chung, “Simultaneous temperature and strain
measurement using two types of high-birefringence fibers in Sagnac loop
mirror,” IEEE Photonics Technology Letters, vol. 19, no. 24, pp. 2027-2029,
Dec. 2007.
[99] O. Hadeler, E. Ronnekleiv, M. Ibsen, and R. I. Laming, “Polarimetric
distributed feedback fiber laser sensor for simultaneous strain and temperature
measurements,” Applied Optics, vol. 38, no. 10, pp. 1953-1958, Apr. 1999.
[100] W. Zou, Z. He, and K. Hotate, “Demonstration of Brillouin distributed
discrimination of strain and temperature using a polarization-maintaining
8/2/2019 Liu Weilin 2011 Thesis
http://slidepdf.com/reader/full/liu-weilin-2011-thesis 120/121
107
optical fiber,” IEEE Photonics Technology Letters, vol. 22, no. 8, pp. 526-528,
Apr. 2010.
[101] G. Chen, L. Liu, H. Jia, J. Yu, L. Xu, and W. Wang, “Simultaneous strain
and temperature measurements with fiber Bragg grating written in novel Hi-Bi
optical fiber,” IEEE Photonics Technology Letters, vol. 16, no. 1, pp. 221-223,
Jan. 2004.
[102] M. S. Ferreira, J. M. Baptista, P. Roy, R. Jamier, S. Fevrier, and O.
Frazao, “Highly birefringent photonic bandgap Bragg fiber loop mirror for
simultaneous measurement of strain and temperature,” Optics Letters, vol. 36,
no. 6, pp. 993-995, Mar. 2011.
[103] P. M. Cavaleiro, F. M. Araujo, L. A. Ferreira, J. L. Santos, and F. Farahi,
“Simultaneous measurement of strain and temperature using Bragg gratings
written in germanosilicate and Boron-codoped germanosilicate fibers,” IEEE
Photonics Technology Letters, vol. 11, no. 12, pp. 1635-1637, Dec. 1999.

8/2/2019 Liu Weilin 2011 Thesis
http://slidepdf.com/reader/full/liu-weilin-2011-thesis 121/121
LIST OF PUBLICATIONS
[1] W. Liu, M. Li, C. Wang, and J. P. Yao, “Real-time interrogation of a linearly
chirped fiber Bragg grating sensor based on chirped pulse compression with
improved resolution and signal-to-noise ratio,” J. Lightwave Technol., vol. 29, no.
9, pp. 1239-1247, May 2011.
[2] W. Liu, W. Li, J. P. Yao, “Real-time interrogation of a linearly chirped fiber
Bragg grating sensor for simultaneous measurement of strain and temperature,”
IEEE Photon. Technol. Lett., vol. 23, no. 18, pp. 1340-1342, Sept. 2011.
[3] W. Liu, J. P. Yao, “Real-time interrogation of optical fiber sensor with
improved resolution and signal-to-noise ratio,” Proc. SPIE 8007, 80070H (2011);
doi:10.1117/12.905695.