
TF...TF 제품과함께하시면귀사업체의성공에도움을드릴수있다고확신합니다 티에프인터내셔널은점점다양하고고급화되어가는한국디저트장의
Upload
sorinarotarCategory
view
220download
0
8/6/2019 Lisbon TF Final Report
http://slidepdf.com/reader/full/lisbon-tf-final-report 1/82
The Social Protection Committee
GROWTH, JOBS AND SOCIAL
PROGRESS IN THE EU
A contribution to the evaluation of the social
dimension of the Lisbon Strategy
European Commission
Directorate-General for Employment, Social Affairs and Equal Opportunities
Units E.2 and E.4
Manuscript completed in September 2009

8/6/2019 Lisbon TF Final Report
http://slidepdf.com/reader/full/lisbon-tf-final-report 2/82
2

8/6/2019 Lisbon TF Final Report
http://slidepdf.com/reader/full/lisbon-tf-final-report 3/82
3
KEY MESSAGES
Message 1: Over the past decade, economic and employment growth has in general
improved overall living standards and many governments have been able to devote
more resources to social policy intervention. However, despite the clear
redistributive effect of social protection, inequalities have often increased and
poverty and social exclusion remain a major issue in most EU countries, although
with substantial differences across Europe.
Generally, richer countries spend a larger share of their GDP on social spending andeconomic growth has allowed many governments to devote more resources to socialpolicy interventions. However, empirical evidence1 shows that income inequalities haveincreased in most EU countries since the mid 80s. These trends were already flagged in
the "Social Reality Stocktaking"2. Most increases in inequalities happened between themid 80s and the mid 90s. In the last 10 years, in most cases inequalities have remainedstable, except in some countries. Behind these overall evolutions, diverging trends wereobserved at different levels of the income distribution. In most countries, top incomesgrew relatively faster than middle incomes. In some countries, low incomes caught upwith median incomes, while in other countries inequalities also widened at the bottom of the distribution.
A major factor behind this is the increase in earnings inequality among full-timeworkers further strengthened by the development of involuntary part-time and
temporary contracts. Labour market segmentation is an important determinant of widened earnings inequality not only because non-standard workers tend to work fewerhours per year but also because they are generally paid less per hour after controlling for
differences in education and experience. Available data therefore suggests that, in manyMember States, ceteris paribus, there is a substantial wage penalty from holding atemporary or part-time job.
Relative poverty risks increased in most Member States between the mid-1980s and themid-1990s and in most cases they either increased or stagnated between the mid-1990sand the mid-2000s. Over this second decade a shift in poverty risks was observed fromthe elderly towards younger people. Child poverty remained stable or increased in
most EU countries, while poverty risks generally decreased for the elderly (thoughremaining at relatively high levels in a few Member States) as a consequence of thematuring of pension systems (including reforms of minimum pensions).
The design of the tax-benefit system is crucial in determining the way and the extent towhich it affects income inequalities and redistributes resources to the poor. Importantfeatures include the progressivity of taxes and benefits and the degree of targeting andconditionality of benefits that can create disincentive effects, if badly designed. In most
1 Evidence draw from the “Growing Unequal?” OECD report http://www.criss-ineq.org and from the
funded EC research project INEQhttp://www.oecd.org/document/53/0,3343,en_2649_33933_41460917_1_1_1_1,00.html
2 http://ec.europa.eu/citizens_agenda/social_reality_stocktaking/index_en.htm

8/6/2019 Lisbon TF Final Report
http://slidepdf.com/reader/full/lisbon-tf-final-report 4/82
4
countries, the redistributive effect of benefits is higher than that of taxes (notably whenexcluding pensions). Available evidence highlights a large variation across MemberStates in net cash support to low-income households (ranging from the bottom value of 20% to the top value of 87% of the poorest decile group's disposable income in differentMember States). EU data show that social transfers other than pensions effectivelyreduce poverty risks but the degree to which they do so varies substantially acrossMember States (ranging from a poverty reduction effect of 50% or more in somecountries to one of 19% or less in others). This also reflects differences in the size of expenditure, which vary from 12% to 30% of GDP. Further work would be needed tobetter understand the determinants of the efficiency and effectiveness of tax-benefitsystems.
In recent years (2005-2007), it is only in countries experiencing very high averagegrowth rates per year (above 5%) that significant improvements in the standards of livingof the poor were observed (as illustrated by wide declines in anchored at-risk-of-povertyor material deprivation rates). In these countries, growth indeed appears to have helpedthe poor. For countries with average growth rates below 5% the nexus growth-livingconditions of the poor is much less clear. In general, economic growth has made itpossible to "erode" the areas of severe deprivation, particularly (though not only) in newMember States, but relative poverty has not declined and has even increased in somecountries that were traditionally "good performers".
Message 2: Having a job remains the best safeguard against poverty and exclusion.
However, recent employment increases have not sufficiently reached those furthest
away from the labour market, and jobs have not always succeeded in lifting people
out of poverty. Some groups still face specific hurdles such as poor access to
training for the low skilled, lack of enabling services, or poor design of benefits thatcreate financial disincentives. Labour market segmentation persists combined with
a lack in job quality. The development of precarious forms of employment, often
characterised by a strong gender dimension has contributed to persistently high
levels of in-work poverty. Lessons need to be drawn from these facts when
preventing that the crisis considerably aggravates persistent exclusion. Active
inclusion strategies are not only crucial to support the most vulnerable in the crisis,
but also to limit losses to human capital and preserve future growth potential.
While acknowledging the overall benefits of broader participation in the labour market,the report highlights a number of key trends showing that employment growth did notalways reach the most excluded and that the jobs created did not always provide fordecent living standards.
Significant progress has been made in raising employment rates across Europe,especially of women and also in reversing negative trends such as the decline inparticipation of older workers. Indeed, unemployment rates were significantly reduced inthe EU (from 8.6% in 2000 to 7.1% in 2007) and the increased participation of women assecond earners and of older workers (notably through the availability of part-time work)has helped improving the income of many households.
However, at the outset of the crisis, about one third of the working age population in theEU was out of work (unemployed or inactive). Furthermore, evidence shows that theincreases in employment rates observed in all EU countries before the crisis coexistedalongside significant numbers of workers in precarious jobs, working poor and

8/6/2019 Lisbon TF Final Report
http://slidepdf.com/reader/full/lisbon-tf-final-report 5/82
5
jobless households. Under-employment and precarious forms of contracts mitigate thepositive impact of including more people in the labour market. Single and lone parenthouseholds whose numbers have grown in the last decades tend to be more vulnerable onthe labour market.
The experience of this decade has confirmed that improving access to good quality
employment helps people out of poverty. Having a job remains the best safeguardagainst poverty and exclusion, since the risk of poverty faced by working age adultswithout work (unemployed or inactive) is more than 3 times higher than those in work(27% against 8%). However, a job is not always a guarantee against the risk of povertyand the working poor represent 1/3 of the working age adults at-risk of poverty. In 2007,8% of the people in employment were living under the poverty threshold. In-workpoverty is linked to the employment situation of the individuals such as low pay, lowskills, precarious employment and under-employment. Since 2000, the development of
temporary work, part-time work (including involuntary part-time) and sometimesstagnating wages have increased the number of individuals with low yearly
earnings. These trends particularly affected women and the young. It is also important tonote that for part of the workers, these jobs are not stepping stones towards better jobs.
Importantly, situations of poverty are also linked to the type of household in whichpeople live. In-work poverty is often related to low work intensity, i.e. situations wherethere are too few adults working in the household, or not working enough to make aliving (too few hours or only part of the year). Single and lone parent households, as wellas one-earner families face the highest risks of poverty.
The last decade has also seen the persistence of groups of people that remain outside
or at the margin of the labour market, often facing multiple barriers to enter the labour
market (among which low skills, care responsibilities, age, migrant background, andother factors of discrimination, etc.). The direst situations concern those households inwhich nobody works. In 2007 in the EU27, 9.3% of adults in age of working were livingin jobless households against 10.2% in 2001. These improvements have not reachedfamilies with children to the same extent and in 2007, 9.4% of children still lived in
jobless households against 9.5% in 2001 and the crisis is likely to increase the number of families having to rely entirely on social benefits.
Employment growth has been mainly driven by an increase of female labour marketparticipation and to a certain extent by the prolonged working life of older workers.However, in many countries the women who are furthest away from the labour
market (lone mothers, the low skilled, etc) still face important barriers to find a job, anda job that pays (lack of childcare or of care for other dependants, involuntary part-time,lack of reconciliation measures). The situation of migrants has also hardly improvedover the period. In particular, in long-standing host countries migrants have much loweremployment rates than the native population, even among the second generations. Thecurrent crisis may considerably aggravate the situation of these workers who werealready vulnerable before the crisis.
National experiences from past crises show that in some instances short-term responsesto rises in unemployment not only resulted in individual withdrawals from the labourmarket, but also have had long-term negative impacts on society as a whole. Stocks of
long-term unemployed or inactive tend to persist long after recovery has set in which points to the importance of active social security policies. Among the long termimpacts of the crisis observed in some countries are the increasing numbers of people

8/6/2019 Lisbon TF Final Report
http://slidepdf.com/reader/full/lisbon-tf-final-report 6/82
6
moving into long-term sickness and disability benefits, or early retirement schemes. Of these people, many are likely never to enter or return to the labour market.
A review of the main policy developments that were meant to address the trendsdescribed above shows that some progress has been made in enhancing activationmeasures across EU countries, but more needs to be done to reach the most vulnerable
workers, especially concerning access to Life Long Learning, since evidence shows thatthe low skilled continue to participate much less in training than the average
worker. This highlights the importance of sustained investments in education andtraining. The review also shows that specific activation measures are needed to reachdifferent categories of workers: youth, women (child care and reform of family support),older workers.
The analysis also shows that while some progress has been made in reducing financial
disincentives to take up work or work more, attention should be paid to the adequacy
of benefits, especially in Member States with major weaknesses and loopholes in theirsafety nets. This shows that both goals need to be pursued at the same time. Furthermore,financial disincentives are not the only barriers to labour market participation, adequateand individualised support services play a key role. Finally, the inadequacy of safety netsis not only a cause of poverty persistence, but also an obstacle to re-integration in thelabour market and society.
The report illustrates that more needs to be done to ensure that EU labour markets aretruly inclusive and lead to greater social cohesion. In order to reach the most vulnerable,without necessarily increasing spending, the effectiveness of the measures describedabove can be reinforced if they are integrated into active inclusion strategies.
Message 3: Past decades of reforming social protection systems have improved their
long-term financial sustainability. However, there remain issues to be resolved
regarding the accessibility and adequacy of social protection. Higher employment
rates, longer working lives, and increased healthy life expectancies will play an
important role in ensuring both adequacy and sustainability of social protection. In
the case of pensions this would apply to funded as well as pay-as-you-go schemes.
Efforts to modernise all functions of social protection should be sustained in order
to ensure effective access to quality services for all while contributing to the
efficiency of public expenditure. Notably, modernisation in health care and long-
term care can improve the health of the whole population and of the work force.
The extent to which social protection systems encourage social and active inclusion asthe population ages has been a vital element in past reforms. Countries spend a larg shareof their GDP on social spending and economic growth has allowed many governments todevote more resources to social policy interventions. Old-age pensions and sickness andhealthcare benefits represent the bulk of spending in all EU Member States. In the lastyears the SPC has carried out important analytical work focusing on the adequacy anduniversality of protection, the sustainability of the systems, and the need to balance thesetwo objectives through modernisation.
Pensions represent by far the greatest item of expenditure of social protection (46% in
2006). In the past years, Member States reformed their pension systems by tightening theeligibility for public pensions, reducing the projected levels of pensions relative towages, increasing incentives for individual to work more and longer and increasing therole of privately managed pension provision. As a result, although the effect of

8/6/2019 Lisbon TF Final Report
http://slidepdf.com/reader/full/lisbon-tf-final-report 7/82
7
demographic change in the absence of reforms would push public pension expenditure byaround 9 percentage point of EU GDP between 2007 and 2060, recent reforms of pensionsystems are expected to reduce this increase to only 2.4 percentage points, so thatprojected expenditure would reach 12.5% of GDP in 2060.
As a consequence of the reforms the role of public pension benefits in overall pension
provision would decline, though public pensions are expected to remain the major sourceof income for pensioners in all but a few Member States. Theoretical replacement rateswhich reflect pension levels relative to the last wages received are projected to drop onaverage by several percentage points, and some Member States should record decreasesof around 20 percentage points. This negative impact on adequacy of pensions could bepartially offset by extending working lives, through improving the ability andopportunities for all workers to remain in employment, by reinforcing contributivity andby improving the financial and administrative management of pension systems. Forinstance two additional years of contributions could raise theoretical replacement rates inthe majority of Member States by 4 to 9 percentage points and help reduce the adequacygap and the tension in the triangle of increasing contributions and declining expenditure.
Replacement rates from privately pensions are also expected to increase as contributionto these pensions increase as a response to ageing and demographic changes. The currenteconomic crisis and past studies have, however, highlighted the need to monitor the riskinvolved with such pensions for various socio-economic groups and have stressed therelevance of sufficient minimum pensions.
Health and long-term care systems are the second biggest social protection componentand the availability, affordability and quality of care can strongly influence the likelihoodof overcoming disease, avoiding mortality and ensuring independent living. Theconsiderable improvement in the health status of the EU population in recent decades hasbeen associated with more widely available healthcare i.e. a rising share of resourcesdevoted to healthcare systems and a more equitable distribution of these resources. It hasalso been recognised that good health contributes to economic prosperity throughimproving labour market participation and improving productivity as well as increasingparticipation in other societal activities.
However, health inequalities exist between different EU Member States and betweensocial groups within Member States and have widened in recent decades. This is partlydue to the fact that some health care systems are under-resourced and that in manycountries, various financial and organisational barriers prevent access to timely andeffective healthcare for some groups of the population. It is also important to note that
high levels of poor health in sections of the EU population imply substantial opportunitycosts for the Union as they are detrimental to employment, productivity and growth.Avoidable ill-health also puts unnecessary pressure on public budgets.
Nevertheless, expenditure has risen over time and ageing, technology and growingexpectations are creating further pressure on resources. Without investments inpreventive measures, public expenditure on health-care is projected to grow by1½ percentage points of GDP in the EU between 2007 and 2060. The evolution of futurespending will depend on effective management and balancing of the costs and benefits of technological advancement, as well as achieving better value for money throughstrengthened primary care, prevention and health promotion, and through better
coordination and rational use of resources.
Long-term care has been identified as an important social protection issue in view of anageing population. Health and long-term care services are dependent on sufficient

8/6/2019 Lisbon TF Final Report
http://slidepdf.com/reader/full/lisbon-tf-final-report 8/82
8
numbers of both high and low skilled staff and represent an opportunity for job creationin the care sectors.
Modernisation has happened also in other branches of social protection to improvecoverage of new risks and improve responsiveness of the system, for example byincreasing expenditure of active labour market measures, or by addressing financial
disincentives to take-up work or work more (see message 2). Since modernising effortshave to continue in all the social protection functions to improve effective access forthose that need it in a sustainable manner, it is vital to monitor all the different socialprotection benefit systems extensively.
Message 4: Social protection systems can play a crucial role as automatic stabilisers
and sustain the productive capacity of the economy. However, Member States are in
very different positions to face the crisis. In some countries, there are significant
weaknesses and loopholes in social safety nets. In others with mature social
protection systems that cushion the impact of the crisis, financial sustainability is
questioned in the long run. Countries faced with major public finance imbalances
are left with little room for manoeuvre to address the social consequences of the
crisis. This raises particular concern for those who also have weaker levels of
protection.
Promoting labour market participation while improving the fairness, efficiency and
effectiveness of social spending will be crucial for all countries, both in view of
ensuring counter-cyclicality towards economic growth and addressing fiscal
imbalances.
Over the last 50 years, notably between the early 1970s and the 1990s, we have seen astructural rise in the share of social protection expenditure as a percent of GDP inMember States. There several reasons behind this trend. First, social protection systemsare maturing and coverage is increasing. Second, new types of benefits are introduced –as happened with family, child benefits and long-term care benefits. Third, demographicand social and economic changes (e.g. evolution of family structure) can increasedemand for social protection even in the context of constant set up of social protectionsystems. Fourth, relative price trends as well as indexation rules can lead to long termincreases or declines in the share of GDP devoted to social protection – notably in thehealth care area. Fifth, inefficiencies in provision and lack of clear budget constraints andaccountability can also contribute to long-term expenditure rises. Finally, we can observe
a hysteresis effect when increases in short-term unemployment persist and lead to
long term labour market exclusion.
The last mentioned of these effects takes place when there is a recovery on the labourmarket and the unemployed do not reintegrate the labour market and end up in long-termunemployment or into incapacity or early retirement benefits.
An analysis of the evolution of social spending and public deficit against the economiccycle illustrate to which extent social spending are counter-cyclical, both in bad and goodtimes. Social protection expenditure can be more or less responsive to the economic
cycle. Firstly, some cases reveal that reactivity to the cycle can be increased or decreased
by the design of rules on granting different kinds of benefits. Eligibility criteria andbenefit levels clearly affect benefit take up. Secondly, the relationship of socialprotection expenditure with economic growth depends on how much the growth iscreating employment.

8/6/2019 Lisbon TF Final Report
http://slidepdf.com/reader/full/lisbon-tf-final-report 9/82
9
Anti-cyclical behaviour in social spending helps maintain the productive capacity of theeconomy as it allows for room for manoeuvre in a recession. An anti-cyclical behaviourin public spending, especially on social expenditure, is an important part of re-boundingan economy in recession. As GDP contracts, however, Government budget balances areoften strained, therefore bringing to light the issue of how to finance increases inexpenditure whiles avoiding ballooning deficits. Increases in social protectionexpenditure should be seen as part of a recovery package, rather than a permanentfeature, thus acting as an automatic stabiliser. Hysteresis effects and persisting fiscaldeficits accumulating over the years can thus be avoided.
Countries with mature social protection systems where social spending increases whenunemployment rises and decreases substantially afterwards, tend to also show solid fiscalpositions. In countries where stabilizers played their role well in times of crisis but socialexpenditure was not significantly reduced in good times, the fiscal situation is lessfavourable. In other countries, social spending does not show a strong relation to thebusiness cycle, and have rather increased steadily since the 80s reflecting the building upof the welfare state. Others have used the latest periods of low unemployment rates toimprove their safety nets and address high poverty rates through improving the situationof the most excluded from the labour market. In many countries, efforts have been madeto address the lack of incentives to enter the labour market through adequate transfers,active labour market policies and a balance between rights and obligations.
At the same time, the analysis shows that there are substantial gaps in coverage and
adequacy in a number of Member States, showing that there is a need to completeand/or reinforce social protection systems, including support for the unemployed, accessto healthcare for all and ensuring adequate retirement benefits including for those withnon-standard careers. In such a process it is important to learn from the mistakes of the
past and create protection systems that encourage active participation and cover all thecentral social risks.
The analysis documents that Member States have taken steps towards reshaping social
protection systems so that they encourage activity and inclusion. However, it is alsoclear that good economic performance is a precondition for well functioning socialprotection systems. Good employment performance has always been crucial for thesustainability of social protection systems but with ageing open labour markets thatattract those who are still underrepresented in employment are becoming essential.Hence modernisation of social protection needs to go hand in hand with rapid progresswith effective strategies for growth and more and better jobs.
* * *
Talking about health care, US President Obama said recently "If Europeans have done it,why could we not achieve it?" Indeed, this report based upon the joint experience of 27Member States working in the context of the social OMC shows that Europeans can beproud of the achievements of their social protection systems. Not only has it verysignificantly contributed to avoid that the economic and financial crisis turns into apolitical disaster; but it has undergone, in line with the whole Lisbon strategy, a deep
modernisation. However, social protection is not enough to limit or prevent poverty andexclusion. Having a job remains indeed the best safeguard against poverty and exclusion,in that sense confirming and important stance of the Lisbon Strategy. Precisely thisreport stresses that the virtuous circle of participation in employment and living out of

8/6/2019 Lisbon TF Final Report
http://slidepdf.com/reader/full/lisbon-tf-final-report 10/82
10
poverty has not always functioned as it should have in the last decade: serious obstaclesstill face the most vulnerable groups, such as the low skilled, lone parent families, ormigrants. In addition, some of the recent developments have not paid enough attention tointeraction between flexible labour markets and quality of work, notably in relation to itsimpact on the gender dimension. As a consequence, while the emphasis should still be onpromoting growth and jobs, fighting child poverty, engaging closely in active inclusionand more generally fighting labour market segmentation and encouraging job quality willhave a crucial importance.
This is not to say that the task of modernising social protection is over: quite thecontrary. Building on previous achievements, reforms should be further pursued andfully articulated with growth and employment strategies. The consolidation of pensionreforms will require further efforts to promote longer working lives, which in turn makesa strong case for fighting health inequalities and improving health and safety at work.
The stance of promoting active social protection policies will not be undermined, but onthe contrary should expand to domains beyond health and pensions, deserving moreattention from policy makers.
Finally, looking beyond 2010, it appears that truly accessible and financially sustainableprovision of basic services such as child care, health and long term care, lifelonglearning, will be a key component of any post-crisis strategy.

8/6/2019 Lisbon TF Final Report
http://slidepdf.com/reader/full/lisbon-tf-final-report 11/82
11
REPORT
INTRODUCTION
The mutual interaction between economic, employment and social policies is at thecentre of the Social Protection Committee’s concerns. The agreed common objectives of the European strategy for social protection and social inclusion comprise an overarchinggoal setting out the need to ensure that adequate, accessible, financially sustainable,adaptable and efficient social protection and social inclusion policies support economicand employment growth. Symmetrically, it requires that growth and more and better jobscontribute to greater social cohesion and to the adequacy of social protection systems. InSeptember 2007, the Committee adopted a report on how best to achieve this integration.The report stressed that successful pro-growth and employment policies need to beunderpinned by modern social protection systems and improved social cohesion, whichspread positive effects of growth and increase employment opportunities across allsocieties.
The present report goes a step further. As a contribution to the analytical underpinning of the "post-2010 Lisbon Strategy", it investigates the extent to which past growth andemployment achievements since the launch of the Lisbon strategy have had an impact onsocial adequacy and social inclusion, and vice versa. It also tries to draw lessons from thelatest evaluations of the social impact of the crisis. This analysis jointly undertaken bythe SPC and its indicators sub-group and the Commission3 builds on work carried out in
the context of the OMC, reviews existing evidence, both at international and nationallevels and presents original analysis. The main results of this work are presented in thiscore report which draws from the analytical chapters in the attached supportingdocuments.
It aims at answering the following questions.
– Did economic growth and increases in employment support social inclusion andsocial protection? By which channels?
– Did higher employment rates strengthen adequacy and better access to socialprotection?
– To what extent did the modernisation of social inclusion and social protectionschemes support economic growth, employment and benefit adequacy?
– Did growth contribute to a maturing of social inclusion and social protectionschemes and to what extent does social protection act as an automatic stabiliserin the economic cycle thus promoting growth and avoid hysteresis effects?
3 See composition of the SPC/ISG task force that was set up in November 2008 in annex.

8/6/2019 Lisbon TF Final Report
http://slidepdf.com/reader/full/lisbon-tf-final-report 12/82
12
TABLE OF CONTENTS
1. Setting the context 14
1.1. The crisis put a halt to a period of overall economic and employment growth and price
stability 14 1.1.1. A decade of overall economic and employment growth 14 1.1.2. The impact of the crisis 14
1.2. The long-term evolution of social protection expenditure 15
2. Economic and employment growth are not enough to reduce inequalities and combat poverty
16
2.1. Income inequalities vary significantly across Member States and have generally increased
within Member States, especially at the top of the income distribution 16 2.1.1. Demographic changes pushed towards rising income inequalities 17 2.1.2. Increased earnings inequality, due to widened inequality among full-time workers as well aslabour market segmentation, is a major determinant of rising income inequalities 18
2.2. Relative poverty risks differ markedly across Member States and have increased or stagnated
over the past two decades 19 2.2.1. Great variation is observed in relative poverty risks across the EU 19 2.2.2. Relative poverty risks have not been reduced in the last decade 20 2.2.3. Poverty risks have shifted away from the elderly towards younger people, and havegenerally increased for the working age population 21
2.3. Living standards vary greatly across the EU despite improvements observed in high growth
countries 21 2.3.1. Living standards vary greatly across the EU 21 2.3.2. In recent years, economic growth has helped raising significantly the living standards of thepoor only in a few countries with high growth rates. 23
2.4. Social protection has a clear redistributive effect in all countries, but the design of the tax-benefit system is crucial to understand large differences in the effectiveness of the systems 24
2.4.1. The design of the tax-benefit system is crucial in determining the way and the extent towhich it affects income inequalities. 24 2.4.2. ..as well as the way and the extent to which it redistributes resources to the poor 25
2.5. Lessons learnt from the diversity of experiences Member States went through over the past 20
years and in previous recessions 27
2.6. Concluding remarks 33
3. Job creation and social inclusion 35
3.1. The diagnosis: despite undeniable progress, more needs to be done to ensure that labour
markets are truly inclusive 35 3.1.1. Having a job remains the best safeguard against poverty and exclusion… 35 3.1.2. …but a job is no guarantee against the risk of poverty and the working poor represent asignificant share of those at-risk of poverty… 36 3.1.3. … and the job strategy did not always reach the most excluded 36
3.2. Is labour market inclusion guaranteeing income adequacy and social inclusion? 37 3.2.1. Increased labour market segmentation: Temporary work, part-time work and sometimesstagnating wages have increased the number of individuals with low earnings 37 3.2.2. In-work poverty: when a job does not provide decent income for the household 40
3.3. Focus on the most excluded from the labour market 42 3.3.1. Long-term unemployment was significantly reduced, but to a lesser extent for older workers
and the low skilled 42 3.3.2. Nearly 10% of people still live in jobless households 43 3.3.3. Little progress in reducing the employment gap of migrant workers 44 3.3.4. Regional disparities in employment rates were reduced, but overall regional developmentdoes not automatically lead to the reduction of poverty 45

8/6/2019 Lisbon TF Final Report
http://slidepdf.com/reader/full/lisbon-tf-final-report 13/82
13
3.4. Some progress in supporting the labour market integration of the most excluded, but concerns
remain on the effectiveness of safety nets 45 3.4.1. Some progress in measures to support labour market integration 46 3.4.2. Significant efforts to reduce financial disincentives to work, but concerns remain on theeffectiveness of safety nets 48
3.5. Concluding remarks: 52
4. Modernising social protection systems to promote growth and jobs 54
4.1. The role of social protection in an ageing society 54
4.2. Pension reform – progress in sustainability, emerging adequacy gaps and higher and better
quality employment as an urgent need to improve balance between sustainability and adequacy 55 4.2.1. The main feature in pension reforms: tightening the link between work and benefits 55 4.2.2. Financial sustainability at the cost of adequacy? 55 4.2.3. Promoting working more and longer through pension reforms 56 4.2.4. … but we still need to protect the interests of other vulnerable groups on the labour market
57 4.2.5. The increasing role of funded privately managed schemes: adequacy and risk 58 4.2.6. … The financial crisis has highlighted risks in privately managed schemes 59 4.2.7. … and in pay-as-you-go schemes 60 4.2.8. Labour market and pension policy need to be combined to achieve adequate and sustainablefuture pensions 61
4.3. Reconciling ageing, health expenditure and inequalities to sustain growth and employment 64 4.3.1. Healthcare has contributed to considerable improvements in population health 64 4.3.2. And a healthy workforce is needed to ensure high productivity and longer working lives 64 4.3.3. However, there are large gaps in health between and within countries… 64 4.3.4. … due to various access barriers that are more severe for lower socio-economic groups 65 4.3.5. …and which have important economic implications 65 4.3.6. In addition and paradoxically, expenditure has risen over time and ageing, technology andgrowing expectations are creating further pressure on resources 66 4.3.7. Hence, improving the value for money of healthcare systems through enhancing
effectiveness, efficiency and priority setting have been deemed an urgent task. 66 4.3.8. Long-term care has been deemed a social risk and an important social protection issue inview of an ageing population 66 4.3.9. Health and long-term care services are dependent on sufficient numbers of both high andlow skilled staff and represent an opportunity for job creation in the care sectors 66
4.4. Concluding remarks 67
5. Providing adequate and sustainable social protection over the economic cycle 68
5.1. The coverage and adequacy of EU social protection systems at the onset of the crisis 68 5.1.1. Protecting the unemployed 69 5.1.2. Protecting the elderly 70 5.1.3. Adequate protection for the sick and disabled? 71
5.2. The role of social protection as an automatic stabiliser - the long-term fiscal capacity to
provide adequate protection 5.2.1. Long term trends in social protection expenditure 72 5.2.2. Automatic stabilisation is a key instrument to achieve output stabilisation 74
5.3. A lack of responsiveness can lead to a hysteresis effect and long term increases in the level of
social expenditure – a wide diversity of experiences in Member States 75
5.4. Concluding remarks 78

8/6/2019 Lisbon TF Final Report
http://slidepdf.com/reader/full/lisbon-tf-final-report 14/82
14
1. SETTING THE CONTEXT
1.1. The crisis put a halt to a period of overall economic and employment growth
and price stability
1.1.1. A decade of overall economic and employment growth
The Lisbon Strategy was launched in 2000 following a period of relatively sustainedgrowth in the second half of the 1990s. The European economy stagnated in 2002-2003,to rebound again in 2004. Growth came to a halt in 2008 as the world entered one of thedirest financial and economic crises in years.
Over the last 15 years, the evolution of the general government debt ratio was quiteclosely correlated with the economic cycle. Overall, EU Member States used the periodto improve public finances, and the aggregate debt of the EU-27 went below thethreshold of 60% of GDP in 2007.
Since the launch of the Lisbon Strategy, EU unemployment rates were reduced from8.7% in 2000 to 7% in 2008 and employment rates increased significantly from 62.2% in2000 to 65.9% in 2008 and unemployment rates were reduced from 8.7% in 2000 to 7%in 2008. In spite of this improvement the results still fall short of the objectives of the70% Lisbon Strategy. target.. The rise in employment rates was mainly driven by anincreased participation of women in the labour market, and of older workers to a lesserextent. The fall in unemployment rates mainly benefited to medium skilled and prime ageworkers, while the low skilled and the young benefited less. Inactivity rates were alsoreduced during the period, from 31.5% in 2000 to 29.1% in 2008. The economicdownturn will be a real test for the durability of achievements of the last decade in thelabour market. The most vulnerable workers, such as the young, the low skilled or themigrants have been the most hit by the crisis.
The price environment was quite stable in the EU-15 since mid-1990s, but a change inrelative prices of different consumption items was observed. Key items that weighheavily in household expenditure (energy, education, health products and services, andtransport services) became relatively more expensive. The relative decline of the pricesof clothing and footwear, recreation and culture, and household equipment compensatedthis increase overall, but probably to a lesser extent for low income households.
Behind these overall trends, the socio-economic reality of the European Union remainsvery diverse. Thanks to the dynamic growth registered in the poorest countries of the EU
the gap in GDP per capita continued to narrow between 2000 and 2008. However, in2008 GDP/per capita remained below 50% of the EU-27 average in Bulgaria andRomania and exceeded 120% in 5 EU countries. Moreover, the economic convergenceobserved between countries hides a widening of inter-regional disparities within somecountries of the EU, especially in some of the New Member States where growth hasmainly been concentrated in capital regions and other urban areas.
1.1.2. The impact of the crisis
The impact of the economic crisis on the labour market is now visible. Employmentgrowth has come to a standstill and the employment rate contracted in the first quarter of 2009 to reach 64.6% in the EU-27 against the 66.4% peak in the third quarter of 2008.
Unemployment rates have started to rise from a low at 6.7% in March 2008 to reach8.9% in June 2009 and could go up to 11% in 2010 if policies and labour marketbehaviour remain unchanged.

8/6/2019 Lisbon TF Final Report
http://slidepdf.com/reader/full/lisbon-tf-final-report 15/82
15
In some Member States, the recent rise in unemployment has been especially stark (seeannex). In Spain it reached 18.1% in June 2009, against 11% in June 08. During the sameperiod, it also more than doubled in Ireland (12.2% against 5.6%), in Estonia (17%against 4.6%), Lithuania (15.8% against 5.1%) and Latvia (17.2% against 6.4%).
Some categories of workers are on the front line of the crisis, including the young, the
low skilled, employees holding temporary contracts, EU mobile workers, migrants andthe elderly. Youth unemployment rate reached 18.3% in the EU27 in March 2009 against14.7% at the end of 2007. In the fourth quarter of 2008, the unemployment rate of non-EU workers grew faster than for other workers and reached 16% against 14% one yearbefore.
Past experience shows that many of those who become unemployed due to a temporarydecline in labour market demand risk drifting into permanent labour market exclusionwith dire consequences for both individuals and society. National experiences from pastcrisis shows that in some instances short-term responses to rises in unemployment notonly resulted in individual withdrawals from the labour market, but also have had long-term negative impacts on society as a whole. Among the long term impacts of the crisisobserved in some countries are stocks of long-term unemployed or inactive that tend topersist long after recovery has set. Increasing numbers of people are moving into long-term sickness and disability benefits, or early retirement schemes. Of these people, manyare likely never to enter or return to the labour market, thus putting long term pressureson social inclusion and protection schemes. The use of disability benefits or earlyretirement schemes to mitigate a sudden rise in unemployment has therefore proved bothcostly and counter productive.
Figure 1.1: Employment rates in the EU: Total, women and older workers, 2008
0
10
20
30
40
50
60
70
80
eu27 mt hu it ro pl el sk be lu bg es lt f r cz ie pt lv si ee de cy fi uk at se nl dk
Total Older workers
Female Total employment Lisbon target
Fem ale em ploym ent Lisbon target Older w orkers em ploym ent Lisbon target
Source: Eurostat LFS
1.2. The long-term evolution of social protection expenditure
Just as social protection expenditure can help mitigate the impact of economic
slowdowns and support growth in the long run, growth contributes to the building up andsustainability of social protection. The ratio of social protection expenditure as a share of GDP has declined during periods of rapid growth in the second half of 1990s, afterhaving increased sharply in the early 1990s when growth rates were very low, reflecting

8/6/2019 Lisbon TF Final Report
http://slidepdf.com/reader/full/lisbon-tf-final-report 16/82
16
a correlation between growth, employment and expenditure. In recent years (2000-2004),social protection expenditure has grown slightly more rapidly than GDP due to moredynamic developments in health care and unemployment expenditure. Clearly, policiesthat affect expenditure also have a direct impact on the need to adapt social protectionfinancing. In recent years, a trend can be observed towards increased resources fromgeneral government budgets devoted to social protection, away from a reliance on socialcontributions levied on wages in the financing of social protection.Figure 1.2: Expenditure on social protection benefits since 1994 in the EU in relation to the
fiscal situation, % of GDP
EU-27
-4,0
-3,0
-2,0
-1,0
0,0
1,0
2,0
3,0
4,0
5,0
6,0
7,0
8,0
9,0
10,0
11,0
1 9 9 4
1 9 9 5
1 9 9 6
1 9 9 7
1 9 9 8
1 9 9 9
2 0 0 0
2 0 0 1
2 0 0 2
2 0 0 3
2 0 0 4
2 0 0 5
2 0 0 6
2 0 0 7
2 0 0 8
2 0 0 9
2 0 1 0
%
-12,0
-9,0
-6,0
-3,0
0,0
3,0
6,0
9,0
12,0
15,0
18,0
21,0
24,0
27,0
30,0
33,0
% o f G D P
Real GDP growth (lhs) Unemployment rate ( lhs) Budget balance (rhs) Social protect ion expendi ture (rhs) Source: AMECO database4
2. ECONOMIC AND EMPLOYMENT GROWTH ARE NOT ENOUGH TO REDUCE
INEQUALITIES AND COMBAT POVERTY
2.1. Income inequalities vary significantly across Member States and have
generally increased within Member States, especially at the top of the income
distribution
Inequalities in disposable income have generally increased between the mid-1980s
and the mid-2000s (OECD, 20085). The Member States for which data are available are
mostly characterised either by increasing inequality over both decades (this holds for thelargest group of countries) or by a rise in inequality in the first decade followed by adecline in the second one. The observed rises in inequality are among the strongest in
4 The AMECO database is based on National Accounts.In this extract from AMECO the sum of "Social transfers in kind" and "Social benefits other than socialtransfers in kind" in accordance with European System of Accounts 1995 (ESA95) has been used.Generally speaking the results for total expenditure on social protection is somewhat lower than inESSPROS. For details on the main differences compared with the European System of Integrated SocialProtection Statistics (ESSPROS) in the way social benefits in cash and kind are distinguished please referto Manual on sources and methods for the compilation of COFOG Statistics, page 65-66, Eurostat,
http://epp.eurostat.ec.europa.eu/cache/ITY_OFFPUB/KS-RA-07-022/EN/KS-RA-07-022-EN.PDF5 See “Growing Unequal?” 2008 OECD report
http://www.oecd.org/document/53/0,3343,en_2649_33933_41460917_1_1_1_1,00.html and the funded EC research project INEQ http://www.criss-ineq.org

8/6/2019 Lisbon TF Final Report
http://slidepdf.com/reader/full/lisbon-tf-final-report 17/82
17
Finland and Sweden (starting from low levels of inequality) but also in Germany, Italyand Portugal6 (starting from higher levels), though in recent years signs of a decline inincome inequality were observed in Portugal. France and Greece experienced declines inhousehold disposable income inequality over the time interval considered (and Irelandand Spain as well till 2000 – the year to which data are limited) (OECD, 2008). In mostcountries, top incomes grew relatively faster than middle incomes. In some countries,low incomes caught up with median incomes, while in other countries inequalities alsowidened at the bottom of the distribution, as illustrated in table 2.1.
Income inequality differs significantly across Member States, ranging from a value of the Gini coefficient for household disposable income of 0.23 for Slovenia and Sweden tothe top values of 0.35 and 0.37 respectively for Latvia and Portugal (EU-SILC 2007). Inother words, in 2007 in the EU, the total income received by the 20% of the populationwith the highest income was 4.8 times higher than the total income received by the 20%with the lowest income. This ratio varies 3.5 or less in the Czech Republic, Slovenia,Slovakia and Sweden to 6 or more in Greece, Latvia, Portugal and Romania. Relatively
high income inequalities are observed also for Romania, Estonia, the UK, Lithuania andGreece.
Table 2.1 – Trends in real household income by quintiles
Average annual change
mid-1980s to mid-1990s
Average annual change
mid-1990s to mid-2000s
Bottom
quintile
Middle
three
quintiles
Top
quintile Median Mean
Bottom
quintile
Middle
three
quintiles
Top
quintile Median Mean
BE 1.2 0.5 1.2 0.4 0.8 1.4 1.3 1.7 1.2 1.5CZ .. .. .. .. .. 0.4 0.6 0.7 0.5 0.6
DK 1.3 0.9 0.8 0.9 0.9 0.6 0.9 1.5 0.9 1.1DE 0.4 1.4 1.6 1.2 1.4 -0.3 0.5 1.3 0.6 0.7IE 4.0 3.0 2.9 3.2 3.1 5.2 7.7 5.4 8.2 6.6EL 0.3 0.1 0.1 0.3 0.1 3.6 3.0 2.7 2.9 2.9ES 4.4 3.2 2.4 3.2 3.0 5.2 5.1 5.0 5.5 5.1FI 0.9 0.9 1.0 0.8 1.2 1.6 2.5 4.6 2.5 2.9FR 1.0 0.5 -0.1 0.5 0.3 0.9 0.7 1.0 0.8 0.8IT -1.3 0.5 1.5 0.6 0.8 2.2 1.0 1.6 1.0 1.3LU 2.3 2.5 3.0 2.4 2.7 1.5 1.5 1.7 1.5 1.6HU .. .. .. .. .. 0.9 1.2 1.0 1.1 1.1AT 2.5 2.7 2.8 2.8 2.7 -2.1 -0.5 -0.4 -0.6 -0.6NL 1.1 2.7 3.9 2.8 3.0 1.8 2.0 1.4 2.0 1.8PT 5.7 6.5 8.7 6.2 7.3 5.0 4.1 4.4 4.2 4.3SE 0.5 0.9 1.2 0.9 0.9 1.4 2.2 2.8 2.2 2.3UK 0.7 2.0 4.3 1.9 2.8 2.4 2.1 1.5 2.1 1.9
Source: OECD (2008) based on OECD income distribution questionnaire
2.1.1. Demographic changes pushed towards rising income inequalities
Changes in the population structure by age and household types are also responsible forincreased income inequalities in most EU countries through ‘compositional effects’(linked to the fact that income is not uniformly distributed among different demographicgroups). For instance, the increase in the share of people living alone (particularly
6 Between 2005 and 2008 the Gini coefficient declined from 0.38 to 0.36 and the S80/S20 ratio decreasedfrom 6.9 to 6.1.

8/6/2019 Lisbon TF Final Report
http://slidepdf.com/reader/full/lisbon-tf-final-report 18/82
18
pronounced in Finland and Italy) and in lone-parent households (especially in France,Germany and the UK) has pushed towards wider inequalities. By comparing actualchanges in the Gini coefficient with hypothetical ones under the assumption of constantage and household structure, the "Growing Unequal" OECD report shows that indeeddemographic trends raised inequality in most countries, with a relatively strong impact inFrance, Germany, the Netherlands and the UK. Demography therefore played a role inexplaining rising inequalities, though it was not the main driver.
2.1.2. Increased earnings inequality, due to widened inequality among full-time workers
as well as labour market segmentation, is a major determinant of rising income
inequalities
Changes in individual earnings are one of the main drivers of household income
inequality for the simple reason that earnings represent the biggest slice of householdincome. Both the OECD report and the INEQ project7 highlight an increase in personalearnings inequality among full-time workers (as measured by the P90/P10 inter-decileratio) over the last two decades (though with a few exceptions). The widening of thedistribution for full-time workers has been larger at the top than at the bottom, meaningthat the increase in the distance between top and middle earners has contributedrelatively more to the observed increase in inequality for full-time earners.
Labour market segmentation (linked to the introduction of temporary and part-timecontracts) has further strengthened the rise in earnings inequality already observed forfull-time workers (Figure 2.1). In terms of annual earnings, one of the reasons for this isof course the reduced number of hours worked by part-time employees and also by manycategories of temporary workers8, of whom many are women and young people (see part3). But on top of this, non-standard workers are also generally paid less per hour after
controlling for differences in education and experience.
9
Findings from the INEQproject, show that temporary workers indeed experience a high wage gap relative to theothers controlling for the above mentioned characteristics. These results highlight thatthere is, ceteris paribus, a substantial wage penalty from holding a temporary or part-time
job. Eastern European countries (excluding Poland) and the UK are the only exceptionsto this as such a wage penalty in these countries is significantly lower than in the othercountries studied in the project. The OECD report also shows that countries with anarrower earnings distribution for full-time workers tend to display a greater widening of the distribution due to the inclusion of part-time workers.
7 INEQ is a research project financed under the VI EU Framework Programme and bringing together sevenuniversities and research centres from different EU countries. The project investigates the economicand social mechanisms producing inequalities in EU and EU neighbouring countries, the effects of inequalities in society and policies aimed at reducing it. http://www.criss-ineq.org
8 Trends illustrating this labour market segmentation are analysed in more detail in part 3 of the report.9 This finding emerges from empirical studies where differences across workers in age, tenure, education
level (also reflecting skills and human capital), industrial sector and size of the firm of employmentare controlled for. Therefore, the resulting hourly wage gap for non-standard workers does not dependon these factors.

8/6/2019 Lisbon TF Final Report
http://slidepdf.com/reader/full/lisbon-tf-final-report 19/82
19
Figure 2.1 – Net wage gaps for temporary workers (wage gap by employees working with
temporary contracts – percentage values estimated through a Mincerian wage equation on
net yearly wages)
-23.4-22.5
-7.4
-1.9
-16.7
-28-26.4
-16
-18.8
-8
-16.3
-1
-21-21.6
-37.6
-10.8
-4.5
-40
-35
-30
-25
-20
-15
-10
-5
0
AT BE CZ EE ES FR EL IE IT LT LU LV PL PT SE SI UK
Source: Franzini M. (2009), elaborations on EU-SILC 2006
2.2. Relative poverty risks differ markedly across Member States and have
increased or stagnated over the past two decades
2.2.1. Great variation is observed in relative poverty risks across the EU
The aggregate figure of 16% of the EU population at risk of poverty10 in 2007 hides
marked differences across Member States, ranging from 10-12% in the Czech Republic,the Netherlands, Slovakia, Sweden, Austria, Denmark, Slovenia and Hungary to 20-25%in Italy, Spain, Greece, Latvia, Bulgaria and Romania. However, being at -risk of povertyrelates to very different living standards across the EU, as illustrated by the largedifferences in the levels of poverty thresholds apparent in figure 2.2 (right axis). Evenwhen corrected for differences in the cost of living, poverty thresholds are four to fivetimes higher in the two countries (UK and Austria) at the top of the ranking afterLuxembourg (which is clearly an outlier) than in the two countries at the bottom(Romania and Bulgaria). Poverty thresholds are generally significantly lower in easternMember States.
10 We refer to the EU-agreed definition of relative poverty, based on the threshold of 60% of national
median equivalised income, whenever not differently specified. It has to be noted that the definitioncurrently used for income excludes non-monetary income components, such as imputed rents, thevalue of goods produced for own consumption, and non-cash employee income. This definition isunder review by Eurostat and the Indicator's Sub-Group of the Social Protection Committee, based onnew information transmitted by Member States in 2009.

8/6/2019 Lisbon TF Final Report
http://slidepdf.com/reader/full/lisbon-tf-final-report 20/82
20
Figure 2.2 – At-risk-of-poverty rates and thresholds in PPS (60% of median equivalised
household disposable income; thresholds referred to single households), EU 27
0
5
10
15
20
25
30
EU
27
EU
15
NMS
10
CZ NL SE SK AT DK HU SI FI FR LU MT BE DE CY PL IE PT EE LT UK EL ES IT LV BG RO
% o f t o t a l p o p u l a t i o n
0
3000
6000
9000
12000
15000
18000
I n P u r c h a s i n g P o w e r S t a n d a r d
At-risk-of-poverty rate (left axis)
Value of thresholds for a single household (right axis)
Source: EU-SILC(2007)
2.2.2. Relative poverty risks have not been reduced in the last decade
Relative poverty risks have increased or stagnated in most EU countries between themid-1980s and the mid-2000s based on OECD data (Figure 2.3).11 The largest increasesare observed in Ireland, Germany, the Netherlands and Austria, and the largest decreasein Belgium.12 The only other countries where relative poverty decreased over this time
interval are France, Greece, Denmark, Spain and Portugal
13
. The disaggregation of thedata for the two decades, mid-1980s to mid-1990s and mid-1990s to mid-2000s, showsthat relative poverty risks increased in most Member States in the first decade (the largestincreases were in Italy, the Netherlands14 and the UK, and the largest decreases inBelgium and Spain). In the majority of countries poverty risks increased in the seconddecade as well (marked increases are reported for Ireland15, Luxembourg, Germany andFinland, while the largest decrease is displayed by Italy, though national evidencesuggests that poverty rates stabilised in the period16). Concerning countries that are notcovered in this analysis, paragraph 2.3.1 comments on very recent trends in the new
11 The definition of relative poverty used by the OECD is based on the threshold of 50% of nationalmedian equivalised income. Conclusions on poverty trends do not differ much from those that wouldbe drawn for the 60% threshold given that the two measures of relative poverty tend to move in thesame direction (OECD, 2008).
12 Data for Belgium in 1983 and 1995 are based on fiscal data and are not strictly comparable with thosefor later years. First, the unit of analysis is that of households filling a tax declaration. Second, themethod used to integrate information on households who do not fill a tax declaration differs in the twoyears. Alternative estimates based on household surveys suggest broad stability of the povertyheadcount in the late 1980s and a slight increase in the first half of the 1990s.
13 See also reference to national data in country profiles in section 2.514 Link to contrasting national evidence in the country profile in section 2.515 More recent national evidence in the country profile in section 2.516 Link to contrasting national evidence in the country profile in section 2.5

8/6/2019 Lisbon TF Final Report
http://slidepdf.com/reader/full/lisbon-tf-final-report 21/82
21
Member States based on EU SILC, and longer-term trends are discussed in the countryprofile of Poland.
Figure 2.3 – Trends in poverty headcounts (point changes in income poverty rate at 50%
median level over different time periods)
(i) Mid-1980s to mid-1990s (ii) Mid-1990s to mid-2000s
-4 -3 -2 -1 0 1 2 3 4 5
AT
BE
CZ
DK
FI
FR
DE
EL
HU
IE
IT
LU
NL
PT
ES
SE
UK
-4 -3 -2 -1 0 1 2 3 4 5
AT
BE
CZ
DK
FI
FR
DE
EL
HU
IE
IT
LU
NL
PT
ES
SE
UK
Source: OECD 2008
2.2.3. Poverty risks have shifted away from the elderly towards younger people, and
have generally increased for the working age population
OECD data (with relative poverty defined according to the 50% threshold) show thatchild poverty remained stable or increased in most EU countries from the mid-1990s to
the mid-2000s. The largest increases are recorded for Austria, Germany and Luxembourgeven if in relation to EU 27 they remain on a relatively low level. With regard to theelderly, poverty risks generally decreased between the mid-1990s and the mid-2000s (theonly exceptions to this are Ireland, where the increase was particularly large17, Finland,Sweden18 and the Netherlands), though they remain at relatively high levels in a fewMember States. Thus, the general long-term trend is a significant shift in poverty risksaway from the elderly and towards younger people (OECD, 2008). Indeed, child povertyin particular has been identified as a matter of concern across EU countries. The labourmarket integration of parents, adequate income support and effective access to child carewere highlighted as key determinants of child poverty in the SPC report adopted in
January 2008
19
).2.3. Living standards vary greatly across the EU despite improvements observed
in high growth countries
2.3.1. Living standards vary greatly across the EU
Living standards vary greatly across the EU as illustrated by the large differences in thelevels of poverty thresholds apparent in figure 2.4. Material deprivation rates
17
More recent and contrasting trends are available in Ireland's country story in section 2.518 For Sweden the at-risk-of-poverty rate does not take account of the effects of the housing supplement forpensioners as a targeted scheme to reduce poverty.
19 http://ec.europa.eu/employment_social/spsi/docs/social_inclusion/2008/child_poverty_en.pdf

8/6/2019 Lisbon TF Final Report
http://slidepdf.com/reader/full/lisbon-tf-final-report 22/82
22
complement this picture by providing an estimate of the proportion of people whoseliving conditions are severely affected by a lack of resources. The material deprivationrate provides a headcount of the number of people who cannot afford to pay their rent,mortgage or utility bills, keep their home adequately warm, face unexpected expenses,eat meat or proteins regularly, go on holiday, or cannot afford to buy a television, afridge, a car or a telephone20.
17% of Europeans live in these difficult conditions. However, in Bulgaria, Hungary,Latvia, Lithuania, Poland or Romania more than 35% of people are affected. Thematerial deprivation rate reflects better the “geography” of poverty across the EU thanthe at-risk-of poverty rate which defines poverty in relation to a national threshold. Thisis because it depends as much on the level of development of the country as on the socialpolicies that are supposed to redistribute the benefits of growth. These disparities inmaterial deprivation rates reflect the large differences in GDP per capita that remainbetween EU countries. This emphasizes that the fight against poverty in the EU willbenefit from a greater economic, social and territorial cohesion within the EU. It isthereby important to anchor social inclusion policies in all the policies that contribute to
these greater cohesion objectives.Figure 2.4: At-risk-of poverty and material deprivation rates (%) and poverty thresholds
(€-PPS per year for a single household); 2007
0
10
20
30
40
50
60
70
80
EU
27
EU
15
NMS
10
LU NL SE DK FI AT IE UK ES FR BE DE MT SI EE IT CZ PT EL SK LT CY HU PL LV RO BG
%
o f t o t a l p o p
u l a t i o n
0
3000
6000
9000
12000
15000
18000
I n P u r c h a s i n g P o w e r S t a n d a r d s
At-risk-of-poverty rate (left axis)
Material deprivation rate (left axis)
Value of thresholds for a single household (right axis)
Source: EU-SILC (2007)
Figure 2.5 below also illustrates how the at-risk of poverty rate and of materialdeprivation measures complement each other. It shows that, over the last 3 years EU15countries, both the risk of poverty and material deprivation remained stable. On thecontrary, in the New Member States material deprivation rates have declinedsignificantly, as well as poverty rates, even though to a lesser extent. These are verypreliminary trends, but they are consistent with the analysis of anchored poverty ratespresented in the next paragraph which shows that, high growth can indeed improve livingstandards, including of the poor.
20 The indicator recently adopted by the social protection committee measures the percentage of thepopulation that cannot afford at least 3 of the 9 items quoted above.

8/6/2019 Lisbon TF Final Report
http://slidepdf.com/reader/full/lisbon-tf-final-report 23/82
23
Figure 2.5: Trends in poverty rates and material deprivation, Total population - 2005-2007
0
5
10
15
20
25
30
35
40
45
50
2005 2006 2007 2005 2006 2007
Risk of poverty Material Deprivation
EU27 EU15 NMS10
Source: EU-SILC (2007, 2006, 2005);
2.3.2. In recent years, economic growth has helped raising significantly the living
standards of the poor only in a few countries with high growth rates.
Between 2005 and 2007 nearly all countries with high average growth rates per year(above 5%) showed wide declines in the anchored at-risk-of-poverty rate calculated inreference to the 2005 threshold (See figure 2.6)21. This indicator asks how many people
in time t are below the at risk poverty threshold calculated in t-n22
. If the at risk of poverty rate does not improve against contemporary poverty threshold it is still importantto ask if poor households are enjoying increases in real income that raises their commandover resources compared with the real incomes received in previous years. In general, theconclusion, based on this limited evidence, is that clear-cut results on the nexus growth-living conditions of the poor only emerge for the group of countries with very highgrowth rates (above 5%), which indeed appear to have helped the poor. For countriesexperiencing average growth rates below 5% (apart for the two exceptions mentionedabove), the evidence on trends in anchored at-risk-of-poverty rates is mixed but changestend to be small in size.
21 The most relevant exception to this is Cyprus (the anchored at-risk-of-poverty rate decreased here by 6points between 2005 and 2007), which anyway also recorded a rather high growth rate, above 4%.
Malta also reported a significant decrease in anchored poverty (by 4 points) in presence of a lower butstill good growth rate of 2.6%
22 The "anchored poverty rate" is defined as the risk of poverty associated with a 60% threshold fixed at apoint in time, and adjusted for inflation

8/6/2019 Lisbon TF Final Report
http://slidepdf.com/reader/full/lisbon-tf-final-report 24/82

8/6/2019 Lisbon TF Final Report
http://slidepdf.com/reader/full/lisbon-tf-final-report 25/82
25
Figure 2.7 – Income inequality (Gini coefficient) before and after taxes and benefits: 2001,
2003, 200526
Source: EUR OMOD
0.20
0.25
0.30
0.35
0.40
0.45
0.50
0.55
0.60
A T DK SE LU BE NL FR DE FI SI HU ES UK IE EL EE PL IT PT
G i n i c o e f f i c i e n t
Original income Original income and public pensions
Gross income Disposable income
Source: Paulus, Figari and Sutherland (2008)
2.4.2. ..as well as the way and the extent to which it redistributes resources to the poor
Significant differences across Member States arise in the way and the extent to whichtaxes and benefits redistribute resources to the lowest income decile, as shown byEUROMOD estimates on the bottom decile group’s income composition for different EUcountries presented in Figure 2.8. Large differences between countries are observed in
the percentage of disposable income accounted for by market income. In terms of netsupport to low-income households large cross-country differences are observed. Net cashsupport accounts for 87% and 81% of the poorest decile group’s disposable income inIreland and the UK respectively, while it only accounts for 29% in Italy and Hungary and20% in Poland (where market income dominates as a source of disposable income).
26 Tax-benefit policy rules refer to 2001 for DK, FR, IE, IT, SE; to 2003 for BE, DE, LU, NL, AT, PT, FI,UK; to 2005 for EE, EL, ES, HU, PL, SI.

8/6/2019 Lisbon TF Final Report
http://slidepdf.com/reader/full/lisbon-tf-final-report 26/82
26
Figure 2.8 – Household income composition, bottom decile group out of whole population:
2001, 2003, 200527
Source: EUROMOD
-60
-40
-20
0
20
40
60
80
100
120
140
160
180
200
BE DK DE EE EL ES FR IE IT LU HU NL AT PL PT SI FI SE UK
% o f d i s p o s a b l e i n c o m
market income personal taxes
social insurance contributions public pensions
means-tes ted benef its non means-tes ted benef its
Source: Paulus, Figari and Sutherland (2008)
The analysis of the impact of social transfers on relative poverty risks (based on EU-SILC 2007) reveals that social transfers (excluding public pensions
28) reduce the povertyrisk by 36% on average in the EU-27 (Figure 2.9)29 The poverty-reducing effects of social transfers other than pensions are stronger in Hungary, the Nordic countries, theNetherlands, Austria, France and the Czech Republic, where poverty drops by 50% ormore thanks to public support (reaching the peak of more than 60% for Sweden). The
weakest effects (drops by 19% or less) are reported for Bulgaria, Greece, Spain, Italy andRomania.
27 Tax-benefit policy rules refer to 2001 for DK, FR, IE, IT, SE; to 2003 for BE, DE, LU, NL, AT, PT, FI,UK; to 2005 for EE, EL, ES, HU, PL, SI.
28 For the purpose of this analysis, pensions are considered primary income since their role is not only toredistribute resources across income groups but also, and primarily, over the life-cycle of individualsand/or across generations.
29 The indicator for the poverty risk before social transfers must be interpreted with caution for a numberof reasons. First, no account is taken of other measures that, like social cash transfers, can have the
effect of raising the disposable incomes of households and individuals, namely transfers in kind, taxcredits and tax allowances. Second, the pre-transfer poverty risk is compared to the post-transfer riskwith all other things being equal — namely, assuming unchanged household and labour marketstructures, thus disregarding any possible behavioural changes that the absence of social transfersmight entail..

8/6/2019 Lisbon TF Final Report
http://slidepdf.com/reader/full/lisbon-tf-final-report 27/82
27
Figure 2.9 – Impact of social transfers (excluding pensions) on the at-risk-of-poverty rate
for the total population (percentage reduction), 2007
0
10
20
30
40
50
60
70
EU25EU27BG ES EL IT RO LV CY EE PT LT MT UK PL SK LU DE IE BE SI FR CZ AT NL FI DK HU SE
Source: EU-SILC 2007
2.5. Lessons learnt from the diversity of experiences Member States went through
over the past 20 years and in previous recessions
A number of country's stories help illustrate the variety and complexity of the interaction
between growth, jobs and social inclusion and social protection Belgium: Over three decades, the maturing of social protection helped reducing
inequalities, while recent trends in labour market and household structures are
challenging the effectiveness of the social security system
In the decade following the oil crisis, both income inequalities and at-risk-of-poverty rates decreased, along side with sharply rising unemployment and budgetdeficits and a slight fall in overall (equivalent) disposable income. This is partlyexplained by an important increase in female labour market participation, dualearner households, and greater reliance on unemployment benefits (when one of two earners became unemployed) and the maturing of pension systems, whichhelped reducing elderly poverty. Social protection expenditures grewsignificantly from 18% to 29% of GDP. From mid-80s to early 90s, botheconomic growth and unemployment rates were relatively high. While marketinequalities started to increase and household income inequalities and at-risk-of-poverty rates stabilised, all income groups experienced a significant increase inhousehold disposable income. Increase in social security expenditures wasslowed down by more selective policies, better targeted to low incomehouseholds. The level of social expenditure decreases from 29% of GDP to 27%between 1985 and 1992. From 1992 to 1997, the average increase in householddisposable income is low and the position of lower income households hardly
improves. Economic growth is less favourable and unemployment remains at ahigh level. Earnings and household income inequalities start rising again, as wellas poverty rates. Because the limits to selectivity are reached the control of socialexpenditure equally affected all beneficiaries, and benefit levels were unable to

8/6/2019 Lisbon TF Final Report
http://slidepdf.com/reader/full/lisbon-tf-final-report 28/82
28
keep up with the general increase in standard of living. This was compounded bythe increase in one earner families (incl. lone parents) among benefit recipients,which in turn led to a slowly growing gap between families with a labour incomeand families dependent solely on social transfers, often depending on oneallowance only.
Denmark: Prolonged economic and employment growth since the mid 1990s led to very high employment rates; relative poverty increased from a low level
The recession of the beginning of the 1990s was followed in Denmark by aprolonged economic growth with annual real growth rate above 2 % until 2000.During the last decade, the economic growth was initially more moderate but stillpositive (until 2003) and recovered in 2004 and 2005. The periods of relativehigh growth corresponded to periods of low unemployment. The gini coefficienthas however been relatively stable during the past 20 years, with a 3 percent pointrise since mid 1990´s. The continuous growth in disposable income has beenrelatively fairly distributed, both between income groups and age groups. Thehigh and rising employment rate is partly due to dedicated effort to strengtheningthe incentives for each individual person to work and increasing theemployability of those at the margin of the labour market, resulting in the highestactivity rate in the EU. However, the share of the population belonging to thelow-income group is increasing since last decade, although starting from a lowlevel reached in the period early 1980s up to the mid-1990s. The higher at-risk-of-poverty rate can be partly explained also by the increase in real terms of thelow-income threshold and it has to be noted that students alone account for 1/3 of the low-income group.
Germany: Lasting recession lead to downward mobility until the mid 2000, but first signs of a reduction in inequalities followed the recovery in 2006
Unlike most other EU member states Germany suffered a serious economicdownturn during the first half of this decade with a subsequent increase inunemployment. Beside the recession, changes in household structures, notably anincrease in singles and lone parents, contributed to an increase in incomedistribution and in the at-risk-of-poverty rate. Since the mid 1990s Germanyexperienced an increase in the numbers of low paid workers, a trend that wasaccentuated because of the economic crisis as the proportion of middle incomeearners decreased significantly. Correspondingly, the proportion of the population
at the margins of the income distribution increased as well, mainly due to theincreases in the number of unemployed persons and welfare recipients, thus, thedownward mobility was more marked than the upward mobility in higher incomegroups. The following economic recovery led to a reduction of inequality and theat-risk-of-poverty rate in 2006, and important reason being the decline inunemployment and the reduction in market income inequality.
Greece: Dynamic growth since the mid-90s helped raising living standards, but
high levels inequalities remain partly due to the low poverty reduction impact of
social protection
GDP growth accelerated after 1996, compared to the relatively low economicgrowth of the period 1980-1995. Unemployment rates continuously increasedfrom 7% in 1990 to 12% in 2000, before gradually decreasing down to 7.6% in2008 just before the crisis. Employment rates increased from 56.6% in 2000 to

8/6/2019 Lisbon TF Final Report
http://slidepdf.com/reader/full/lisbon-tf-final-report 29/82
29
61.4% in 2007, but the female employment rate lagged behind the EU average(47.9 against 58.3%). GDP per head between Greece and the average of EU-countries has been continuously converging since 1995 and has almost reachedthe average (EU-27) in 2008 (from 83 in 1995, base 100 EU-27, to 97 in 2008). Itshould also be underlined, that absolute poverty in terms of real purchase powerstarted to decrease after 1994 following a long period of stability (1982-1994).However, Greece shows relatively high levels of inequality. The Gini coefficientremains stable at around 34 and the indicator S80/S20 has slightly increased from5.3 in 1995, to 6.1 in 2006. Relative poverty remains higher than EU averageeven if it has decreased from 23-22% in 1995-1996 to 20-21% in 2005-2006.Over the period, the relative income of middle-class families has been improved.This was partly due to the fact that high economic growth permitted to increasegradually expenditure on social protection benefits (from 21.8% of the GDP in1996 to 24.2% in 2006) in a social security system dominated by the universalcoverage approach. As a result, the vertical redistributive role of the socialsecurity system is rather limited, as illustrated by the very low poverty reduction
impact of social transfers other than pensions. Ireland: Strong and sustained growth, tax reforms and increased labour market
participation in households helped raising household incomes overall, but to a
lesser extent for those below the poverty line.
Ireland experienced a period of strong economic growth from the early 1990’s,which moved through a number of phases: In the late 1980s the economygradually recovered from a deep and prolonged recession and real incomesdeclined for a variety of reasons. The unemployment rate increased from 7% in1980 to 17% in 1987. It was followed by a strong period of economic growth, butwith relatively subdued growth in employment as emigration was at a high levelfor most of the period and tax reforms were limited. Household incomesincreased more quickly than welfare rates, which resulted in a slight increase innumbers falling below the risk of poverty line from 1987-1994. From the mid1990s, tax reforms were concentrated at lower and middle income levels, whichreduced labour costs to companies and increased net household incomes.Household incomes increased at a much higher rate than earnings, which wasdriven by tax reforms affecting median earners and increased number of 2 ormore earners households generally. Given that most of these changes impacted onhouseholds above the risk of poverty line, the risk of poverty increased from15.6% to 21.9% despite strong social welfare increases. Consistent and anchored
poverty measures decreased over the period, reflecting real income increases forpeople at risk of poverty. During the beginning of this decade, employment rateslevelled out. The rate of growth in household incomes fell closer to the rate of earnings growth. Social welfare rates increased at roughly the same level as 1994-2001, but reduced the risk of poverty from 19.7% in 2003 to 16.5% in 200730,with particularly strong decreases for 65+ year olds who tend to be welfaredependent with incomes close to the risk of poverty line.
France: Long-term trend of reduction of inequalities and poverty, despite an
increase in market income inequalities due to segmentation of the labour market
and the polarisation of jobs between job-rich and job poor households.
30 Just using SILC data, as there appears to have been a discontinuity between LIIS/ECHP and SILC

8/6/2019 Lisbon TF Final Report
http://slidepdf.com/reader/full/lisbon-tf-final-report 30/82
30
The long term trend of reduction in inequalities and poverty which had begun inthe seventies has decelerated in the nineties. While the relative situation of old-age pensioners continued to improve, the relative situation of workers andunemployed people has weakened. However, the poverty rate with a thresholdcalculated only among the active population is nearly stable since the 70’s. Theoverall dispersion of wages has not changed much in the last decades (the inter-decile ratio of yearly net wages was 3.1 in 1995 and 3 in 2004). The lowest wagesgrew slightly more rapidly than the average reflecting increases in the legalminimum wage while the very high wages grew very strongly. However, whenmeasuring the income on a yearly basis, market income inequalities are muchwider (D9/D1 = 13) than for full-time wages. The main driver of inequality is theemployment duration over the year. People at the bottom of the annual earningsdistribution work, on average, for approximately 13 weeks during the year,against as compared with 51 weeks for those in the top decile. Part-time workalso plays a role since people in the lowest decile worked on average 22 hours aweek when people in the top decile worked 38 hours a week. The proportion of
low paid workers (below 1,1 minimum wage) also increased from 13% in theearly 80’s to 18,4% in the mid-nineties and then declined to 16.5% in the early2000s. This evolution was mainly due to the rise of part time work (Atkinson andalii, 2001).31 Furthermore, the polarisation of jobs between households alsoincreased since the early 80s: the proportion of couples with two jobs increasedfrom 63% in 1982 to 67% in 1999 while the proportion of couples without any
jobs increased from 7% to 11%.
The Netherlands: Activation has partly mitigated the impact of increased wage
dispersion and lower redistributive impact of the tax-benefit system
The low economic growth in the beginning of the 1990s had a relatively limitedeffect on the unemployment rate, increasing a couple of percentage points toaround 6.5% in the middle of the 1990s. It then kept falling until the beginning of this decade at the same time as the economy recovered. Income inequality hasincreased since the beginning of the 1980 and the strongest increase occurred in1990 partly as a consequence of tax reductions. However, overall average incomeinequality in the Netherlands has been relatively stable. This is explained by acombined effect of on the one hand increased wage dispersion at the lower end of the labour market and reforms in the social security system (leading to increasedinequality) to increase incentives to enter the labour market and on the other handthe related decrease in benefit dependency (leading to decrease in inequality).
Relative poverty decreased from 1995 until 2002 after which it increased toalmost 9 % in 2005. Based on national indicators, poverty has been decreasingOverall, the development of poverty appears to have been linked to the economicdevelopments over this period.
Austria: Effective public transfers and activation have helped reducing poverty
by mitigating rising market income inequalities due to increasing part-time and
temporary work, widening hourly wage dispersion and rising unemployment.
Since the mid-80s, Austria has experienced growth cycles with longer periods of faster GDP growth (at about 3%) than periods of slower growth (at about 1%). Atthe same time, both employment and unemployment rates have steadily
31 Atkinson, A., Glaude, M., Olier, L., Piketty, T., (2001), Inégalités économiques, Conseil d’Analysed’Économique, rapport n°33, ,

8/6/2019 Lisbon TF Final Report
http://slidepdf.com/reader/full/lisbon-tf-final-report 31/82
31
increased. The volume of hours worked, however, has grown much slower thanthe number of people employed; there is an ever rising share of part timeemployees. This is due to a successful competition on export markets, toproductivity growth induced through investments and a better trained workforce,to the integration of migrant workers into the regular labour supply, to flexiblelabour market rules. Since the mid 90s both inequalities were reduced in Austriaand the slight changes in the composition of the population at risk of povertyhave not been accompanied by an increase in poverty rates. This trend resultsfrom a complex combination of factors. A number of developments in theAustrian economy may have contributed to increasing inequality amonghouseholds and raise poverty rates i) a sharp drop in the labour share in nationalincome, ii) to the widening of the distribution of hourly wages, iii) to an increaseof the ranks of people working part time or being employed as temporaryworkers, and iv) to the substantial rise in unemployment. However, growthoriented policies aiming at activating women and men of working age and raisingfuture employability, have helped reducing the poverty risk of the less
advantaged groups in society. Overall, public transfers (social, education, health,housing) have had the strongest impact in reducing inequality and poverty rates.It is by these means that changes in market incomes (pointing towards increasinginequality) have not been translated into a more unequal distribution of disposable household incomes.
Poland: Following the transition, economic expansion brought higher
inequalities, but improved the material situation of households.
Following the economic transformation in Poland, unemployment increasedsharply until 1994. With the exception of the beginning of the 2000s, since then
the proportion of people outside the labour market has constantly decreased,although in 2008 it is still above the EU average. As a consequence, the constantincrease of the poverty rate observed from the mid 1990s (up to 20.4% in 2003)came to an end in the last years. In 2008, 10,6% of total population was livingbelow the legal poverty line, defined as a monthly income of a householdqualifying the household to apply for a social benefit in cash in accordance withthe legislation in force. The economic expansion in Poland brought higherincome inequalities, especially above the median income. Different factors led toincreased inequality, including the education level, unemployment and differentsituation of urban vs. rural areas (larger cities correspond to higher averageincome level). However, improved material situation among households is one of
the reasons of a decrease in income inequalities observed since 2005.
Portugal: High and increasing activity rates combined with a gradual increase in
unemployment; high inequalities remain despite a recent decrease due to the
reinforcement of social transfers
The growth of the Portuguese economy in the second half of the 90s (4.1%annual growth average in the period 1996-2000) continued during the last decade,although in a more moderate way. This growth supported a growing activity ratereaching 74.2% in 2008 and which was due particularly to increased participationof women in the labour market, postponement of retirement age and migration
flows. During the same period, however, unemployment rate has progressivelyincreased, although from low levels (3.9% in 2000), and is now aligned to theEuropean average. The increase of unemployment concerned especially womenand younger active population (especially those aged 15-24). This situation

8/6/2019 Lisbon TF Final Report
http://slidepdf.com/reader/full/lisbon-tf-final-report 32/82
32
should be seen also in conjunction with persisting weaknesses in the Portuguesesociety owing to structural factors, such as the entrepreneurial structure and loweducational level of employed people (apart the effort that have been made in thelast years for the qualification of adult people with some results). In the period of economic growth, disposable incomes have been rising since 1995, andparticularly between 1998 and 200132. However, despite the improvements in
the last years, inequality remains a main issue in Portugal, mainly due to apersisting disparity in terms of wages and salaries. In 2008 the net equivalentmonetary income of the 20% of population with the highest income was 6.1 timeshigher than that of the 20% of population with the lowest income. The povertyrate has slightly decreased from 21% in 2000 to 18% in 2008, notably due to therole played by social transfers. The risk of poverty remains high for vulnerablegroups (especially unemployed, young and women) as well as for the employed(12% in 2008).
Finland: Reforms of the tax and benefits systems have lead to a slow increase in
inequalities since the mid-90s.
During the recession in the beginning of 1990`s the disposable income of allhouseholds decreased remarkably. The decrease was strongest in 1992 and theincome fell by 4-5 %. In 1995 incomes turned to an increase. Incomes started toincrease again in 1995, and the increase was strongest in 1997-1999 especially inthe top quintiles. At the beginning of 2000`s increase of income of the middlequintiles was more rapid than in the top quintiles. In the last year the top quintileshas increased their income more rapid then the others. As a result, the incomeshare of the lowest quintiles has decreased. Inequality measured by Ginicoefficient was quite stable in 1980`s until mid 1990`s. Since then the income
distribution has been less equal. The main reason for this is that the role of taxation in minimizing income differences has weakened. At the same time theshare of cash benefits of households´ income have decreased and the role of market income has increased. One reason for the gains of the top quintiles is thatthe share of capital income in these quintiles has increased. Capital income is lesstaxed than income from work.
Sweden: Stark recession lead to long-term exclusion from the labour market and
polarisation of incomes
The economic recession in the Swedish economy in the beginning of the 1990s
resulted in a dramatic increase in unemployment, although from a very low level,as well as an increase in the proportion of people outside the labour force. As aconsequence, household disposable income fell for all groups in the populationand despite the following recovery in the economy income did not recover untilthe beginning of the 2000s. In parallel, there was an increase in income inequalitywhich peaked in 2007, after a slight decrease in the beginning of this decade. Theincrease in the overall inequality was mainly driven by changes at the top andbottom of the income distribution, driven mainly by those in gainful employmentand those dependent on public benefits respectively. Although relative povertydecreased slightly during the first years of the recession, it has increased
32 This trend refers to Gross disposable income (including for households). The trend for households is thesame.

8/6/2019 Lisbon TF Final Report
http://slidepdf.com/reader/full/lisbon-tf-final-report 33/82
33
continuously since the mid 1990s. The increase has been larger for the non-working population and those dependent on public transfers, notably singleparents and elderly and youth in single household.
The United Kingdom: Improved redistribution through the tax-benefit systems
has partly mitigated the sharp polarisation in original incomes (earnings from
work)
The economic recession in the UK economy in the beginning of the 1990sresulted in a sharp increase in unemployment with a peak in 1993. This wasfollowed by a steady fall in unemployment down to around 5% in the 2000 whereit stayed until the second half of 2008. Income inequality rose during the 1980sbut from the mid-1990s and onwards inequality has been fairly stable, thoughthere has been a small increase in overall inequality mainly driven by changes atthe very top and bottom of the income distribution. Several factors contributed tothe sharp rise in poverty in the early 1990s, including higher rates of worklesshouseholds, widening earnings disparities and the impact of government policies.
Although government intervention through taxes and benefits plays an importantrole in determining the distribution of household income, over the last decade'schanges in income distribution have been caused predominantly by changes in thedistribution of original income rather than by changes in the impact of taxes andbenefits. However, estimates of the importance of the tax-benefit system inreducing poverty indicates that if the 1996/97 tax-benefit system had remained inplace, the poverty rate would have been larger. The effect was especiallyimportant in reducing poverty among children living in lone-parent families,families with children and pensioners. This would imply that, since the povertyrate actually fell during late 1990s, other factors such as demographicdevelopments and changes in household formation, would have led to an increasein poverty without the tax-benefit reforms.
2.6. Concluding remarks
Over the past decade, economic and employment growth has in general improved
overall living standards and many governments have been able to devote more
resources to social policy intervention. However, despite the clear redistributive
effect of social protection, inequalities have often increased and poverty and social
exclusion remain a major issue in most EU countries, although with substantial
differences across Europe.
Income inequalities have increased in most EU countries since the mid 80s, beforestabilising in the last 10 years. In most countries, top incomes grew relatively faster thanmiddle incomes. In some countries, low incomes caught up with median incomes, whilein other countries inequalities also widened at the bottom of the distribution.
A major factor behind this is the increase in earnings inequality among full-time workersfurther strengthened by the increase of involuntary part-time and temporary contracts.Labour market segmentation is a key determinant of widened earnings inequality bothbecause non-standard workers tend to work fewer hours per year and because they areoften paid less per hour after controlling for differences in education and experience.
Relative poverty risks increased in most Member States between the mid-1980s and themid-1990s and in most cases they either increased or stagnated between the mid-1990sand the mid-2000s. There was a shift in poverty risks from the elderly towards youngerpeople. In particular, child poverty remained stable or increased in most EU countries.

8/6/2019 Lisbon TF Final Report
http://slidepdf.com/reader/full/lisbon-tf-final-report 34/82
34
In recent years, it is only in countries with very high growth (above 5%) that significantimprovements in the standards of living of the poor were observed. In general, economicgrowth has made it possible to "erode" severe deprivation, particularly (though not only)in new Member States, but relative poverty has not declined and has even increased insome countries that were traditionally "good performers".
The design of the tax-benefit system is crucial in determining the way and the extent towhich it affects income inequalities and redistributes resources to the poor. Importantfeatures include the progressivity of taxes and benefits and the degree of targeting andconditionality of benefits that can create disincentive effects, if badly designed. Furtherwork would be needed to better understand the determinants of the efficiency andeffectiveness of tax-benefit systems.

8/6/2019 Lisbon TF Final Report
http://slidepdf.com/reader/full/lisbon-tf-final-report 35/82
35
3. JOB CREATION AND SOCIAL INCLUSION
Significant progress has been made in raising employment rates across Europe, helpingto improve gender equality and also in reversing negative trends such as the decline inparticipation of older workers. The experience of this decade has confirmed that
improving access to good quality employment can help reduce the risk of poverty .Indeed, between 2000 and 2007, unemployment rates were significantly reduced in theEU as a whole from 8.6% in 2000 to 7.1% in 2007. This trend was observed in themajority of countries except in BE, LU, HU, the NL and PT (LU, NL and PT already hadvery low rates at the start of the period). The increased participation of women as secondearners has helped improving the income of many households.
However, at the outset of the crisis, about one third of the working age population in theEU was out of work (unemployed or inactive). Furthermore, evidence shows that thesignificant increases in employment rates observed in all EU countries before the crisiscoexisted alongside significant numbers of workers in precarious jobs, working poor and
jobless households. These trends result from a complex combination of factors. Under-employment and precarious forms of contracts mitigate the positive impact of includingmore people in the labour market. Increases in the number of single and lone parenthouseholds also play a role.
3.1. The diagnosis: despite undeniable progress, more needs to be done to ensure
that labour markets are truly inclusive
The Task Force report does not aim at explaining the complex mechanisms by whichdevelopments on the labour market impact on income inequalities overall. Whileacknowledging the overall benefits of including more people on the labour market, thereport highlights a number of key trends showing that the EU job strategy did not alwaysreach the most excluded and that the jobs created did not always provide for decentliving standards. It illustrates that more needs to be done to ensure that EU labourmarkets are truly inclusive and lead to greater social cohesion.
3.1.1. Having a job remains the best safeguard against poverty and exclusion…
In the EU as a whole, the risk of poverty faced by working age adults without work 33 ismore than 3 times higher than those in work (27% against 8%). This risk increases to43% for the unemployed. This indicates that a job remains the best safeguard against therisk of poverty. It also indicates that the level of protection of the unemployed varies alot across countries. The at-risk-of-poverty rate for the unemployed is particularly high
(above 50%) in Bulgaria, Germany, Estonia, Latvia, Lithuania, and the United Kingdom.Cross-country variations can be explained by the relative generosity of the benefits butalso by the categories of workers that are unemployed, as well as the type of householdsthey live in.
33 People out of work include the inactive (including the disabled, the retired, people with familyresponsibilities who are not seeking for work, etc) and the unemployed.

8/6/2019 Lisbon TF Final Report
http://slidepdf.com/reader/full/lisbon-tf-final-report 36/82
36
Figure 3.1: At-risk of poverty rate of the working age population by employment status:
employed, not-employed (among whom the unemployed). 2007
0
10
20
30
40
50
60
70
eu27cz be dk mt nl si sk fi bg ie fr cy hu at de se ee lt uk lu pt it lv es pl el ro
% o f c o n c e r n e d p o p u l a t i o n
Employed Not employed Unemployed
Source: EU-SILC 2007
3.1.2. …but a job is no guarantee against the risk of poverty and the working poor
represent a significant share of those at-risk of poverty…
In 2007, 8% of the people in employment were living under the poverty threshold. Theworking poor also represent more than 1/3 of the people at-risk-of poverty in age of
working. Finally, in-work poverty is an important determinant of child poverty in manycountries, as was highlighted in the SPC report on child poverty and well-being. In-workpoverty is linked to the employment situation of the individuals such as low pay, lowskills, precarious employment and involuntary part-time work. Importantly, situations of poverty are also linked to the type of household in which people live. In-work poverty isoften related to low work intensity, i.e. situations where there are too few adults workingin the household, or not working enough to make a living (too few hours or only part of the year). Single and lone parent households, as well as one-earner families face thehighest risks of poverty (See also paragraph 3.2.2)
3.1.3. … and the job strategy did not always reach the most excluded
The direst situations concern those households in which nobody works and who thereforehave to rely on social benefits. In 2007 in the EU27, 9.3% of adults in age of working(and not students) were living in jobless households against 10.2% in 2001. In 2007,9.4% of children lived in jobless households, against 9.5% 2001 showing that the slightimprovements recorded for adults have not reached families with children to the sameextent.. The crisis is likely to increase the number of families having to rely entirely onsocial benefits. (See also point 3.3.2)

8/6/2019 Lisbon TF Final Report
http://slidepdf.com/reader/full/lisbon-tf-final-report 37/82
37
Figure 3.2: EU - Employment and unemployment rates and shares of children and adults
(aged 18-59 and not students) living in jobless households; 2001-07 — %
6
8
10
12
14
2001 2002 2003 2004 2005 2006 2007
58
60
62
64
66
Adults (18-59, not students) living in jobless households (left axis)
Children living in jobless households (left axis)
Unemployment rate (left axis)
Employment rates (right axis)
Source: Labour Force Survey
3.2. Is labour market inclusion guaranteeing income adequacy and social
inclusion?
Individual yearly earnings are a key component of household income, and as highlightedin part 2 of this report, a major factor behind increased inequalities is the increase inearnings inequality among full-time workers further strengthened by the development of involuntary part-time and temporary contracts. The report therefore reviews first thepotential impact of recent labour market developments on individual yearly earnings,with a focus on the lower end of the earning distribution. It then reviews how individualearnings interact with the evolution of household structures in order to illustrate theircontribution to disposable income inequalities.
3.2.1. Increased labour market segmentation: Temporary work, part-time work and
sometimes stagnating wages have increased the number of individuals with low
earnings
This chapter reviews structural features of the labour market such as low wages, genderpay gap, female employment patterns, precarious employment, under-employment andpatterns of self-employment that can lead to lower individual earnings. As earningsfrom work are defined as the total income individuals derive from work over a wholeyear, it depends both on the level of their wage and on the amount of work they doduring a whole year. We will not review here the micro-economic determinants thatexplain the increased dispersion of hourly-earnings observed over the last decade, ashighlighted in part 2 of the report34.
34 An extensive review of the earnings dispersion across the EU is available in Employment in Europe
Report 2005 - Chapter 4: Earnings disparities and determinants of the earnings distribution in the EU:http://ec.europa.eu/social/BlobServlet?docId=2281&langId=en. It focuses on the micro-economicdeterminants that impact on hourly earning disparities such as individual characteristics of workers(age, gender, skill), companies specificities, economic integration, and the institutional and bargainingframework.

8/6/2019 Lisbon TF Final Report
http://slidepdf.com/reader/full/lisbon-tf-final-report 38/82
38
According to a the 2008/09 Global Wage Report of the ILO35, wage inequalities have
increased since the mid 1990's in most of the EU countries reviewed with the notableexception of France and Austria. However, the report distinguishes between differentpatterns of evolution depending on whether inequalities widened at the top or at thebottom of the wage distribution. In most of the EU countries for which data areavailable36, increases in wage inequalities have been mainly driven by the upper end of the wage distribution (DK, IE, NL, FI and the UK). In France, wage inequalities havebeen reduced. However, evidence shows that in Germany, Poland, and the Czech
Republic wage inequalities increased according to a "collapsing bottom" scenario.
In these countries, inequalities between the median and low wage earners have increasedwhile inequalities between top and median earners remained fairly stable. In Germanyfor instance, the D5/D1 ratio increased from 1.60 in the period 1995/2000 to 1.76 in theperiod 2001/2007, while the D9/D5 ratio decreased from 1.83 to 1.79.
As indicated above, the level of yearly earnings also depends on the quantity of workcarried out over a whole year. In particular, working part-time has obviously a direct
impact on the level of yearly earnings at the individual level. Temporary employment is also likely to impact on the total number of hours worked during the year, since it islikely to increase the overall number of out-of-work spells during a given year. Both
forms of employment have significantly increased since 2000. At the household levelboth forms of employment increase the risk of poverty significantly in comparison to thesituation of workers working full-time or employed on permanent contracts37. The risk of poverty of people working part-time is 11% against 7% for those working full-time, andthe risk-of poverty of people on temporary contracts is 13% against 5% for workersholding permanent contract. SILC results also show that this gap has increased over thelast three years.
The share of part-time work in total employment has increased overall from 15.8% in2000 to 17.6% in 2008, and from 28.7% to 30.6% for women. This increase concerns allcategories of workers, and especially women and the youth. Part-time work can of coursebe seen as a desirable development of the labour market as long as it responds to workerspreferences and desire to better reconcile work and family life (DK, LU, the NL, AT andthe UK). However, 21.6% of part-time work (or 4.2% of total number of employees) isinvoluntary in the EU, and can be considered as a form of under-employment. Thisphenomenon has increased overall (+ 4.4 percentage points since 2000), and for allcategories of workers. In particular, in 2008 involuntary part-time represented asignificant share of total female employment in Spain (8%), France and Germany (9%),Italy (10%) and Sweden (11%).
35 Global Wage Report 2008/09: Minimum wages and collective bargaining: Towards policy coherence;http://www.ilo.org/global/What_we_do/Publications/lang--en/docName--WCMS_100786/index.htm
36
Detailed data is available for 11 EU countries in the ILO report on page 96 (see above): CZ, DK, DE,IE, FR, HU, NL, PL, FI, SE, UK37 Indeed, the poverty risk of people working part-time or on temporary contracts is much lower than the
poverty risk of the unemployed (see Figure 3.1).

8/6/2019 Lisbon TF Final Report
http://slidepdf.com/reader/full/lisbon-tf-final-report 39/82
39
Figure 3.3: EU 27- Part-time employees as a percentage of the total number of employees
and share of part-time that is involuntary; by sex; 2008 (%)
0
10
20
30
40
50
60
70
80
EU27BG SK HU CZ EL LV EE LT CY PL SI RO PT MT ES FI IT FR LU IE BE AT DK UK DE SE NL
% o
f m e n / w o m e n e m p l o y e d
0
10
20
30
40
50
60
70
80
% o
f m e n / w o m e n w o r k i n g p a r t - t i m e
Women - Part-time share (left axis) Men - Part time share (left axis)
Women - involuntary part time (right axis) Men - involuntary part time (right axis)
Source: LFS 2008
Temporary employment represented 14% of total employment in 2008 in the EU27,and it has significantly increased since 2000 (12.2%). This increase concerned allcategories of workers, and especially the youth since in 2007, 40% of people aged 15-24were employed on a short term contract (against 35% in 2000). Temporary employmentexceeds 20% in PT (23%), PL (27%) and ES (29%), but concerns less than 5% of employees in the Baltic States, Romania, Bulgaria, Malta and Slovakia. As highlighted insection 2 of this report (point 2.1.2), the INEQ project also shows evidence of net andgross wage gaps between temporary workers and workers with permanent contracts.
Table 3.1: EU 27- Temporary employees as a percentage of the total number of employees
for a given sex and age group; 2000-2008 (%)
EU27 2000 2001 2002 2003 2004 2005 2006 2007 2008
Total 12.2 12.5 12.4 12.6 13.2 14 14.4 14.5 14Women 13 13.3 13.3 13.4 13.9 14.5 15 15.2 14.915 to 24 35.2 35.9 35.8 36.4 37.7 40.2 40.7 41.1 4025 to 49 9.7 10 10 10.4 11.1 11.8 12.3 12.3 1250+ 6.4 6.4 6.4 6.3 6.4 6.7 7 7.1 7
Source: LFS
There is little evidence on whether low paid or precarious jobs are stepping stones
towards better jobs. An in-depth analysis of labour market transitions calculated on thebasis of EU-SILC can shed some light on this issue38. First results show that the chancesto move from a temporary contract to a permanent job are much higher in some countriesthan in others. For instance between 2005 and 2006, the share of temporary employeesthat moved to a permanent contract was less than 25% in EL, FR, the NL, PT and ITwhile it was over 45% in EE, LV, LU, HU, SI, SK and the UK. As expected, in all EUcountries the chances for employees on short term contracts to become unemployed or
38 3 Indicators of labour market transitions calculated on the basis of EU-SILC have been adopted by theEmployment Committee in March 09. Data are available at (indicator 17.A4, p34; 18.A8, p61; 21.M1p.115): http://ec.europa.eu/social/BlobServlet?docId=115&langId=en

8/6/2019 Lisbon TF Final Report
http://slidepdf.com/reader/full/lisbon-tf-final-report 40/82
40
inactive are also much greater (2 to 4 times) than for employees on permanent contracts.Concerning workers entering the labour market at a low pay level, between 2005 and2006, the share of workers in the first earnings decile moving up to a higher decile39 ranged from around 20% in Greece and Portugal to more than 50% in Spain, Sloveniaand Slovakia. Low paid workers are also among those that are most likely to become outof work. Between 2005 and 2006, the share of first decile workers who became non-employed exceeded 20% in CZ, DK, DE, LV, HU, SE and the UK.
Taken together, these figures point to the existence of groups of workers, often young,and/or low skilled, and/or women40, who tend to remain at the margins of the labourmarket as they encounter difficulties accessing stable and gainful jobs. In paragraph 3.4of this report, we analyse whether the most vulnerable workers benefit from sufficientsupport through social protection and activation policies, and in particular to evaluatewhether they have effective access to skill upgrading schemes.
Employment growth has been mainly driven by an increase of female labour marketparticipation and to a certain extent by the prolonged working life of older workers.Several characteristics of female labour force participation impact on the
distribution of yearly earnings: skill levels, sector of activity, number of hours
worked, and the gender pay gap. A large share of women entered the labour market assecond earners and thereby improved the income situation of households already at work.However, in many countries the women who are furthest away from the labour market(lone mothers, the low skilled, etc) still face important barriers to find a job due to lack of childcare or of care for other dependants, or lack of reconciliation measures. They alsooften have difficulties to find a job that pays because of involuntary part-time, and thecombined effect of high marginal effective tax rates and high cost of childcare (seesection 3.4).
3.2.2. In-work poverty: when a job does not provide decent income for the household
The distribution of individual yearly earnings can mainly be explain by the individualcharacteristics of the workers and labour market features such as those reviewed above.However, in-work poverty relates to the situation of people that are employed, but stilllive, together with the other members of their households, under the poverty threshold.In-work poverty is both linked to the individual's labour market situation (such as lowpay, low skills, precarious employment and often involuntary part-time working), ant tolow work intensity (i.e. too few adults working or working only a few months during theyear). As illustrated in Figure 3.4 below, the risk of poverty of people employed depends
on the total amount of work performed by the adult members of the households in age of working. In all households with a work intensity below 0.5, i.e. adults in the householdsrealise less than half of their working potential, the risk of poverty is significantly higher.However, the risk of poverty of single earner households (work intensity=0.5) stronglydepends on the presence of children in the households. In the absence of children, the
39 The upward mobility of workers crucially depends on the age of workers since young workers are morelikely to be mobile and move up the ladder than older workers. In all countries, the proportion of young workers among low wage earners and among temporary workers is high. However, this
proportion varies across countries and might explain part of the differences in the results on LMtransitions.
40 The supporting document notably highlights the specific situation of the young and of women in thisrespect.

8/6/2019 Lisbon TF Final Report
http://slidepdf.com/reader/full/lisbon-tf-final-report 41/82
41
risk of poverty of households with several working age adults but only 1 earner is notsignificantly increased (7% against 6%).
On average in the EU, the in-work poverty rate of employed people is 10% if they live inhouseholds with children, against 6% if there are no children. The impact of children isonly mitigated in households that realise their full "working potential". When all working
age adults in the household work over the whole year (work intensity=1), the risk of poverty of workers is 5% in households with children and 6% in household withoutchildren. On the contrary, when one of the adults in the households do not work, or onlyworks part of the time, the respective in-work poverty risks increase to 7% householdswithout children and 16% in households with children. Finally, as expected, workersliving in households with very low work intensity (below 0.5) face very high risks of poverty.
Figure 3.4: EU 25- In-work poverty risk of employed people by type of household and work
intensity of the household; 2007 (%)
0
5
10
15
20
25
30
35
40
All Household with work
intensity between 0 and 0.5
Household with work
intensity between 0.5 and 1
Household with work
intensity = 1
Households without dependent children
Households with dependent children
Source: EU-SILC 2007
Low work intensity especially plays a role in households with children where thesingle-earner family model is not sufficient anymore to ward off the risk of poverty. TheSPC report on "child poverty and child well-being"41 showed that among children livingwith both parents, when both are working, children face a 7% risk of poverty on average,compared with 27% for children with only one of their two parents at work (and workingfull-time). The risk of poverty for children in single-earner families ranges from 11-16%in DK, DE, IE, FI and SE to 30% or more in EL, ES, IT, LT, LV, PL, PT, RO, and SI.Similarly, children living in a lone parent family face a very high risk of poverty of 37%,but it is much lower (18%) if the parent works full-time. The capacity of parents toparticipate in the labour market depends both on policies that support parentalemployment (especially mothers’ employment) and the reconciliation of work and familylife and on the availability and affordability of enabling services (e.g. child care).
41 See “Child poverty and Well-being in the EU, current status and way forward”, 2008, Table A14a p.166(couple with children). See also Joint Report 2008, Supporting document, p.12-13

8/6/2019 Lisbon TF Final Report
http://slidepdf.com/reader/full/lisbon-tf-final-report 42/82
42
3.3. Focus on the most excluded from the labour market
This part of the report aims at understanding whether the jobs created went to job rich or job poor households, and whether job creation worked in favour of those furthest awayfrom the labour market (long-term unemployed, migrants, disabled, older workers), thusimproving social cohesion. Did the job created help reducing the number of long-term
unemployed and the number of people living in jobless households? Are the employmentgaps of the most vulnerable groups (e.g. the migrants and ethnic minorities, the lowskilled, the disabled) persisting? Did all categories of older workers prolong theirworking lives? Developments in disparities of regional employment rates will also beused to explore the territorial distribution of employment growth.
3.3.1. Long-term unemployment was significantly reduced, but to a lesser extent for
older workers and the low skilled
Among all the different types of joblessness, long-term unemployment is certainly oneclearly associated with social distress. Long-term unemployment42 represents a
significant loss of income for the individuals concerned, who also tend to lose their skillsand the self-esteem necessary to regain a foothold in the labour market, unlessappropriate and timely support is provided. In 2007, long-term unemployment wasdown to 3.1% of the active population as against 4.2% in 2004, when it reached itshighest level since the launch of the Lisbon Strategy. Across Member States, the share of long-term unemployed among the unemployed varies markedly from less than 15 % inSE, DK, and CY to more than 50% in BG, DE and SK.
Overall, unemployment rates decreased significantly for all age groups since 2000.However, in all countries, the long term unemployment share is much higher for older
workers than for the young and until recently there was no significant decline in theLTU share of older workers: in 2007, it was still 60% against 59% in 2000, and therecent drop to 54% in 2008 can mainly be attributed to the impact of the crisis 43. Figure3.6 (drawn from Employment in Europe 2009) also shows that the overall reduction inthe long-term unemployment share was mainly driven by a decline of the LTU shareamong workers with higher education that started in 1998, while it remained stable for
workers with lower levels of education. This trend is consistent with the figureshighlighted in section 3.4 which show that the participation in Life Long Learning of thelow and medium skilled is much lower than the participation of high skilled workers.
42 Long-term unemployment is defined as the total long-term (over 12 months) unemployed population(ILO definition) as a proportion of the total active population aged 15 years or more.
43 Large in-flows of new unemployed reduces mechanically the LTU share in the short term.

8/6/2019 Lisbon TF Final Report
http://slidepdf.com/reader/full/lisbon-tf-final-report 43/82
43
Figure 3.5: EU 27- Long-term unemployment share: percentage of the unemployed that
have been unemployed for more than 12 months; by age, 2008 (%)
0
10
20
30
40
50
60
70
80
90
eu27 se dk cy es fi lt uk at lv ie ee lu pl nl fr ro si mt it hu pt el be cz bg de sk
% o
f p e o p l e u n e m p l o y e d i n e a c h a g e g r o u
p
Total Older workers (50+) Young (15-24)
Source: LFS 2008
Figure 3.6: EU - Long-term unemployment share by level of education, 1992 2007 (%)
0.3
0.35
0.4
0.45
0.5
0.55
1992 1993 1994 1995 1996 1997 1998 1999 2000 2001 2002 2003 2004 2005 2006 2007
High - IR12M
Low - IR12M
Medium - IR12M
COUNTRY EU AGE 15-64 SEX Total
Sum of VALUE
YEAR
HATLEV1D
INDICE
Source: DG EMPL based on EU LFS.
Variable used: DURUNE
Source: Employment in Europe 2009 - Calculation by DG EMPL based on LFS
3.3.2. Nearly 10% of people still live in jobless households
However, joblessness not only affects the unemployed. It also affects the householdmembers who depend on their income, and the impact of joblessness is most severe whennobody works in the household. In the EU-27 in 2007, despite the recent improvementsobserved, the share of people living in jobless households remained high at 9.3% for
adults of working age and 9.4% for children. Joblessness is one of the main factors of poverty and exclusion. It concerns 19 million adults in the EU, among whom 23% are

8/6/2019 Lisbon TF Final Report
http://slidepdf.com/reader/full/lisbon-tf-final-report 44/82
44
single adults, 10% lone parents, and 2/3 share the household with other adults who arealso out-of-work44. The percentage of adults living in jobless households varies from 5%in CY to 13% in Belgium. While precise poverty rates cannot be calculated for thispopulation, it is estimated that adults living in jobless households face a risk of povertyof 30% when there are no children in the household, and 60% when there are children 45.
It also concerns more than 7 million children, or 9.4% who still lived in joblesshouseholds in 2007. Variations across Member States are more marked, ranging from2.5% in SI to 16.7% in the UK. Children living in jobless households not only sufferfrom a lack of resources: the absence of a working adult in the household can also affecttheir educational and future labour market outcomes due to the lack of a role model.
Figure 3.7: Adults (aged 18-59 and not students) and children (0-17) living in jobless
households; 2007 — %
0
2
4
6
8
10
12
14
16
18
eu27 cy pt ee es cz nl si lv dk lt lu at mt ie el sk fi it de fr bg ro uk pl hu be
% o f p o p u l a t i o n c o n c e r n e d
Adults aged 18-59 (not students) Children aged 0-17
Source: Labour Force Survey (2007) — spring results; detailed household data missing for SE
3.3.3. Little progress in reducing the employment gap of migrant workers
In 2008, the overall employment gap46
for migrants born outside the EU had slightly
increased to 4.9 percentage points (against 4.5 p.p. in 2005). This slight increase masksvery divergent trends across the EU. In countries of recent migration, the employmentrates of people born outside the EU are higher than for the native-born population. In
44 According to the LFS, it is estimated that 42% of adults in jobless households share their household withat least another adult (also out of work) but with no children and that 24.5% share their householdwith at least another adult (also out of work) and with children.
45 The at-risk-of-poverty rates quoted here refer to a definition of joblessness that is stricter than thedefinition used in the indicator for people living in jobless households based on the LFS survey.According to the LFS definition, people are defined as jobless if they did not work in the last 4 weeks,whereas for calculating the poverty rate, people who have not worked over a period of 12 months areconsidered. Further analysis of the impact of joblessness and low work intensity is presented in
chapter 3 on social inclusion.46 The employment gap of migrants is defined as the difference in percentage points between the
employment rates of people born in the host country and of people born outside the EU. See data inEMCO indicators compendium (p. 77): http://ec.europa.eu/social/BlobServlet?docId=115&langId=en

8/6/2019 Lisbon TF Final Report
http://slidepdf.com/reader/full/lisbon-tf-final-report 45/82
45
long-standing host countries (BE, DK, DE, FR, NL, AT SE and the UK), migrants havemuch lower employment rates than the host population with a gap ranging from 7.6 pp inFR to 21pp in DE. In all these countries the gap remained stable or was slightly reducedbetween 2005 and 2008.
The employment gap for migrants depends on a number of factors, including the
composition of the migrant population by age, skills level, household composition, andnumbers of years spent in the host country. It also depends on the main motives formigration (family reunion, economic, humanitarian, etc), which vary considerably acrossthe EU47. EU Member States have agreed to mainstream the social aspects of migrationwithin their social inclusion and social protection policies. This is to take account of themultiple dimensions of the integration of migrants, who often face several exclusionfactors simultaneously, including a higher risk of poverty and barriers in access tohousing, health care or education for their children.
3.3.4. Regional disparities in employment rates were reduced, but overall regional
development does not automatically lead to the reduction of poverty
The regional dispersion of employment rates across the EU has been reduced from astandard deviation of 13 in 2000 to 11.1 in 2007. This overall trend is further confirmedby the drop in the number of under performing regions. In 2007, 23 out of 268 NUTS-IIregions recorded employment rates below 90% of the national average against 28 in200548. This overall progress in employment rates is partly mitigated by the persistingincidence of informal work of different forms (from subsistence agriculture to taxevasion…) in some of the poorest regions of EU49. In addition, a Commission workingpaper50 presenting empirical evidence on regional convergence shows that, overall, poorregions of the EU-27 have been catching-up on richer regions in the last ten years, in
terms of GDP/capita. However, during the same period disparities have diminishedamong countries (mainly the New Member States), but have increased within countries.
3.4. Some progress in supporting the labour market integration of the most
excluded, but concerns remain on the effectiveness of safety nets
As already highlighted, several policy guidelines51 embedded in the Lisbon strategy aremeant to address labour market segmentation, the persistence of in-work poverty andexclusion from the labour market. On the basis of indicators identified by theEmployment Committee and the SPC, as well as relevant literature, this chapter reviewsthe progress made by Member States in several areas with a focus on workers that are
further away from the labour market. Notably, we focus on the extent to which the mostvulnerable have benefited from active labour market policies; if they had an effective
47 A detailed analysis of the labour market situation of migrants is available in ‘Employment in Europe2008’: http://ec.europa.eu/social/main.jsp?langId=en&catId=113&newsId=415&furtherNews=yes
48 See data EMCO indicators compendium (pages. 28 and 36):http://ec.europa.eu/social/BlobServlet?docId=115&langId=en
49 See a review of 4 EU countries (PL, HU, CZ, SK) in OECD Employment Outlook 2008.Another OECDreport estimates that informal employment represents between 20% and 50% of total employment
in Romania, depending on the definition used: http://www.oecd.org/dataoecd/19/13/41012694.pdf 50 "Regional convergence, growth and interpersonal inequalities across the EU" Philippe Montfort, DGREGIO, January 2009
51 Notably guidelines 19 "inclusive labour markets" and 23 "Expand and Improve human capital"

8/6/2019 Lisbon TF Final Report
http://slidepdf.com/reader/full/lisbon-tf-final-report 46/82
46
access to life long learning, if progress has been made to reduce financial disincentives towork for people with low wages and for those with family responsibilities, whilstensuring adequate levels of social protection.
3.4.1. Some progress in measures to support labour market integration
A number of policy tools are promoted in the context of the Lisbon Strategy to supportgreater labour market participation among the inactive and the unemployed and help lowwage workers getting better jobs.
Participation in life long learning has improved overall in the EU27 from 7.1% of thepeople aged 25-64 in 2000 to 9.6% in 2008. However, great disparities remain acrosscountries with participation rates among the 25-64 varying from 3% or less in RO, BG,HU and EL to more than 30% in DK and SE. The participation rates of the unemployedhave increased but still stood at 8.5% 2008. After an increase in the early 2000,participation rates of the inactive stagnated and stood at 6.9% in 2008. The main issue of concern is the very low rates and slow progress in the participation of low skilled
workers which stood at 3.8% in 2008 (against 2.8% in 2000). Furthermore, thepercentage of early school leavers was still high at 15.2% in 2007 in the EU, against17.2% in 2000. This overall progress hides the poor performance of a number of countries like BE, DK, DE, EE, ES, FR, AT and SK where no or very little progress wasmade.
Labour Market Policy expenditure decreased from 0.51% of GDP to 0.47% between2005 and 2007, partly reflecting declining unemployment rates. LMP expenditure perperson wanting to work has also stagnated during the period. In the mean time there wasa slight shift from spending on passive measures to spending on active measures52.Spending on active measures per person wanting to work have increased from 1472 PPSin 2005 to 1739 PPS in 2007, while spending on "passive" measures per person wantingto work declined from 3931 PPS to 3770 PPS in 2007. The decline was mainly driven bythe decline in income replacement spending, while spending on early retirementmeasures (8% of total passive spending) was not reduced. Further analysis would beneeded to identify the factors behind the relative decrease in income maintenancespending (changes in the design of benefits, reduced benefits, etc). (See point 3.4.2)
The lack of enabling services has also been identified as an obstacle to participation inthe labour market, especially for women with care responsibilities. It is also acompounding factor of child poverty. Efforts of Member States for increasing child care
provision has helped increasing the number of children cared for in formal arrangementsfrom 25% in 2005 to 30% in 2007 for children below 2 years. Very large differencespersist between Member States, with rates ranging from 2% in CZ, PL and SK to morethan 40% in BE, DK, NL and SE. In many countries the provision of childcare is mainlyon a part-time basis which can hamper participation for lone parents especially.Furthermore, in the same period the share of persons with care responsibilities declaringthat they are inactive or working part-time due to a lack of care services has increasedfrom 26.7% in 2006 to 29.8% in 2008.
52 "Passive measures" include income support (8) and early retirement schemes (9); "Active measures"include Training (2), Job rotation and job sharing (3), Employment incentives (4), Supportedemployment and rehabilitation (5), Direct job creation (6) and Start-up incentives (7)
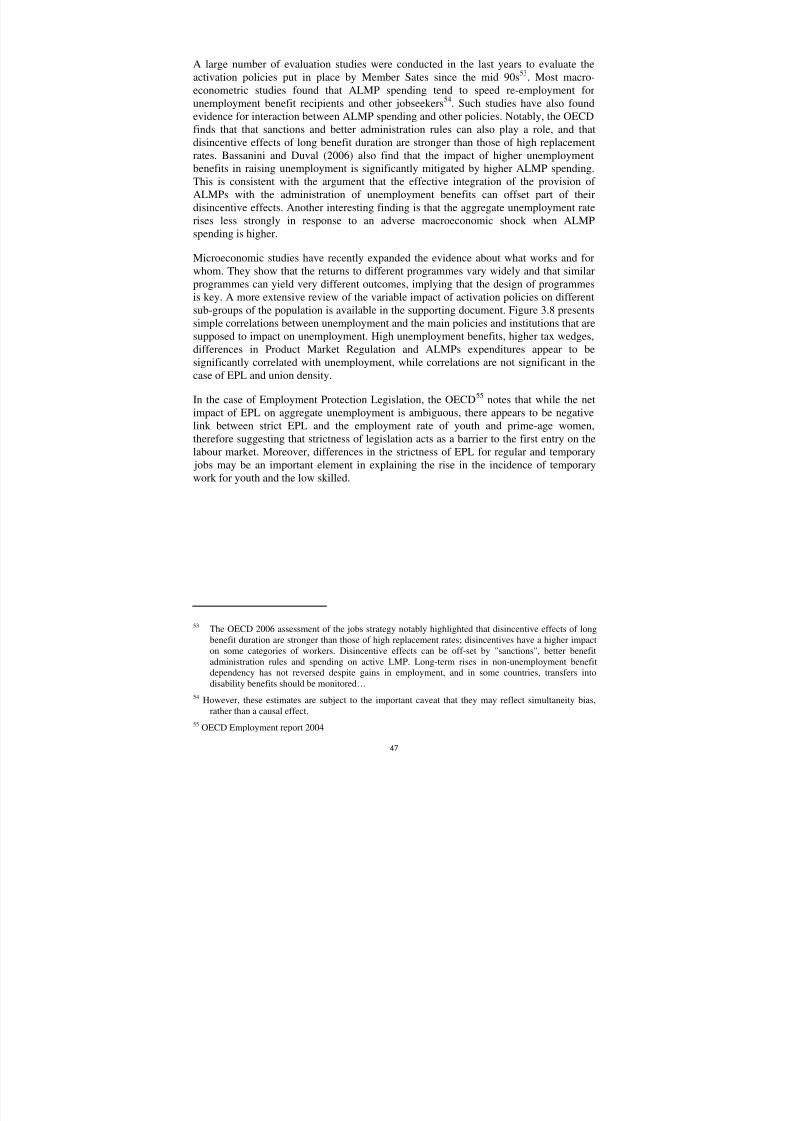
8/6/2019 Lisbon TF Final Report
http://slidepdf.com/reader/full/lisbon-tf-final-report 47/82
47
A large number of evaluation studies were conducted in the last years to evaluate theactivation policies put in place by Member Sates since the mid 90s53. Most macro-econometric studies found that ALMP spending tend to speed re-employment forunemployment benefit recipients and other jobseekers54. Such studies have also foundevidence for interaction between ALMP spending and other policies. Notably, the OECDfinds that that sanctions and better administration rules can also play a role, and thatdisincentive effects of long benefit duration are stronger than those of high replacementrates. Bassanini and Duval (2006) also find that the impact of higher unemploymentbenefits in raising unemployment is significantly mitigated by higher ALMP spending.This is consistent with the argument that the effective integration of the provision of ALMPs with the administration of unemployment benefits can offset part of theirdisincentive effects. Another interesting finding is that the aggregate unemployment raterises less strongly in response to an adverse macroeconomic shock when ALMPspending is higher.
Microeconomic studies have recently expanded the evidence about what works and forwhom. They show that the returns to different programmes vary widely and that similarprogrammes can yield very different outcomes, implying that the design of programmesis key. A more extensive review of the variable impact of activation policies on differentsub-groups of the population is available in the supporting document. Figure 3.8 presentssimple correlations between unemployment and the main policies and institutions that aresupposed to impact on unemployment. High unemployment benefits, higher tax wedges,differences in Product Market Regulation and ALMPs expenditures appear to besignificantly correlated with unemployment, while correlations are not significant in thecase of EPL and union density.
In the case of Employment Protection Legislation, the OECD55 notes that while the net
impact of EPL on aggregate unemployment is ambiguous, there appears to be negativelink between strict EPL and the employment rate of youth and prime-age women,therefore suggesting that strictness of legislation acts as a barrier to the first entry on thelabour market. Moreover, differences in the strictness of EPL for regular and temporary
jobs may be an important element in explaining the rise in the incidence of temporarywork for youth and the low skilled.
53 The OECD 2006 assessment of the jobs strategy notably highlighted that disincentive effects of longbenefit duration are stronger than those of high replacement rates; disincentives have a higher impacton some categories of workers. Disincentive effects can be off-set by "sanctions", better benefitadministration rules and spending on active LMP. Long-term rises in non-unemployment benefitdependency has not reversed despite gains in employment, and in some countries, transfers intodisability benefits should be monitored…
54 However, these estimates are subject to the important caveat that they may reflect simultaneity bias,rather than a causal effect.
55 OECD Employment report 2004

8/6/2019 Lisbon TF Final Report
http://slidepdf.com/reader/full/lisbon-tf-final-report 48/82
48
Figure 3.8: Correlations between unemployment and the main policies and institutions
Variables purged from both country and time fixed effects, 1982-2003
***
***
***
**
-0,6
-0,4
-0,2
0
0,2
0,4
0,6
Average
replacement
rate
Tax wedge EPL a Union density PMR b ALMP c
Source: OECD estimates. ALMP: Active labour market programmes. EPL: Employment protection
legislation. PMR: Product market regulation.***, **, *, statistically significant at 1%, 5% and 10% levels, respectively.
3.4.2. Significant efforts to reduce financial disincentives to work, but concerns remain
on the effectiveness of safety nets
One of the key areas of reform aimed at attracting more people in the labour market is toensure that work pays and that the underlying incentive structure in the tax and benefitsystems is supportive to employment. The concern is to reduce reliance on socialprotection and increase self-sufficiency by supporting labour market participation and
"making work pay", that which is, making work an economically attractive optionrelative to welfare. While of interest from a work incentive perspective, the design of welfare and tax systems is also crucial from a social inclusion perspective. In reviewingtax and benefit systems, Member States also need to make sure that social transfers andincome support schemes for those who remain out of the labour market are effective inrelieving poverty. Balancing the two goals of increasing labour supply incentives and atthe same time alleviating poverty is a challenge for policy-makers, who also have to takeaccount of the budgetary costs that any tax and benefit reform may involve.
In February 2009, the European Commission produced a full assessment of the tax-benefit reforms aimed at making-work-pay56, based on key indicators of financial
incentives to work. Three different types of transitions are considered through theanalysis of the unemployment trap, the inactivity trap and the low wage trap. Thesethree indicators are agreed OMC context information 57 and are defined as marginaleffective tax rates measuring the part of the additional gross wage that is taxed away inthe form of increased taxes and withdrawn benefits, when the unemployed or the inactivetake up a job, or when a low wage worker decides to work more.
56 Recent reforms of the tax and benefit systems in the framework of flexicurity; European EconomyOccasional papers 43, Feb 2009:
http://ec.europa.eu/economy_finance/publications/publication14173_en.pdf 57 An extensive analysis of financial incentives to work from a social inclusion perspective was published
in the context of social OMC in chapter III of the technical annex to the Joint Report 2006. See:http://ec.europa.eu/employment_social/spsi/docs/social_inclusion/2006/sec2006_523_en.pdf

8/6/2019 Lisbon TF Final Report
http://slidepdf.com/reader/full/lisbon-tf-final-report 49/82
49
It has to be highlighted here that these indicators are based on typical cases whoserepresentativeness vary across countries and on common assumptions that might notcapture the nuances of Member States systems. Furthermore, we do not attempt here toevaluate the extent to which potential traps are actual ones. It is however worthmentioning that the elasticity of labour supply to changes in the tax and benefit systemsappears to vary between Member States and across different population groupsdepending on a multitude of factors ranging from the availability and accessibility of services to the conditions of national and local labour markets. Thus, financialincentives, as measured by the trap indicators, only partly explain labour marketoutcomes.
The main findings of the February 2009 report are summarised below.
The main policy tools that Member States have used to lower these traps were mainlyfocused on low wage workers. They include reducing the tax wedge (direct labourtaxation + social security contributions) on lower wages, increasing minimum wages,reducing the level or duration of unemployment benefits, introducing in-work benefits,and reviewing the design of out-of-work benefits (social assistance, child/family benefits,housing benefits, disability schemes). Indeed, important features of the reforms of benefits do not impact directly on the financial incentives but are instrumental inencouraging the return to work of the unemployed and the inactive. These includeeligibility and work-availability conditions, participation in activation measures andeffective enforcement of the system. While some of these tools have no impact on benefitadequacy (in-work benefits, lower the tax wedge, increased minimum wage), others mayaffect adequacy and lead to poverty and exclusion if the return to work is not effective ordurable. Active inclusion strategies that are put in place in Member States couldcontribute to ensuring this balance.
As illustrated in table 2, between 2001 and 2007, the largest reductions in theunemployment trap have been achieved by France, the Slovak Republic, Finland,Sweden, Belgium and Denmark, for all types of households.. The introduction of in-workbenefits contributed to these reductions in FR58, SK, IE, and FI. Measures to reduce thetax wedge on low wages contributed to lower METRs in FR, FI, BE and PL. Increasedearnings disregards helped reducing the financial disincentives to work in FR and FI.Reduction on social assistance and housing benefits were used in SK, where concernsover the adequacy of out-of work income support can be expressed as illustrated in thefollowing paragraph.
The inactivity trap was also considerably reduced between 2001 and 2007 in a numberof countries. In particular, for a one-earner couple with children the METR were reducedat a low wage level in France, Sweden, Austria, Spain, Finland, the Czech Republic andthe Slovak Republic. The reduction is mainly due to changes in the social assistancescheme, followed by the introduction of in-work benefits (in Slovak Republic andSweden) and changes in housing benefits (Austria). Targeted reductions in inactivitytraps for certain family types were achieved also in Hungary (for a two-earner couplewith and without children), the UK (for one-earner couple), Italy (for two-earner couple
58
The French set of measures is especially comprehensive including increased earning disregards, in-workbenefits and lower tax wedges on low wages. The new "Revenu de Solidarité Active" scheme thatcame into force on 1st July 2009 goes a step further by integrating a whole range of measures of in andout of work income support, activation and access to services into one scheme along the principles of active inclusion.

8/6/2019 Lisbon TF Final Report
http://slidepdf.com/reader/full/lisbon-tf-final-report 50/82
50
with and without children) and Ireland (for two-earner couple without children andsingle parents with children). These trends are confirmed when looking at the recentchanges in METRit (2007), where reductions have been recorded in particular in France,
Latvia and Sweden. A decline in the inactivity trap in France and in Latvia was drivenby changes in the social assistance scheme and in Sweden by the introduction of in-workbenefits.
The OECD report Benefits and Wages 200759, also based on these indicators, highlightedthe specific impact of tax-benefits and childcare policies for work incentives. Both theavailability and affordability of child care play a crucial role in allowing parents,especially of young children, to take-up a job. Lone parents with low prospective wagesface the greatest disincentives to work. In some countries, high childcare costs have astrong compounding impact on financial disincentives (IE, SK, UK) for these parents,but inactivity traps deriving from the design of the tax-benefit system may also be aproblem where childcare support is well developed. Child care costs can also be apowerful determinant of the net income gains in the case of second earners.
It has to be noted that the introduction of measures targeted at low wage earners such asin-work benefits and the reduction of the tax wedge on low wages, may createdisincentive effects at a higher in the earnings distribution, and/or introduce a bias in thesetting of wages. Such side effects can also impact on the long-term adequacy of socialprotection by lower contributions.
Concerns remain on the effectiveness of safety nets
Among the measures described above some are likely to have negative unintendedeffects. Increasing the conditionality of unemployment benefits is a way increasingincentives to take-up a job without lowering the level of benefits, but it may push peopleinto social assistance schemes, if their efforts to find a job are unsuccessful. Loweringsocial assistance benefits will affect the adequacy of these schemes and undermine theindividual capability to overcome dependency. It is therefore crucial to ensure both thatproper mechanisms are put in place to prevent benefit dependency, and that those whohave to rely on social assistance can afford a decent standard of living.
What is the financial situation of those who depend on a minimum income? Countriesdiffer substantially in terms of the minimum safety nets they provide to worklesshouseholds60, even relative to the at-risk-of-poverty threshold, which depends on theliving standards within each country (Figure 3.9). Only a few countries provide workless
households with a minimum income and related (i.e. housing) benefits that are sufficientto lift them close to or above the 60% median income threshold, and this only for somefamily types.
59 See related data in http://dx.doi.org/10.1787/141558047744
60 This indicator reflects assumptions that households rely on social assistance benefits for the entire
year, and that no other income stream (from other social protection benefits such as unemploymentinsurance or disability or from work) is available. This indicator based on a typical case is thereforenot strictly comparable to the poverty threshold estimated on the basis of household survey data (EU-SILC). Concerning the UK, a specific and significant inconsistency between the SILC and the OECDmodel in the way they estimate housing benefits may explain the very high ratio for lone parents.

8/6/2019 Lisbon TF Final Report
http://slidepdf.com/reader/full/lisbon-tf-final-report 51/82

8/6/2019 Lisbon TF Final Report
http://slidepdf.com/reader/full/lisbon-tf-final-report 52/82
52
3.5. Concluding remarks:
Having a job remains the best safeguard against poverty and exclusion. However,
recent employment increases have not sufficiently reached those furthest away from
the labour market, and jobs have not always succeeded in lifting people out of
poverty. Some groups still face specific hurdles such as poor access to training for
the low skilled, lack of enabling services, or poor design of benefits that createfinancial disincentives. Labour market segmentation persists combined with a lack
in job quality. The development of precarious forms of employment, often
characterised by a strong gender dimension has contributed to persistently high
levels of in-work poverty. Lessons need to be drawn from these facts when
preventing that the crisis considerably aggravates persistent exclusion. Active
inclusion strategies are not only crucial to support the most vulnerable in the crisis,
but also to limit losses to human capital and preserve future growth potential.
While broader participation in the labour market generated overall benefits, employmentgrowth did not always reach the most excluded and that the jobs created did not alwaysprovide for decent living standards. Despite the increased participation of women andolder workers, at the outset of the crisis, about one third of the working age population inthe EU was out of work (unemployed or inactive). Furthermore, under-employment andprecarious forms of contracts mitigate the positive impact of including more people inthe labour market.
A job is not always a guarantee against the risk of poverty and the working poor represent 1/3 of the working age adults at-risk of poverty. Since 2000, the developmentof temporary work, part-time work (including involuntary part-time) and sometimesstagnating wages have increased the number of individuals with low yearly earnings
(especially among women and the young). For many of these workers, these jobs are notstepping stones towards better jobs. In-work poverty is also related to situations wherethere are too few adults working in the household, or where they are working too fewhours or only part of the year. Single and lone parent households, as well as one-earnerfamilies face the highest risks of poverty.
The last decade has also seen the persistence of groups of people that remain outside
or at the margin of the labour market (e.g. low skilled women, migrants and theyoung), often facing multiple barriers to enter the labour market (among which lowskills, care responsibilities, age, migrant background, etc.). In 2007 in the EU27, 9.3% of adults in age of working were living in jobless households against 10.2% in 2001 and
the crisis is likely to increase the number of families having to rely entirely on socialbenefits.
Some progress has been made in enhancing activation measures across EU countries, butmore needs to be done to reach the most vulnerable, especially concerning access to
lifelong learning. While some progress has been made in reducing financial
disincentives to take up work or work more, attention should be paid to the adequacy
of benefits, since the inadequacy of safety nets is not only a cause of poverty persistence,but also an obstacle to re-integration in the labour market and society. Financialdisincentives are not the only barriers to labour market participation, adequate and
individualised support services play a key role. In order to reach the most vulnerable,
without necessarily increasing spending, the effectiveness of the measures describedabove can be reinforced if they are integrated into active inclusion strategies.

8/6/2019 Lisbon TF Final Report
http://slidepdf.com/reader/full/lisbon-tf-final-report 53/82
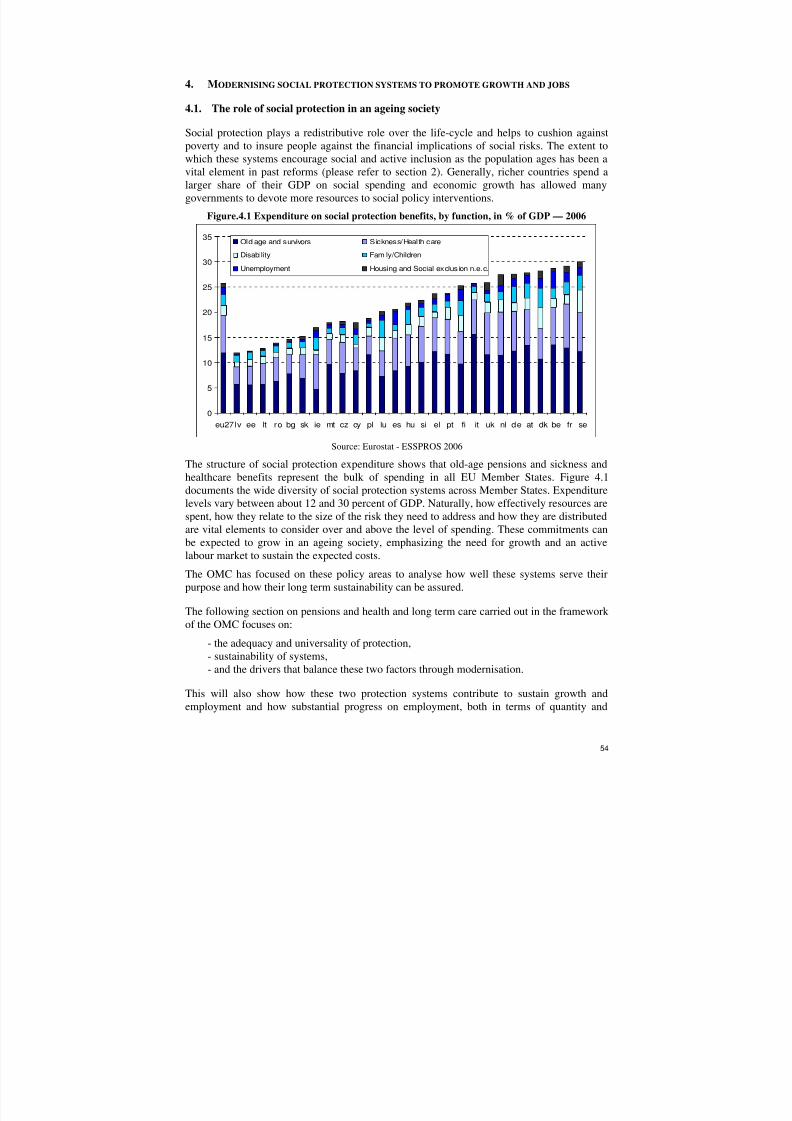
8/6/2019 Lisbon TF Final Report
http://slidepdf.com/reader/full/lisbon-tf-final-report 54/82
54
4. MODERNISING SOCIAL PROTECTION SYSTEMS TO PROMOTE GROWTH AND JOBS
4.1. The role of social protection in an ageing society
Social protection plays a redistributive role over the life-cycle and helps to cushion againstpoverty and to insure people against the financial implications of social risks. The extent towhich these systems encourage social and active inclusion as the population ages has been avital element in past reforms (please refer to section 2). Generally, richer countries spend alarger share of their GDP on social spending and economic growth has allowed manygovernments to devote more resources to social policy interventions.
Figure.4.1 Expenditure on social protection benefits, by function, in % of GDP — 2006
0
5
10
15
20
25
30
35
eu27lv ee lt ro bg sk ie mt cz cy pl lu es hu si el pt fi it uk nl de at dk be fr se
Old age and survivors Sickness/Health care
Disability Family/Children
Unemployment Housing and Social exclusion n.e.c.
Source: Eurostat - ESSPROS 2006
The structure of social protection expenditure shows that old-age pensions and sickness andhealthcare benefits represent the bulk of spending in all EU Member States. Figure 4.1documents the wide diversity of social protection systems across Member States. Expenditurelevels vary between about 12 and 30 percent of GDP. Naturally, how effectively resources arespent, how they relate to the size of the risk they need to address and how they are distributedare vital elements to consider over and above the level of spending. These commitments canbe expected to grow in an ageing society, emphasizing the need for growth and an active
labour market to sustain the expected costs.The OMC has focused on these policy areas to analyse how well these systems serve theirpurpose and how their long term sustainability can be assured.
The following section on pensions and health and long term care carried out in the frameworkof the OMC focuses on:
- the adequacy and universality of protection,- sustainability of systems,- and the drivers that balance these two factors through modernisation.
This will also show how these two protection systems contribute to sustain growth andemployment and how substantial progress on employment, both in terms of quantity and

8/6/2019 Lisbon TF Final Report
http://slidepdf.com/reader/full/lisbon-tf-final-report 55/82
55
quality, are essential to achieve this balance between social adequacy and long-termsustainability.
4.2. Pension reform – progress in sustainability, emerging adequacy gaps and higher
and better quality employment as an urgent need to improve balance between
sustainability and adequacy
4.2.1. The main feature in pension reforms: tightening the link between work and benefits
The Social Protection Committee (SPC) has studied and analysed changes to pension systemsfrom the early days of reform. One of the key results shows that over the last 15 years,reforms have tied pension entitlement more closely to contributory work years or directly towages through the accumulation of contributions and the returns on their investment as a keysolution to dealing with demographic ageing. Furthermore, remaining life expectancy at theage of retirement is more strongly linked to the benefit formula in several Member States.These reforms tighten the link between longer lives and longer working lives in the
calculation of pension benefits, strengthening financial incentives for individuals to workmore and longer. Furthermore, some Member States have reduced public debt rates, creatingbudgetary space to support the financing of aging when necessary.
4.2.2. Financial sustainability at the cost of adequacy?
Pensions represent by far the greatest item of expenditure of social protection (46 percent in2006 in the EU). The projected future pressures from demographic ageing on the cost of pensions have instigated pension reforms in most Member States. Whiles demographic ageingwithout pension reform would lead to an increase in public pension expenditure by around 9percentage points of EU GDP between 2007 and 2060; reforms of pension systems should
curb this increase to only 2.4 percentage points, so that projected expenditure would reach12.5% of GDP in 2060.
Two main consequences of reforms emerge. Firstly, the role of public pension benefits inoverall pension provision would decline, though public pensions are expected to remain themajor source of income for pensioners in all but a few Member States. Secondly, theeligibility for public pensions has been tightened, reducing the projected levels of pensionsrelative to wages if working lives are not prolonged.
Recent analysis by the Ageing Working Group of the Economic Policy Committee (EPC)suggests that in the future, the ratio of average pensions from statutory schemes to average
wages will decline substantially in a number of Member States. Furthermore, the report on"Updates of Current and prospective theoretical pension replacement rates 2006-2046"adopted by the July 2009 SPC looks at both the current and future adequacy of pensions inEU Member States64.
Between 2006 and 2046 these are projected to drop on average by several percentage points,and some Member States record decreases of over ten percentage points at a fixed career
64 The theoretical replacement rates measure the extent to which pension systems enable typical workers to
preserve their previous living standard when moving from employment to retirement, reflecting pensionlevels relative to the last wages.

8/6/2019 Lisbon TF Final Report
http://slidepdf.com/reader/full/lisbon-tf-final-report 56/82

8/6/2019 Lisbon TF Final Report
http://slidepdf.com/reader/full/lisbon-tf-final-report 57/82
57
Figure 4.3 Difference in net theoretical replacement rates for an average earner working until
the age of 63 and 67 with 38 and 42 contributory years respectively as compared with working
until the age of 65, 2044-2048, percentage points
-12
-10
-8
-6
-4
-2
0
2
4
6
8
10
LU DK IE UK ES BE SI FR LT IT RO FI SE DE NL EL LV BG PL HU EE AT CZ SK PT CY MT
Difference in NRR after a 38 year career compared w ith a 40 year career
Difference in NRR after a 42 year career compared w ith a 40 year career
Source: SPC/ISG
4.2.4. … but we still need to protect the interests of other vulnerable groups on the labour
market
Whiles increasing the individual financial incentives to prolong working lives in pensionsystems it is important to analyse the impact of these reforms on people unable to meet theseconditions due to atypical career patterns. Future risk groups would include the low skilled,low waged women and men, individuals affected by long-term unemployment, disability orillness, men and women with caring duties and people excluded from pension coverage due toshort term, temporary contracts or self-employed status. For such groups minimum incomeprovision and minimum pensions play an important role in providing adequate livingstandards in old age. In many pension reforms these types of pension have been reinforced,although their impacts on work incentives need to be continuously monitored.
Income inequalities and wage gaps between employed men and women continue to persist.Whiles a main objective in reforms has been to continue to ensure adequacy in old age evenfor the most vulnerable, persisting labour market differences between men and womentransmit into income inequalities in old age. In the EU 27, in 2007, the risk-of poverty rate forwomen over the age of 65 is 22 percent as compared with 16 percent for men. Part of thesolution legislated by Member States to ensure that women have a decent retirement incomehas been equalising the pension eligibility ages for men and women. Furthermore, careburdens, which today are still mainly borne by women, and how they result in lower pensionare monitored. An increasing number of countries are beginning to give pension entitlementsfor care-related absences from the labour market. At the same time, this is monitored togetherwith the effects on work incentives in order to avoid that such protections become new
dependency traps as caring years have a significant negative effect on women's long-termparticipation in the labour market in many Member States.

8/6/2019 Lisbon TF Final Report
http://slidepdf.com/reader/full/lisbon-tf-final-report 58/82
58
Figure 4.4 Accumulated difference in net theoretical replacement rates for an average earner
entering the labour market at 25 and retiring at the statutory retirement age with a 1, 2 and 3
year career break for childcare compared with no break
-8
-6
-4
-2
0
2
4
F R
C Z
E S
L U
M T F
I
A T
B E
E L
S E
E E
S K I E
D E
D K
L T I T
U K
P L
C Y
H U
P T
N L
B G
L V S
I R O
1 year 2 years 3 years
Source: SPC/ISG
Note: the values for CZ, ES, LU and MT are equal to 0 and should not be interpreted as missing.
4.2.5. The increasing role of funded privately managed schemes: adequacy and risk
Calculations of theoretical replacement rates also show that the drop in pension adequacy ismore pronounced in statutory pension systems than in private ones, although this is partly
linked to a shift of contributions from statutory schemes to funded ones. Calculations of theoretical replacement rates show that nearly half of the EU Member States show double-digit percentage point declines between 2006 and 2046. By contrast, in privately managedpension schemes, future retirees are expected to accrue a higher proportion of their incomefrom mandatory funded, occupational and/or supplementary pensions for those actuallycovered by these schemes. This however is also a reflection that these countries have a verylow or no proportion of current retirement income from such schemes for average workers.Countries where private schemes have already been developed, such as the United Kingdom,The Netherlands, Sweden and Ireland show lower percentage increases for a typical averageworker assumed to be covered by these schemes. Whiles this development increases savings
and the pre-funding of future pensions it often also increases the risk and exposure of theindividual to economic and financial volatility. Also as the importance of such schemesincreases in overall pension income it is important to maintain that there is a high coverage of these schemes. This development needs, therefore, to be monitored in light of the growingmaturity of these schemes.65
65
Updates of current and prospective theoretical pension replacement rates 2006-2046 , Social ProtectionCommittee, July 2009.

8/6/2019 Lisbon TF Final Report
http://slidepdf.com/reader/full/lisbon-tf-final-report 59/82
59
Figure 4.5 Expected change in percentage of occupational and statutory funded schemes in total
gross replacement rate in Member States with such schemes, 2006-2047, percentage points
-10
0
10
20
30
40
50
60
LV DK SK PL EE HU DE BG RO IT BE SE NL UK IE
Source: SPC/ISG
4.2.6. … The financial crisis has highlighted risks in privately managed schemes
In the wake of the financial crisis the Social Protection Committee adopted a report whichtried to assess growing importance of funded pensions.66 The report highlighted that asprivate pension schemes in the future will be increasingly used in more Member States toachieve the objectives of adequacy and sustainability, it has become essential to analyse theimpact of their development on future pension levels.
Pension reforms in a number of Member States (or at the time candidate countries) were
implemented in the period of high economic growth and boom in the stock markets. Theboom made people believe that participation to funded schemes will considerably improvetheir income position during retirement. The financial crisis made visible that in some casesexpectations of the long-term return rates of the funded pensions were excessively optimistic.Lower than expected pension funds results and lower risk adjusted rates of return will put adownward pressure on adequacy of pension income. This will be especially sensitive for theless well off who may be less able to absorb the inherent risks, bringing to light the need tofurther study the effects of these pensions for different socio-economic groups.
The SPC report underlines the need for better financial education. The report also stressed theimportance of ensuring that investment frameworks for private pension schemes are designed
in a solid prudential framework and to encourage informed choices and that the 'lifecycling' or'lifestyling' of asset allocation is the mainstream option for everyone.
The appropriate coverage and contribution levels of private schemes depend on their role inthe overall pension system. If they are a top-up to other universal retirement provision toensure similar replacement rates for all, then coverage may only need to be targeted at certainsegments of the population. However, if their role is as an essential component of retirementincome for the whole population then coverage clearly needs to be very high and contribution
66
Privately managed funded pension provision and their contribution to adequate and sustainable pensions,Social Protection Committee, 2008.

8/6/2019 Lisbon TF Final Report
http://slidepdf.com/reader/full/lisbon-tf-final-report 60/82
60
levels need to be sufficient. In the case of the latter and as funded provision forms an everincreasing share of total pension benefits, there is a role for the governments to ensure thelong term pension adequacy from these schemes.
4.2.7. … and in pay-as-you-go schemes
The economic downturn has, however, also hit other types of pensions than only those withreturns directly linked to the financial market. As the financial crisis filters down to the realeconomy, a contracting labour market in the EU is expected. The affect of highunemployment on pensions is two-fold. Higher unemployment, along with slowerproductivity and wage growth, affects both the tax and contributory base of pension systems,negatively reducing the revenues that pension systems rely on. Furthermore, long-termunemployment and increasing inactivity can have negative affects on the accrual of pensionentitlements, having an adverse affect on individuals' pensions. Lower accruals along withminimum income safety nets can create further disincentives to work and poverty traps in thefuture.
In most Member States, the legislated period of pension entitlements for unemploymentbreaks does not stretch out for three years, resulting in a bigger drop in pension replacementrates during the second or third year of unemployment. In extreme cases these become non-income and non-contributory years. It is, therefore, vital to monitor the legnth of the period of unemployment and actively promote a return to the labour market.
Past crises have often resulted in older workers, who are a relatively vulnerable group on thelabour market in the best of times, being prematurely pushed out of the labour market (pleaserefer to section 1). Given the demographic challenges that pay-as-you-go systems are yet toface in light of demographic ageing, Member States would need to reduce the risks of olderworkers being pushed into using early exit pathways from the labour market, including, early
retirement, unemployment and disability schemes.Figure 4.6 Accumulated difference in net theoretical replacement rates for an average earner
entering the labour market at 25 and retiring at the statutory retirement age with a 1, 2 and 3
year career break for unemployment compared with no break*
-7
-6
-5
-4
-3
-2
-1
0
1
2
M T
P T
F R
C Z
E S
H U
B G
E L
D K I E
N L
A T
L T E
E S I
U K
B E
S E
L U
C Y
D E
P L
L V I T F
I S K
R O
1 year 2 years 3 ye ars
Source: SPC/ISG* The unemployment break is assumed to take place in the years just prior to old age retirement
which is assumed to take place at the legislated statutory old retirement age for men. Note: the values for MTand PT are equal to 0 and should not be interpreted as missing.

8/6/2019 Lisbon TF Final Report
http://slidepdf.com/reader/full/lisbon-tf-final-report 61/82
61
4.2.8. Labour market and pension policy need to be combined to achieve adequate and
sustainable future pensions
Whiles recent pension reforms have reduced future pressures on sustainability, if bothadequacy and sustainability of pensions are to be achieved there is a need to increase
employment rates and the quality of employment for all socio-economic groups.According to the AWG calculations demographic factors (captured by changes in the old agedependency ratio) are the main contributors to the increase in the ratio of pensions to GDPbetween 2007 and 2060. The increase in the old age dependency ratio would push publicpension expenditure in the EU on average by 8.7 pp. over the period. Nevertheless, EUMember States have introduced pension reforms that will make public pension systems moresustainable.
From the European point of view it is important to keep particular attention to the futureadequacy and sustainability of pensions, as these are objectives agreed within the open
method of coordination on social protection and social inclusion. There are some doubtswhether the results of recent pension reforms lead to achievement of both objectives. Whilethe AWG group calculations show a lower increase in public pension expenditure, the ISGcalculations project a decrease in future replacement rates of statutory public pensions67.Calculations of AWG benefits ratios also confirm a general trend of declining adequacy. Thisentails that statutory public pensions in a majority of Member States will decline in relation toaverage wages, as governments strive to achieve financial sustainability, very often at theexpense of adequacy.
Some Member States try to compensate for declines in adequacy by encouraging enrolment infunded pensions, often shifting part of the pension expenditure to the private funded pension
provision. In some Member States, the effective contribution rates are, therefore, higher thanshown in the AWG public pension expenditure calculations which do not include thesepensions. SPC studies on privately managed pension provision from 2004 and 2008 haveprovided only partial information on the increases in contribution rates to private schemes,but for some countries where data is available, we can see additional increases in totalcontribution rates for the individual which may curb active labour market policy.
As an effect of the reforms introduced, Member States also project an increased participationin the labour market. The AWG calculations were based on an assumption of a moderateincrease in employment rates of population aged 15-64 from 65.5% in 2007 to 69.9% in 2060.This increase reflects growing employment of women and older workers. According to theprojections the improvements in the labour market should be most visible between 2007 and2020, and starting from 2020 onwards only moderate increases in the participation rates andalmost constant structural unemployment rate were assumed.68
The overall outcome of the AWG calculations is that the decline in average pension levels inrelation to average wages and an increase in employment rates lead to a reduction in pension
67 Updates of current and prospective theoretical pension replacement rates 2006-2046,http://ec.europa.eu/social/main.jsp?langId=en&catId=443&newsId=551&furtherNews=yes
68 Ageing Report 2009, p.99.

8/6/2019 Lisbon TF Final Report
http://slidepdf.com/reader/full/lisbon-tf-final-report 62/82
62
expenditure from 8.7 pp. of GDP to 2.4 pp. between 2007 and 2060. This presents us with asituation where pensions may be inadequate for some in certain Member States and theincrease in pension expenditure will need to be financed through higher contributions.
Member States can either accept this situation or may try to close the potential adequacy gap
by devoting more resources to pensions through shifts in the public finances. For instance astrategy of reduction of national debt would lead to lower expenditure on interest paymentsand would create some room for fiscal manoeuvre. However, pension expenditure would haveto compete with other ageing related expenditure needs, like healthcare or long-term care.
Another option, leading to achievement of both adequate and sustainable pensions would beto tap into the potential in the labour markets. Further increases in employment rates, goingbeyond what was assumed in the AWG calculations, could help reduce the tension in thetriangle of increasing contributions, declining expenditure. Redesign of contribution/benefitformulas and eligibility criteria have significantly underpinned work incentives for theindividuals.
Compared to the AWG assumptions of an almost 70% employment rate of the population 15-64 in 2060, an increase in the employment rate to 80% corresponding to creation of more than28 million employment and an equivalent reduction in the number of inactive in thepopulation would ease the pressure on public pensions by ¼. This could reduce the decline inadequacy or the expenditure growth. An additional effect of reducing the pressure by ¼would be achieved with an increase in employment rate of population aged 65-69 by 40pp.(shift of 12 million from the population of pensioners into employment).69
Increases in employment rates overall and of older workers can be achieved. The graph belowshows clearly that employment rates of older men declined substantially since the 1970, when
life expectancy was much lower than today. In 1970 there were more employed men aged 55-69 than today and more women aged 65-69. In contrast, employment rates of women aged 25-54 increased substantially by at least 25 pp.70 Attracting more people into the labour market inthe future will thus require reversal of the decline in employment of older people (especiallymen) observed after 1970 and reinforcement of the trend of increasing female employment.Through reforms, like increasing the retirement age, flexible retirement options andincreasing contributory periods needed for a full pension, and designing work incentives intopension schemes, there is scope to bring the effective retirement age in line with expectedincreases in life expectancy.
69 No AWG data for 65-69 age group employment rate available.
70
More detailed analysis can be found in the chapter 2 "Active ageing and labour market trends for olderworkers", Employment in Europe 2007 Report.

8/6/2019 Lisbon TF Final Report
http://slidepdf.com/reader/full/lisbon-tf-final-report 63/82
63
Figure 4.7 Employment rates by gender in the EU-15, 1970 and 2008
0
10
20
30
40
50
60
70
80
90
100
15-19 20-24 25-29 30-34 35-39 40-44 45-49 50-54 55-59 60-64 65-69 70-74 75+
% o
f a g e g r o u p p o p u l a t i o n
Men 1970 Men 2008 Women 1970 Women 2008 80%
Source: OECD. Stat database
Pension reforms have coincided with changes in the labour market. Improving the ability andthe opportunities on the labour market for senior workers to be maintained in employment iskey. As shown in the section 3, short-term and part-time employment contracts, which usuallyoffer lower wages than permanent full-time employment, are becoming more widespread onthe European labour market. In consequence, a growing number of individuals rely ontemporary or part-time employment and do not earn sufficient income to avoid poverty at theold age.
Recent improvements in the labour market have not been spread evenly between differentcategories of the labour force. Along with the rise in female participation, the employment of older workers has been one of the most dynamic components of the EU labour market inrecent years. In total, between 2000 and 2006, the employment rate of people aged 55–64 roseby 7 percentage points at EU-25 level. In terms of skill levels, however, employment rateincreases for those aged 55–64 have been greatest for the medium-skilled, for whomemployment rates have increased by 7.2 percentage points between 2000 and 2006, exceedingeven the increase for the high-skilled (5.8 percentage points). In contrast, the improvement
has been more limited for low-skilled older workers for whom employment rates have risenby less than 5 percentage points during this period71. Also as shown before, increasingunemployment in conjunction with recent reforms that strengthened the link betweencontributions and benefits will significantly affect the adequacy of pensions for some.
Demographic ageing put an evident pressure on pension systems. It has made clear the needto sustain adequate social protection systems and with affordable levels of expenditure.Stronger link between contributions paid to and benefits received from pension schemes hassignificantly underpinned work incentives for the individuals. The adequacy andsustainability of pensions have thus become contingent on the economy and labour market's
71 Ibidem.

8/6/2019 Lisbon TF Final Report
http://slidepdf.com/reader/full/lisbon-tf-final-report 64/82
64
ability to generate an increasing amount of quality jobs that enables more people to workmore and longer. Only if growth and job processes are able to deliver that, can sustainablepensions also become adequate.
While pension reforms help pension systems achieve long term financial sustainability, if
adequacy and sustainability of pensions is to be achieved, there is a need to increaseemployment rates and the quality of employment for all socio-economic groups.
4.3. Reconciling ageing, health expenditure and inequalities to sustain growth and
employment
The social OMC has proven to provide good means to advance our understanding of healthcare reforms and promoting a learning process. The work in this area has highlighted anumber of issues of relevance for the Lisbon Strategy of employment and growth.
4.3.1. Healthcare has contributed to considerable improvements in population health
Health and long-term care systems are the second biggest social protection component and theavailability, affordability and quality of care can strongly influence the likelihood of overcoming disease, avoiding mortality and ensuring independent living. The considerableimprovement in the health status of the EU population in recent decades has been associatedwith more widely available healthcare i.e. a rising share of resources devoted to healthcaresystems and a more equitable distribution of these resources. For example, recent evidence forsome Member States suggests that increased expenditure on health can lead an increase in thenumber of years in good health72.
4.3.2. And a healthy workforce is needed to ensure high productivity and longer working
lives
It has also been recognised that good health contributes to economic prosperity throughimproving labour market participation and improving productivity as well as increasingparticipation in other societal activities. High levels of population health and longer, healthierlives are crucial in the context of an ageing population to allow for longer working lives.Reducing unnecessary and premature death and disease can make a contribution to meetingthe Lisbon goals of employment and growth and achieving Europe's full potential forprosperity. On the other hand, there is some evidence that longer active lives may also have apositive effect on health73.
4.3.3. However, there are large gaps in health between and within countries…
Very large gaps in the average level of health exist between different EU Member States andbetween social groups within Member States and have widened in recent decades. BetweenEU Member States there is a 14 year gap in life expectancy at birth for men and an 8 year gap
72 http://ec.europa.eu/health/ph_information/indicators/lifeyears_en.htm 73 Exploring the synergy between promoting active participation in work and in society and social, health and
long-term care strategies,http://ec.europa.eu/employment_social/spsi/docs/social_protection/final_report_en.pdf

8/6/2019 Lisbon TF Final Report
http://slidepdf.com/reader/full/lisbon-tf-final-report 65/82
65
for women74. Within Member differences in life expectancy at birth between lowest andhighest socio-economic groups can reach 10 years for men and 6 years for women75.
Figure 4.8 Life expectancy gaps and health expenditure as a percent of GDP in the EU
Source: Eurostat and OECD Health Data 2009
4.3.4. … due to various access barriers that are more severe for lower socio-economic
groups
Not all groups have benefited in the same way from the economic progress that delivers betterhealth through better living and monetary conditions and from the availability andimprovements in key services such as healthcare (health promotion, disease prevention,treatment and rehabilitation). Various barriers to access can be identified. It can also beshown that the larger the within-country health inequalities, the lower the overall population
health. Also, those countries with the lower overall population health and higher within-country health inequalities are those with higher inequities in access to care and thosespending the least on health care. Hence, improvements in access to timely and effectivehealthcare can have an impact on reducing mortality and disease in lower socio-economicgroups and, as a consequence, improve the overall population health status. In some countriesthere may be a case of under resourcing requiring higher investments in healthcare.
4.3.5. …and which have important economic implications
Importantly, high levels of poor health in sections of the EU population imply substantialopportunity costs for the Union as they are detrimental to employment, productivity and
growth. Avoidable ill-health also puts unnecessary pressure on public budgets. The presenceof such large gaps in health therefore also calls for greater effectiveness of healthcare deliveryand a rethinking of priorities in this sector.
74 Monitoring progress towards the objectives of the European Strategy for Social Protection and SocialInclusion, http://ec.europa.eu/employment_social/spsi/docs/social_inclusion/2008/omc_monitoring_en.pdf
75 http://ec.europa.eu/health/ph_determinants/socio_economics/keydo_socioeco_en.htm

8/6/2019 Lisbon TF Final Report
http://slidepdf.com/reader/full/lisbon-tf-final-report 66/82
66
4.3.6. In addition and paradoxically, expenditure has risen over time and ageing, technology
and growing expectations are creating further pressure on resources
Health and long-term care expenditure represent a significant share of GDP and is on asecular rise. There is some uneasiness about spending an ever growing share of GDP on
healthcare in view of ageing, technological development, growing patient expectations andincreased risky behaviour (for example, alcohol abuse or obesity in children and youngadults). This trend is enhanced, if combined with low economic growth, low labour marketparticipation and high unemployment which limit increases in revenues. Additionally, risinghealth expenditure has appeared to have contributed relatively little to a reduction in healthinequalities.
4.3.7. Hence, improving the value for money of healthcare systems through enhancing
effectiveness, efficiency and priority setting have been deemed an urgent task.
There are no simple solutions and strategies need to be tailored to national features. The 2007
and 2009 joint reports highlight some win-win solutions i.e. reforms that can improve accessor quality of healthcare as well as its sustainability including:
• Encouraging the use of primary care, strengthening referral systems and improvingcare coordination.
• Managing the introduction of new technology through technology assessment andevidence-based medicine.
• Promoting healthy life-styles and enhancing disease prevention activities.
On the other hand, important trade-offs between access or quality on one hand and financialsustainability on the other have also been identified including in relation to increasing cost-
sharing, patient choice and competition in the sector.
4.3.8. Long-term care has been deemed a social risk and an important social protection
issue in view of an ageing population
Ageing will increase the pressure on the services to provide more and better medical care andmore rehabilitative, nursing and social care. Long-term care provision is currently insufficientand the barriers to accessing long-term care services are more severe than in the case of healthcare. Member States therefore want to ensure adequate and sustainable fundingstructures for current and future long-term needs. Such arrangements need to be coupled withhealthy life-styles at old ages and strategies to keep an elderly population active.
4.3.9. Health and long-term care services are dependent on sufficient numbers of both high
and low skilled staff and represent an opportunity for job creation in the care sectors
The healthcare and long-term care sectors are labour intensive and together employ asignificant proportion of the population. As a result of ageing, patients' needs are likely torequire increases in staff numbers. Yet, as more and more care professionals reach theretirement age it has become increasingly difficult to replace them. In some EU countriesageing is coupled with brain-drain to richer countries. These emerging staff shortages canaggravate access problems but also threaten the financial sustainability of the services. Ahuman resources development strategy involving economic, employment and social policiesis required to the sector to ensure sufficient recruitment, retention and motivation.

8/6/2019 Lisbon TF Final Report
http://slidepdf.com/reader/full/lisbon-tf-final-report 67/82
67
The modernisation of healthcare and long-term is therefore an area where Member States canbenefit from information and best-practice exchange and where there is room to improve thelinks between economic, employment, social and health policy.
4.4. Concluding remarks
Past decades of reforming social protection systems have improved their long-term financialsustainability. However, there remain issues to be resolved and concerns about the access andadequacy of benefits persist. Higher employment rates, longer working lives, and increasedhealthy life expectancies will play an important role in ensuring both adequacy andsustainability of social protection. In the case of pensions this would apply to funded as wellas pay-as-you-go schemes. Efforts to modernise all functions of social protection should besustained in order to ensure effective access to quality services for all, notably in health carewhere modernisation can improve the health of the work force and contribute to the efficiencyof public expenditure.
Modernisation has happened also in other branches of social protection to improve coverageof new risks and improve responsiveness of the system, for example by increasingexpenditure of active labour market measures, or by addressing financial disincentives totake-up work or work more. Since modernising efforts have to continue in all the socialprotection functions to improve effective access for those that need it in a sustainable manner,it is vital to monitor all the different social protection benefit systems extensively.

8/6/2019 Lisbon TF Final Report
http://slidepdf.com/reader/full/lisbon-tf-final-report 68/82
68
5. PROVIDING ADEQUATE AND SUSTAINABLE SOCIAL PROTECTION OVER THE ECONOMIC
CYCLE
The Social Protection Committee has produced major pieces of analysis of social protection
systems under the perspective of universality and adequacy as well as modernisation andsustainability. The policy conclusions of such analysis are published in the Joint Reports onSocial Protection and Social Inclusion, the supporting material in a number of special studiesas well as in the supporting document underpinning the Joint Reports.
The downward swing in the economic cycle has accentuated the quest for adequacy andsustainability and the following emerges as key:
- the capacity of the EU social protection schemes to provide a protection looking at takinginto consideration the dimensions of universality and adequacy,
- the fiscal capacity to provide such protection through sound public finances, notablyreducing public debt.
5.1. The coverage and adequacy of EU social protection systems at the onset of the
crisis
The impact of the economic downturn on individuals in different Member States will varydepending not only on the force of the impact of the crisis in different countries, but also onthe past situation of the economy just before the crisis. Whilst the crisis can be seen as a sortof stress test for social protection systems, there is no comprehensive information on thecapacity to protect those affected by it. We can, however, look at the capacity of socialprotection systems to protect the individual and the ability of systems to provide protectionover a longer period of time. This section considers three central social issues:
unemployment, retirement and health care provision.A number of countries appear to be in a particularly fragile position to face the crisis. In thesecountries, at-risk-of-poverty and material deprivation rates were already high before thecrisis. Mapping the at-risk-of-poverty rate of the total population along with total socialprotection expenditure as a % of GDP gives a first indication of the importance of socialsecurity expenditure in reducing social vulnerability, but also of the efficiency at reducingpoverty of the social protection systems before the economic crisis. Generally speaking,higher expenditure on social protection is correlated with lower at-risk–of-poverty rates as inBE, DE, DK, FR, AT, NL, and SE. Similarly, the lowest spenders have higher at-risk-of-poverty rates for the total population, BG, EE, LT, LV, RO. This puts them in a position of
increased vulnerability, especially as the crisis hits these economies the hardest in terms of GDP growth and unemployment.

8/6/2019 Lisbon TF Final Report
http://slidepdf.com/reader/full/lisbon-tf-final-report 69/82

8/6/2019 Lisbon TF Final Report
http://slidepdf.com/reader/full/lisbon-tf-final-report 70/82
70
Figure 5.2 The percentage of unemployed receiving social transfers, 2006 and forecasted
unemployment rates in EU Member States, 2010
BE
CZ
DK
DE
EE
EL
ES
FR
IT
CY
LVLT
LU
HU
AT
PL
PT
SI
FI
SE
UK
IE
NL
SK
4.0
6.0
8.0
10.0
12.0
14.0
16.0
18.0
20.0
22.0
25 35 45 55 65 75 85 95
Percentage of unem ployed aged 25-59 receiving social transfers , 2006
U n e m p l o y m e n t r a t e 2 0 1 0 ( f o r e c a s t )
Source: LFS 2007, Commission Spring forecast 2009, EU-SILC 2007
Note: The perpendicular line depicts the EU average of the variable. The horizontal line depicts the EU averageof the unemployment rate in 2007. The dotted horizontal line depicts the forecasted unemployment rate in 2010.
5.1.2. Protecting the elderly
In light of the economic crisis, older people are also a vulnerable group as they have fewerpossibilities to affect their financial situation. Although pension reforms have helped lowerthe at-risk-of-poverty rates in many parts of the EU, in countries where elderly poverty isalready high the situation is, however, not likely to improve and cutbacks on pensions orindexation due to growing budget deficits can worsen the already poor relative economicsituation of current pensioners. Considering the strong impact of the financial crisis on privatepension funds, special attention must be paid to effects on the economic and social protectionprovided by these pensions now and in the future (Please also refer to section 3).
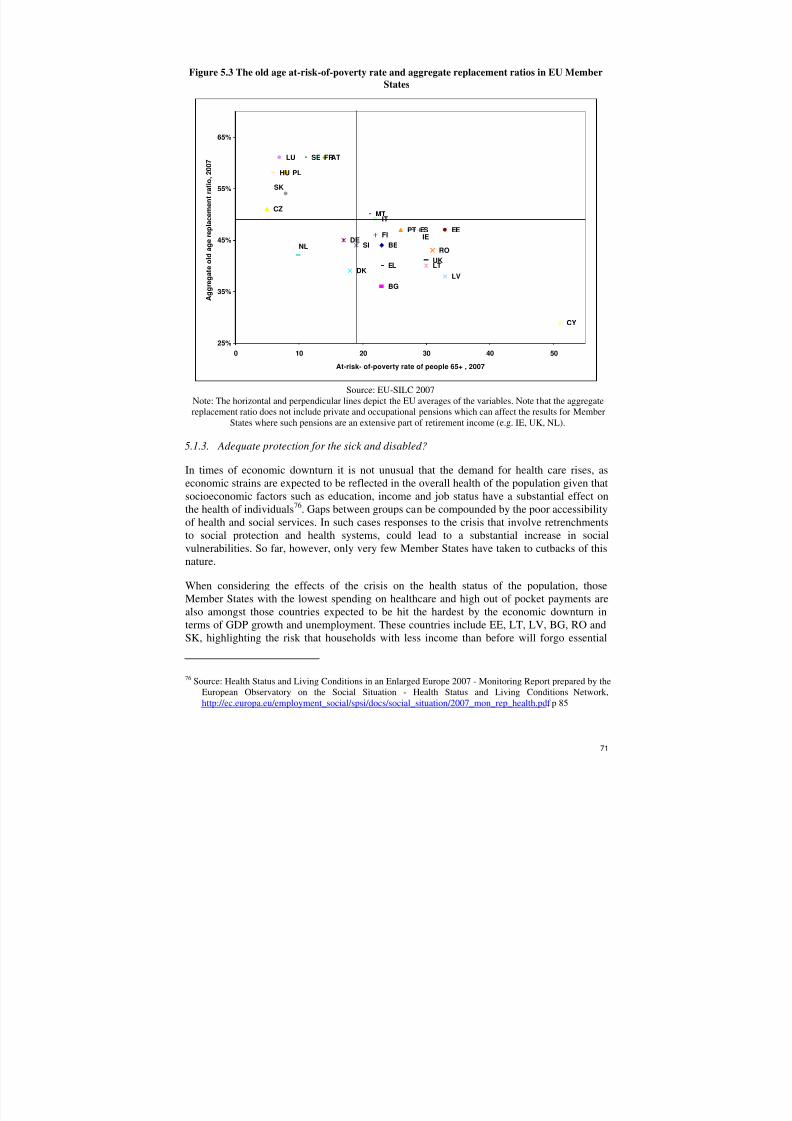
8/6/2019 Lisbon TF Final Report
http://slidepdf.com/reader/full/lisbon-tf-final-report 71/82
71
Figure 5.3 The old age at-risk-of-poverty rate and aggregate replacement ratios in EU Member
States
BE
BG
CZ
DK
DE
EE
EL
ES
FR
IT
CY
LV
LT
LU
HU
MT
AT
PL
PT
ROSI
FI
SE
UK
IE
NL
SK
25%
35%
45%
55%
65%
0 10 20 30 40 50
At-risk- of-poverty rate of people 65+ , 2007
A g g r e g a t e o l d a g e r e p l a c e m e n t r a t i o ,
2 0 0 7
Source: EU-SILC 2007
Note: The horizontal and perpendicular lines depict the EU averages of the variables. Note that the aggregate
replacement ratio does not include private and occupational pensions which can affect the results for MemberStates where such pensions are an extensive part of retirement income (e.g. IE, UK, NL).
5.1.3. Adequate protection for the sick and disabled?
In times of economic downturn it is not unusual that the demand for health care rises, aseconomic strains are expected to be reflected in the overall health of the population given thatsocioeconomic factors such as education, income and job status have a substantial effect onthe health of individuals76. Gaps between groups can be compounded by the poor accessibilityof health and social services. In such cases responses to the crisis that involve retrenchmentsto social protection and health systems, could lead to a substantial increase in socialvulnerabilities. So far, however, only very few Member States have taken to cutbacks of thisnature.
When considering the effects of the crisis on the health status of the population, thoseMember States with the lowest spending on healthcare and high out of pocket payments arealso amongst those countries expected to be hit the hardest by the economic downturn interms of GDP growth and unemployment. These countries include EE, LT, LV, BG, RO andSK, highlighting the risk that households with less income than before will forgo essential
76 Source: Health Status and Living Conditions in an Enlarged Europe 2007 - Monitoring Report prepared by the
European Observatory on the Social Situation - Health Status and Living Conditions Network,http://ec.europa.eu/employment_social/spsi/docs/social_situation/2007_mon_rep_health.pdf , p 85
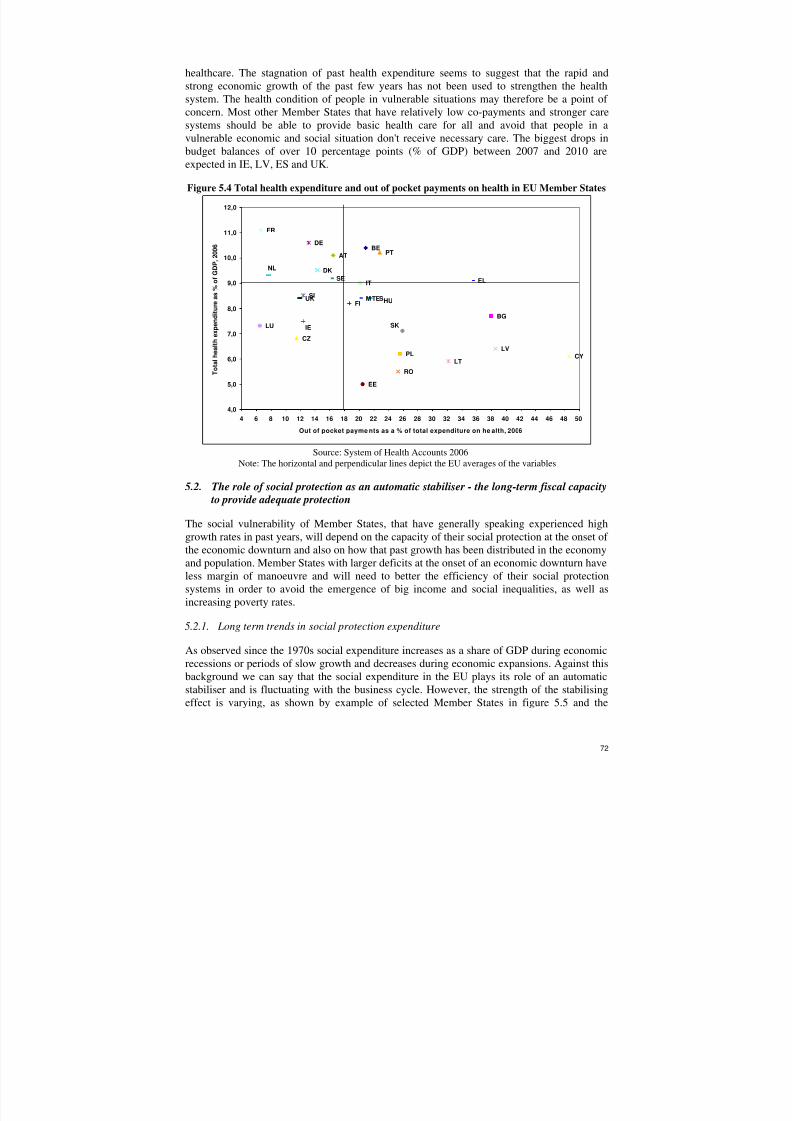
8/6/2019 Lisbon TF Final Report
http://slidepdf.com/reader/full/lisbon-tf-final-report 72/82
72
healthcare. The stagnation of past health expenditure seems to suggest that the rapid andstrong economic growth of the past few years has not been used to strengthen the healthsystem. The health condition of people in vulnerable situations may therefore be a point of concern. Most other Member States that have relatively low co-payments and stronger caresystems should be able to provide basic health care for all and avoid that people in a
vulnerable economic and social situation don't receive necessary care. The biggest drops inbudget balances of over 10 percentage points (% of GDP) between 2007 and 2010 areexpected in IE, LV, ES and UK.
Figure 5.4 Total health expenditure and out of pocket payments on health in EU Member States
BE
BG
CZ
DK
DE
EE
EL
ES
FR
IT
CYLV
LT
LU
HUMT
AT
PL
PT
RO
SI
FI
SE
UK
IE
NL
SK
4,0
5,0
6,0
7,0
8,0
9,0
10,0
11,0
12,0
4 6 8 10 12 14 16 18 20 22 24 26 28 30 32 34 36 38 40 42 44 46 48 50
Out of pocket payme nts as a % of total expenditure on he alth, 2006
T o t a l h e a l t h e x p e n d i t u r e a s % o f
G D P ,
2 0 0 6
Source: System of Health Accounts 2006
Note: The horizontal and perpendicular lines depict the EU averages of the variables
5.2. The role of social protection as an automatic stabiliser - the long-term fiscal capacity
to provide adequate protection
The social vulnerability of Member States, that have generally speaking experienced highgrowth rates in past years, will depend on the capacity of their social protection at the onset of
the economic downturn and also on how that past growth has been distributed in the economyand population. Member States with larger deficits at the onset of an economic downturn haveless margin of manoeuvre and will need to better the efficiency of their social protectionsystems in order to avoid the emergence of big income and social inequalities, as well asincreasing poverty rates.
5.2.1. Long term trends in social protection expenditure
As observed since the 1970s social expenditure increases as a share of GDP during economicrecessions or periods of slow growth and decreases during economic expansions. Against thisbackground we can say that the social expenditure in the EU plays its role of an automatic
stabiliser and is fluctuating with the business cycle. However, the strength of the stabilisingeffect is varying, as shown by example of selected Member States in figure 5.5 and the

8/6/2019 Lisbon TF Final Report
http://slidepdf.com/reader/full/lisbon-tf-final-report 73/82
73
responsiveness of expenditure to the economic cycle differs across Member States (pleasealso refer to annex 1 of the supporting document for disaggregated information on all EU 27).
Recent responsiveness of social protection systems to the business cycle partially determinestheir current capacity to protect people. Countries with more developed systems can afford toshow a higher degree of counter cyclicality in an economic boom as compared with countrieswhere the systems are still being expanded, meaning they can consolidate their fiscal budgetsto a greater extent. Countries with large, mature social security systems and balanced budgetswill thus have more budgetary room for manoeuvre at the onset of a recession and will have abetter possibility to protect those most vulnerable and those most affected by a downturn.
Over the last 50 years, notably between the early 1970s and the 1990s, we have seen astructural rise in the share of social protection expenditure as a percent of GDP in MemberStates.
There are several reasons behind this trend. First, social protection systems are maturing andcoverage is increasing. Second, new types of benefits are introduced – as happened with
family, child benefits and long-term care benefits. Third, demographic, social (e.g. evolutionof family structure) and structural economic changes can increase demand for socialprotection even in the context of constant set up of social protection systems. In particular, theincreased labour market participation of women and structural change towards a moreknowledge intensive economy shifted the demand for labour and resulted in an increasedprobability for low skilled workers to become unemployed and to rely on benefits(unemployment, sickness and invalidity, early retirement and also social assistance). Fourth,relative price trends as well as indexation rules can lead to long term increases or declines inthe share of GDP devoted to social protection – notably relevant in the health care area. Forinstance, between 1996 and 2006 the average annual price increases for health goods andservices in the EU 15 were 1.1 pp. higher than the HICP. Fifth, inefficiencies in provision and
lack of clear budget constraints and accountability can also contribute to long-termexpenditure rises as for example discussed in the joint Commission-OECD conference inSeptember 2008 on the efficiency of health care provision. Finally, we can observe ahysteresis effect as increases in short term unemployment might persist and lead to long termlabour market exclusion.
The last mentioned of these effects takes place when an economic downturn is over and theunemployed who do not reintegrate the labour market end up in the long-term unemploymentor they claim incapacity or early retirement benefits. For example, short term unemploymentin an economic downturn would generally lead to an increase in the take up of unemploymentbenefits. After an upswing these short term unemployed should return to the labour market. If
the dynamics of the labour market and social protection policies leads to people moving fromshort term unemployment into long-term benefit dependency this can lead to long termincreasing social expenditure and a lower degree of counter cyclicality in an economicrecovery period. This is the case when the unemployed are moved into other benefit systemsfrom which the return to the labour market is more restricted such as sickness, disability, andearly retirement schemes. This is often also a result of segmented labour markets that areclosed to certain groups.
Active labour market policies that coincide with active social protection policies can facilitatereturning individuals to the labour market and minimizing benefit dependency whiles stillprotecting the most vulnerable. Reforms have been made in a number of Member States in
recent years with regard to the eligibility rules in benefit systems and the financial incentivesfor individuals to return to the labour market. As an effect of this, in some cases combined

8/6/2019 Lisbon TF Final Report
http://slidepdf.com/reader/full/lisbon-tf-final-report 74/82
74
with a maturing of social protection systems, the rate of increase in social protectionexpenditure as a percent of GDP has slowed.
Figure 5.5 Trends in social protection expenditure in selected Member States
10
15
20
25
30
35
1 9 7 0
1 9 7 2
1 9 7 4
1 9 7 6
1 9 7 8
1 9 8 0
1 9 8 2
1 9 8 4
1 9 8 6
1 9 8 8
1 9 9 0
1 9 9 2
1 9 9 4
1 9 9 6
1 9 9 8
2 0 0 0
2 0 0 2
2 0 0 4
2 0 0 6
2 0 0 8
2 0 1 0
DE FR BE UK NL PT LV FI Forecast
Source: AMECO database, national data for FI
5.2.2. Automatic stabilisation is a key instrument to achieve output stabilisation
Automatic stabilization is the capacity of public finances to attenuate the consequences of economic shocks on the level of activity. In an expansive economy, tax revenue increasesmore quickly (provided they are progressive) and expenditure on employment and othersocial security benefits increase at a slower pace or even drop. The increase of taxes and thefall of benefits lead to a reduction of the growth. The initial increase in economic activity isthus reduced by the operation of these automatic stabilizers. The situation is symmetricalwhen the economy faces a deceleration or a recession.
It is often argued that automatic stabilisers may be preferable to discretionary policiesessentially since they are timely and more efficient. The magnitude of stabilisers dependsprimarily on the size of the government sector, but also on the composition of domesticexpenditures. A number of estimates of the capacity of stabilization of public finances in(large) European countries have been published showing that an average of around 20-25% of
economic fluctuations are smoothed through automatic stabilisers (between 15% and 35%,depending on Member States and estimates)77. In general, most components of socialprotection expenditures increase more quickly than GDP in periods of economic downturn,and more slowly than GDP in economic recovery. But, while unemployment expenditures areclearly among the most sensitive to changes in the economic conditions, the variability of social protection expenditures also reflects changes in other types of expenditures (with
77 Sources: Creel J. and Saraceno F. Automatic Stabilisation, Discretionary Policy and the Stability Pact, OFCE,working paper n° 2008-15; Van den Noord P. (2000),The Size and Role of Automatic Fiscal Stabilizers inthe 1990s and Beyond., OECD Economics Department Working Paper, n° 230.

8/6/2019 Lisbon TF Final Report
http://slidepdf.com/reader/full/lisbon-tf-final-report 75/82
75
significant variations between Member States covered). For example, in DK, FI, UKdisability benefits show strong variations in economic booms and troughs, whiles in ES, FR,UK variation is strong for expenditure on family benefits and social exclusion benefits in NL(Please also refer to chapter 2 1).
5.3. A lack of responsiveness can lead to a hysteresis effect and long term increases in
the level of social expenditure – a wide diversity of experiences in Member States
While the dynamics of expenditure and receipts are partly linked to the economic cycle, in thelonger run, a trend of increasing share of social protection expenditure in GDP can beobserved in the majority of Member States (Please refer to figure x above).
Social protection systems can be more or less responsive to the economic cycle. Firstly, somecases reveal that reactivity to the cycle can be escalated or hampered by the design of rules ongranting different kinds of benefits. Eligibility criteria and benefit levels clearly affect benefittake up behaviour. Secondly, the relationship of social protection expenditure with economicgrowth depends on how much the growth is creating employment. Moreover, there can be
also a time lag between the period of high economic growth and a rise in spending on socialprotection systems. In consequence, social protection expenditure could be insufficientlycountercyclical, or could leave less room for manoeuvre in the face of economic slowdown.
Although, often politically difficult, maintaining an anti-cyclical behaviour in social spendingeven as the economy enters a boom allow for room for manoeuvre in a recession. An anti-cyclical behaviour in public spending, especially on social expenditure, is an important part of rebounding an economy in recession. As GDP contracts, however, Government budgetbalances are often strained, therefore bringing to light the issue of how to finance increases inexpenditure whiles avoiding ballooning deficits. Increases in social protection expenditureshould be seen as part of a recovery package, rather than a permanent feature, thus acting as
an automatic stabiliser, and avoiding a hysteresis effect and high fiscal deficits which willthen accumulate over the years.
The country examples below attempt to show the past and current patterns of social protectionexpenditure in a number of Member States.
Denmark and Sweden: Tightened eligibility and benefit rules have helped reduce
hysteresis in social protection expenditure and have increased counter-cyclicality
In Denmark and Sweden, the social protection system is mature and historic time seriesshow that levels of social spending have increased every time unemployment rose and
decreased substantially afterwards. Looking closer at the components of social spending,it is possible to see that labour market reforms have led to a strong decline inunemployment benefits expenditure in response to the improvement of the economic andlabour market situation. However, in DK and SE disability benefits have shown anincreasing trend for a long time. In Sweden, for example, since the economic crisis of theearly 1990's the number of unemployed as well as those supported by different labourmarket measures erupted but has since declined. Instead a movement of people intosickness and disability schemes can be observed. This trend has now been reversed in thecase of SE through a tightening of eligibility criteria. In Denmark social protectionsystem was more responsive to the 2004-2007 economic recovery than to the 1998-2000one. It seems that constant reforms of the Danish welfare system brought positive results.
In both Member States strengthening the incentives for each individual person to work,increasing the employability of the workforce and improving the possibilities for the

8/6/2019 Lisbon TF Final Report
http://slidepdf.com/reader/full/lisbon-tf-final-report 76/82
76
employer to employ those at the margin of the labour market have helped to achieve agreater counter-cyclicality of social protection expenditure.
Figure 5.6 Trends in social protection expenditure in Denmark since 1990
0
2
4
6
8
10
12
14
16
1990 1991 1992 1993 1994 1995 1996 1997 1998 1999 2000 2001 2002 2003 2004 2005 2006
% o
f G D P
-2
0
2
4
6
8
10
12
Old age and survivors Sickness/Health care InvalidityUnemployment Unemployment rate - rhs Real GDP growth - rhs
%
Source: ESSPROS, Eurostat
Figure 5.7 The share of people aged 20-64 (measured as full-year equivalents) receiving benefits
from specified benefit systems in Sweden 1970-2007, percentage78
0%
5%
10%
15%
20%
25%
70 75 80 85 90 95 00 05
Unemployment
Labour market measures
Subsistance allowance
Sickness benefit and sick pay
Disability pension
Source: Swedish Ministry of Finance, Statistics Sweden
78 A full-year equivalent is equal to full benefit withdrawal for an entire year (365 days). Two persons with a 50
percent withdrawal rate for a full year equal to one person with full rate. The drawback of this measure isthat is underestimates the total share of individuals with benefits.

8/6/2019 Lisbon TF Final Report
http://slidepdf.com/reader/full/lisbon-tf-final-report 77/82
77
France: Curbing health care expenditure can improve the responsiveness of social
protection expenditure to the economic cycle
France shows an example of a country where despite the interdependence between theeconomic cycle and expenditure levels, social protection expenditure has been increasing.
Social protection expenditure has shown an upwards trend driven by health and old ageexpenditures, while other types of expenditures have been more responsive to economicdownturns than upturns. Since 1990, healthcare, pension, and social exclusion benefitsexpenditure has increased in relation to GDP, while unemployment benefits are relativelystable. Increases in social protection expenditure have been driven by dynamic growth inhealthcare and pension expenditure.
Figure 5.8 Trends in social protection expenditure in France since 1990
0
2
4
6
8
10
12
14
16
1 9 9 0
1 9 9 1
1 9 9 2
1 9 9 3
1 9 9 4
1 9 9 5
1 9 9 6
1 9 9 7
1 9 9 8
1 9 9 9
2 0 0 0
2 0 0 1
2 0 0 2
2 0 0 3
2 0 0 4
2 0 0 5
2 0 0 6
% o
f G D P
-2
0
2
4
6
8
10
12
14
Old age and survivors Sickness/Health care UnemploymentInvalidity Unemployment rate - rhs Real GDP growth - rhs
Source: ESSPROS, Eurostat
The Netherlands: Increasing financial incentives to work helps to decrease social
protection expenditure and to increase its counter-cyclicality
In the Netherlands, there is also a link between economic activity and employment onone side and social spending on the other side, showing that social protection expenditureis playing a role as an automatic stabiliser. The expenditure on unemployment and
invalidity benefits has been reduced notably in times of economic upswing increasing theanti-cyclical nature of social protection expenditure. This has been a result of policiesaimed at reducing the number of people on welfare systems by decreasing benefit levelsand supportive labour market measures, increasing financial incentives and opportunitiesto work. Old age, sickness and health expenditure in the Netherlands has on the otherhand increased continuously since 2000 which will be further augmented as thepopulation ages.

8/6/2019 Lisbon TF Final Report
http://slidepdf.com/reader/full/lisbon-tf-final-report 78/82
78
Figure 5.9 Trends in social protection expenditure in the Netherlands since 1990
0
2
4
6
8
10
12
14
16
1 9 9 0
1 9 9 1
1 9 9 2
1 9 9 3
1 9 9 4
1 9 9 5
1 9 9 6
1 9 9 7
1 9 9 8
1 9 9 9
2 0 0 0
2 0 0 1
2 0 0 2
2 0 0 3
2 0 0 4
2 0 0 5
2 0 0 6
% o
f G D P
0
1
2
3
4
5
6
7
8
Old age and survivors Sickness/Health care InvalidityUnemployment Unemployment rate - rhs Real GDP growth - rhs
%
Source: ESSPROS, Eurostat
5.4. Concluding remarks
Social protection systems can play a crucial role as automatic stabilisers and sustain the
productive capacity of the economy. However, Member States are in very different
positions to face the crisis. In some countries, there are significant weaknesses and
loopholes in social safety nets. In others with mature social protection systems that
cushion the impact of the crisis, financial sustainability is questioned in the long run.Countries faced with major public finance imbalances are left with little room for
manoeuvre to address the social consequences of the crisis. This raises particular
concern for those who also have weaker levels of protection.
Promoting labour market participation while improving the fairness, efficiency andeffectiveness of social spending will be crucial for all countries, both in view of ensuringcounter-cyclicality towards economic growth and addressing fiscal imbalances.
The analysis documents that Member States have taken steps towards reinforcing socialprotection systems that encourage activity and inclusion. However, it is also clear that good
economic performance is a precondition for well functioning social protection systems. Goodemployment performance has always been crucial for the sustainability of social protectionsystems but with ageing open labour markets that attract those who are still underrepresentedin employment are becoming essential. Hence, modernisation of social protection needs to gohand in hand with rapid progress with effective strategies for growth and more and better
jobs.

8/6/2019 Lisbon TF Final Report
http://slidepdf.com/reader/full/lisbon-tf-final-report 79/82

8/6/2019 Lisbon TF Final Report
http://slidepdf.com/reader/full/lisbon-tf-final-report 80/82
80
***Note: AWG projections figures include funded tiers of statutory schemes and statutory early retirement scheme.

8/6/2019 Lisbon TF Final Report
http://slidepdf.com/reader/full/lisbon-tf-final-report 81/82
81
Annex 2: Composition of the SPC – ISG Task Force on the Interaction of
Economic, Employment and Social Policies
Chair Raffaele TANGORRA SPC
Support team Coordination Isabelle ENGSTED-MAQUET
Ruth PASERMAN / Fritz VON NORDHEIMEC/EMPL E2EC/EMPL E4
Support team Asees AHUJA EC/EMPL E4
Support team Katia BERTI EC/EMPL E2
Support team Håkan NYMAN EC/EMPL E1
Support team Jakub WTOREK EC/EMPL E4
Member States
ISG Chair David STANTON ISG Chair
BE Muriel RABAU SPC
BE Rudi VAN DAM ISG
CZ Zuzana ZAJAROSOVA SPC
CZ Milos ZDENEK ISG
DK Ole KJAERGAARD / Josephine KRUSE ISG
DE Martin KOPPERNOCK SPC
DE Volker SCHMITT / Ulrich BIEBER ISG
EE Kaupo PALTSERI ISG
IE Paul MORRIN / Barry SOBEY ISG
EL Eric GAZON ISG
ES Aurelio FERNANDEZ / Dolores RUIZ BAUTISTA SPC Chair / SPC
FR Olivier BONTOUT / Guillaume DELAUTRE ISG
LT Grazina JALINSKIENNE SPC
NL Lauris BEETS / Aart Jan BETTE SPC
AT Hans STEINER / Andreas SCHALLER SPC
AT Christian KLOPF ISG
LU Tom DOMINIQUE ISG
PL Marzena BREZA ISG
PT Rute GUERRA / Gisela MATOS ISG
FI Tiina PALOTIE-HEINO ISG
SE Johanna MOLLERBERG SPC
SE Kristoffer LUNDBERG ISG
UK Aaron G. GRECH ISG
Observers
BE Tom BEVERS EMCO representative
Commission Fabiana PIERINI EC/ECFIN DDG-B3
Commission Jorge PINTO ANTUNES EC/SANCO C5
Commission Pascal WOLFF EC/ESTAT F3

8/6/2019 Lisbon TF Final Report
http://slidepdf.com/reader/full/lisbon-tf-final-report 82/82
Annex 3: Countries’ abbreviations
EU-27 European Union – 27 Member States
BE Belgium
BG BulgariaCZ Czech Republic
DK Denmark
DE Germany
EE Estonia
IE Ireland
EL Greece
ES Spain
FR France
IT ItalyCY Republic of Cyprus
LV Latvia
LT Lithuania
LU Luxembourg
HU Hungary
MT Malta
NL The Netherlands
AT Austria
PL Poland
PT Portugal
RO Romania
SI Slovenia
SK Slovakia
FI Finland
SE Sweden
UK The United Kingdom