Liquid Metal–Organic Frameworks - arXiv¶X-ray Science Division, Advanced Photon Source, Argonne...
22
Published as: Nature Materials, 2017, 16, 1149–1154, DOI: 10.1038/nmat4998 Liquid Metal–Organic Frameworks Romain Gaillac, †,‡ Pluton Pullumbi, ‡ Kevin A. Beyer, ¶ Karena W. Chapman, ¶ David A. Keen, § Thomas D. Bennett, *,k and François-Xavier Coudert *,† †Chimie ParisTech, PSL Research University, CNRS, Institut de Recherche de Chimie Paris, 75005 Paris, France ‡Air Liquide, Centre de Recherche Paris Saclay, 78354 Jouy-en-Josas, France ¶X-ray Science Division, Advanced Photon Source, Argonne National Laboratory, 9700 South Cass Avenue, Argonne, Illinois 60439, United States §ISIS Facility, Rutherford Appleton Laboratory, Harwell Campus, Didcot, Oxon OX11 0QX, United Kingdom kDepartment of Materials Science and Metallurgy, University of Cambridge, 27 Charles Babbage Road, Cambridge CB3 0FS, United Kingdom E-mail: [email protected]; [email protected] 1 arXiv:1704.06526v3 [cond-mat.mtrl-sci] 26 Oct 2017
Transcript of Liquid Metal–Organic Frameworks - arXiv¶X-ray Science Division, Advanced Photon Source, Argonne...

Published as: Nature Materials, 2017, 16, 1149–1154, DOI: 10.1038/nmat4998
Liquid Metal–Organic Frameworks
Romain Gaillac,†,‡ Pluton Pullumbi,‡ Kevin A. Beyer,¶ Karena W. Chapman,¶
David A. Keen,§ Thomas D. Bennett,∗,‖ and François-Xavier Coudert∗,†
†Chimie ParisTech, PSL Research University, CNRS, Institut de Recherche de Chimie Paris,
75005 Paris, France
‡Air Liquide, Centre de Recherche Paris Saclay, 78354 Jouy-en-Josas, France
¶X-ray Science Division, Advanced Photon Source, Argonne National Laboratory, 9700 South
Cass Avenue, Argonne, Illinois 60439, United States
§ISIS Facility, Rutherford Appleton Laboratory, Harwell Campus, Didcot, Oxon OX11 0QX,
United Kingdom
‖Department of Materials Science and Metallurgy, University of Cambridge, 27 Charles Babbage
Road, Cambridge CB3 0FS, United Kingdom
E-mail: [email protected]; [email protected]
1
arX
iv:1
704.
0652
6v3
[co
nd-m
at.m
trl-
sci]
26
Oct
201
7

Abstract
Metal–organic frameworks (MOFs) are a family of chemically diverse materials, with ap-
plications in a wide range of fields covering engineering, physics, chemistry, biology and
medicine. Research so far has focused almost entirely on crystalline structures, yet a clear
trend has emerged shifting the emphasis onto disordered states of MOFs, including “defective
by design” crystals, as well as amorphous phases such as glasses and gels. Here we introduce a
MOF liquid, a strongly associated liquid obtained by melting a zeolitic imidazolate framework
(ZIF), with retention of chemical configuration, coordinative bonding modes, and porosity of
the parent crystalline framework. We combine in-situ variable temperature X-ray, ex-situ neu-
tron pair distribution function experiments, and first principles molecular dynamics simulations
to study the melting phenomenon and the nature of the liquid obtained, focusing on structural
characterization at the molecular scale, dynamics of the species, and thermodynamics of the
solid–liquid transition.
2

Crystalline metal-organic frameworks have been proposed for application in a variety of situ-
ations which take advantage of their highly ordered and nanoporous structures, e.g. gas sorption
and separation,1–3 catalysis4 and ion transport.5 Inherent defects,6 structural disorder7 and near-
ubiquitous flexibility8 present significant challenges in the development of highly robust, selective
systems from perfect crystals. However, they also present opportunities, in creating functional “de-
fective by design” materials.9,10
Non-crystalline, or amorphous MOF systems are formed by avoidance of crystallization, or
induced collapse of crystalline systems by pressure, temperature, or ball-milling.11 In the case of
the zeolitic imidazolate framework (ZIF) family,12,13 which adopt similar structures to inorganic
zeolites and are formed from Mn+ (Mn+ = e.g. Li+, B+, Zn2+) inorganic nodes connected by Im
based (Im = imidazolate, C3H3N−2 ) ligands, such amorphous systems resemble the continuous ran-
dom network of amorphous SiO2. Recently, the formation of a molten ZIF state from a crystalline
phase was observed in an inert argon atmosphere. No mass loss was observed during the formation
of the liquid, which upon cooling yielded a melt-quenched glass, possessing an extended Zn–Im–
Zn coordination network.14 Unlike reversible solid–liquid transitions in 1D or 2D coordination
polymers which occur below 500 K,15 melting processes in ZIFs have only been observed at high
temperatures, i.e. those exceeding 700 K.
The novelty of the liquid and glass states means microscopic insight into the mechanism of
melting, and the nature of the liquid produced are of great interest when considering the generality
of the mechanism in the wider MOF family. However, thus far, the narrow temperature range and
poorly understood kinetics-time stability of the fleeting liquid phase have precluded information
on any liquid MOF state. Particularly salient and intriguing considerations pertaining to the liquid
involve (i) “memory” of the crystalline framework conferred by remnant framework connectivity,
(ii) coordinative framework dynamics and (iii) the proximity of structure to that of an ionic or a
strongly associated liquid.16 The ability to form hybrid “porous liquids”, analogous to that of the
organic systems of the Cooper and James groups,17 would present a significant advance in the
field, and help shift attention away from the solid state.
3

Motivated by the above questions and linking the MOF field to liquid, glass and polymer sci-
ence, we studied the melting of ZIF-4 via experimental and computational means. The dynamic
nature of the transition necessitated use of first principles molecular dynamics (FPMD) calcula-
tions, which have previously been successfully used in ionic liquid and disordered carbonate sys-
tems.18,19 Results were then combined with in-situ variable temperature X-ray and ex-situ neutron
pair distribution function (PDF) experiments to yield a complete picture of the melting process,
and, for the first time, an insight into the structure of a MOF-liquid.
Structural characterization upon heating and melting
We first studied the evolution in structure of ZIF-4, which is composed of Zn(Im)4 tetrahedra linked
by Zn–N coordinative bonds (Figures 1a,b), and forms a three dimensional, crystalline network
containing a maximum cavity diameter of 4.9 Å (Figure 1c). It shares a topology with that of
the mineral variscite, CaGa2O4, and a melting point of ca. 865 K has previously been identified,
though no atomistic modelling of experimental data has to date been performed on any MOF liquid
or glass.
A sample of ZIF-4 was prepared and evacuated according to previous literature procedures,20
and heated to 865 K in an argon tube furnace, before natural cooling to room temperature. Neu-
tron and X-ray total scattering data were then collected using the GEM Diffractometer at the ISIS
spallation source, and the Diamond Light Source, UK. Conversion to the respective Pair Distribu-
tion Functions (PDFs) was performed after data corrections (see Methods). Reverse Monte Carlo
(RMC) modelling was subsequently performed, using as a starting model a previous Zn–Im–Zn
continuous random network (CRN) configuration, arising from an amorphous, non-glass ZIF phase
(i.e. one which had not passed through the liquid state).21 No changes to the network topology
were necessary, and the resultant configuration is shown in Figure 1d. A good fit to the experimen-
tal structure factors was obtained (Figure 1e), which reproduces all salient features. This model
represents the first obtained using experimental data on a MOF-glass.
Synchrotron X-ray diffraction data were then used to evaluate structural changes in the glass
4

upon heating. Figure 1f shows the structure factor F(Q) recorded from the glass at temperatures of
304, 778, 796 and 856 K on heating — while the corresponding total pair distribution functions are
plotted in Figure S1. The experimental structure factor for the glass at room temperature is largely
similar to that previously reported,14 with no visible Bragg peaks. The PDF contains the expected
peaks at ca. 1.3 Å, 2 Å, 3 Å, 4 Å, and 6 Å, which correspond to C–C/C–N, Zn–N, Zn–C, Zn–N and
Zn–Zn pair correlations respectively.
Upon heating from 304 to 778 K, both intensity and position of the first sharp diffraction peak
(FSDP), centered at 1.1 Å−1 remained approximately constant, as was the case with other visible
features in the F(Q). However, further heating to 856 K resulted in a more pronounced intensity
reduction and shift in the position of the FSDP to 1.3 Å−1, along with a near-total disappearance of
any features at higher Q values. This is in stark contrast to the case of liquid silica, where negligible
changes in the FSDP upon melting are indicative of significant intermediate range order.22 The
changes in the F(Q) result in a significantly decreased Zn–Zn correlation peak in the corresponding
high temperature PDFs, centered on 6 Å (Figure S1).
To probe the evolution of the ZIF structure upon heating and liquid formation from a microsopic
point of view, we performed first principles molecular dynamics simulation (FPMD) by running
constant-temperature MD simulations at temperatures of 300, 600, 800, and up to 2,250 K.23 Be-
cause of the computational cost of FPMD, these simulations cannot be performed directly on the
glass model — the unit cell of which is prohibitively large. Instead, we used the ZIF-4 crystalline
phase as starting point, with the change in structure factor upon heating in good agreement with
the trends observed experimentally (Figure 1f). Similarly close agreement is also witnessed in the
variable temperature total pair distribution functions (see Figure S2).
Moreover, in addition to the total PDFs, we calculated from the MD trajectories the PDFs
for specific atom-atom correlations, which provide greater understanding of the salient real-space
structural movements. We plot in Figure 2a–c the partial radial distribution functions gi j(r) for Zn–
N, Zn–Im (where Im is the center of mass of the imidazolate group), and Zn–Zn pairs. In addition
to the overall thermal broadening of the peaks, there is a clear loss of long-range order at high
5

temperature. At intermediate temperatures (around 1,000 K), the system has liquid-like disorder,
with gi j(r) that do not go to zero after the first peak, though it retains some order at distances
larger than 10 Å. To characterize further this state, we plot in Figure 2d the generalized Lindemann
ratio,24 computed from the width of the first peak in the Zn–N and Zn–Zn partial radial distribution
functions. The usual criterion used to determine melting from the Lindemann ratio is between 10
and 15%, which indicates in our case a melting temperature between 1,000 and 1,500 K — and we
note that the Zn–Zn ratio shows a clear disruption in slope at 1,200 K.
Thermodynamics of melting
Approaching the phenomenon from a thermodynamic standpoint, we plot in Figure 2e the evolu-
tion of heat capacity CV as a function of temperature. We see a clear jump in the heat capacity, in-
dicative of a solid–liquid phase transition, from the value of the crystal phase (CV ≈ 2.2 J.g−1.K−1)
to a higher value for the ZIF liquid (CV ≈ 2.8 J.g−1.K−1). Integration yields an estimate for the
enthalpy of fusion of the ZIF of ∆Hfus = 173 J.g−1, which is in line with values for materials such
as quartz (∆Hfus = 146 J.g−1) and cristobalite (∆Hfus = 237 J.g−1).25
Since the melting of this supramolecular network is dependent upon partial dissociation and
reassociation of Zn–N coordination bonds, we used this distance as a reaction coordinate. From
the Zn–N partial radial distribution function, gZn–N(r), we calculated the potential of mean force
(PMF) between the two atoms at all temperatures, through the relation F(r) =−kBT lng(r). From
the resultant free energy profiles (Figure S3), we were then able to extract the temperature de-
pendence of the activation free energy (∆F‡) needed to break the Zn–N bond. It can be seen on
Figure S4 that ∆F‡ follows a van ’t Hoff law, ∆F‡(T ) = ∆H‡−T ∆S‡, with ∆H‡ ≈ 121 kJ.mol−1
and ∆S‡ ≈ 34 J.mol−1.K−1 constant in this temperature range.
The main contribution to the free energy barrier is thus energetic in nature, accompanied by a
minor entropic stabilisation. Moreover, the free energy barrier is still relatively high at the melting
temperature, with ∆F‡(T = 1,000 K) = 87 kJ.mol−1 = 10.5kBT . Hence, as in conventional solids,
melting occurs as a rare barrier-crossing event.26 Finally, comparison of the potential of mean force
6

for the Zn–Im coordinate with the PMF for Zn–N shows that breaking of the Zn–N bond is indeed
an entirely suitable choice of reaction coordination for this activated process: as shown in Table S1,
the thermodynamic parameters are almost identical in both cases.
Microscopic mechanism
Turning to a molecular level visualization of the melting process, we depict in Figures 3a and 3b
the distribution of Zn cation coordination numbers, as a function of temperature. The ideal four-
fold coordination is maintained at low temperatures up to 1,200 K, where more than 94% of the Zn
ions are coordinated by four imidazolate groups. In this regime, the under-coordination of Zn2+
can be seen as a defect in the solid, and its concentration is found (as expected, Figure S5) to be
proportional to nd ∝ exp(−ε/kBT ), where ε ≈ 56 kJ.mol−1 is the energy required for defect for-
mation. These “undercoordinated” zinc ions can act as nucleation sites for melting. Going to higher
temperature, the proportion of undercoordinated Zn2+ increases dramatically, e.g. at 1,500 K with
59% 4-fold coordinated, 39% in 3-fold coordination, and 2% in 2-fold coordination. In contrast,
we note that pentacoordination is almost nonexistent in our simulations.
Focusing on typical individual linker exchange events of zinc cations provided the mechanistic
picture shown in Figure 3d (snapshots from a FPMD simulation at 1,500 K): the melting process
takes place over a few picoseconds through a sequence of well-defined steps. From an initial four-
fold coordinated zinc, one imidazolate linker moves away and is then replaced by a neighboring
Im group with a dangling nitrogen lone pair. Inspired by Laage et al.’s statistical treatment of
the molecular mechanism of reorientation in liquid water,27,28 we averaged over all events during
a molecular dynamics trajectory to plot the average distance of the outgoing and incoming N
atoms during an exchange — taking the reference time t = 0 when both nitrogren atoms are at
equal distance from the zinc ion. This plot (Figure 3c) shows that the event is concerted and that
the exchange itself is rather fast, lasting less than 2 ps. This is very similar to what is seen for a
switch between hydrogen bond partners in liquid water, showcasing the similarities between this
and the ZIF liquid: both are strongly associated liquids forming a dynamic network with preferred
7

tetrahedral association.
We then calculated the frequencies at which the Zn–N bonds or Zn–Im linkages break. Plotting
the log of these frequencies against inverse temperature (see Figures S6 and S7) demonstrates the
Arrhenian behaviour of the system, reinforcing the idea that melting is driven by rare events dis-
turbing the network. We also note that the two activation energies for Zn–N and Zn–Im are very
close. Extrapolating to the melting temperature — where in the limited time window of our simu-
lations we cannot directly observe enough of these rare events to gather good statistics — shows
that the timescale at which bond breaking occurs becomes sub-nanosecond near the melting tem-
perature. As Table S2 shows, for any given zinc cation, we expect one coordinative bond breaking
every 143 ms at 300 K, every 58 ns at 600 K, and every 0.87 ns at 840 K. Moreover, looking at these
events in detail, we see that at low temperature, the majority of bond-breaking events leads to a
simple flip of the imidazolate linker, and do not result in exchange between two linkers (Table S3).
As temperature increases, this “local” motion of lower energy becomes dominated by events which
lead to linker exchange, and thus allows the ZIF to melt. Finally, we see that the duration of the
coordinative bond breaking and reformation is independent of temperature, and is only guided by
the timescale for approach of another imidazolate partner and local dynamics.
Characterization of the liquid ZIF
To characterize the dynamics of the ZIF in the liquid phase, we calculated from our FPMD the
translational diffusion of both zinc cations and imidazolate anions. The plots of mean square dis-
placement over time, shown in Figure 4a and 4b, clearly show diffusive behaviour at temperatures
above 1,200 K, i.e. in the liquid phase. The translational diffusion of zinc and imidazolate are
clearly linked strongly, as the coefficients are very similar (see Table S4): for example, at 1,500 K
we have DIm = 7.7 10−10 m2.s−1 and DZn = 6.5 10−10 m2.s−1. This is yet another sign of the
strongly associated nature of the liquid. Moreover, the translational diffusion coefficients over tem-
perature follow an Arrhenius law (see Figures S8 and S9), compatible with a jump-like diffusion
of “partner exchange” events.28 The activation energies for Zn and Im respectively are found to
8

be 105 kJ.mol−1 and 102 kJ.mol−1 respectively. The rotational diffusion of imidazolate cycles can
also be measured, where we choose to follow rotation around the N–N axis and the associated an-
gle θ . Orientational diffusion happens at lower temperatures than translational diffusion, starting
around 800 K, and can be associated with an activation energy three times lower (≈ 40 kJ.mol−1).
At intermediate temperatures, before melting, there thus exists a regime of free rotation of the
imidazolate linkers.
Given the focus on porosity in MOFs, we investigated the nature of the liquid ZIF from a struc-
tural point of view. We performed statistical analysis of the instantaneous porosity along FPMD
trajectories at all temperatures — using a geometric criterion for the determination of porosity and
a probe diameter of 2.4 Å, corresponding to the kinetic diameter of helium. The evolution of the
pore volume distribution is depicted in Figure 4c, from 300 K to higher temperatures. As expected
for the solid phase (T < 1,200 K), a slight broadening of the distribution is observed, which corre-
sponds to increased thermal motion. However, at higher temperatures and particularly in the liquid
phase, we see that the porosity is maintained overall, with only a slight deviation in average to
lower pore volumes. This result, obtained in constant-volume simulations performed at densities
inferred from the experimentally available data, were confirmed by shorter constant-pressure sim-
ulations. We thus conclude that, even at very high temperatures, the ZIF forms a hybrid “porous
liquid”, quite different in nature from the organic systems recently reported,17 which are formed
from cage molecules providing a well-defined pore space in solvents whose molecules are too
bulky to enter the pores.29,30 This finding is in agreement with the available experimental data on
the free volume of ZIF glasses.31
To link the predicted liquid structure to experimental information, we performed Reverse Monte
Carlo (RMC) modelling on the X-ray total scattering data collected at 856 K (Figure 1f). The atom-
istic configuration derived for the glass in Figure 1d was used as a starting model, with a reduced
density to reflect the changes upon melting. The final configuration is shown in Figure 4d, along
with the fit to the experimental X-ray structure factor (Figure S10). Whereas the internal surface of
the glass at ambient temperature was calculated to be 4.8%, again using standard probe diameter
9

of 2.4 Å, that of the liquid at 856 K increased to 16.2%. Whilst transient in nature, linked voids
appear irregularly distributed throughout the configuration.
Perspectives
In this work, we introduce the general term “MOF liquid”, for a liquid formed from the melting of
a MOF, due to the retention of chemical configuration and coordinative bonding modes between
the solid and liquid phases. Importantly, we show the retention of porosity in the liquid state, with
a pore volume larger than in the glass state, making liquid ZIF-4 a rare example of an intrinsically
porous liquid. The demonstration and rationalization of melting in ZIF-4 provides a prototypical
example in this new area, and a foundation on which further studies can be based, thus opening
the way to the identification (or design) of MOFs with reduced melting temperatures and increased
porosity. Chemically tunable MOF liquids with tailored properties reminiscent of crystalline struc-
tures will prove accessible through modification of inorganic centers and linker functionalization,
length and shape — similar to those routinely used in the design and synthesis of MOF crystal
structures. Such materials would be of interest for liquid phase separations, homogeneous catal-
ysis and ion transport, alongside as an intermediary state in the formation of mechanically and
thermally stable MOF glasses retaining porous characteristics.
10
NN
–
Zn2+
4
+
-0.3
0.0
0.3
0.6
0.9
F(Q
)
304K778K796K856K
-0.1
0.5
1.1
1.7
2.3
2.9
1.0 2.0 3.0 4.0 5.0 6.0 7.0 8.0 9.0
F(Q
)
Q (Å -1 )
300K900K
1500K2250K
10.0 15.0 20.0 25.0
FX(Q
)
5.0
Q (Å–1)
a b e
fdc
10.0 20.0 30.0 40.0-0.4
0.8
0.0
0.4
0.6
0.2
-0.2
Q (Å–1)5.0 15.0 25.0 35.0
FN
(Q)
ExperimentRMC Fit
-0.8
-0.4
0.0
0.4
0.8
Q (Å–1)
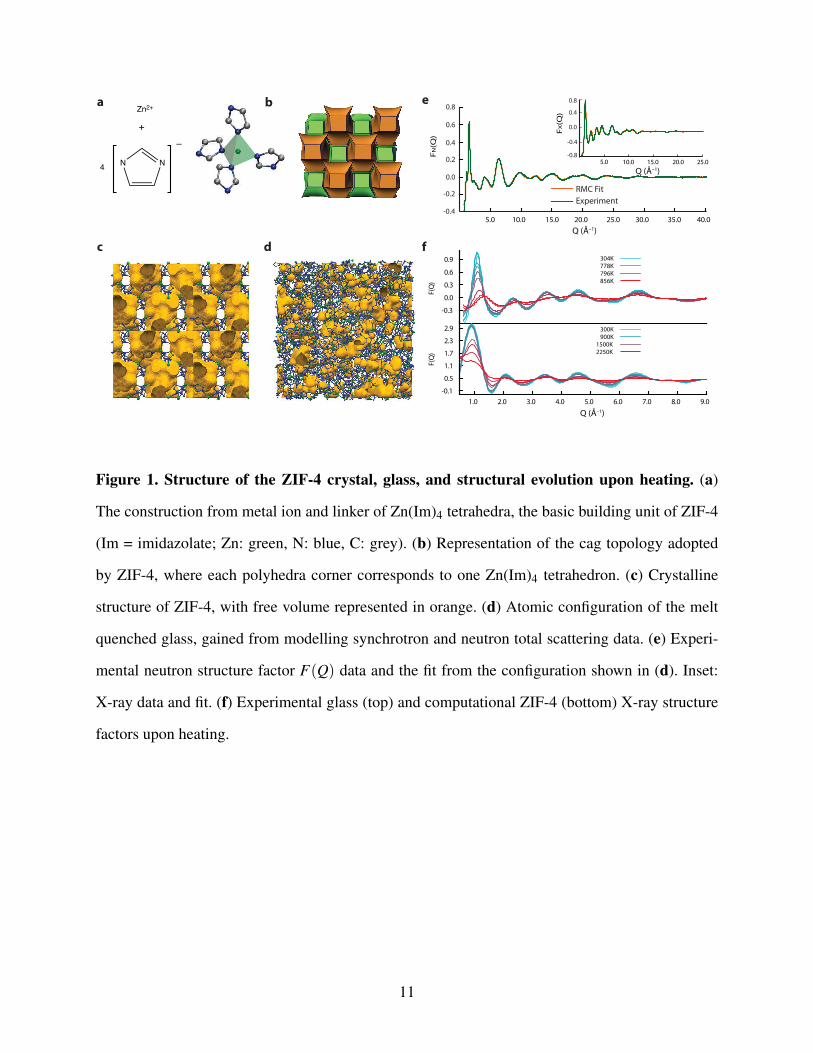
Figure 1. Structure of the ZIF-4 crystal, glass, and structural evolution upon heating. (a)
The construction from metal ion and linker of Zn(Im)4 tetrahedra, the basic building unit of ZIF-4
(Im = imidazolate; Zn: green, N: blue, C: grey). (b) Representation of the cag topology adopted
by ZIF-4, where each polyhedra corner corresponds to one Zn(Im)4 tetrahedron. (c) Crystalline
structure of ZIF-4, with free volume represented in orange. (d) Atomic configuration of the melt
quenched glass, gained from modelling synchrotron and neutron total scattering data. (e) Experi-
mental neutron structure factor F(Q) data and the fit from the configuration shown in (d). Inset:
X-ray data and fit. (f) Experimental glass (top) and computational ZIF-4 (bottom) X-ray structure
factors upon heating.
11

2
2.2
2.4
2.6
2.8
3
400 600 800 1000 1200 1400 1600 1800 2000
Hea
t cap
acity
(J g
–1 K
–1)
Temperature (K)
0
0.05
0.1
0.15
0.2
0.25
0.3
0.35
500 1000 1500 2000
Lind
eman
n ra
tio
Temperature (K)
Zn-N peak
Zn-Zn peak
Lindemann melting criterion
0.0
1.0
2.0
3.0g Zn
–Im
(r)
0.0
1.0
2.0
3.0
0.0
1.0
2.0
3.0
2 4 6 8 10 12 14
300 K
r (Å)
900 K1500 K2250 K
g Zn–N
(r)
g Zn–Z
n(r)
a
b
c
300 K900 K
1500 K2250 K
300 K900 K
1500 K2250 K
d
e
Zn–Zn
Zn–N
Zn–Im
Figure 2. Computational data from ZIF-4 melting: structure and thermodynamics. (a–c) Evo-
lution of the partial radial distribution function gi j(r) for (a) Zn–Im distances (where Im is the
center of mass of the imidazolate group), (b) Zn–N distances, (c) Zn–Zn distances, at temperatures
going from 300 K (light blue) to 2,250 K (red). (d) Generalized Lindemann ratio ∆, quantifying
the liquid nature of the system, as a function of temperature, calculated for Zn–Zn (green) and
Zn–N (blue) interatomic distances. The red horizontal line represents the “critical ratio” indicated
in the literature at 10% or 15% (the value chosen here). (e) Evolution of the heat capacity with
temperature.
12

–4 –2 0 2 4Time (ps)
2
3
4
5
6
7
8
Dis
tanc
e(Å
)
Zn-N bond cleavageZn-N bond formation
3.0
3.2
3.4
3.6
3.8
4.0
4.2
Co
ordi
natio
nnu
mb
er
Zn coordination number
Zn coordination at 300 K
0%
20%
40%
60%
80%
100%
0 1 2 3 4 5
Coordination number
300 K600 K800 K900 K
1000 K1200 K1500 K1750 K2000 K2250 K
0%
20%
40%
60%
80%
100%
500 1000 1500 2000
Temperature (K)
5-fold4-fold3-fold2-fold1-fold0-fold
a b c
d
4-fold Zn2+
coordination
fluctuation
Im groupleaving
undercoordinated Zn2+
another Imapproaching
4-fold Zn2+
coordination
~ 400 fs
Figure 3. Molecular mechanism of ZIF-4 melting. (a) Distribution of zinc coordination numbers
as a function of temperature, from 0-fold coordinated (red) to 4-fold (light blue). 5-fold coordina-
tion is indicated in black, but is close to the temperature axis. (b) Temperature evolution for each
degree of coordination of zinc cations. Temperatures range from 300 K (light blue) to 2,250 K (red).
(c) Behaviour during an exchange of a nitrogen atom by another nitrogen atom, in the first coor-
dination sphere of a zinc cation, averaged over all such events (all exchanges on all zinc cations).
The distance between the incoming nitrogen and the zinc is plotted in red, and that between the
outgoing nitrogen and the zinc in blue. The green curve corresponds to the average coordination
number of the zinc cation involved in the exchange. The flat dashed lines are the average coordina-
tion number over the whole simulation at 300 K (light blue) and 2,000 K (green). (d) Visualization
of a representative imidazolate exchange event. Zn: green, N (initially coordinated): light blue, N:
blue, N (coordinated after exchange): orange, C: grey.
13

20 40 60 80
300 800
1300 1800
2300
10%
20%
30%
40%
Rela
tive
prop
ortio
n
Porous volume (cm3.kg–1)
Temperature (K) 0.1
1
10
Zinc
MSD
(Å2 )
800 K1200 K1500 K
0.1
1
10
0 2 4 6 8 10
Imid
azol
ate
MSD
(Å2 )
Time (ps)
800 K1200 K1500 K
a
b
c
0 2 4 6 8 10Time (ps)
d
Figure 4. Structure and dynamics in the ZIF liquid. (a-b) Mean square displacement (MSD)
as a function of time for (a) zinc cations and (b) the center of mass of the imidazolate linkers,
plotted in logarithmic scale, for temperatures ranging from 300 K (light blue) to 2,250 K (red).
Dashed curves represent fits of the MSD (excluding short times) for lower temperatures, showing
the absence of diffusive behaviour. (c) Temperature evolution of the distribution of the total pore
volume, determined for a standard probe of radius 1.2 Å. The average pore volume takes the fol-
lowing values: 52 cm3.kg−1 at 300 K, 49 cm3.kg−1 at 2,000 K, and 41 cm3.kg−1 at 2,250 K. (d)
Atomic configuration of the ZIF melt, gained from Reverse Monte Carlo modelling of the total
scattering data collected at 856 K. Free volume is represented in orange, Zn atoms in green, N in
blue, and C in grey.
14
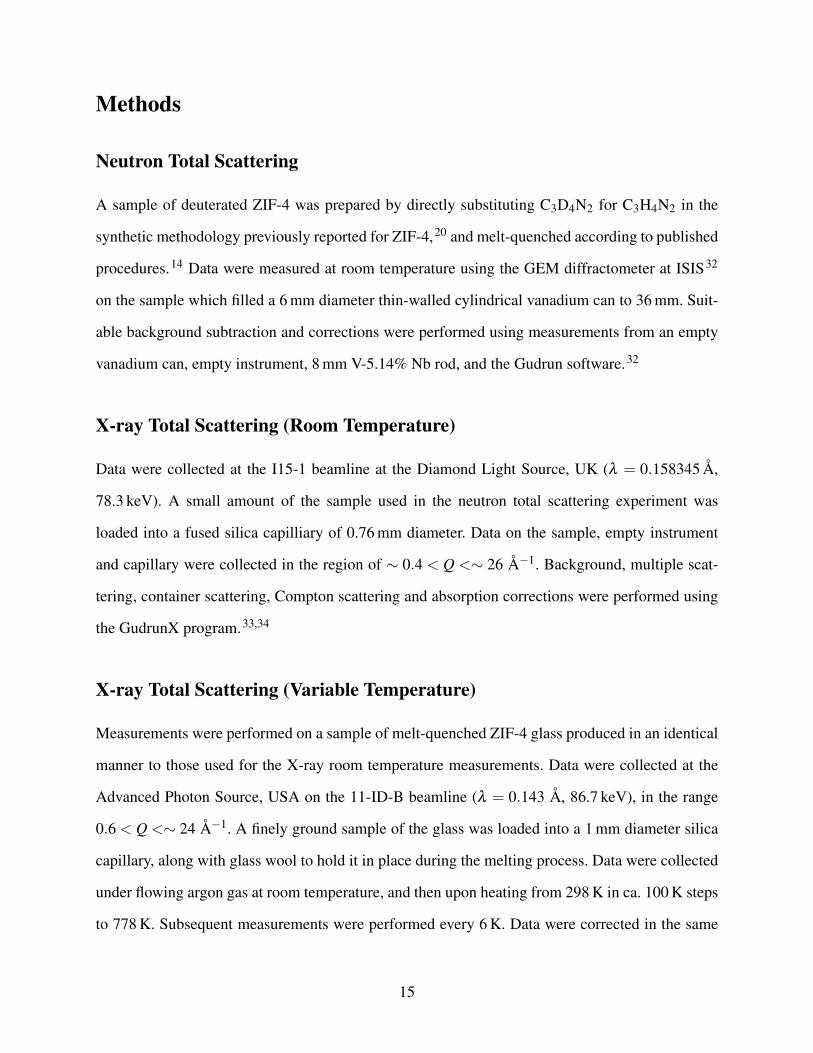
Methods
Neutron Total Scattering
A sample of deuterated ZIF-4 was prepared by directly substituting C3D4N2 for C3H4N2 in the
synthetic methodology previously reported for ZIF-4,20 and melt-quenched according to published
procedures.14 Data were measured at room temperature using the GEM diffractometer at ISIS32
on the sample which filled a 6 mm diameter thin-walled cylindrical vanadium can to 36 mm. Suit-
able background subtraction and corrections were performed using measurements from an empty
vanadium can, empty instrument, 8 mm V-5.14% Nb rod, and the Gudrun software.32
X-ray Total Scattering (Room Temperature)
Data were collected at the I15-1 beamline at the Diamond Light Source, UK (λ = 0.158345 Å,
78.3 keV). A small amount of the sample used in the neutron total scattering experiment was
loaded into a fused silica capilliary of 0.76 mm diameter. Data on the sample, empty instrument
and capillary were collected in the region of ∼ 0.4 < Q <∼ 26 Å−1. Background, multiple scat-
tering, container scattering, Compton scattering and absorption corrections were performed using
the GudrunX program.33,34
X-ray Total Scattering (Variable Temperature)
Measurements were performed on a sample of melt-quenched ZIF-4 glass produced in an identical
manner to those used for the X-ray room temperature measurements. Data were collected at the
Advanced Photon Source, USA on the 11-ID-B beamline (λ = 0.143 Å, 86.7 keV), in the range
0.6 < Q <∼ 24 Å−1. A finely ground sample of the glass was loaded into a 1 mm diameter silica
capillary, along with glass wool to hold it in place during the melting process. Data were collected
under flowing argon gas at room temperature, and then upon heating from 298 K in ca. 100 K steps
to 778 K. Subsequent measurements were performed every 6 K. Data were corrected in the same
15

manner as the room temperature X-ray measurements.
Reverse Monte Carlo Modelling
To produce the structural configuration of the melt quenched glass, The RMCProfile software35
was used to refine an atomistic starting model for an amorphous, non melt-quenched ZIF described
previously,21 against the neutron and X-ray F(Q) and neutron PDF room temperature data. The
resultant configuration was then used as a starting input model for RMCProfile, and refined against
the variable temperature X-ray data collected, in order to produce the configuration for the liquid
ZIF. The density of the model was adjusted to match that determined experimentally for the glass
and liquid phases.
First principles molecular dynamics
The behaviour of zeolitic imidazolate frameworks as a function of temperature was studied by
means of density functional theory (DFT)-based molecular dynamics (MD) simulations, using the
Quickstep module36 of the CP2K software package.37 We used the hybrid Gaussian and plane
wave method GPW38 as implemented in CP2K. The simulations were performed in the constant-
volume (N,V,T ) ensemble with fixed size and shape of the unit cell. A timestep of 0.5 fs was used
in the MD runs, the temperature was controlled by velocity rescaling.39
The unsually large temperature at which the simulations were performed requires careful fine-
tuning of the simulation protocol. In particular, the exchange-correlation energy was evaluated in
the PBE approximation,40 and the dispersion interactions were treated at the DFT-D3 level.41 The
Quickstep module uses a multi-grid system to map the basis functions onto. We kept the default
number of 4 different grids but chose a relatively high plane-wave cutoff for the electronic density
to be 600 Ry, as already used in Ref. 42, and a relative cutoff (keyword REL_CUTOFF in CP2K)
of 40 Ry for high accuracy. Valence electrons were described by double-zeta valence polarized
basis sets and norm-conserving Goedecker–Teter–Hutter43 pseudopotentials all adapted for PBE
(DZVP-GTH-PBE) for H, C and N or optimized for solids (DZVP-MOLOPT-SR-GTH) in the case
16

of Zn.
The unit cell studied for ZIF-4 (space group Pbca) is the orthorhombic primitive unit cell,
which contains 272 atoms, with cell parameters a = 15.423 Å, b = 15.404 Å, c = 18.438 Å, and
α = β = γ = 90°. Representative input files for the molecular dynamics simulations are available
as supporting information, and online in our data repository at https://github.com/fxcoudert/
citable-data.
Trajectory analysis
The Lindemann ratio ∆ is computed from the width of the first peaks in the different partial ra-
dial distribution functions as a measure of the fluctuation of atomic positions and interparticular
distances:
∆ =FWHM
d0(1)
where FWHM is the full width at half maximum of the first partial radial distribution function peak
(estimated by a Gaussian fit) and d0 corresponds to the mean interatomic distance (calculated as
the maximum of the first peak), i.e. d0 = 5.95 Å for Zn–Zn and d0 = 2.0 Å for Zn–N.
The coordination number for nitrogen atoms around the zinc cation is computed by taking
a cut-off radius of 2.5 Å, a value chosen from the Zn–N partial radial distribution function at
room temperature. We checked that the precise value used does not influence the outcome of the
calculations, nor does the choice of a discontinuous criterion (vs. the use of a damping function
near the cut-off value).
From the MD simulations, we can extract the internal energy U(T ) as the average of the total
energy of the system. From these values we can then calculated the heat capacities CV (T ) by finite
differences:
Cv
(T1 +T2
2
)=
U(T2)−U(T1)
T2−T1(2)
where T1 and T2 are two successive temperatures in our series of simulations. Furthermore, we
can estimate the enthalpy of fusion by writing the energy difference in heating the system from
17

T1 = 1,000 K to T2 = 1,500 K:
∆U =CV (T1)× (T2−T1)+∆Hfus (3)
In order to compute the total porous volume, we used the freely available software Zeo++.44–46
It uses a geometric decomposition of space to compute the accessible and non-accessible volume
to a sphere of a given radius. We have taken a value a 1.2 Å simulating the porous volume as seen
by a helium molecule, calculating the distribution of instantaneous total pore space (sum of the
accessible and the non-accessible volume) along the MD trajectories at each temperature.
Acknowledgements
We thank Anne Boutin, Alain Fuchs, Anthony Cheetham, and Rodolphe Vuilleumier for fruitful
discussions. This work benefitted from the financial support of ANRT (thèse CIFRE 2015/0268).
We acknowledge access to HPC platforms provided by a GENCI grant (A0010807069). TDB
would like to thank the Royal Society for a University Research Fellowship. We also thank Dia-
mond Light Source for access to beamline I15-1 (EE15676), and Dean Keeble and Philip Chater
for assistance with data collection on I15-1 during its initial commissioning phase. We gratefully
acknowledge the Science and Technology Facilities Council (STFC) for access to neutron beam-
time at ISIS on the GEM instrument. This research used resources of the Advanced Photon Source
(Beamline 11-ID-B, GUP44665), a U.S. Department of Energy (DOE) Office of Science User Fa-
cility operated for the DOE Office of Science by Argonne National Laboratory under Contract No.
DE-AC02-06CH11357.
References
(1) Mason, J. A.; Oktawiec, J.; Taylor, M. K.; Hudson, M. R.; Rodriguez, J.; Bachman, J. E.;
Gonzalez, M. I.; Cervellino, A.; Guagliardi, A.; Brown, C. M.; Llewellyn, P. L.; Mascioc-
18

chi, N.; Long, J. R. Nature 2015, 527, 357–361.
(2) Rodenas, T.; Luz, I.; Prieto, G.; Seoane, B.; Miro, H.; Corma, A.; Kapteijn, F.; Llabrés i
Xamena, F. X.; Gascon, J. Nat Mater 2014, 14, 48–55.
(3) Yoon, J. W. et al. Nat Mater 2016, 57.
(4) Mondloch, J. E.; Katz, M. J.; Isley III, W. C.; Ghosh, P.; Liao, P.; Bury, W.; Wagner, G. W.;
Hall, M. G.; DeCoste, J. B.; Peterson, G. W.; Snurr, R. Q.; Cramer, C. J.; Hupp, J. T.;
Farha, O. K. Nature Mater. 2015, 14, 512–516.
(5) Horike, S.; Umeyama, D.; Kitagawa, S. Acc. Chem. Res. 2013, 46, 2376–2384.
(6) Sholl, D. S.; Lively, R. P. J. Phys. Chem. Lett. 2015, 6, 3437–3444.
(7) Cairns, A. B.; Goodwin, A. L. Chem. Soc. Rev. 2013, 42, 4881.
(8) Schneemann, A.; Bon, V.; Schwedler, I.; Senkovska, I.; Kaskel, S.; Fischer, R. A. Chem. Soc.
Rev. 2014, 43, 6062–6096.
(9) Morris, R. E.; Cejka, J. Nature Chem 2015, 7, 381–388.
(10) Bennett, T. D.; Cheetham, A. K.; Fuchs, A. H.; Coudert, F.-X. Nature Chem. 2017, 9, 11–16.
(11) Bennett, T. D.; Cheetham, A. K. Acc. Chem. Res. 2014, 47, 1555–1562.
(12) Park, K. S.; Ni, Z.; Cote, A. P.; Choi, J. Y.; Huang, R.; Uribe-Romo, F. J.; Chae, H. K.;
O’Keeffe, M.; Yaghi, O. M. Proceedings of the National Academy of Sciences 2006, 103,
10186–10191.
(13) Tian, Y.-Q.; Zhao, Y.-M.; Chen, Z.-X.; Zhang, G.-N.; Weng, L.-H.; Zhao, D.-Y. Chem. Eur.
J. 2007, 13, 4146–4154.
(14) Bennett, T. D.; Tan, J.-C.; Yue, Y.; Baxter, E.; Ducati, C.; Terrill, N. J.; Yeung, H. H. M.;
Zhou, Z.; Chen, W.; Henke, S.; Cheetham, A. K.; Greaves, G. N. Nature Comm. 2015, 6,
8079.
19

(15) Umeyama, D.; Horike, S.; Inukai, M.; Itakura, T.; Kitagawa, S. J. Am. Chem. Soc. 2015, 137,
864–870.
(16) MacFarlane, D. R.; Forsyth, M.; Howlett, P. C.; Kar, M.; Passerini, S.; Pringle, J. M.;
Ohno, H.; Watanabe, M.; Yan, F.; Zheng, W.; Zhang, S.; Zhang, J. Nat. Rev. Mater. 2016,
1, 15005.
(17) Giri, N.; Del Pópolo, M. G.; Melaugh, G.; Greenaway, R. L.; Rätzke, K.; Koschine, T.; Pi-
son, L.; Gomes, M. F. C.; Cooper, A. I.; James, S. L. Nature 2015, 527, 216–220.
(18) Kohara, S.; Akola, J.; Patrikeev, L.; Ropo, M.; Ohara, K.; Itou, M.; Fujiwara, A.; Yahiro, J.;
Okada, J. T.; Ishikawa, T.; Mizuno, A.; Masuno, A.; Watanabe, Y.; Usuki, T. Nat Comms
2014, 5, 5892.
(19) Corradini, D.; Coudert, F.-X.; Vuilleumier, R. Nature Chem. 2016, 8, 454–460.
(20) Wharmby, M. T.; Henke, S.; Bennett, T. D.; Bajpe, S. R.; Schwedler, I.; Thompson, S. P.;
Gozzo, F.; Simoncic, P.; Mellot-Draznieks, C.; Tao, H.; Yue, Y.; Cheetham, A. K. Angew.
Chem. Int. Ed. 2015, 54, 6447–6451.
(21) Bennett, T. D.; Goodwin, A. L.; Dove, M. T.; Keen, D. A.; Tucker, M. G.; Barney, E. R.;
Soper, A. K.; Bithell, E. G.; Tan, J.-C.; Cheetham, A. K. Phys. Rev. Lett. 2010, 104.
(22) Mei, Q.; Benmore, C. J.; Weber, J. K. R. Phys. Rev. Lett. 2007, 98.
(23) Although the higher temperatures would not be physically relevant for the experimental sys-
tem, they are made necessary by the relatively short times explored due to the high computa-
tional cost of FPMD, in order to gather statistics on relatively rare events and high thermody-
namic barriers.
(24) Chakravarty, C.; Debenedetti, P. G.; Stillinger, F. H. J. Chem. Phys. 2007, 126, 204508.
(25) Kelly, K. US Bur. Mines Bull 1936, 393.
20

(26) Samanta, A.; Tuckerman, M. E.; Yu, T.-Q.; E, W. Science 2014, 346, 729–732.
(27) Laage, D. Science 2006, 311, 832–835.
(28) Laage, D.; Hynes, J. T. J. Phys. Chem. B 2008, 112, 14230–14242.
(29) O’Reilly, N.; Giri, N.; James, S. L. Chem. Eur. J. 2007, 13, 3020–3025.
(30) Hasell, T.; Cooper, A. I. Nat. Rev. Mater. 2016, 1, 16053.
(31) Thornton, A. W.; Jelfs, K. E.; Konstas, K.; Doherty, C. M.; Hill, A. J.; Cheetham, A. K.;
Bennett, T. D. Chem. Commun. 2016, 52, 3750–3753.
(32) Keen, D. A. J. Appl. Cryst. 2001, 34, 172–177.
(33) Soper, A. K. GudrunN and GudrunX: Programs for Correcting Raw Neutron and X-ray
Diffraction Data to Differential Scattering Cross Section. Tech. Rep. RAL-TR-2011-013
(Rutherford Appleton Laboratory, 2011).
(34) Soper, A. K.; Barney, E. R. J. Appl. Cryst. 2011, 44, 714–726.
(35) Tucker, M. G.; Keen, D. A.; Dove, M. T.; Goodwin, A. L.; Hui, Q. J. Phys. Condens. Matter
2007, 19, 335218.
(36) VandeVondele, J.; Krack, M.; Mohamed, F.; Parrinello, M.; Chassaing, T.; Hutter, J. Comput.
Phys. Comm. 2005, 167, 103–128.
(37) http://www.cp2k.org.
(38) VandeVondele, J.; Krack, M.; Mohamed, F.; Parrinello, M.; Chassaing, T.; Hutter, J. Comput.
Phys. Comm. 2005, 167, 103–128.
(39) Bussi, G.; Donadio, D.; Parrinello, M. J. Chem. Phys. 2007, 126, 014101.
(40) Perdew, J. P.; Burke, K.; Ernzerhof, M. Phys. Rev. Lett. 1996, 77, 3865–3868.
21

(41) Grimme, S.; Antony, J.; Ehrlich, S.; Krieg, H. J. Chem. Phys. 2010, 132, 154104.
(42) Haigis, V.; Coudert, F.-X.; Vuilleumier, R.; Boutin, A. Phys. Chem. Chem. Phys. 2013, 15,
19049–19056.
(43) Goedecker, S.; Teter, M.; Hutter, J. Phys. Rev. B 1996, 54, 1703–1710.
(44) Pinheiro, M.; Martin, R. L.; Rycroft, C. H.; Jones, A.; Iglesia, E.; Haranczyk, M. J. Mol.
Graph. Model. 44, 208–219.
(45) Martin, R. L.; Smit, B.; Haranczyk, M. J. Chem. Inf. Model. 2012, 52, 308–318.
(46) Willems, T. F.; Rycroft, C. H.; Kazi, M.; Meza, J. C.; Haranczyk, M. Micro. Meso. Mater.
149, 134–141.
22