
Liquid cavitation studies in circular pipe bends LIBRARY KAFB, NM I...
26
I NASA TECHNICAL NOTE *o h M - I n z c TN - D-3176 LIQUID CAVITATION STUDIES IN CIRCULAR PIPE BENDS by R. E. Stonemetz George C. Marshall Space Flight Cen Hnntsville, Ala, \-,e . , ; . . ' . . NATIONAL AERONAUTICS AND SPACE ADMINISTRATION - WASHINGTON, D. C. - DECEMBER 1965 https://ntrs.nasa.gov/search.jsp?R=19660003948 2018-05-18T00:24:39+00:00Z
Transcript of Liquid cavitation studies in circular pipe bends LIBRARY KAFB, NM I...

I
NASA TECHNICAL NOTE
*o h
M -
I
n z c
TN -
D-3176
LIQUID CAVITATION STUDIES IN CIRCULAR PIPE BENDS
by R. E . Stonemetz
George C. Marshall Space Flight Cen Hnntsville, Ala,
\-,e . , ;. . '
. .
NATIONAL AERONAUTICS AND SPACE A D M I N I S T R A T I O N - WASHINGTON, D. C . - DECEMBER 1 9 6 5
https://ntrs.nasa.gov/search.jsp?R=19660003948 2018-05-18T00:24:39+00:00Z
TECH LIBRARY KAFB, NM
I llllllllllllllllllllllllllllllllllll~llllll ~ . -
OL30002
NASA TN D-3176
LIQUID CAVITATION STUDIES IN CIRCULAR P I P E BENDS
By R. E . Stonemetz
George C. Marsha l l Space Flight Center Huntsville, Ala.
N A T I O N A L AERONAUT ICs AND SPACE ADMl N I STRATI ON
For sale by the Clearinghouse for Federal Scientific and Technical Information Springfield, Virginia 22151 - Price $1.00


TABLE OF CONTENTS
Page SUMMARY . . . . . . . . . . . . . . . . . . . . . . . . . . . . . . . . . . . . . . . . . . . . . . . . . 1
INTRODUCTION . . . . . . . . . . . . . . . . . . . . . . . . . . . . . . . . . . . . . . . . . . . . . 1
APPARATUSANDPROCEDURE . . . . . . . . . . . . . . . . . . . . . . . . . . . . . . . . . . . 1
CAVITATION CRITERIA . . . . . . . . . . . . . . . . . . . . . . . . . . . . . . . . . . . . . . . . 2
CAVITATION SIMILARITY LAWS . . . . . . . . . . . . . . . . . . . . . . . . . . . . . . . . . . . 3
RESULTS AND DISCUSSION . . . . . . . . . . . . . . . . . . . . . . . . . . . . . . . . . . . . . 4
Cavitation Region . . . . . . . . . . . . . . . . . . . . . . . . . . . . . . . . . . . . . . . 5 Velocity Profile in Bend . . . . . . . . . . . . . . . . . . . . . . . . . . . . . . . . . . . 5
6
CONCLUSIONS . . . . . . . . . . . . . . . . . . . . . . . . . . . . . . . . . . . . . . . . . . . . . . 7
Discussion of Experimental uk . . . . . . . . . . . . . . . . . . . . . . . . . . . . . . .
RECOMMENDATIONS . . . . . . . . . . . . . . . . . . . . . . . . . . . . . . . . . . . . . . . . . 8
REFERENCES . . . . . . . . . . . . . . . . . . . . . . . . . . . . . . . . . . . . . . . . . . . . . . 19
iii

LIST OF ILLUSTRATIONS
Figure Title Page
I Cavitation Study Test Arrangement. ..................... I 1
2 Test Section Configurations. . . . . . . . . . . . . . . . . . . . . . . . . . . 12
3 120 Degrees Bend Test Section Showing Probe Positions and Pulsating Cavitation . . . . . . . . . . . . . . . . . . . . . . . . . . . . . 13
4 Radial Pressure Differentials Across the (a) 60 Degrees Bend, 2 Inch Diameter Tes t Section and the (b) 60 Degrees Bend, 4 Inch Diameter Tes t Section at Velocities up to the Mean Critical Flow Velocity at a Bulk Water Temperature of80OF . . . . . . . . . . . . . . . . . . . . . . . . . . . . . . . . . . . . . . . . . 14
5 Diagram of Regions Encountered in Curved Pipe Flow and their Effects on the Cavitation Parameters . . . . . . . . . . . . . . 15
V P
Critical Cavitation Index Versus Pressure Ratio, 6 1/2p7; ’ Within the Cavitation Region. . . . . . . . . . . . . . . . . . . . . . . . . . . 16
7 Critical Cavitation Index V e r s u s Reynolds Number Within the Cavitation Region . . . . . . . . . . . . . . . . . . . . . . . . . . . . . . . 17
8 Curved Pipe Critical. Cavitation Index as Computed Versus Reynolds Number. . . . . . . . . . . . . . . . . . . . . . . . . . . . . 18
LIST OF TABLES
Table Title Page
I Values of R/d and 0.67 (R/d) -d for Different Pipe Size and Bend Radius Ratios. ......................... 7
I1 Critical Cavitation Indices and Related Parameters . . . . . . . . . . 8
iv

DEFINITION OF SYMBOLS
Symbol
d
R
'k
Definition
pipe diameter
pipe bend radius
pipe bend radius ratio
ratio of liquid vapor pressure t o dynamic pressure
Reynolds number
upstream static pressure
upstream static pressure at cavitation
upstream mean velocity pressure at cavitation
V

LlQU ID CAVITATION STUD IES IN CIRCULAR P IPE BENDS
SUMMARY
Incipient cavitation indices were determined for bends of 6 0 " , go", and 120" in one plane for pipe diameters (d) of I. 5, 2.0, and 4.0 inches , and bend radius ratios (R/d) of 0.7 , I. 0 and 1. 5. The working fluid was water.
It was found that, for all configurations investigated, the cri t ical cavitation index decreased somewhat with increasing values of Reynolds number and ratio of the fluid vapor pressure to the upstream dynamic pressure. index was greater fo r smaller ratios of bend radius to pipe diameter. angles investigated, 60" - 120" , had insignificant effect.
The crit ical cavitation The bend
An empirical relationship was derived for the determination of the cri t ical cavitation index. pipe diameter.
This relationship takes into account the effects of bend radius and
I NTROD UCT I ON
The phenomenon of cavitation in curved pipes is of importance to the aerospace industry, because short space vehicle stages require propellant suction ducts with small bend radii and large bend angles. cavitation at the required high volume flowrates.
These configurations are conducive to bend
Much is available in the l i terature on cavitation concerning flow about bodies of various shapes, but little has been published on cavitation in pipe bends. pose of this investigation was to obtain experimental data on cavitation in pipe bends over a range of Reynolds numbers and rat ios of vapor pressure to dynamic pressure (pressure ratio) .
The pur-
APPARATUS AND PROCEDURE
Figure I shows the arrangement of the test tower. The overall height was
The 62 feet. rate was regulated by replaceable orfices near the bottom of the downcomer. working fluid was water.
The height from ground level to the test section was 39.75 feet. The flow-
The bend configurations tested are shown in Figures 2

and 3. The bends were affixed to the side of a cylindrical sump at the bottom of a vertical cylindrical open top tank ( reservoir) with a hemispherical-shape bottom,
A three-probe static pressure pickup arrangement was used to measure the average upstream static pressure. Single measurements, directly opposite one another, were made in the bend (Fig. 3 ) . In all cases , the static pressure holes were polished to remove burrs. All pressures were recorded electrically.
The water reservoir was filled to a predetermined level and timed through The fall was of such magnitude that steady flow conditions were a measured fall,
assumed to have been established ( 5 seconds) and that the pressure head differential could be neglected. In this way the volume flowrate was computed.
With a given orifice size and required tank liquid level, the shutoff valve was opened and a test was run. This procedure was repeated twice for each orifice size and for each test section; the orifice size was increased until cavitation was visually, observed. Although more fully developed cavitation could be observed at slightly larger orifice s izes , a s ize was reached that produced no increase in flow velocity o r volume flowrate.
For each run, maximum, minimum and mean values were determined for the pressure at each probe position. F o r each test the average of the maximum values of the pressure was chosen to be used in determining the cavitation indices because of the associated minimum data scatter. Flowrates a lso were determined from the average of two test runs per orifice size.
The water temperature ranged from 70" to 130" F in steps of approximately 15" F.
CAVITATION CRITERIA
The occurrence of cavitation in a curved pipe can be explained by examining the forces on an element of fluid as it passes through the bend. As the surface curves away from the element, an inward force must act on it to keep it against the inner surface. The outer wall pressure cannot increase; hence, the pressure difference required to keep the particle against the inner surface must be supplied by a reduction in the inner wall pressure. attained when the inner surface pressure has fallen to the vapor pressure of the liquid. However, if the outward radial velocity component of the particle has not fallen to zero, the pressure difference is not great enough to cause the particle to follow the path of the bend. Therefore, it separates from the inner wall and cavita- tion occurs.['] This phenomenon is depicted by the test results shown in Figure 4.
The maximum pressure difference is
2

Cavitating flows are described by the cavitation index or number:
P - P (1)
S V 0 - =
2pV2
where Ps is the upstream static pressure, Pv the vapor pressure at the bulk liquid temperature, p the mass density, and B the upstream mean velocity. cavitation index, Ok, is defined by:
The crit ical
a k = 1 -2 %PVk
The upstream static pressure at cavitation is Pk, the mean crit ical velocity at which cavitation occurs is Vk, and P and p as before.
V
CAVITATION S IMILARITY LAWS
The similarity laws for curved pipe flow can be explained in the same manner as those for flow about a body. At some point within a pipe bend, a maximum flow- velocity is reached with a corresponding minimum pressure. A minimum pressure coefficient is defined as:
At the point of cavitation inception, for geometrically s imilar flow systems, the ratio of the pressure difference Ps - Pmin to the upstream dynamic pressure is ,equal to the minimum pressure coefficient in the non-cavitating flow regime. [ 2 ] Therefore, the assumption that the minimum pressure equals the vapor pressure and that the minimum pressure coefficient equals the cri t ical cavitation index at cavi- tation inception makes equation 3 identical to equation 2.
The scaling laws (similari ty laws) employed in this study a r e briefly outlined below:
( I ) Reynolds number.
Maintain a constant ratio between the inertial and viscous fluid forces -
3
I

R = CL (4)
(2) Assuming a near gas-free liquid, maintain a constant ratio of the vapor pressure to the dynamic pressure.
This scaling law can be used when all evaluations a r e made after cavitation inception. However, P will not necessarily be the vapor pressure at the bulk liquid temperature, because the vaporization of the liquid produc V a cooling effect that lowers the vapor pressure. This reduction will be given by r v
AT. AP =- apV
v 8T
Hence, the scaling relationship should be A P /$.pV2. In this study the evaluation of the critical cavitation index w a s not always made at the same point within the cavi- tation region during every test; consequently, some tes ts produced significant cooling effects and others almost none. Due to this inconsistency, P w a s taken to be the vapor pressure at the bulk liquid temperature and equation 5 ro be the scaling relationship.
V
Actually, there are other parameters that could cause departures from the No consideration w a s given to the effect of dissolved air and/or gas scaling laws.
within the liquid, o r to the effect of the surface tension of the liquid. Al so disre- garded a r e the t ime effects of bubble growth by diffusion associated with gaseous type cavitation, such as that presented by Reference 3 . No attempt w a s made to control the surface roughness o r to vary fluid leanliness to account for variations in the availability of bubble nucleation sites. r4ci Unfortunately, it is impossible to isolate one scaling parameter and study its effects on cavitation.
RESULTS AND D ISCUSS ION
The scaling relationships employed in this study were the Reynolds number and the pressure ratio. The Reynolds number w a s used to show how viscous effects a l ter the critical cavitation index. The experimental test arrangement (Fig. i) could not control pressure nor flow velocity; hence the point of cavitation inception could not be determined with accuracy. Therefore, all evaluations w e r e made after cavitation inception, that is , within the "cavitation region. Wislicenus r 31
4

suggested using the pressure ratio as a scaling parameter because of the effects on the vapor pressure within the "region" caused by liquid vaporization.
Cavitat ion Reg ion
The "cavitation region" is illustrated in Figure 5. It can be described as the
The diagram shows that as the bulk liquid tempera- region between the point of cavitation inception and the point where choked flow or steady state conditions prevail. ture rises ( T, > Ti) , the flow velocity decreases for incipient cavitation. Essentially, pe liquid vapor pressure rises with temperature, thereby necessitating a lower mean flow velocity to induce cavitation. In turn, assuming frictionless flow, the upstream static pressure increases at the expense of a decrease in upstream velocity pressure. Table I1 is a compilation of experimental flow parameters and crit ical cavitation in- dices for various liquid temperatures , pipe bend angles , pipe bend radii , and pipe diameters. the liquid temperature increases for all configurations tested.
The table shows that the cri t ical velocity fo r cavitation decreases as
The "cavitation region" can best be explained by citing an example from the diagram (Fig. 5). Assume incipient cavitation at an orifice diameter of 2. 95 inches and a bulk liquid temperature of Ti. It can be visually observed that slightly more voluminous boiling occurs as the orifice diameter is increased in increments of 0.01 inch up to a diameter of 3. 0 inches, all other conditions remaining unchanged. further increase in orifice diameter will produce no further increase in the amount of cavitation, and this point is the beginning of the choked flow region. In between is the 'Tcavitation region.
Any
Velocity Prof i le in Bend
Figure 2 depicts the experimental test section configurations. The 4-inch diameter tes t sections have a sharp-edged entrance at the sump that may be conducive to non-uniform velocity profiles. However, in all tests, cavitation occurred at the middle of the inside wall a shor t distance into the bend. velocity distribution was very uniform. occurring on the inner surface of the 120' bend, I. 5 bend radius ratio, 2-inch diameter line. The exact origin of cavitation cannot be seen in the photograph because of a band of concentrated light reflecting from the periphery of the circular line within the plexiglass section; however , the photograph shows the pulsating effect associated with cavitation.
This indicated that the Figure 3 shows A small amount of cavitation
5
F

Discussion of Experimental oic
Experimental data shows that the upstream static pressure difference from one liquid temperature to another is small and is less than the vapor pressure differ- ence over the same temperature range. Therefore, the magnitude of the numerator in equation 2 decreases with each temperature increment. Since the upstream dynamic pressure is a function of the upstream static pressure (assuming negligible friction pressure differential losses) , its change wil l likewise be small. Therefore , the magnitude of the dynamic pressure decreases only slightly for each temperature increment, and less severely than the magnitude of the pressure difference in the numerator of equation 2. It can be concluded that the cri t ical cavitation index de- c reases as the liquid temperature increases (Figs . 6 and 7).
Several cavitation indices were found at the cavitation inception point for the 90" bend, 1. 0 bend radius ratio, 2-inch diameter line, and are depicted as curve (1) in Figures 6 and 7. the more voluminous visual cavitation. It should not be concluded, however, that the other test sections can be represented likewise, because such points for these test sections were not observed. pressure and flow velocity are of utmost importance for visual investigations of incipient cavitation phenomena.
These indices are approximately 25% higher than those found for
This points to the fact that precise control of the
Figures 6 and 7 reveal that the critical cavitation index is not solely a function of the Reynolds number nor the pressure ratio, but is affected by the line s ize and bend radius ratio. derivation o r evaluation of the cri t ical cavitation indices for curved pipe flow.
Hence , it appears that these t e rms should be included- in the
Let equation 2 be the defining equation for the cri t ical cavitation index for straight pipe flow, and call equation 7 the defining equation for curved pipe flow.
P. - P 0. 67 ( R/d)-d ( 7 )
The R/d for straight pipe flow is infinite and, when applied to equation 7 , gives the defining equation for straight pipe flow (equation 2). Table I gives the values of the parameters for the second te rm of equation 7 as applicable to the test sections used in this investigation.
6

Table I. Values of R/d and 0. 67 (R/d) -d for Different Pipe Sizes and Bend Radius Ratios
R/d d ( R/d) -d 0. 67 (R/d)-d
00 any size 0 0
1 2 1 0. 67
1. 5 2 0.445 0. 30
1 . 5 4 0. 20 0. 13
4 2 0. 0625 0.042
The predominant factoi in the second te rm of equation 7 is the bend radius. R/d values approaching 10, equation 7 approaches equation 2. combines the three distinct bands of Figure 7 into one band when plotted as a function of Reynolds number (Fig. 8 ) . tance of the previously mentioned scale effects.
For Essentially, equation 7
This is desirable and appears to diminish the impor-
CONCLUSIONS
For a Reynolds number range of 4 x l o 5 to 2 x l o 6 and for a range of pressure ratios of 0. 04 to 0. 40, the following conclusions are made:
1. Cavitation occurring in pipes curved in one plane was found to be affected by the pipe bend radii and the pipe diameters, and affected little, if any, by the pipe bend angle.
2. In curved pipes , crit ical cavitation indices decrease in magnitude for increasing Reynolds number and pressure ratio
P V
$pT2
3. of curved pipe flow (equation 7 ) in conjunction with Reynolds number appears to be an adequate scaling relationship.
The empirical defining equation for the crit ical cavitation index
7
I

4. Increasing the temperature of a liquid lowers its crit ical velocity for cavitation.
RECOMMENDAT IONS
This study was conducted using the classical approach to the problem. Figure 8 reveals that there is some spreading of points which could be due to nuclei, gas o r air content, etc. , as well as to data scatter. Further studies.should be con- ducted to determine just how important the effects mentioned ear l ie r a r e on curved pipe-flow cavitation. either the pressure o r velocity, o r both, should be employed. In this way accurate cavitation inception indices may be determined for various bend configurations; lower and higher ranges of Reynolds numbers can be explored as well as the nuclei in the working fluid, air content, and upstream and downstream velocity profiles. important and rather simple investigation would be to determine whether cri t ical cavitation indices at cavitation inception are repeatable for curved pipe flow.
A closed loop facility , having the capability of controlling
A very
Table 11. Critical Cavitation Indices and Related Parameters
90" Bend, R/d = 1. 0 , 2 inch dia. line ~ ~~
V gk Okc P 'k Orifice Flow Water Vel. Vapor Re Diam Velocity Temp Press. Press. (in.) ( f t /sec) (Fa) (psf ) (psia) (psis) &PVk2
2.372 29. 9 73 864 0.402 4 . 8 9 ~ 1 0 ~ 10.75 .067 1.72 1.05
2.372 30. 1 81 873 0. 530 5.44 10.81 .087 1.70 1.03
2.372 30. 4 82 891 0. 541 5. 58 10.96 .087 1.68 1.01
2. 372 29. 8 I i o 852 1. 275 7.32 11.00 .215 1.65 .98
2.372 29. 2 I 2 8 815 2.106 8.59 11.10 .372 1.59 . 9 2
60" Bend, R/d I. 5, 2 inch dia. line
2.372 33. 9 7 1 1114 0.376 5 . 3 8 ~ 1 0 ~ 9.91 .0486 1.23, .93
2.372 33. 8 82 1100 0. 541 6.24 9.35 .0708 1.15 .85
8
I

Table I1 Continued
0- 'k V *k kc P Orifice Flow Water Vel. Vapor Re Dia. Velocity Temp Press. Press. 1 - 2 ( in . ) (ft/sec) (Fa) (psf ) (psis) (psia) nPvk
60" Bend (cont'd) ... _- ~~ -
2. 372 33. 4 I 0 0 1075 0.935 7.44 9.52 .125 1.15 .85
2. 372 32. 8 112 1036 1.35 8.32 9.75 . I 8 8 1.17 .87
2.372 31. 9 127 975 2. 05 9.29 10.07 .307 1.19 .89
90" Bend
2.650 33.4 66 1075 0.316 4 . 9 8 ~ 1 0 ~ 9.54 .0423 1.24 . 9 4
2. 650 33. 3 82 1071 . 514 6.11 9. 49 ,0728 1.20 . 87
2.650 33. 0 95 1052 .815 7.03 9.38 .116 1.17 .87
2. 650 32. 6 108 1018 1.203 7.92 9. 57 . I 7 0 1.18 .88
2. 650 31. 2 124 930 I. 890 8.82 9. 88 .292 1.24 . 9 4
120" Bend
2. 650 33. 8 7 1 1103 0.369 5 . 3 4 ~ 1 0 ~ 9.75 0.0482 1.22 .92
2. 650 33. 5 82 1079 0. 539 6.19 9.79 .0719 1.23 .93
2. 650 32. 9 94 1042 0.791 6.99 9.90 . 109 1.26 ' .96
2. 650 31. 6 113 962 1.390 8.07 10.50 .208 1.36 1.06
60" Bend, R/d - I. 5, 4 inch dia. line
4. 525 34. 7 7 1 1165 0.376 l . l l x 1 0 6 7.94 .0465 0.94 . 8 1
4. 525 33. 8 81 1104 0.517 1.22 7. 52 .0674 .91 .78
4. 525 34. 9 98 1176 0.894 - 1.53 8.02 . IO9 .87 . 7 4
9
I
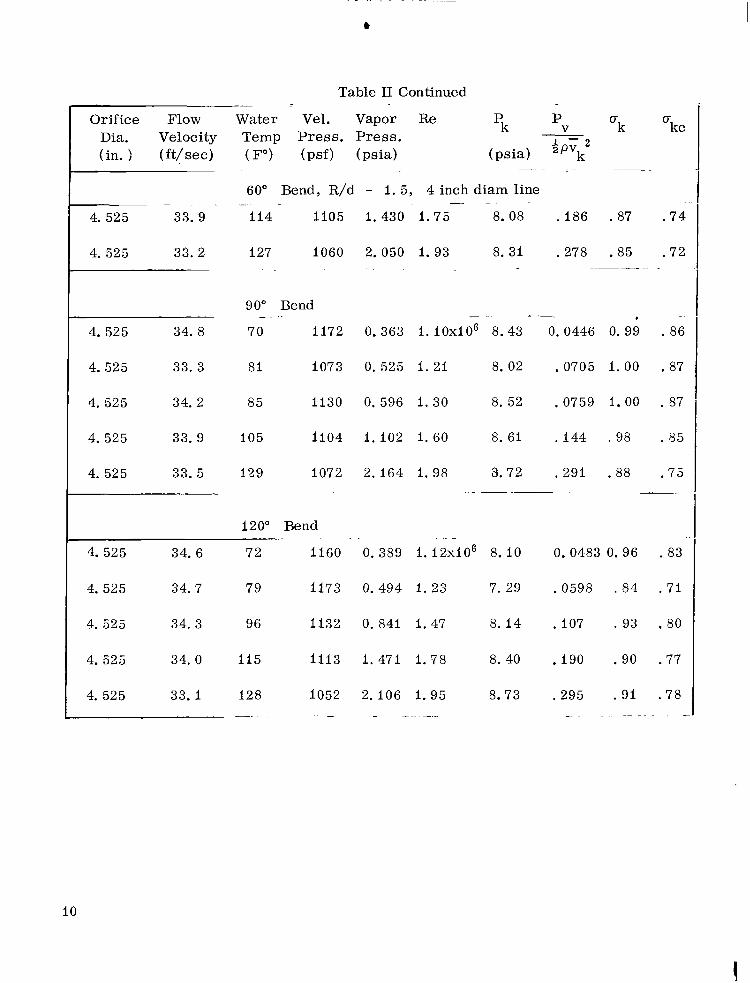
Table I1 Continued -.
cr k kc CT
V P 'k Orifice Flow Water Vel. Vapor Re
Dia. Velocity Temp Press. Press. (in. ) (ft/sec) (F") (psf ) (psia) (psis) BpTC
_- .- ~.
60" Bend, R/d - 1. 5, 4 inch diam line - - - -
4. 525 33. 9 114 1105 1.430 1.75 8.08 .186 .87 . 7 4
4. 525 33. 2 127 1060 2.050 1.93 8.31 .278 .85 .72 - ~ ..__- .. . -~ .. . .~ -
-. . . _ - . _ 90" Bend
- -~
4. 525 34. 8 70 1172 0.363 1. 1 0 ~ 1 0 ~ 8.43 0.0446 0. 99 .86
4.525 33. 3 81 1073 0. 525 1.21 8.02 ,0705 1 .00 .87
4. 525 34. 2 85 1130 0.596 1.30 8. 52 . 0759 1.00 . 87
4. 525 33. 9 105 1104 1.102 1 . 6 0 8.61 .144 .98 . 85
4. 525 33. 5 129 1072 2.164 1.98 9.72 .291 .88 . 7 5 . .-
~~~~~ .
. . .. - .- - 120" Bend
. - ~
4.525 34. 6 72 1160 0.389 1. 1 2 ~ 1 0 ~ 8.10 0.0483 0.96 . 8 3
4. 525 34. 7 79 1173 0.494 1 .23 7. 29 .0598 . 84 . 7 1
4. 525 34. 3 96 1132 0. 841 1.47 8.14 . l o 7 . 93 .80
4. 525 34. 0 115 1113 1.471 1.78 8.40 . I 9 0 .90 .77
4.525 33. I 128 1052 2.106 1.95 8.73 .295 .91 . 7 8 - - - -~ - . . - -- .~ ~ ~ ..
10

FIGURE 1. CAVITATION STUDY TEST ARFtANGEMENT I

SUMP
Test sect ion bend angles of 60°, 90°, 120' f o r a 2 inch d-ia. l i n e and an R/d = 1.5
TEST SECTION
I TEST SECTION I su
(b) Test sect ion bend angles of 60°, 90°, 120' f o r a 4 inch dia . l i ne and an R/d = 1.5
TEST SECTION
(c) 90' bend, 2 inch dia. l i n e , R/d = 1.0
FIGURE, 2. TEST SECTION CONFIGURATIONS

FIGURE 3. 120 DEGREES BEND TEST SECTION SHOWING PROBE POSITIONS AND PULSATING CAVITATION (Shutter Speed 1/500 sec.) 13

MEAN FLOW 0 1 I
10.0 20.0 30.0 40 i 0
( 4
2.00-
MEAN FLOW VELOCITY, .o 11 I , I I I
10.0, 20.0 30.0 40.0
FIGURE 4. RADIAL PRESSURE DIFFERENTIALS ACROSS THE (a) 60 DEGREES BEND, 2 INCH DIAMETER TEST SECTION AND THE (b ) 60 DEGREES BEND, 4 INCH DIAMETER TEST SECTION AT VELOCITIES UP TO THE MEAN CRITICAL FLOW VELOCITY AT A BULK WATER TEMPE,RATURE OF 80°F

BULK TEMPERATURES
T5 ' T, r, T4 T3 T2 Tl
I CAVITA
YON-CAVITATION REGION
I I l I TION INCEPTION
3W REtilUlU
0 J i AvT4 - T5
/
CHOKED FLOW REGION \
\
CAVITATION REGION'
I I I I I I I - v - - I - v
2, a5 2.90 2.95 3.00
ORIFICE DIAMETER - INCHES
FIGURE 5. DIAGRAM O F REGIONS ENCOUNTERED IN CURVED PIPE FLOW AND THEIR EFFECTS ON THE CAVITATION PARAMETERS
15

I 10.0 9. 0 8.0
7 . 0
6.0
5.0
4.6-
3 . 0
44 b
2.0-- x"
0.3- I CIJRVE (1): 1 2 INCH DIAM, R
0 . 1 tI 0 4 0
14" !
I I I I I
1 1
REGION
CSTIMATE D INCIPIENT - p + + p - - - - - - .
444-I- - -
I H i . -
I 1 1 1 -
L1- 9'0" BEND, -
d = 1.0 T E S T SECTION
i I
- i I
I
. -
CAVITATION LINE . - - -_._ 7- L3-r 1_
V90' bend, 2 inch d i a m - . lire. R / d = 1.0
0 6 0 ' bend, 2 i n c h d i a m Line, R / d = 1.5
@90' bend @ l Z O . bend
~ 6 0 ' bend, 4 i nch d i a m
m 90' bend
.$I 120" bend
l ine , R / d = 1.5
. - d 0 0 d d d d P R E S S U R E RATIO, l z i T z
V P
i/2p$k ' FIGURE 6. CRITICAL CAVITATION INDEX VERSUS PRESSURE RATIO,
WITHIN THE CAVITATION REGION
16

10. c- 9. c 8. 0-
7 . 0 6. o 5 .0
4. c
3.0
2.5
1.b 0.9 0 . E 0 . i
0. t
0. E
0. '
0 . 3
0 . 2
0.1 1
CURVI
NON,
-
:AVIT.
! I ) SEI F I G
loo REYNOLDSNUMBER, R = PfTd e U.
1 --
9 0 0 benq 2 i n c h
0 6 0 " b e n d , 2 i n c h
@90° bend
d i a m l ine , R / d = l . O
d i a m l i n e , R / d = l . 5
@ 120 O bend .6O0 b e n d , 4 i n c h
90 " bend 120" bend
diam l ine , R / d = l . 5
0 2 3 4 5 6 7 8
i o 6
0
FIGURE 7. CRITICAL CAVITATION INDEX VERSUS REYNOLDS NUMBER WITHIN THE CAVITATION REGION
17

0 600 Bend-2" Diam-R/d=l . 0
@ 90' Bend-2" Diam-R/d=l . 0 ,
i 05 3 4
pvd 0 2 1 06
REYNOLDS NUMBER, Re = -.p.
FIGURE 8. CURVED PIPE CRITICAL CAVITATION INDEX AS COMPUTED VERSUS REYNOLDS NUMBER
6 7 8 9 1 0
18

REFERENCES
1. Knapp, R. T. , .and A. Hollander; "Laboratory Investigations of the Mechanisms of Cavitation. IT Trans. ASME, July, 1948, pp. 419-435.
2. Hall , John William; "The Effect of Surface Irregularit ies on Incipient Cavitation. Doctoral Thesis, The Pennsylvania State University, College Park , Pa. , June, 1958, pp. 11-14.
3. Hall , J. W. , and George F. Wislicenus; "Scale Effects on Cavitation. ASME, September, 1963, pp. 385-398.
Trans.
4. Harvey, E. N. , Elroy, W. D. , and A. H. Whitely; "On Cavity Formation in Water. If Journal of Applied Physics, Vol, 18, 1947, pp. 162-172.
NASA-Langley, 1965 M336
1
19

“The aerotiautical and space activities o f the United States shall be conducted so as to contribute . . . to the expansion of h i m a n knowl- edge of phenomena i12 the atmosphere and space. T h e Administratio12 shall provide for the widest practicable aizd appropriate dissemination of information concerniizg its activities and the results thereof .”
-NATIONAL AERONAUTICS AND SPACE ACT OF 1958
NASA SCIENTIFIC AND TECHNICAL PUBLICATIONS
TECHNICAL REPORTS: important, complete, and a lasting contribution to existing knowledge.
TECHNICAL NOTES: of importance as a contribution to existing knowledge.
TECHNICAL MEMORANDUMS: Information receiving limited distri- bution because of preliminary data, security classification, or other reasons.
CONTRACTOR REPORTS: Technical information generated in con- nection with a NASA contract or grant and released under NASA auspices.
TECHNICAL TRANSLATIONS: Information published in a foreign language considered to merit NASA distribution in English.
TECHNICAL REPRINTS: Information derived from NASA activities and initially published in the form of journal articles.
SPECIAL PUBLICATIONS: Information derived from or of value to NASA activities but not necessarily reporting the results .of individual NASA-programmed scientific efforts. Publications include conference proceedings, monographs, data compilations, handbooks, sourcebooks, and special bibliographies.
Scientific and technical information considered
Information less broad in scope but nevertheless
Details on the availability of these publications may be obtained from:
SCIENTIFIC AND TECHNICAL INFORMATION DIVISION
N AT1 ONAL AERONAUTICS AND SPACE ADM I N ISTRATI 0 N
Washington, D.C. PO546


![1 The Power of Ultrasound - Wiley-VCH · As the liquid compresses and stretches, the cavitation bubbles can behave in two ways [1]. In the first, called stable cavitation, bubbles](https://static.fdocuments.net/doc/165x107/5afef5097f8b9a68498efff9/1-the-power-of-ultrasound-wiley-vch-the-liquid-compresses-and-stretches-the-cavitation.jpg)