Linking Two Assessment Systems Using Common...
34
Linking Two Assessment Systems Using Common-Item IRT Method and Equipercentile Linking Method Annual meeting of the National Council of Measurement in Education Vancouver, Canada Rob Kirkpatrick Ahmet Turhan Jie Lin April 2012
Transcript of Linking Two Assessment Systems Using Common...

Linking Two Assessment Systems Using Common-Item IRT Method and Equipercentile Linking Method
Annual meeting of the National Council of Measurement in Education Vancouver, Canada
Rob Kirkpatrick
Ahmet Turhan
Jie Lin
April 2012
Common-Item IRT and Equipercentile Linking 1
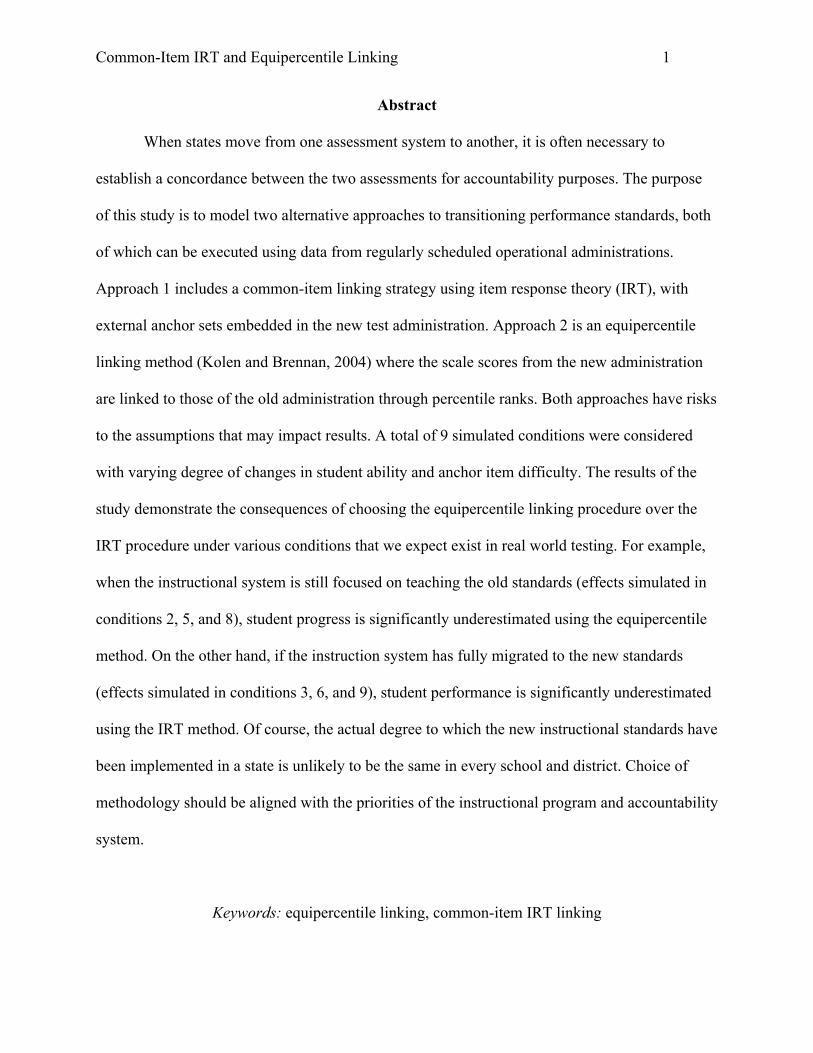
Abstract
When states move from one assessment system to another, it is often necessary to
establish a concordance between the two assessments for accountability purposes. The purpose
of this study is to model two alternative approaches to transitioning performance standards, both
of which can be executed using data from regularly scheduled operational administrations.
Approach 1 includes a common-item linking strategy using item response theory (IRT), with
external anchor sets embedded in the new test administration. Approach 2 is an equipercentile
linking method (Kolen and Brennan, 2004) where the scale scores from the new administration
are linked to those of the old administration through percentile ranks. Both approaches have risks
to the assumptions that may impact results. A total of 9 simulated conditions were considered
with varying degree of changes in student ability and anchor item difficulty. The results of the
study demonstrate the consequences of choosing the equipercentile linking procedure over the
IRT procedure under various conditions that we expect exist in real world testing. For example,
when the instructional system is still focused on teaching the old standards (effects simulated in
conditions 2, 5, and 8), student progress is significantly underestimated using the equipercentile
method. On the other hand, if the instruction system has fully migrated to the new standards
(effects simulated in conditions 3, 6, and 9), student performance is significantly underestimated
using the IRT method. Of course, the actual degree to which the new instructional standards have
been implemented in a state is unlikely to be the same in every school and district. Choice of
methodology should be aligned with the priorities of the instructional program and accountability
system.
Keywords: equipercentile linking, common-item IRT linking
Common-Item IRT and Equipercentile Linking 2
Linking Two Assessment Systems
Using Common-Item IRT Method and Equipercentile Linking Method
Introduction
State testing programs are beginning to consider transition strategies to move from their
current testing programs to one measuring Common Core Standards. Many states will consider
strategies for transitioning performance standards during this activity. One common approach
may be to set performance standards on the new assessment before scores are reported, and
simply drop the old performance standards. To use this approach time must be allotted to
develop the new performance standards, hold committee meetings, present results to policy-
making bodies, and publish results. Some states may not be able to complete these activities
quickly enough to meet various reporting goals during the transition year. Another option states
may consider is to estimate a concordance relationship between tests, and use the concordance to
map existing performance standards onto the Common Core Standards test for use in the first
year. States interested in a concordance strategy may find approaches that require special data
collection to be challenging as many schools or districts may not want to participate.
Unfortunately, strategies that do not require special data collections rely on strong assumptions,
which if not met may lead to large amounts of linking error. Even so, states may want to consider
the options for one year if the results are within a tolerance. A full description of available
methodology can be found in Dorans, Pommerich & Holland (2007).
The purpose of this study is to model two alternative approaches to transitioning
performance standards, both of which can be executed using data from regularly scheduled
operational administrations. Approach 1 includes a common-item linking strategy using item
response theory (IRT), with external anchor sets embedded in the new test administration. This
Common-Item IRT and Equipercentile Linking 3
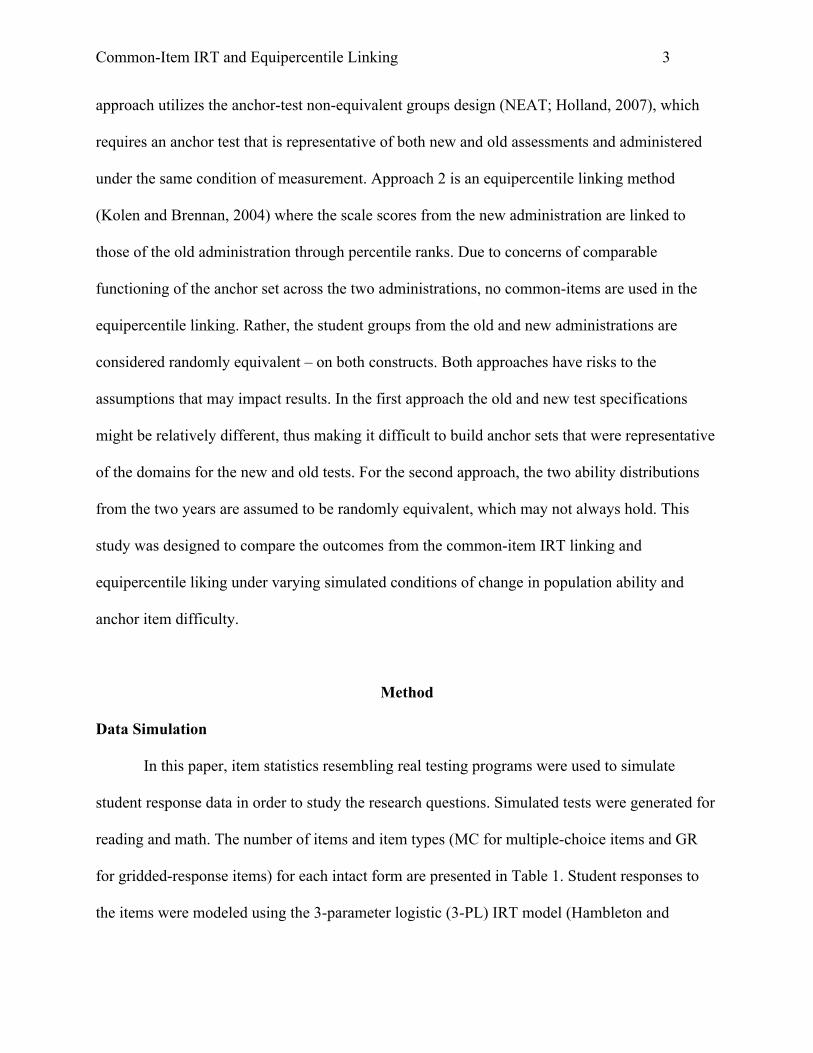
approach utilizes the anchor-test non-equivalent groups design (NEAT; Holland, 2007), which
requires an anchor test that is representative of both new and old assessments and administered
under the same condition of measurement. Approach 2 is an equipercentile linking method
(Kolen and Brennan, 2004) where the scale scores from the new administration are linked to
those of the old administration through percentile ranks. Due to concerns of comparable
functioning of the anchor set across the two administrations, no common-items are used in the
equipercentile linking. Rather, the student groups from the old and new administrations are
considered randomly equivalent – on both constructs. Both approaches have risks to the
assumptions that may impact results. In the first approach the old and new test specifications
might be relatively different, thus making it difficult to build anchor sets that were representative
of the domains for the new and old tests. For the second approach, the two ability distributions
from the two years are assumed to be randomly equivalent, which may not always hold. This
study was designed to compare the outcomes from the common-item IRT linking and
equipercentile liking under varying simulated conditions of change in population ability and
anchor item difficulty.
Method
Data Simulation
In this paper, item statistics resembling real testing programs were used to simulate
student response data in order to study the research questions. Simulated tests were generated for
reading and math. The number of items and item types (MC for multiple-choice items and GR
for gridded-response items) for each intact form are presented in Table 1. Student responses to
the items were modeled using the 3-parameter logistic (3-PL) IRT model (Hambleton and
Common-Item IRT and Equipercentile Linking 4
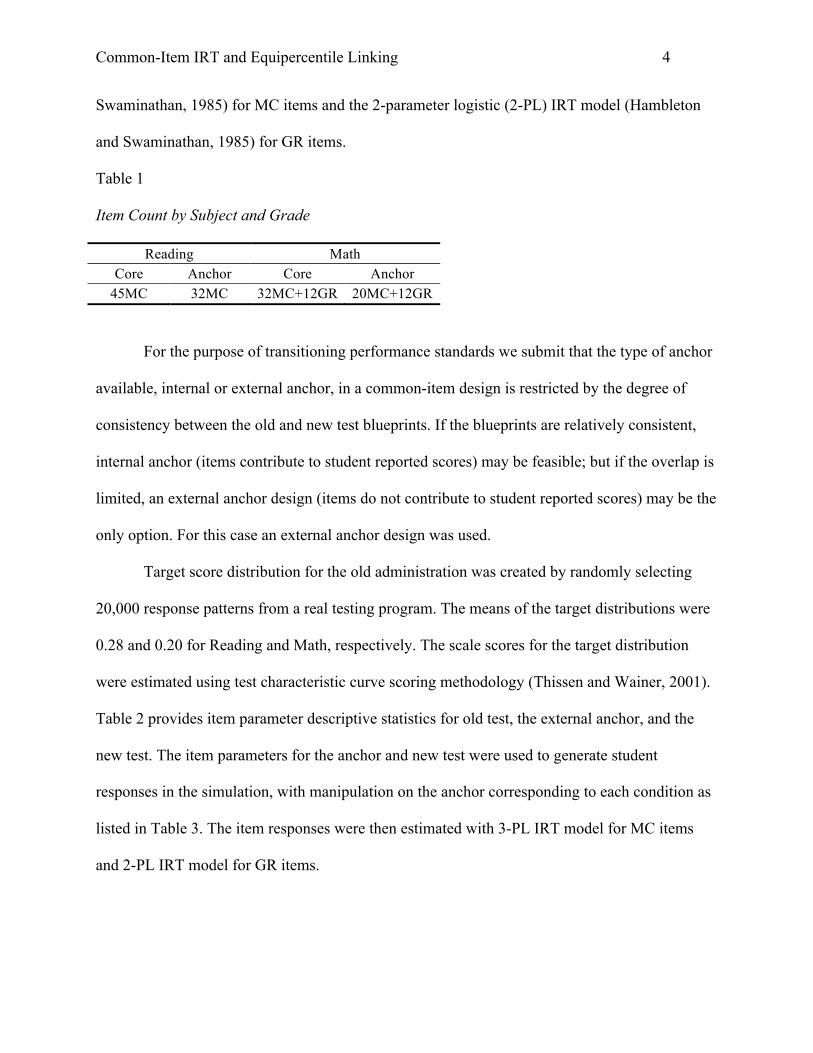
Swaminathan, 1985) for MC items and the 2-parameter logistic (2-PL) IRT model (Hambleton
and Swaminathan, 1985) for GR items.
Table 1
Item Count by Subject and Grade
Reading Math Core Anchor Core Anchor
45MC 32MC 32MC+12GR 20MC+12GR
For the purpose of transitioning performance standards we submit that the type of anchor
available, internal or external anchor, in a common-item design is restricted by the degree of
consistency between the old and new test blueprints. If the blueprints are relatively consistent,
internal anchor (items contribute to student reported scores) may be feasible; but if the overlap is
limited, an external anchor design (items do not contribute to student reported scores) may be the
only option. For this case an external anchor design was used.
Target score distribution for the old administration was created by randomly selecting
20,000 response patterns from a real testing program. The means of the target distributions were
0.28 and 0.20 for Reading and Math, respectively. The scale scores for the target distribution
were estimated using test characteristic curve scoring methodology (Thissen and Wainer, 2001).
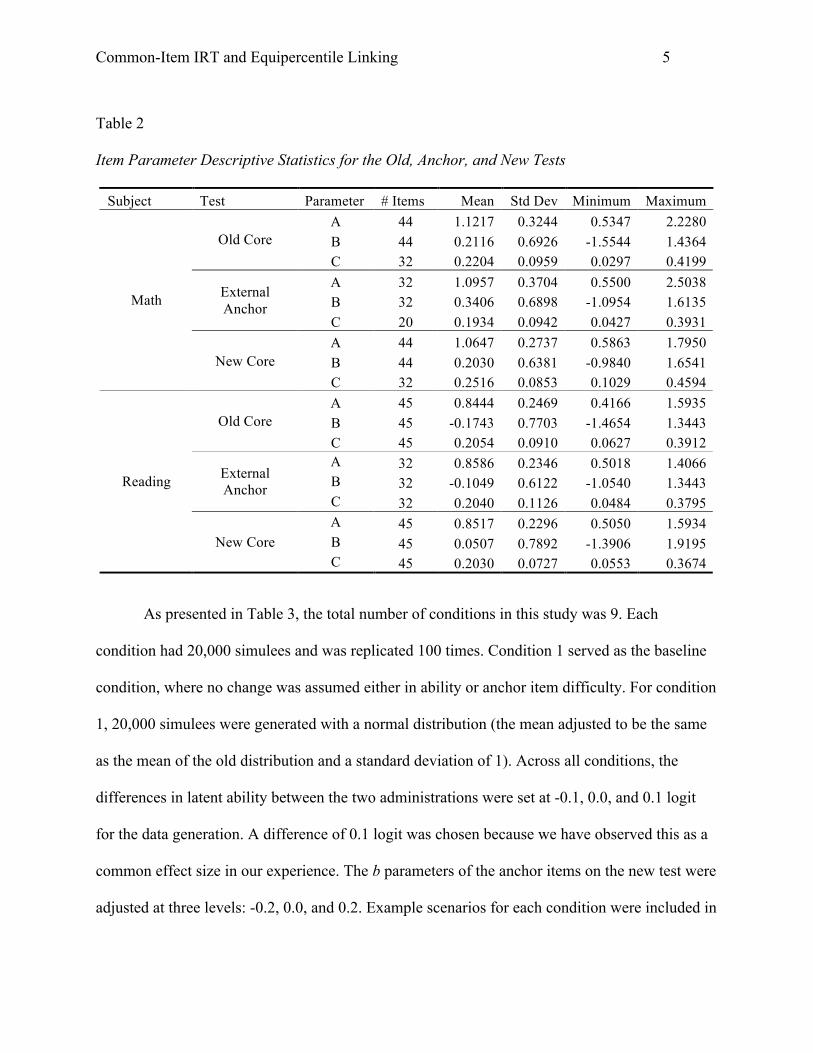
Table 2 provides item parameter descriptive statistics for old test, the external anchor, and the
new test. The item parameters for the anchor and new test were used to generate student
responses in the simulation, with manipulation on the anchor corresponding to each condition as
listed in Table 3. The item responses were then estimated with 3-PL IRT model for MC items
and 2-PL IRT model for GR items.
Common-Item IRT and Equipercentile Linking 5
Table 2
Item Parameter Descriptive Statistics for the Old, Anchor, and New Tests
Subject Test Parameter # Items Mean Std Dev Minimum Maximum A 44 1.1217 0.3244 0.5347 2.2280 B 44 0.2116 0.6926 -1.5544 1.4364 Old Core C 32 0.2204 0.0959 0.0297 0.4199 A 32 1.0957 0.3704 0.5500 2.5038 B 32 0.3406 0.6898 -1.0954 1.6135
External Anchor
C 20 0.1934 0.0942 0.0427 0.3931 A 44 1.0647 0.2737 0.5863 1.7950
New Core B 44 0.2030 0.6381 -0.9840 1.6541
Math
C 32 0.2516 0.0853 0.1029 0.4594 A 45 0.8444 0.2469 0.4166 1.5935 B 45 -0.1743 0.7703 -1.4654 1.3443 Old Core C 45 0.2054 0.0910 0.0627 0.3912 A 32 0.8586 0.2346 0.5018 1.4066 B 32 -0.1049 0.6122 -1.0540 1.3443
External Anchor
C 32 0.2040 0.1126 0.0484 0.3795 A 45 0.8517 0.2296 0.5050 1.5934
New Core B 45 0.0507 0.7892 -1.3906 1.9195
Reading
C 45 0.2030 0.0727 0.0553 0.3674
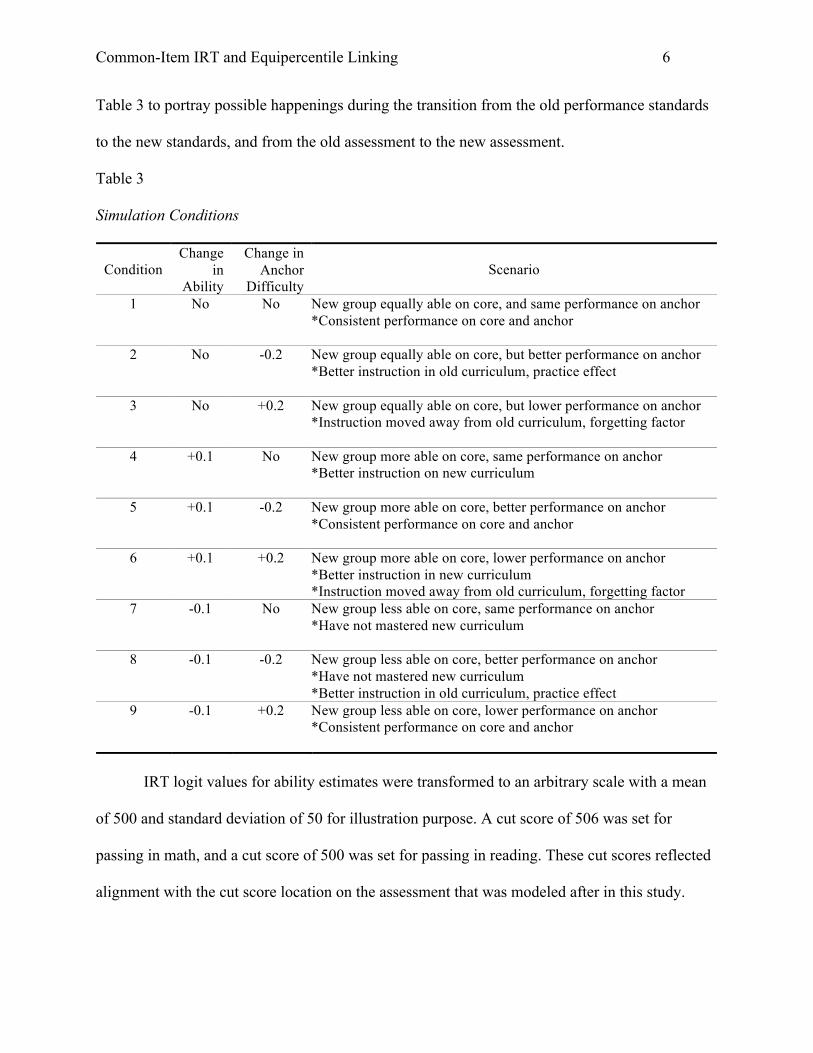
As presented in Table 3, the total number of conditions in this study was 9. Each
condition had 20,000 simulees and was replicated 100 times. Condition 1 served as the baseline
condition, where no change was assumed either in ability or anchor item difficulty. For condition
1, 20,000 simulees were generated with a normal distribution (the mean adjusted to be the same
as the mean of the old distribution and a standard deviation of 1). Across all conditions, the
differences in latent ability between the two administrations were set at -0.1, 0.0, and 0.1 logit
for the data generation. A difference of 0.1 logit was chosen because we have observed this as a
common effect size in our experience. The b parameters of the anchor items on the new test were
adjusted at three levels: -0.2, 0.0, and 0.2. Example scenarios for each condition were included in
Common-Item IRT and Equipercentile Linking 6
Table 3 to portray possible happenings during the transition from the old performance standards
to the new standards, and from the old assessment to the new assessment.
Table 3 Simulation Conditions
Condition Change
in Ability
Change in Anchor
Difficulty Scenario
1 No No New group equally able on core, and same performance on anchor *Consistent performance on core and anchor
2 No -0.2 New group equally able on core, but better performance on anchor *Better instruction in old curriculum, practice effect
3 No +0.2 New group equally able on core, but lower performance on anchor *Instruction moved away from old curriculum, forgetting factor
4 +0.1 No New group more able on core, same performance on anchor *Better instruction on new curriculum
5 +0.1 -0.2 New group more able on core, better performance on anchor *Consistent performance on core and anchor
6 +0.1 +0.2 New group more able on core, lower performance on anchor *Better instruction in new curriculum *Instruction moved away from old curriculum, forgetting factor
7 -0.1 No New group less able on core, same performance on anchor *Have not mastered new curriculum
8 -0.1 -0.2 New group less able on core, better performance on anchor *Have not mastered new curriculum *Better instruction in old curriculum, practice effect
9 -0.1 +0.2 New group less able on core, lower performance on anchor *Consistent performance on core and anchor
IRT logit values for ability estimates were transformed to an arbitrary scale with a mean
of 500 and standard deviation of 50 for illustration purpose. A cut score of 506 was set for
passing in math, and a cut score of 500 was set for passing in reading. These cut scores reflected
alignment with the cut score location on the assessment that was modeled after in this study.
Common-Item IRT and Equipercentile Linking 7
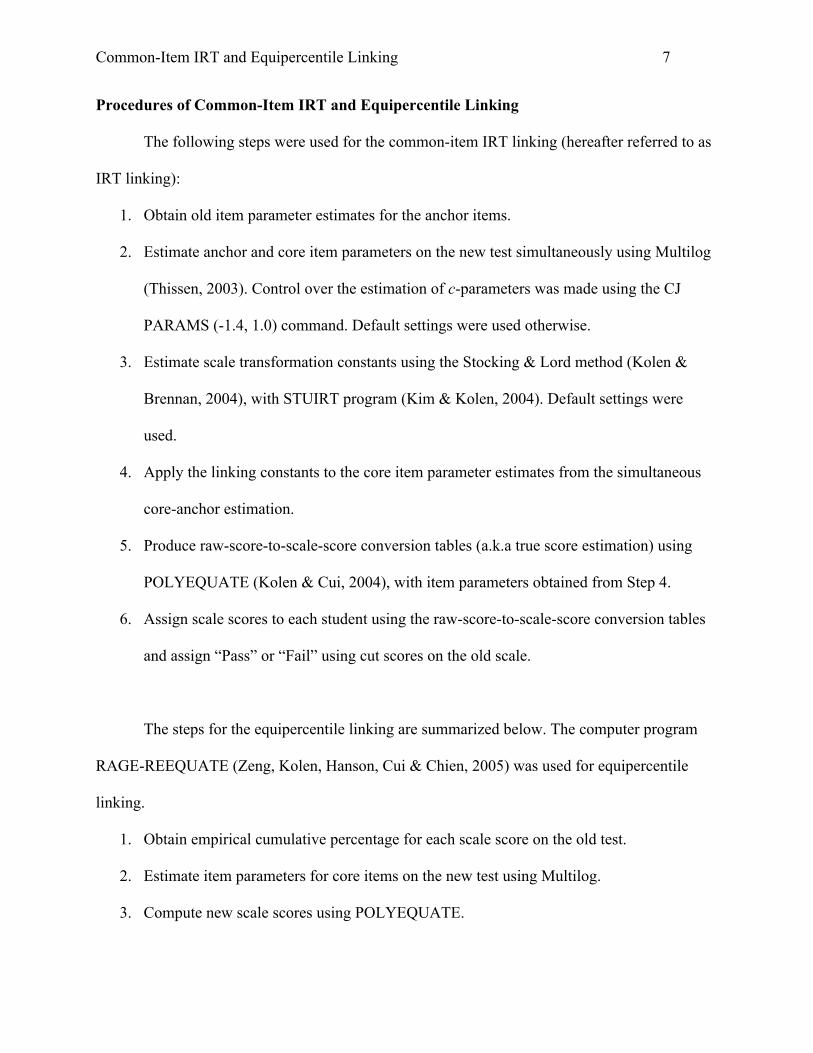
Procedures of Common-Item IRT and Equipercentile Linking
The following steps were used for the common-item IRT linking (hereafter referred to as
IRT linking):
1. Obtain old item parameter estimates for the anchor items.
2. Estimate anchor and core item parameters on the new test simultaneously using Multilog
(Thissen, 2003). Control over the estimation of c-parameters was made using the CJ
PARAMS (-1.4, 1.0) command. Default settings were used otherwise.
3. Estimate scale transformation constants using the Stocking & Lord method (Kolen &
Brennan, 2004), with STUIRT program (Kim & Kolen, 2004). Default settings were
used.
4. Apply the linking constants to the core item parameter estimates from the simultaneous
core-anchor estimation.
5. Produce raw-score-to-scale-score conversion tables (a.k.a true score estimation) using
POLYEQUATE (Kolen & Cui, 2004), with item parameters obtained from Step 4.
6. Assign scale scores to each student using the raw-score-to-scale-score conversion tables
and assign “Pass” or “Fail” using cut scores on the old scale.
The steps for the equipercentile linking are summarized below. The computer program
RAGE-REEQUATE (Zeng, Kolen, Hanson, Cui & Chien, 2005) was used for equipercentile
linking.
1. Obtain empirical cumulative percentage for each scale score on the old test.
2. Estimate item parameters for core items on the new test using Multilog.
3. Compute new scale scores using POLYEQUATE.
Common-Item IRT and Equipercentile Linking 8
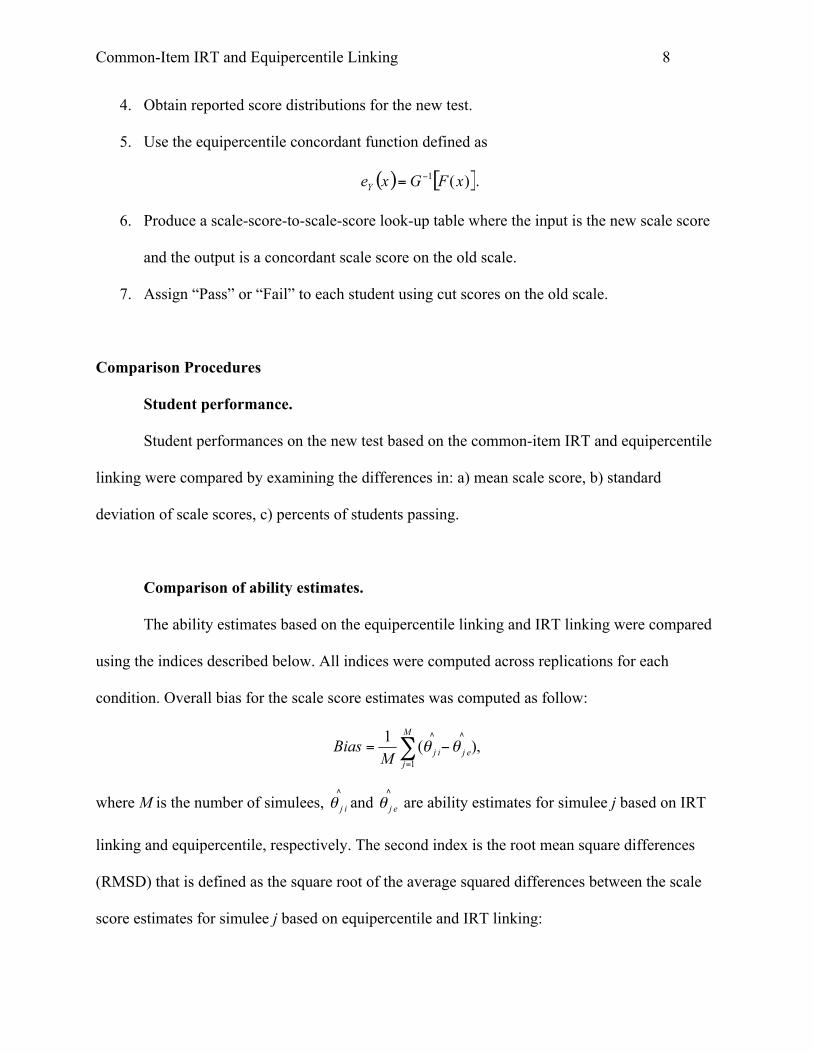
4. Obtain reported score distributions for the new test.
5. Use the equipercentile concordant function defined as
.
6. Produce a scale-score-to-scale-score look-up table where the input is the new scale score
and the output is a concordant scale score on the old scale.
7. Assign “Pass” or “Fail” to each student using cut scores on the old scale.
Comparison Procedures
Student performance.
Student performances on the new test based on the common-item IRT and equipercentile
linking were compared by examining the differences in: a) mean scale score, b) standard
deviation of scale scores, c) percents of students passing.
Comparison of ability estimates.
The ability estimates based on the equipercentile linking and IRT linking were compared
using the indices described below. All indices were computed across replications for each
condition. Overall bias for the scale score estimates was computed as follow:
where M is the number of simulees, and are ability estimates for simulee j based on IRT
linking and equipercentile, respectively. The second index is the root mean square differences
(RMSD) that is defined as the square root of the average squared differences between the scale
score estimates for simulee j based on equipercentile and IRT linking:
Common-Item IRT and Equipercentile Linking 9
;
Finally, the correlations between the scale score estimates based on the two methods were also
calculated.
Estimation of linking error.
The conditional standard errors of linking for the equipercentile and common-item IRT
procedures were estimated using the raw-score-to-scale-score conversion tables resulted from the
100 replications. For the IRT linking, the raw-score-to-scale-score conversion tables were a
direct product of the procedure. For the equipercentile linking, raw-score-to-scale-score
conversion table was obtained by running a PROC FREQ procedure in SAS of the raw score and
equivalent scale score on the scored student file of the new test. The following steps were then
followed to estimate the standard error of linking:
1. Obtain 100 scale scores corresponding to each raw score point on the new test from the
100 replications.
2. Compute the standard deviation of the scale scores for each raw score point. This
represents the standard error of linking at each raw score point.
3. Plot the raw-score-to-scale-score linking relationship, with symmetric lines representing
plus and minus standard error for each linking method.
The average raw-score-to-scale-score conversions from the common-item IRT and
equipercentile linking were also plotted on the same grid for comparison purpose. In addition,
the equipercentile linking conversion was added to the IRT linking graph to see whether the
Common-Item IRT and Equipercentile Linking 10
equipercentile raw-score-to-scale-score relationship curve fell in the standard error bands of IRT
linking.
Results
Descriptive Statistics
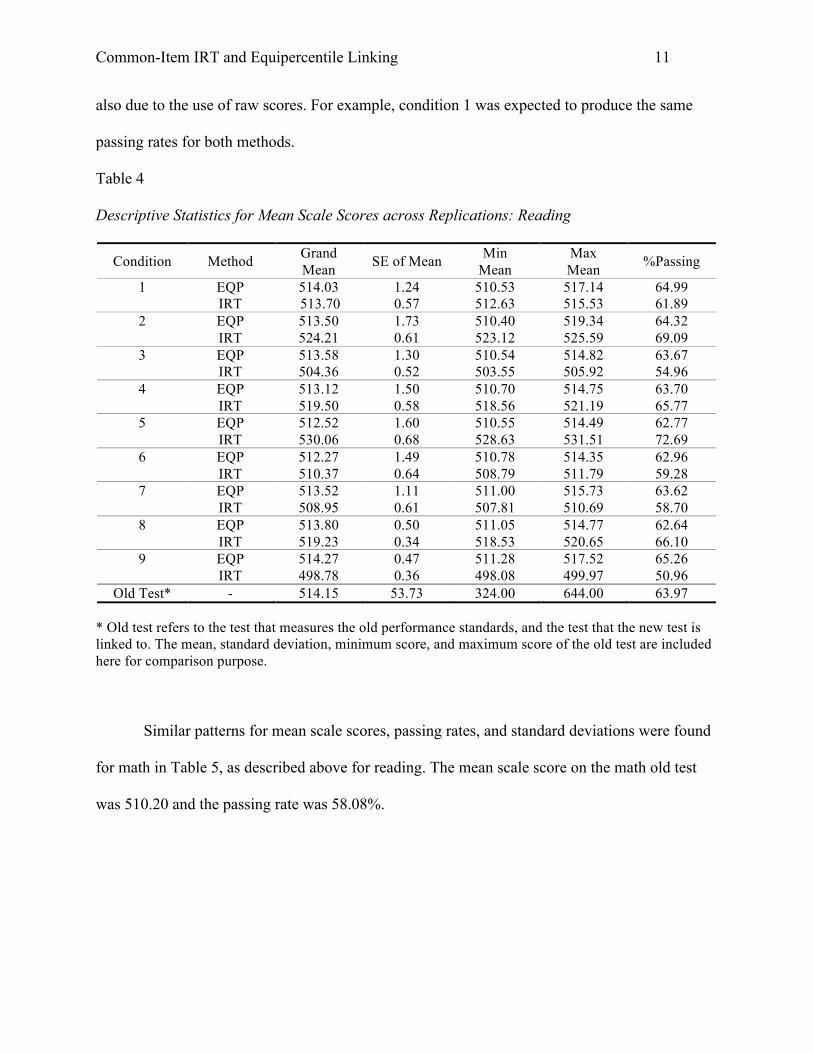
The descriptive statistics of the scale score estimates for the common-item IRT linking
and equipercentile linking, summarized across 100 replications, are given in Tables 4 and 5 for
reading and math respectively. For each condition, the tables provide the average mean scale
scores (grand mean), the standard deviation of the mean scale scores, and the minimum and
maximum mean scale scores from the 100 replications. The passing rate is also presented for
equipercentile (EQP) and common-item IRT (IRT) linking.
As shown in Table 4, the mean scale scores from equipercentile linking are similar across
conditions for reading, and so are the passing rates. This is not surprising because equipercentile
linking for randomly equivalent groups is expected to result in the very similar four moments
and very similar passing rates as those on the old test. The mean scale score on the old reading
test was 514.15 and the passing rate was 63.97%. The standard deviations of the mean scale
scores were all very small at around one scale score point. The mean scale scores and the passing
rate resulted from the IRT linking varied by condition, and these results will be discussed later
with other statistics and graphs.
We note that all of the variability in the passing rate across conditions using the
equipercentile method is due to the use of number correct scoring and our setting the cut score
near the mean of the old score distribution. Roughly 3-4% of simulee scores are at each raw
score near our chosen cut. Some of the variability between the IRT and equipercentile method is
Common-Item IRT and Equipercentile Linking 11
also due to the use of raw scores. For example, condition 1 was expected to produce the same
passing rates for both methods.
Table 4 Descriptive Statistics for Mean Scale Scores across Replications: Reading
Condition Method Grand Mean SE of Mean Min
Mean Max Mean %Passing
1 EQP 514.03 1.24 510.53 517.14 64.99 IRT 513.70 0.57 512.63 515.53 61.89
2 EQP 513.50 1.73 510.40 519.34 64.32 IRT 524.21 0.61 523.12 525.59 69.09
3 EQP 513.58 1.30 510.54 514.82 63.67 IRT 504.36 0.52 503.55 505.92 54.96
4 EQP 513.12 1.50 510.70 514.75 63.70 IRT 519.50 0.58 518.56 521.19 65.77
5 EQP 512.52 1.60 510.55 514.49 62.77 IRT 530.06 0.68 528.63 531.51 72.69
6 EQP 512.27 1.49 510.78 514.35 62.96 IRT 510.37 0.64 508.79 511.79 59.28
7 EQP 513.52 1.11 511.00 515.73 63.62 IRT 508.95 0.61 507.81 510.69 58.70
8 EQP 513.80 0.50 511.05 514.77 62.64 IRT 519.23 0.34 518.53 520.65 66.10
9 EQP 514.27 0.47 511.28 517.52 65.26 IRT 498.78 0.36 498.08 499.97 50.96
Old Test* - 514.15 53.73 324.00 644.00 63.97
* Old test refers to the test that measures the old performance standards, and the test that the new test is linked to. The mean, standard deviation, minimum score, and maximum score of the old test are included here for comparison purpose.
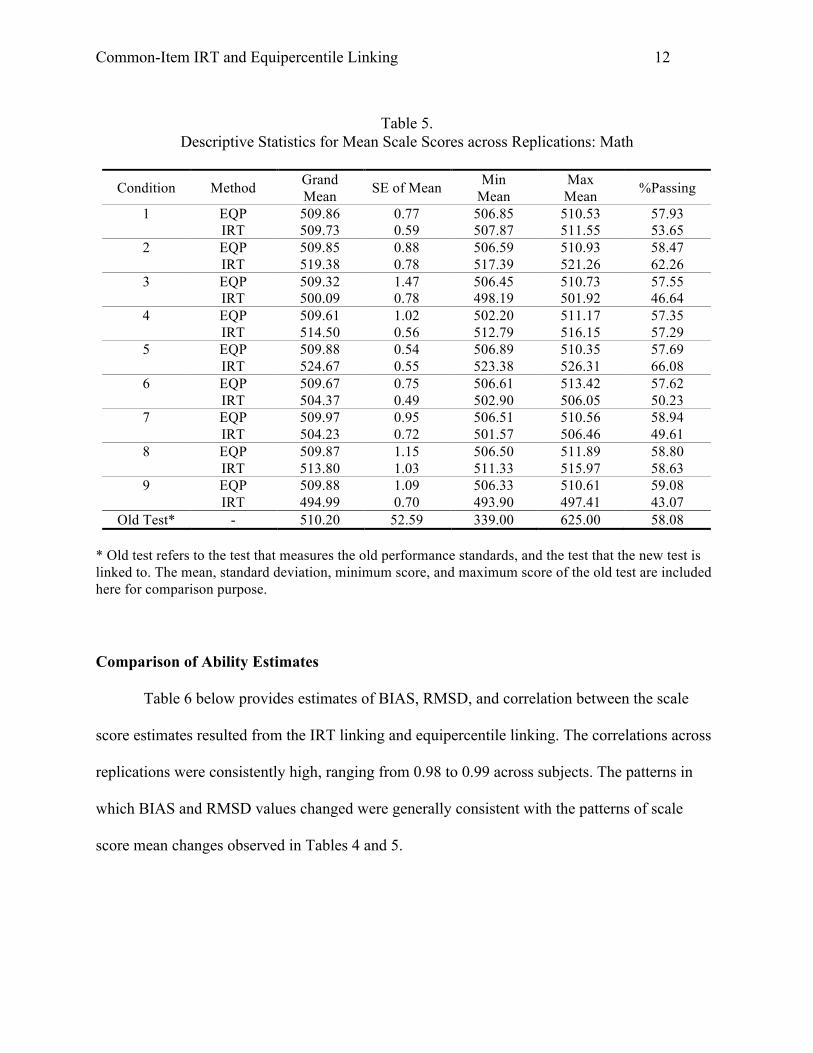
Similar patterns for mean scale scores, passing rates, and standard deviations were found
for math in Table 5, as described above for reading. The mean scale score on the math old test
was 510.20 and the passing rate was 58.08%.
Common-Item IRT and Equipercentile Linking 12
Table 5.
Descriptive Statistics for Mean Scale Scores across Replications: Math
Condition Method Grand Mean SE of Mean Min
Mean Max Mean %Passing
1 EQP 509.86 0.77 506.85 510.53 57.93 IRT 509.73 0.59 507.87 511.55 53.65
2 EQP 509.85 0.88 506.59 510.93 58.47 IRT 519.38 0.78 517.39 521.26 62.26
3 EQP 509.32 1.47 506.45 510.73 57.55 IRT 500.09 0.78 498.19 501.92 46.64
4 EQP 509.61 1.02 502.20 511.17 57.35 IRT 514.50 0.56 512.79 516.15 57.29
5 EQP 509.88 0.54 506.89 510.35 57.69 IRT 524.67 0.55 523.38 526.31 66.08
6 EQP 509.67 0.75 506.61 513.42 57.62 IRT 504.37 0.49 502.90 506.05 50.23
7 EQP 509.97 0.95 506.51 510.56 58.94 IRT 504.23 0.72 501.57 506.46 49.61
8 EQP 509.87 1.15 506.50 511.89 58.80 IRT 513.80 1.03 511.33 515.97 58.63
9 EQP 509.88 1.09 506.33 510.61 59.08 IRT 494.99 0.70 493.90 497.41 43.07
Old Test* - 510.20 52.59 339.00 625.00 58.08 * Old test refers to the test that measures the old performance standards, and the test that the new test is linked to. The mean, standard deviation, minimum score, and maximum score of the old test are included here for comparison purpose.
Comparison of Ability Estimates
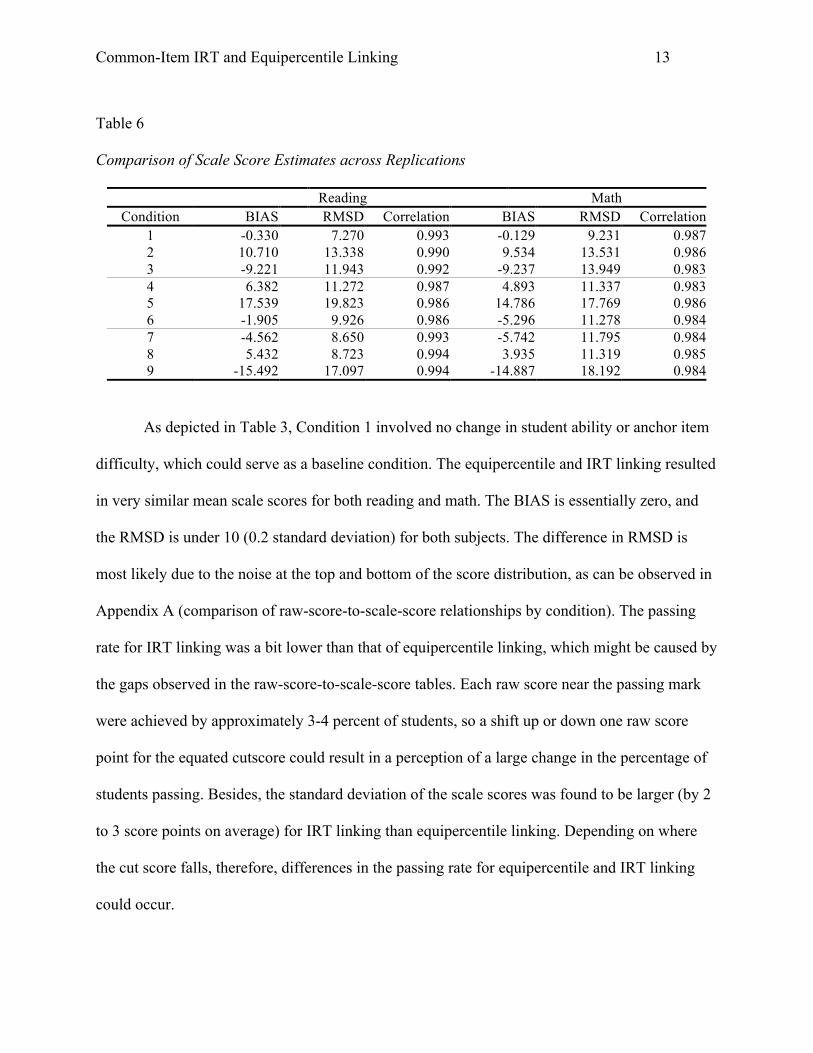
Table 6 below provides estimates of BIAS, RMSD, and correlation between the scale
score estimates resulted from the IRT linking and equipercentile linking. The correlations across
replications were consistently high, ranging from 0.98 to 0.99 across subjects. The patterns in
which BIAS and RMSD values changed were generally consistent with the patterns of scale
score mean changes observed in Tables 4 and 5.
Common-Item IRT and Equipercentile Linking 13
Table 6 Comparison of Scale Score Estimates across Replications
Reading Math Condition BIAS RMSD Correlation BIAS RMSD Correlation
1 -0.330 7.270 0.993 -0.129 9.231 0.987 2 10.710 13.338 0.990 9.534 13.531 0.986 3 -9.221 11.943 0.992 -9.237 13.949 0.983 4 6.382 11.272 0.987 4.893 11.337 0.983 5 17.539 19.823 0.986 14.786 17.769 0.986 6 -1.905 9.926 0.986 -5.296 11.278 0.984 7 -4.562 8.650 0.993 -5.742 11.795 0.984 8 5.432 8.723 0.994 3.935 11.319 0.985 9 -15.492 17.097 0.994 -14.887 18.192 0.984
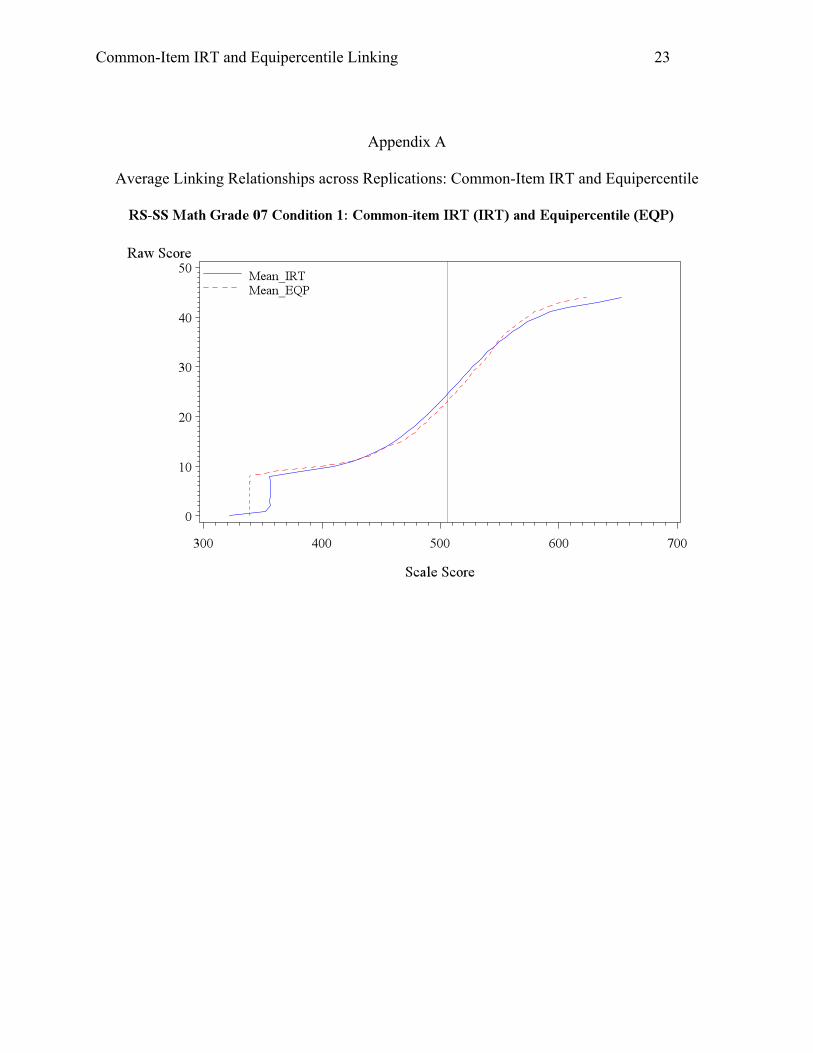
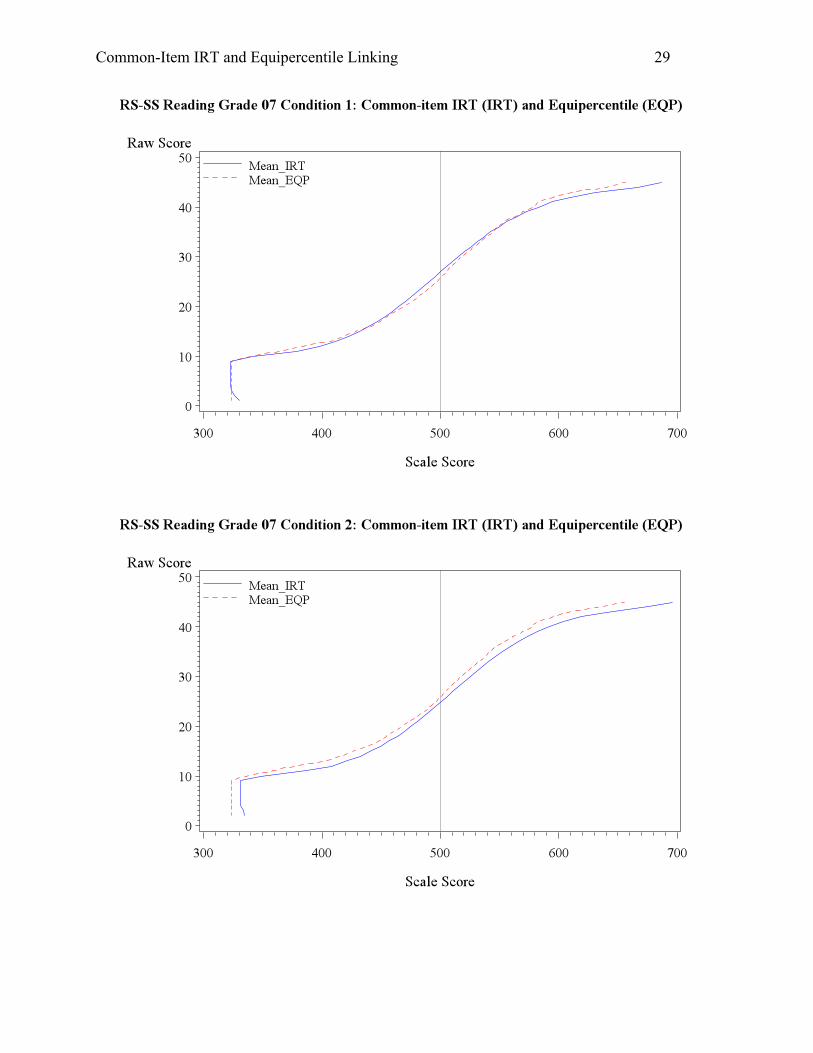
As depicted in Table 3, Condition 1 involved no change in student ability or anchor item
difficulty, which could serve as a baseline condition. The equipercentile and IRT linking resulted
in very similar mean scale scores for both reading and math. The BIAS is essentially zero, and
the RMSD is under 10 (0.2 standard deviation) for both subjects. The difference in RMSD is
most likely due to the noise at the top and bottom of the score distribution, as can be observed in
Appendix A (comparison of raw-score-to-scale-score relationships by condition). The passing
rate for IRT linking was a bit lower than that of equipercentile linking, which might be caused by
the gaps observed in the raw-score-to-scale-score tables. Each raw score near the passing mark
were achieved by approximately 3-4 percent of students, so a shift up or down one raw score
point for the equated cutscore could result in a perception of a large change in the percentage of
students passing. Besides, the standard deviation of the scale scores was found to be larger (by 2
to 3 score points on average) for IRT linking than equipercentile linking. Depending on where
the cut score falls, therefore, differences in the passing rate for equipercentile and IRT linking
could occur.
Common-Item IRT and Equipercentile Linking 14
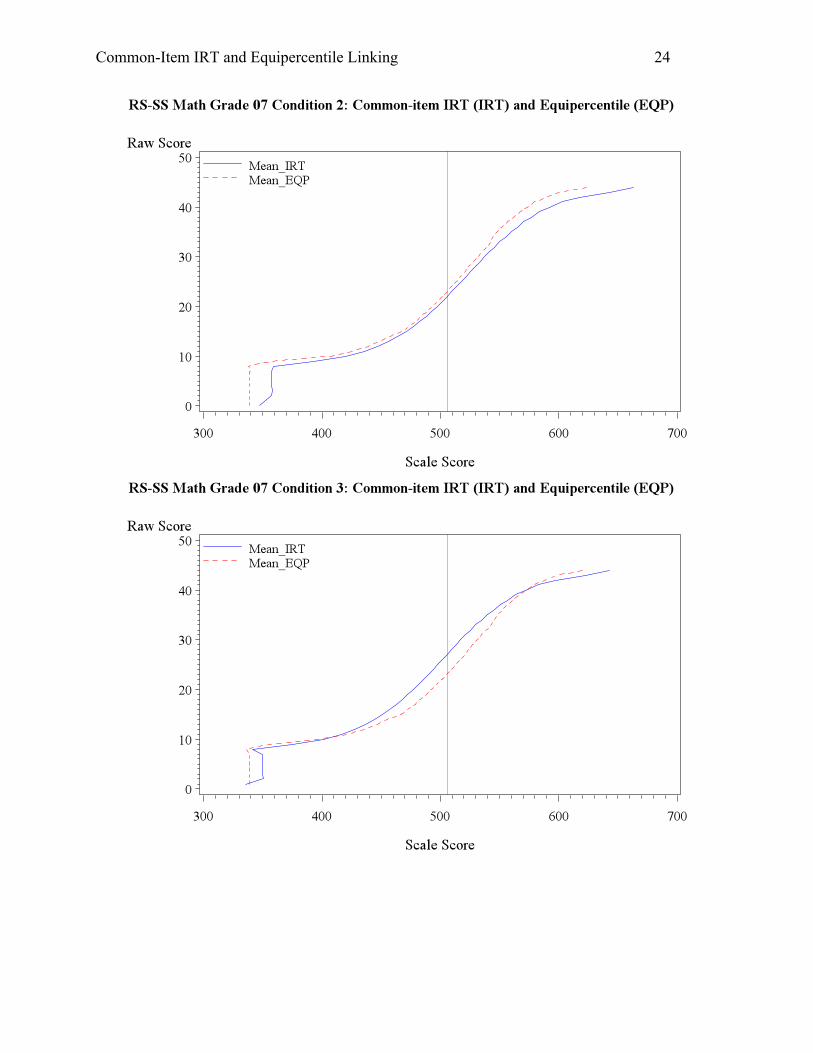
In condition 2, no ability change was assumed, but the anchor item difficulty dropped by
0.2 on the logit metric. That is, compared with the old population, the new student population
were equally able, but performed slightly better on the anchor set which might have more focus
on the old test, for example. With no change in ability, equipercentile linking should link the two
tests adequately. When the IRT linking is used, however, the item parameters on the new
operational tests would be overestimated and therefore student ability would be overestimated as
well. This is consistent with what was found in Tables 4 and 5 for both reading and math.
Compared with equipercentile linking, IRT linking yielded higher mean scale scores (about 10
scale score points higher for both reading and math) and higher passing rates. As shown in
Appendix A, the scale scores from IRT linking were consistently higher across all the raw score
points.
Contrary to Condition 2, Condition 3 tends to occur when the new student population
were equally able, but did not perform so well on the anchor set. In cases where the anchor set
cannot be produced to mimic both old and new curriculum, the anchor set might be built more
towards the old standards, and thus factors like forgetting and reduction in instruction in old
standards could lead to less desirable performance on the anchor. With condition 3, the IRT
method would underestimate the student ability, as observed in the mean scale scores, passing
rates, and graphical representation in Appendix A for both reading and math.
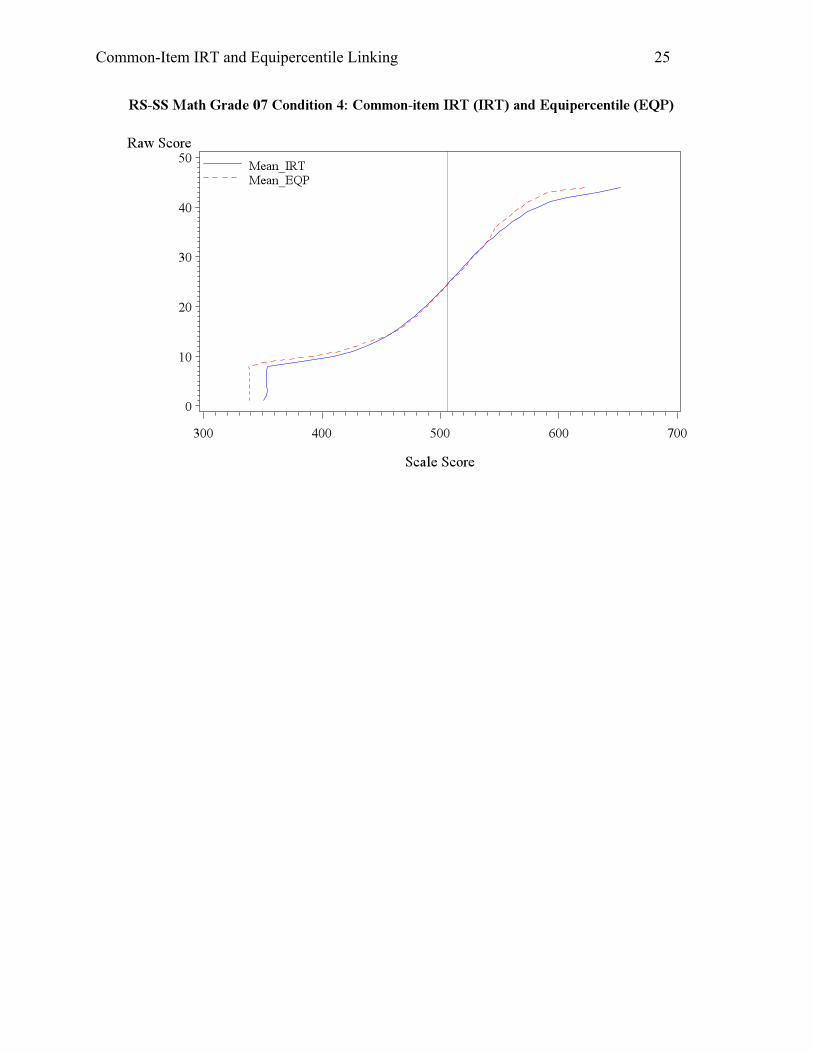
Conditions 4-6 assume that student overall ability grew by 0.1 on the logit metric, while
the change in anchor item difficulty varied, from no change to -0.2 and +0.2. Therefore, the
equipercentile linking would still assume randomly equivalent groups and thus underestimate
student achievement. In condition 4, the student ability grew, but anchor item difficulty stayed.
Equipercentile linking is expected to underestimate student ability, which was evident from the
Common-Item IRT and Equipercentile Linking 15
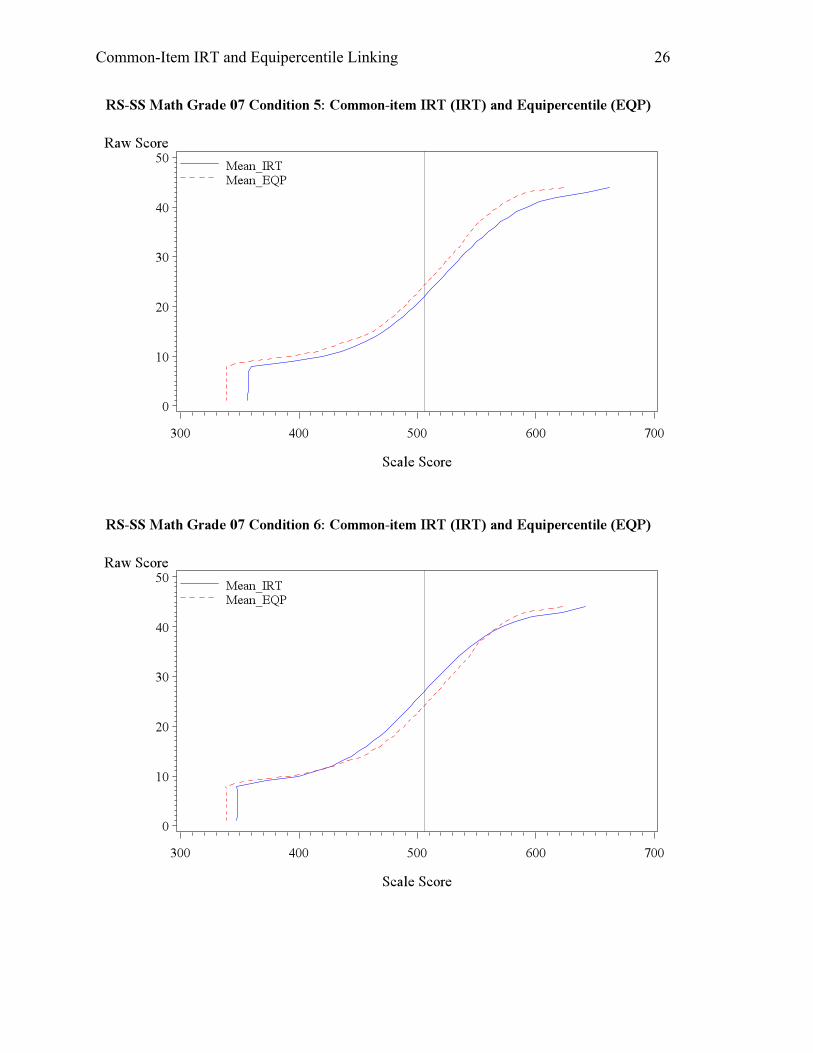
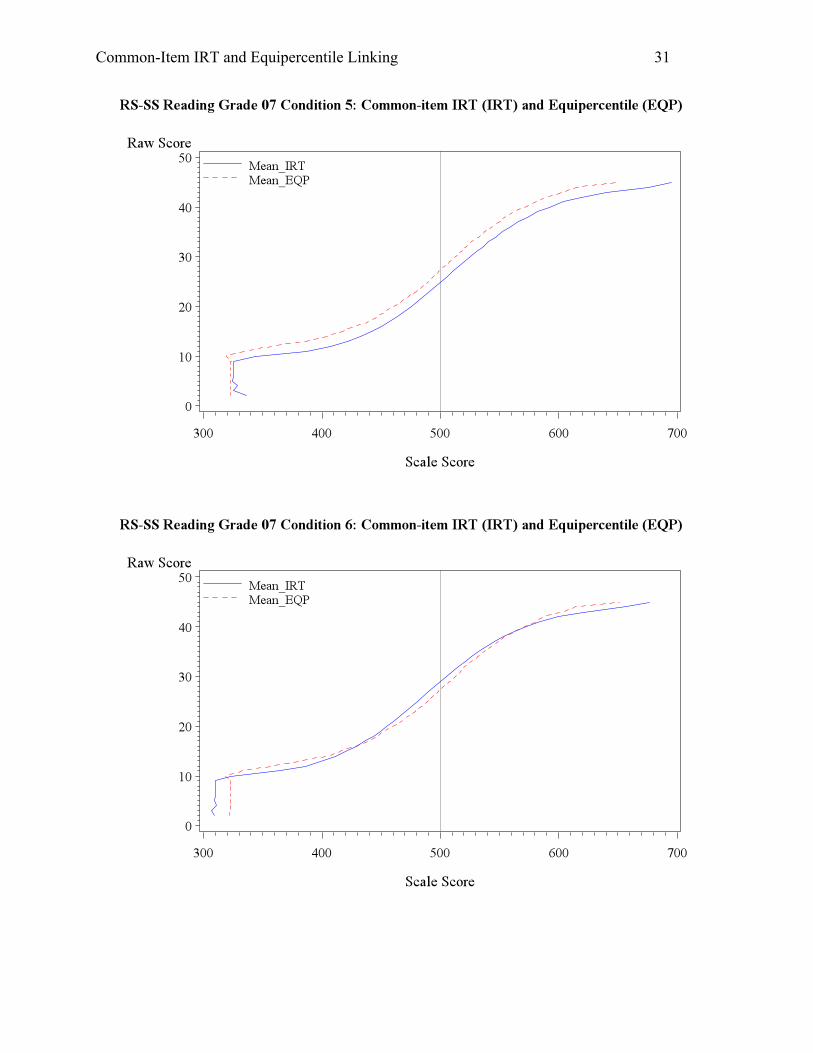
mean scale scores and graphs in Appendix A. Condition 5 had a 0.2 drop in anchor item
difficulty, meaning that the students did better on the anchor set. Coupled with the overall
growth of ability, Condition 5 saw a large difference up to 0.3 standard deviation between the
mean scales scores for both reading and math, and the passing rates differed by around 10% as
well This scenario could occur when the students are more able, and perform even better on
anchor due to familiarity with the old standards and practice effect. Condition 6, on the contrary,
involved higher overall ability but poorer performance on the anchor test, which could occur
when the teacher focused on teaching new standards, and did not spend adequate time on the old
standards. The change of ability and anchor item difficulty in opposite directions offset each
other and resulted in slightly low scores for the IRT linking due to the larger magnitude in the
item parameter change.
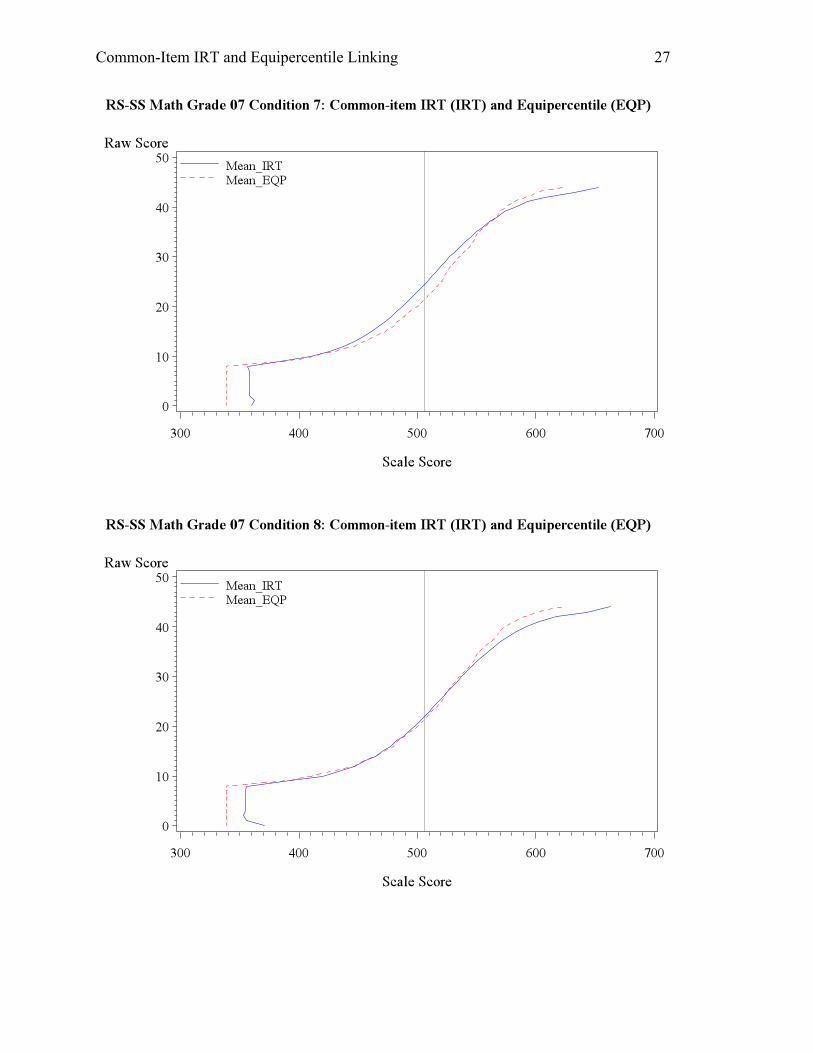
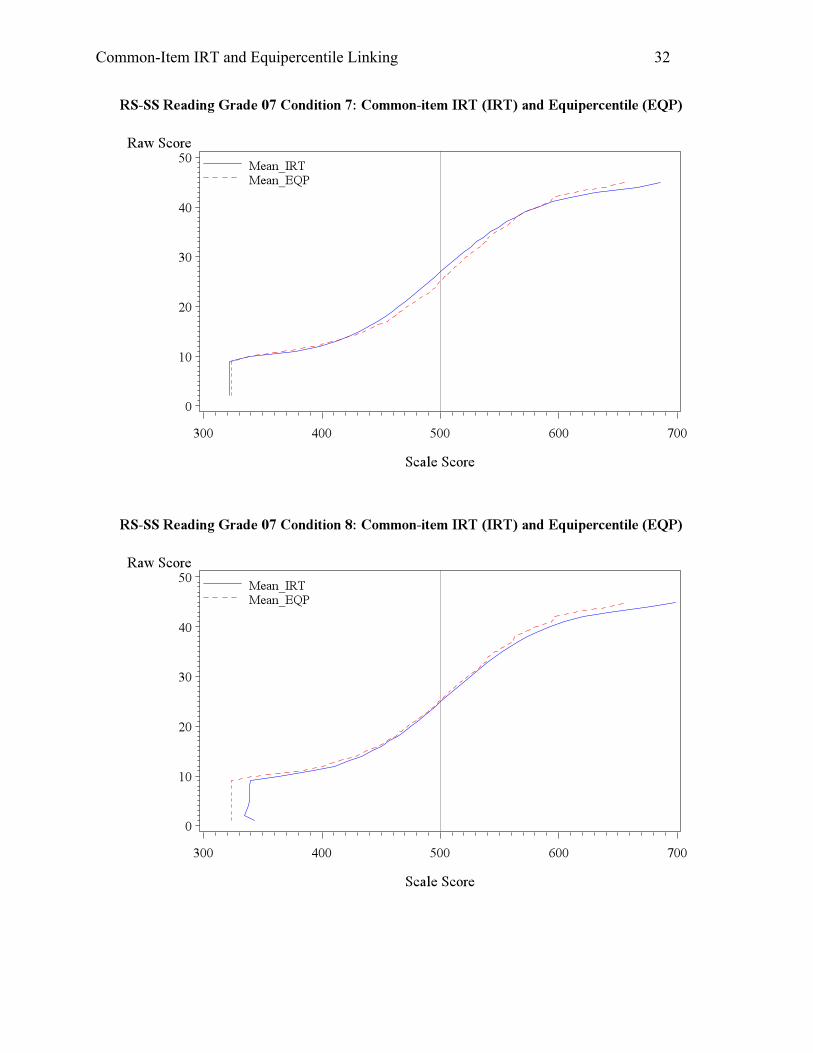
The last set of conditions, 7, 8, and 9, assume a decline in student ability, which would
likely cause overestimation of student ability when equipercentile linking is used. As expected,
Condition 7 yielded lower mean scale scores and passing rate for both reading and math. For
Condition 8, the student overall ability dropped but the anchor items were easier, so the
counteraction of the two factors brought about similar, yet slightly higher scores for the IRT
method, again due to the magnitude of the factors. In this case, students did well on the anchor
set due to better instruction in old standards and practice effect, but have not mastered new
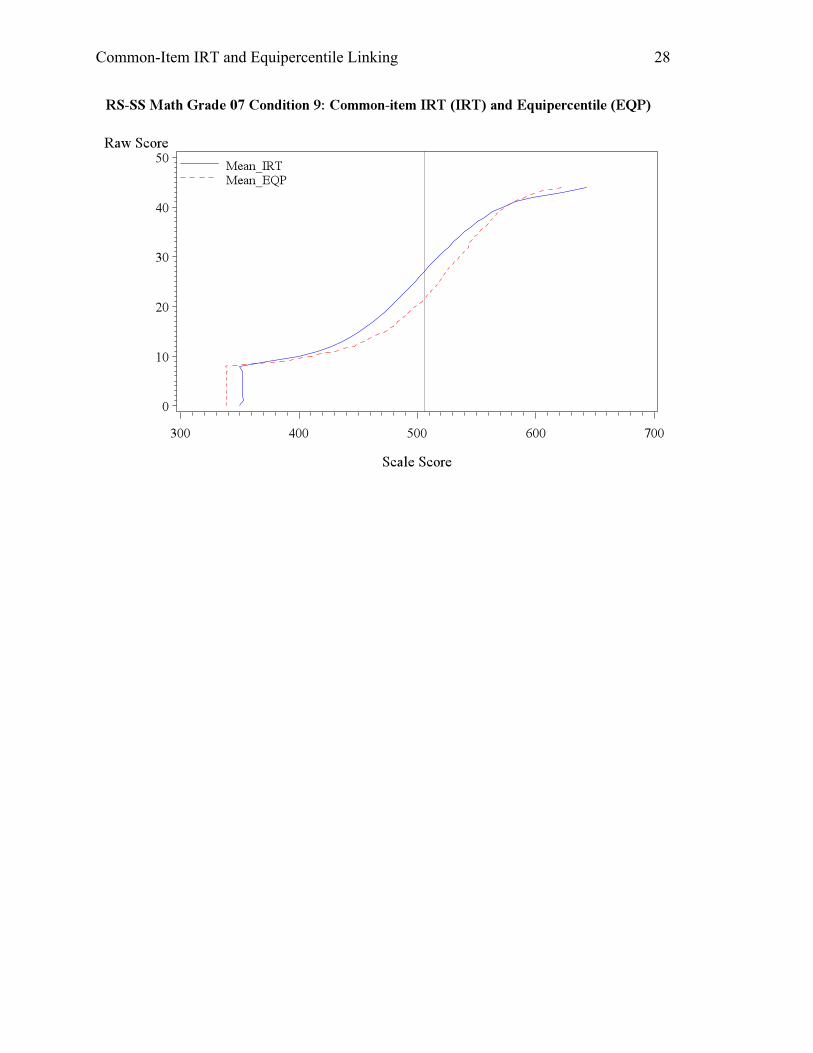
standards. Lastly, Condition 9 is another condition that saw a large discrepancy between the
resulting scale scores from the equipercentile and IRT linking. The student overall ability
dropped and the anchor items were proved harder for them. Therefore, the IRT linking produced
much lower mean scale scores (by about 15 score points) and passing rates (by about 15%) for
both reading and math.
Common-Item IRT and Equipercentile Linking 16
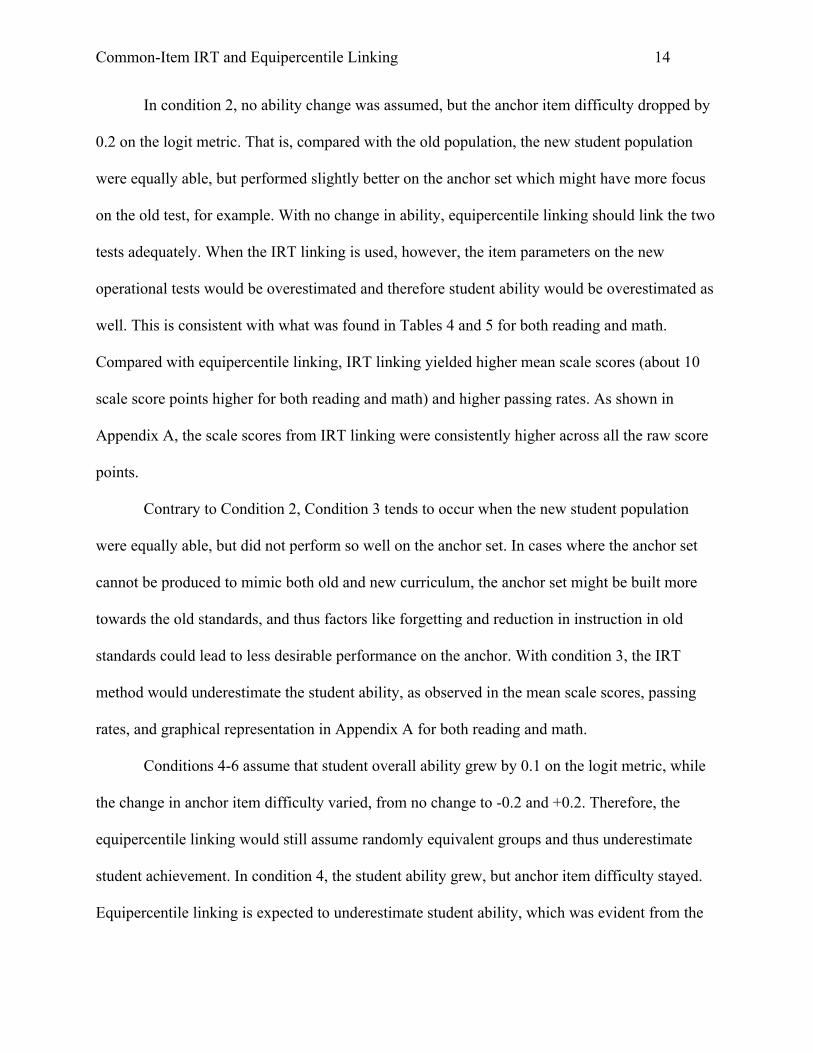
Estimation of Linking Error
The linking error for the equipercentile and common-item IRT linking was calculated as
the standard deviation of the mean scale scores corresponding to each raw score across 100
replications. Figures 1 and 2 below provide graphical representation of the linking error for the
equipercentile and common-item IRT linking in reading Condition 1.
Figure 1. Graphical Representation of Standard Error of Linking for Equipercentile linking: Reading Condition 1
Common-Item IRT and Equipercentile Linking 17
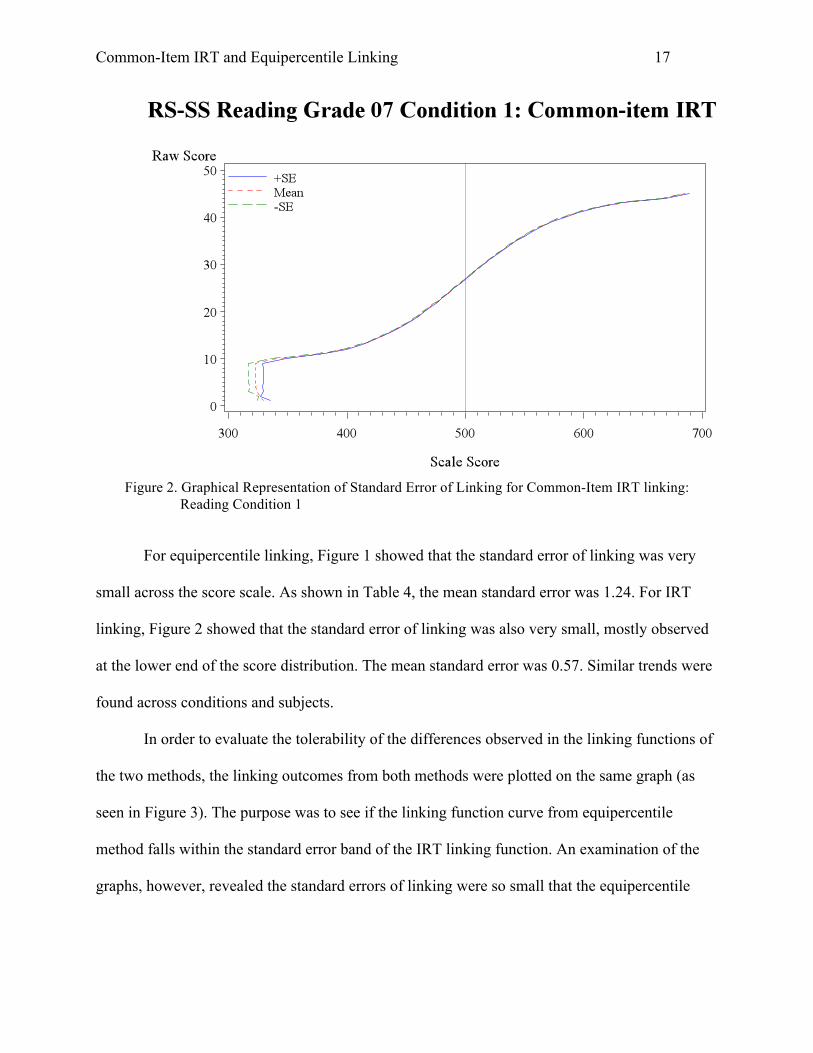
Figure 2. Graphical Representation of Standard Error of Linking for Common-Item IRT linking:
Reading Condition 1
For equipercentile linking, Figure 1 showed that the standard error of linking was very
small across the score scale. As shown in Table 4, the mean standard error was 1.24. For IRT
linking, Figure 2 showed that the standard error of linking was also very small, mostly observed
at the lower end of the score distribution. The mean standard error was 0.57. Similar trends were
found across conditions and subjects.
In order to evaluate the tolerability of the differences observed in the linking functions of
the two methods, the linking outcomes from both methods were plotted on the same graph (as
seen in Figure 3). The purpose was to see if the linking function curve from equipercentile
method falls within the standard error band of the IRT linking function. An examination of the
graphs, however, revealed the standard errors of linking were so small that the equipercentile
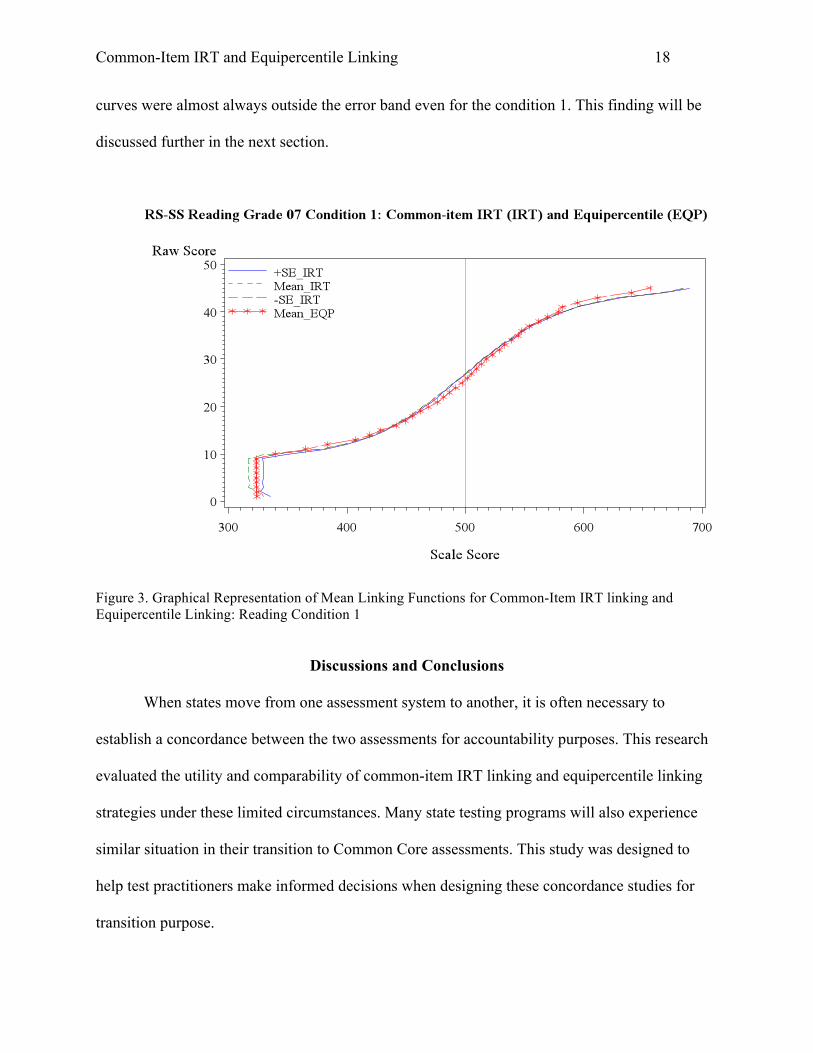
Common-Item IRT and Equipercentile Linking 18
curves were almost always outside the error band even for the condition 1. This finding will be
discussed further in the next section.
Figure 3. Graphical Representation of Mean Linking Functions for Common-Item IRT linking and Equipercentile Linking: Reading Condition 1
Discussions and Conclusions
When states move from one assessment system to another, it is often necessary to
establish a concordance between the two assessments for accountability purposes. This research
evaluated the utility and comparability of common-item IRT linking and equipercentile linking
strategies under these limited circumstances. Many state testing programs will also experience
similar situation in their transition to Common Core assessments. This study was designed to
help test practitioners make informed decisions when designing these concordance studies for
transition purpose.
Common-Item IRT and Equipercentile Linking 19
This study used empirical item parameter estimates and simulated student responses to
investigate the performance of equipercentile linking and common-item IRT linking. A total of 9
conditions were considered with varying degree of changes in student ability (0, +0.1, -0.1) and
anchor item difficulty (0, +0.2, -0.2). When the student ability had no change and randomly
equivalent groups were assumed in conditions 1-3, the IRT linking tended to overestimate
student ability when the anchor set was easier for them, and underestimate ability when the
anchor set was harder. When the new student population was more able in conditions 4-6, the
equipercentile linking tended to underestimate student ability. The degree of underestimation
varied by condition. When the anchor was equally hard for the new population, the
equipercentile linking underestimated student ability to a small degree by an average of 5 to 6
score points. The underestimation was more pronounced (from 15 to 17 score points) when the
anchor was proven easier as in Condition 5. In Condition 6 where the anchor was found harder
for the new group, however, the IRT linking resulted in even lower ability estimates for the new
population. Conditions 7-9 involved less able population on the new test. The equipercentile
linking was expected to give higher estimates for the new group, as seen in Condition 7 where no
difference in anchor difficulty was observed. When the anchor became easier in Condition 8,
IRT also provided higher estimates for the new population, thus resulting in a small difference
between the two linking yields. Under Condition 9 with the anchor being harder, the less able
group obtained much lower ability estimates from the IRT linking. Therefore, the difference in
ability estimates between the two linking methods became larger (up to 15 score points).
The standard error of linking was found to be very small (about 1/50 standard deviation)
for both the equipercentile link and common-item IRT linking. On average, the IRT linking
yielded even smaller standard error than the equipercentile method. A note needs to be made that
Common-Item IRT and Equipercentile Linking 20
the 100 replications of student response simulation, item parameters estimation, and ability
estimations were conducted only on the new test, not on the old test. This may not represent a
classic approach to standard error of linking as described in Kolen & Brennan (2004), and
therefore resulting in very small values as observed in the findings.
The results of the current study demonstrate the consequences of choosing the
equipercentile linking procedure over the IRT procedure under various conditions that we expect
exist in real world testing. For example, when the instructional system is still focused on
teaching the old standards (effects simulated in conditions 2, 5, and 8), student progress is
significantly underestimated using the equipercentile method. On the other hand, if the
instruction system has fully migrated to the new standards (effects simulated in conditions 3, 6,
and 9), student performance is significantly underestimated using the IRT method. Of course, the
actual degree to which the new instructional standards have been implemented in a state is
unlikely to be the same in every school and district. Choice of methodology should be aligned
with the priorities of the instructional program and accountability system.
The accuracy of anchor-item non-equivalent groups design depends heavily on the choice
of anchor set. The requirement that the old test, new test, and the anchor set all measure the same
construct in the same manner may not be likely in these cases. The anchor items often cannot
adequately represent the content of both old and new tests. If possible, Holland (2007)
recommended conducting linking with different anchor tests so that the sensitivity of the linking
to choice of anchor test can be assessed.
Whereas this study provides helpful information on the use of equipercentile linking and
common-item IRT linking during the transition from old assessments to new assessments, there
are distinct limitations that direct us to future research. This study manipulated changes only in
Common-Item IRT and Equipercentile Linking 21
anchor item difficulty and mean score distribution. Further research on the effects of the item
discrimination variability as wells as score distribution variability would shed more light on the
value of the equipercentile linking and common-item IRT linking. Other levels of change in
ability distribution and anchor item difficulty can also be considered. Furthermore, if an anchor
test is used to link the old and new tests that measure similar but somewhat different constructs,
real student response data would provide more realistic view of the differences in ability
estimates between the equipercentile linking and IRT linking. Depending on how well the anchor
set represents the old and new tests in terms of content and difficulty, and how much the new and
old student populations differ in ability, the two methods may function differently than perceived
in this study.
Common-Item IRT and Equipercentile Linking 22
References
Dorans, N.J., Pommerich, M., & Holland, P.W. (Editors) (2007). Linking and Aligning Scores
and Scales. New York: Springer
Kim, S. and Kolen, M. (2004). STUIRT [computer program]. Iowa City, IA: The University of
Iowa.
Kolen, M. J., & Brennan, R. L. (2004). Test equating, scaling, and linking. Methods and
practices (2nd Ed.). New York: Springer.
Kolen, M. J. & Cui, Zhongmin (2004). POLYEQUATE. The University of Iowa: Iowa
City.
Hambleton, R. K., & Swaminathan, H. (1985). Item response theory: Principles and applications.
Boston: Kluwer Nijhoff.
Holland, P. W. (2007). A framework and history for score linking, in Dorans, N.J., Pommerich,
M., & Holland, P.W. (Editors). Linking and Aligning Scores and Scales. New York:
Springer
Thissen, D. (2003). MULTILOG 7: Multiple categorical item analysis and test scoring using item
response theory [computer program]. Chicago, IL: Scientific Software.
Thissen, D. & Wainer, H. (Eds) (2001). Test Scoring. Hillsdale, NJ: Lawrence Erlbaum
Associates.
Zeng, L., Kolen, M. J., Hanson, B.A., Cui, Z., & Chien, Y. (2005). RAGE-RGEQUATE
[computer program]. Iowa City, IA: The University of Iowa.
Common-Item IRT and Equipercentile Linking 23
Appendix A
Average Linking Relationships across Replications: Common-Item IRT and Equipercentile
Common-Item IRT and Equipercentile Linking 24
Common-Item IRT and Equipercentile Linking 25
Common-Item IRT and Equipercentile Linking 26
Common-Item IRT and Equipercentile Linking 27
Common-Item IRT and Equipercentile Linking 28
Common-Item IRT and Equipercentile Linking 29

Common-Item IRT and Equipercentile Linking 30
Common-Item IRT and Equipercentile Linking 31
Common-Item IRT and Equipercentile Linking 32

Common-Item IRT and Equipercentile Linking 33