LIMB MECHANICS AS A FUNCTION OF SPEED AND...
25
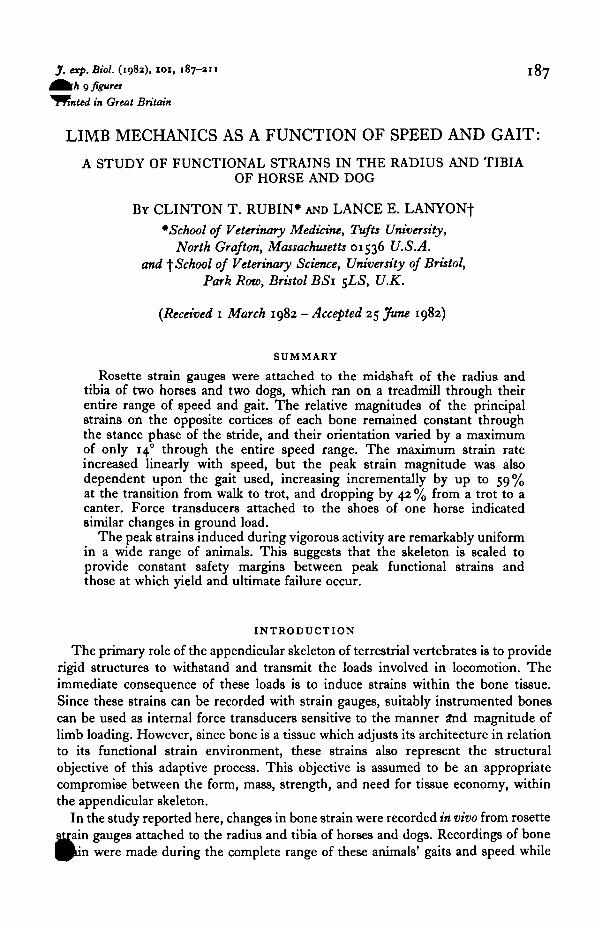
J. exp.Biol. (198a), IOI, 187-an ^^th 9 figures in Great Britain LIMB MECHANICS AS A FUNCTION OF SPEED AND GAIT: A STUDY OF FUNCTIONAL STRAINS IN THE RADIUS AND TIBIA OF HORSE AND DOG BY CLINTON T. RUBIN* AND LANCE E. LANYONf •School of Veterinary Medicine, Tufts University, North Graf ton, Massachusetts 01536 U.S.A. and f School of Veterinary Science, University of Bristol, Park Row, Bristol BSi 5LS, U.K. (Received 1 March 1982 - Accepted 25 June 1982) SUMMARY Rosette strain gauges were attached to the midshaft of the radius and tibia of two horses and two dogs, which ran on a treadmill through their entire range of speed and gait. The relative magnitudes of the principal strains on the opposite cortices of each bone remained constant through the stance phase of the stride, and their orientation varied by a maximum of only 14 0 through the entire speed range. The maximum strain rate increased linearly with speed, but the peak strain magnitude was also dependent upon the gait used, increasing incrementally by up to 59% at the transition from walk to trot, and dropping by 42 % from a trot to a canter. Force transducers attached to the shoes of one horse indicated similar changes in ground load. The peak strains induced during vigorous activity are remarkably uniform in a wide range of animals. This suggests that the skeleton is scaled to provide constant safety margins between peak functional strains and those at which yield and ultimate failure occur. INTRODUCTION The primary role of the appendicular skeleton of terrestrial vertebrates is to provide rigid structures to withstand and transmit the loads involved in locomotion. The immediate consequence of these loads is to induce strains within the bone tissue. Since these strains can be recorded with strain gauges, suitably instrumented bones can be used as internal force transducers sensitive to the manner a*nd magnitude of limb loading. However, since bone is a tissue which adjusts its architecture in relation to its functional strain environment, these strains also represent the structural objective of this adaptive process. This objective is assumed to be an appropriate compromise between the form, mass, strength, and need for tissue economy, within the appendicular skeleton. In the study reported here, changes in bone strain were recorded in vivo from rosette gauges attached to the radius and tibia of horses and dogs. Recordings of bone dn were made during the complete range of these animals' gaits and speed while
Transcript of LIMB MECHANICS AS A FUNCTION OF SPEED AND...
J. exp.Biol. (198a), IOI, 187-an^^th 9 figures
in Great Britain
LIMB MECHANICS AS A FUNCTION OF SPEED AND GAIT:
A STUDY OF FUNCTIONAL STRAINS IN THE RADIUS AND TIBIAOF HORSE AND DOG
BY CLINTON T. RUBIN* AND LANCE E. LANYONf
•School of Veterinary Medicine, Tufts University,North Graf ton, Massachusetts 01536 U.S.A.
and f School of Veterinary Science, University of Bristol,Park Row, Bristol BSi 5LS, U.K.
(Received 1 March 1982 - Accepted 25 June 1982)
SUMMARY
Rosette strain gauges were attached to the midshaft of the radius andtibia of two horses and two dogs, which ran on a treadmill through theirentire range of speed and gait. The relative magnitudes of the principalstrains on the opposite cortices of each bone remained constant throughthe stance phase of the stride, and their orientation varied by a maximumof only 140 through the entire speed range. The maximum strain rateincreased linearly with speed, but the peak strain magnitude was alsodependent upon the gait used, increasing incrementally by up to 59%at the transition from walk to trot, and dropping by 42 % from a trot to acanter. Force transducers attached to the shoes of one horse indicatedsimilar changes in ground load.
The peak strains induced during vigorous activity are remarkably uniformin a wide range of animals. This suggests that the skeleton is scaled toprovide constant safety margins between peak functional strains andthose at which yield and ultimate failure occur.
INTRODUCTION
The primary role of the appendicular skeleton of terrestrial vertebrates is to providerigid structures to withstand and transmit the loads involved in locomotion. Theimmediate consequence of these loads is to induce strains within the bone tissue.Since these strains can be recorded with strain gauges, suitably instrumented bonescan be used as internal force transducers sensitive to the manner a*nd magnitude oflimb loading. However, since bone is a tissue which adjusts its architecture in relationto its functional strain environment, these strains also represent the structuralobjective of this adaptive process. This objective is assumed to be an appropriatecompromise between the form, mass, strength, and need for tissue economy, withinthe appendicular skeleton.
In the study reported here, changes in bone strain were recorded in vivo from rosettegauges attached to the radius and tibia of horses and dogs. Recordings of bone
dn were made during the complete range of these animals' gaits and speed while

188 CLINTON T. RUBIN AND LANCE E. LANYON
running on a treadmill. These data are considered in relation to the mechanicslocomotion, and the functional significance of bone form.
Bone strain, locomotor mechanics and gait change
Cursorial quadrupeds increase their speed by using different gaits in which themovements of the trunk, and the relative timing of the support and swing phases ofthe limbs, are altered. Although the sequence of movements involved in these gaitshas been described in detail (Muybridge, 1957; Gambaryan, 1974; Hildebrand, 1959,1965, 1976; Gray, 1968), the specific mechanical and metabolic benefits of each gaitremain controversial. Many previous studies have centred on measuring totaloxygen consumption (Taylor, Schmidt-Nielsen & Raab, 1970; Taylor & Rowntree,1973; Fedak & Seeherman, 1979; Hoyt & Taylor, 1981), which gives little indicationof the distribution of muscle activity within the body, on qualitative EMG recording(Tokuriki, 19730, 1973 b, 1974; Taylor, 1978; Goslow et al. 1981), which providesinformation relevant to the electrical activity of the muscle but not the amount oftension it develops; on cinematographic analysis of the moments and forces actingabout joints (Alexander, Langman & Jayes, 1977; Alexander, Jayes &~Ker, 1980;Alexander & Goldspink, 1977), which relies heavily on theoretical assumptions; andon force plate analyses (Pratt, 1976; Heglund, 1979; Cavagna, Heglund & Taylor,1977; Alexander & Jayes, 1978), which are confined to whole animal or single limbcontact forces. Data revealed by each of these methods alone is limited and candisguise or misrepresent the mechanical and metabolic benefits of gait change. Toinvestigate these benefits directly it is necessary to know at all times each muscle'senergy consumption, or its tension and length, either of which would be difficult toachieve. However, one consequence of tension is that it loads the bones to which themuscles are anchored. The normal pattern of limb bone deformation therefore resultsfrom (and can be used as a measure of changes in) the internal forces caused by themuscles as they react with the externally imposed forces originating from the animal'scontact with the ground. Any alterations in the absolute or relative magnitude of theseforces should be detectable in terms of the size and pattern of strains engenderedwithin the limb bones.
In the experiments reported here, the bone strain data, which were obtained fromthe radius and tibia of horses and dogs over these animals' complete speed range on atreadmill, are examined in relation to the load distributions which occur in the limbsduring each gait, and at each gait transition.
Bone strain and the functional significance of bone form
Since the primary responsibility of the appendicular skeleton must be to supportthe animal and not break or suffer high levels of damage even under the extremes ofnormal loading, there are obvious advantages in each bone being as massive aspossible. However, since bone tissue is also metabolically expensive, both to produceand, subsequently, to transport, there are conflicting advantages between bone struc-ture being massive and so creating high safety factors to failure, and bones containingless tissue and therefore economical to transport, but having a higher risk of fracture.
The suitability of each bone for its structural role results from two major influence
Limb mechanics as a function of speed and gait 189Hhe overall shape and anatomical relationship of the bone are genetically determinedand will develop in the absence of functional stimuli (Lanyon, 1980). However, itsfinal form, mass, and detailed architecture are influenced by mechanical activity andare therefore a unique achievement for each animal. The features most greatlyinfluenced by mechanical function are those with obvious structural significance, i.e.the presence and size of crests and tuberosities, the thickness of cortices, the amountand orientation of cancellous tissue, and the degree of curvature of long boneshafts.
Although the nature of the functional influences responsible for the productionand maintenance of normal bone structure are not understood, the evidence suggeststhat they are derived from some aspect of the mechanical circumstances which thebone encounters (Wolff, 1870; Roux, 1895; Koch, 1917; Goodship, Lanyon &MacFie, 1979; Rubin & Lanyon, 1981; Hayes & Snyder, 1981; Lanyon et al. 1982).For the bones of cursorial quadrupeds, the predominant functional stimulus willalmost certainly be provided by locomotion, and the structural objective of bonearchitecture in the limbs will therefore be related to the mechanical demands whichthis activity imposes. The strain data obtained from the experiments described herewill be considered in relation to this structure-function relationship.
MATERIALS AND METHODS
Limb terminology during gaits
At any gait, each individual limb performs essentially the same action, slowing orincreasing its relative motion according to the requirements of speed (Tokuriki,1973 a, 19736, 1974)- The difference between gaits depends primarily on the sequencein which the limbs are placed on the ground. During the walk the principal supportphases occur between either diagonally opposite, or ipsilateral, fore and hind limbs.Between these two main support phases, there are transient phases when three, oreven four, legs may be touching the ground, but at no time are there less than twofeet with ground contact. As speed at the walk increases, the limbs move faster untilthe animal changes from a walk to a trot. This gait consists of alternating support bydiagonally opposite fore and hind limbs moving in phase with one another. Eachdiagonal support phase is separated by an aerial (floating) phase.
During the canter, the footfall pattern is changed so that the legs of one diagonallyopposite pair move out of phase with each other while those of the other pair remain'in-phase'. A single stride of the canter begins with the lead ('out-of-phase') forelimb,which throws the animal into the aerial phase. The animal lands on the diagonallyopposite (out-of-phase) hind limb. The contralateral hind limb and its diagonallyopposite (in-phase) forelimb make ground contact simultaneously in the same waythat they did in the trot. As the stance phase of these diagonally opposite in-phaselimbs ends, the out-of-phase lead forelimb is placed to the ground and provides theanimal's sole support before it is propelled into the aerial phase of the next stride.
As the animal's speed increases it will change gait from a canter to a transversegallop. The difference in limb sequencing between these two gaits specifically con-cerns the relationship between the in-phase fore and hind limb which at the trot andianter had been working synchronously. During a transverse gallop the previously
190 CLINTON T . RUBIN AND LANCE E. LANYON
in-phase hind leg makes contact before the previously in-phase foreleg. A totalfour independent limb contacts are thus made with the ground, and in some animalsthe relationship of the previously synchronous (in-phase) pair of limbs becomes soextended that there is a second aerial phase between them. Although other animalsuse a variety of other gaits (e.g. rotary gallop, pace, bound, etc.), the four footfallpatterns described above were the gaits normally exhibited by the animals used inthese experiments.
Principles of strain measurement
When a structure is deformed, even in a very simple manner, the strain producedwithin it is complex. If a solid cube of isotropic material is compressed between twoopposing faces, it will compress in that plane and stretch in the plane perpendicularto it. The ratio of the change in any dimension to the original dimension is the strain.At any point on the structure's surface there will be a principal compressive strainand, at right angles to it, a principal tensile strain. In these principal strain directionsthere is no shear strain. In any direction other than the principal directions there is acomponent of shear which varies in magnitude, but is maximum at 45 ° to the direc-tions of the principal tensile and compressive strains. If the loading pattern of thestructure is complex, and the material is anisotropic, the relative magnitude of theprincipal strains will be affected as will be their orientation with respect to the direc-tion of loading. Despite this, the direction of the principal tensile and compressivestrains will always remain at right angles to each other.
By attaching strain gauges to a structure's surface, the changes in dimension ofthat surface can be measured. The type of strain gauge used in this and previousin vivo studies on bone (Lanyon, 1973) is composed of an electrical conductor madeof metal foil arranged as a grid mounted on a thin supporting epoxy-resin base. Thebase is glued to the bone surface so that the gauge element deforms with the structure'ssurface. The resulting change in the conductor's dimensions alters its electricalresistance and this change can be recorded. A single strain-sensitive element can onlyrespond to changes in strain from the surface of the structure to which it is attached,and it is maximally sensitive to strains in the directions in which its grid is aligned.This severe limitation of single element gauges makes it necessary to use rosettestrain gauges which are composed of three completely independent strain-sensitivegrids. These grids are stacked over the same area and are aligned at zero, 45 and 900
relative to one another. Using the independent values of strain from these threedirections, the changes in the size and direction of the principal strains can be com-puted using standard formulae (Dally & Riley, 1978). The alignment of the rosettegauge relative to the bone's princpal strain directions (or the bone's geometry) isunnecessary since the principal directions are calculated and corrected to the bone'slong axis using radiographs or the isolated bone post-mortem.
Calculation of bone loads
Each strain gauge provides data relevant to the small area of bone surface to whichit is adherent. By using rosette data from two sites opposite one another on the bone'scircumference, the loading situation of the bone can be approximated (Lanyon et^

Limb mechanics as a function of speed and gait 191
P981 b). The three components of load - axial force, bending moment, and torsion -can be calculated from the strains by using the natural and sectional properties of thebone. In this study, the primary loading conditions of the bone were assumed toconsist of axial force and bending moment. To determine the magnitude of theseloads, the principal strains were first converted through a coordinated transformationmatrix into strains in the longitudinal and transverse directions. From the relation-ships of these, the proportion of the total strain due to bending or axial compressioncan be calculated. Through a reduced stress matrix, the isolated longitudinal stressesnecessary to produce these strains can also be determined (Carter, 1978).
The cross-sectional shape, area, and second moment of area of the horse boneswere assessed from anteroposterior and lateral radiographs of the limbs. The dogswere killed after the experiment, and the bone dimensions were measured directly.With this bone geometry, bending moments in one plane and loads due to axial forcecan be calculated (Crandall, Dahl & Lardner, 1977). The axial force can be trans-formed to the weight-referenced gravitational force, and stresses due to axial force orbending moment can also be determined. A value of 18-2 GPa is used for the longitu-dinal elastic modulus, 12-2 GPa for the transverse modulus, and 0*46 for the Poisson'sratio of longitudinal stress/transverse strain (Lanyon, Magee & Baggot, 1979;Schryver, 1978; Carter, 1978).
Experimental procedure
Bone strain was recorded from rosette strain gauges, attached to the cranial andcaudal surfaces of the right radial and tibial midshafts of two adult dogs (29 and 32 kg)and two adult ponies (147 and 138 kg), during locomotion on a treadmill. The gaugeswere attached under general halothane anaesthesia using a single medial incision overthe bone's diaphysis and reflexion of limb musculature, exposing the cranial andcaudal gauge sites without any muscle disruption. The bone surface was prepared byremoving a small (10 mm2) area of the bone's periosteum, drying the exposed surface,swabbing it with methyl-ethyl-ketone, and then gluing the gauge to the surface withisobutyl 2-cyanoacrylate monomer. The lead wires from the gauge passed through asmall epoxy resin flange which was anchored to the bone's surface some 30 mm fromthe gauges by a 1-5 mm diam. stainless steel screw inserted into a tapped hole in thecortex. The leads were passed subcutaneously and emerged through the skin at a remoteincision. The wound was closed, and the lead ends then connected to a series of straingauge bridge amplifiers via a standard six pin plug connector. The orientation andposition of the gauges were determined from cranio-caudal and lateral radiographs.
All the animals used were in good physical condition and had previously been trainedto perform on the treadmill over their complete range of speed. Post-operative sorenesshad subsided sufficiently by 2 days after gauge implantation such that the animalswere willing to run on the treadmill up to their previously determined maximumspeeds without discernible lameness. While the dog radius and tibia were instrumentedin separate operations, the ponies' tibias and radii were instrumented on the sameoccasion, allowing data from all 12 gauge elements to be recorded onto magnetictape simultaneously. On at least one occasion, each animal's strain recordings were•tnchronized to cine film taken at 200 f.p.s.
7-2
192 CLINTON T. RUBIN AND LANCE E. LANYON
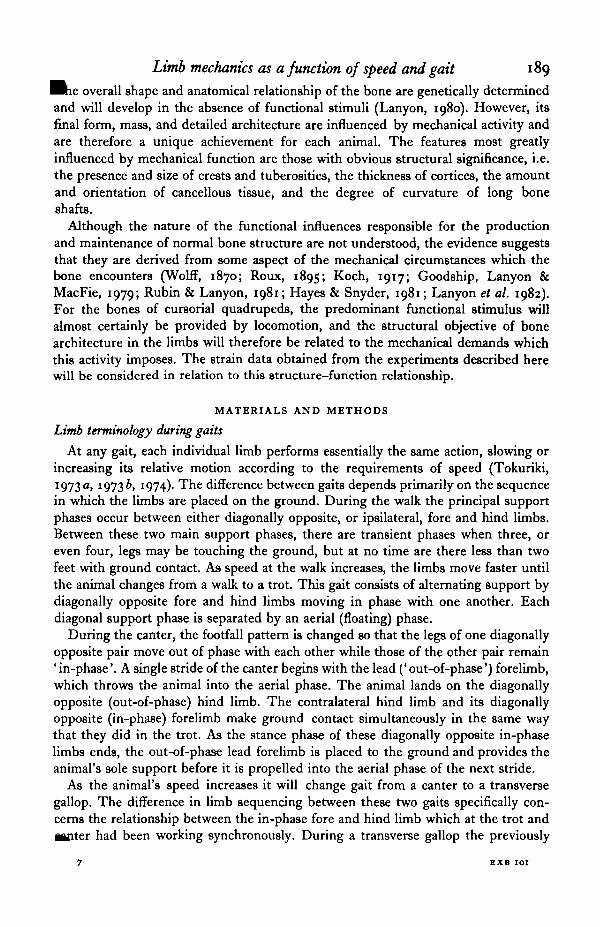
Fig. i. Peak principal tensile (upper trace) and compressive (lower trace) strain on the caudalsurface of the radius of dog B, together with the orientation of the principal compressive strainin relation to the long axis of the bone, taken while the animal walked at 4-2 kph. While boththe tensile and compressive strain magnitudes change quickly during the stance phase of thelimb, the orientation of the principal strains remains remarkably constant.
Analysis of bone strain data
Calculations of the magnitude and orientation of principal strains were made fromthe 'raw' (3-element) strain data of at least six consecutive strides. The analoguestrain gauge data from the F.M. tape was digitized through an A-D convertor andentered into a microprocessor. From these data, principal strain calculations weremade at each speed at 5 ms intervals, and the magnitudes of principal tensile strain(%), compressive strain (ee), and their respective directions relative to the long axisof the bone (6et and 6ec) were fJlotted. The location of zero strain from each channelof the changing strain gauge signal was adjusted to be zero volts by applying a suitabled.c. voltage off-set to the tape recorder output signal. Positions of zero strain from thegauge traces were taken to be the strain levels during the swing phase of the limbwhen the three gauges of the rosette showed little or no change in strain. These zerostrain levels are identical to those occurring when the leg is lifted from the ground,or when the animals were anaesthetized and lying on their sides.
RESULTS
Changes in strain and strain orientation during a stride
The processed principal strain data analysed from the caudal surface of the radiusof dog B while walking on the treadmill are indicated in Fig. 1. The features of thesastrain cycles were common to all gauges. During the swine phase, there is little or
Limb mechanics as a function of speed and gait 193
0 1 2Time (s)
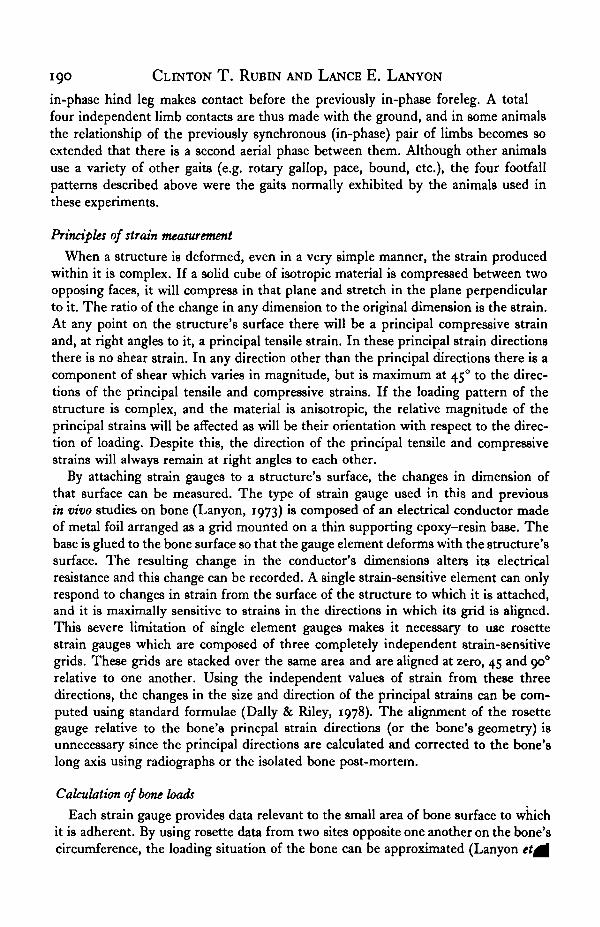
Fig. 3. Similar data to that shown in Fig. 1, from the caudal radius of horse A taken whiletrotting at 8-6 kph. The constancy of strain orientation is again maintained throughout thestance phase of the limb, and is similar to that at different gaits.
change in raw strain in any element of the gauges, and this flat portion in the gaugetraces is taken to represent zero strain (Fig. 1). As the limb is placed to the groundand the bone is loaded, there is a sharp increase in both the principal tensile (et) andprincipal compressive (ec) strains, which reach a peak approximately midway throughthe stance phase. Both components of principal strain then quickly return to zeroas the leg again enters the swing phase. The orientation of the larger principal strain(6ec) relative to the long axis of the bone is also shown. The direction of the smallerprincipal strain (6et) is always 900 removed.
In all the bones instrumented, the principal compressive strain was the largerprincipal strain on the caudal surface and was closely aligned to the bone's longitudinalaxis. On the cranial surface the principal tensile strain was larger in magnitude andoriented more closely to the bones' longitudinal axis than the transverse compressivestrain. In all cases, the peak principal compressive strain (Pec) on the caudal surfacewas larger than the peak principal tensile strain (Pet) on the cranial surface. This strainsituation is consistent with the predominant loading mode of these bones, i.e. axialcompression with superimposed cranio-caudal bending.
In contrast to the abrupt changes in strain magnitude which occurred throughoutthe stance phase of the stride, the strain direction remained constant. The change instrain orientation during the loading period was always less than 4° from its orientationat the instant when peak principal strain was developed (Figs. 1, 2).
Changes in strain orientation as a function of speed and gait
Since the strain direction changed so little during the stance period of the limb, itsentation at peak principal strain {OP^ or 6Pec) was considered to be representative
194 CLINTON T. RUBIN AND LANCE E. LANYON
| -1750
S. -1250oo
-750
o
S
10
10
1250
750
• •
Caudal
A AA A A t • m 9T T T • • J
• • •Cranial
• • •
10 15Speed (kph)
20 25
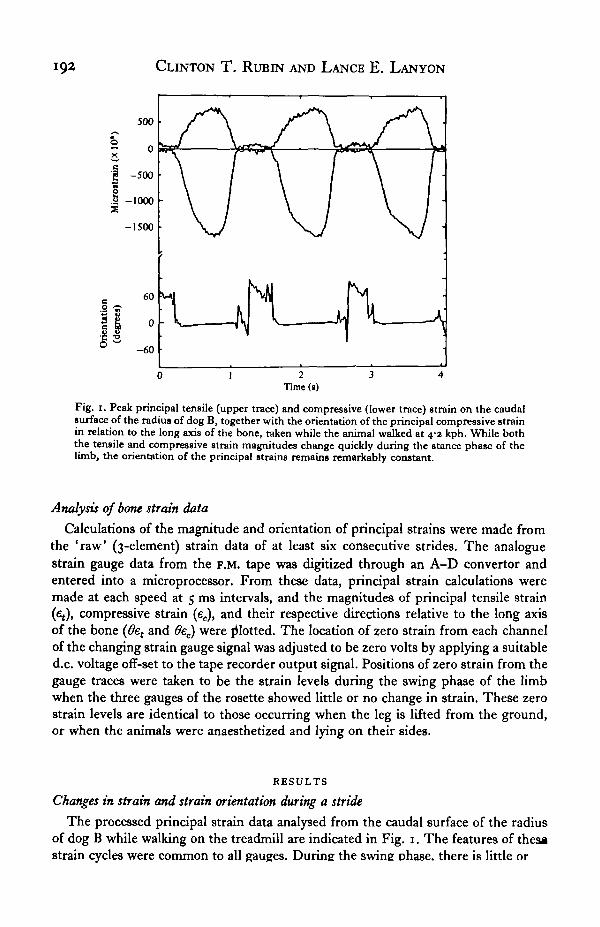
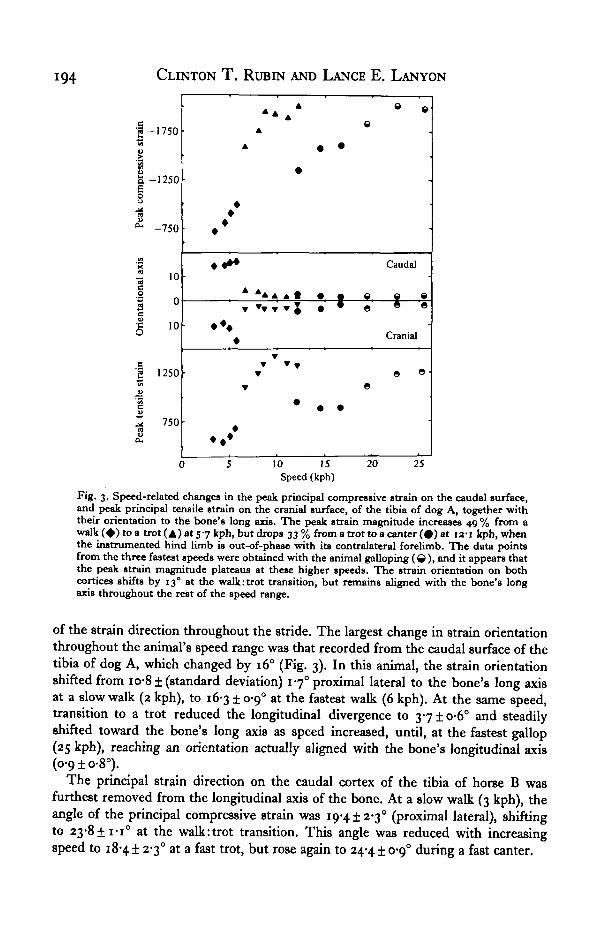
Fig. 3. Speed-related changes in the peak principal compressive strain on the caudal surface,and peak principal tensile strain on the cranial surface, of the tibia of dog A, together withtheir orientation to the bone's long axis. The peak strain magnitude increases 49 % from aw a l k ( 4 ) t o a trot (A) at 5 7 kph, but drops 33 % from a trot to a canter ( • ) at 121 kph, whenthe instrumented hind limb is out-of-phase with its contralateral forelimb. The data pointsfrom the three fastest speeds were obtained with the animal galloping ( © ) , and it appears thatthe peak strain magnitude plateaus at these higher speeds. The strain orientation on bothcortices shifts by 13° at the walk:trot transition, but remains aligned with the bone's longaxis throughout the rest of the speed range.
of the strain direction throughout the stride. The largest change in strain orientationthroughout the animal's speed range was that recorded from the caudal surface of thetibia of dog A, which changed by 160 (Fig. 3). In this animal, the strain orientationshifted from io-8± (standard deviation) 170 proximal lateral to the bone's long axisat a slow walk (2 kph), to 16-3 ± 0-9° at the fastest walk (6 kph). At the same speed,transition to a trot reduced the longitudinal divergence to 37±o-6° and steadilyshifted toward the bone's long axis as speed increased, until, at the fastest gallop(25 kph), reaching an orientation actually aligned with the bone's longitudinal axis(0-9 ±o-8°).
The principal strain direction on the caudal cortex of the tibia of horse B wasfurthest removed from the longitudinal axis of the bone. At a slow walk (3 kph), theangle of the principal compressive strain was 19-4 ±2-3° (proximal lateral), shiftingto 23-8 ± I - I ° at the walk:trot transition. This angle was reduced with increasingspeed to 18-4 ± 2-3° at a fast trot, but rose again to 24-4 ± 0-9° during a fast canter.

Limb mechanics as a function of speed and gait 195
8
Canter 23 kph
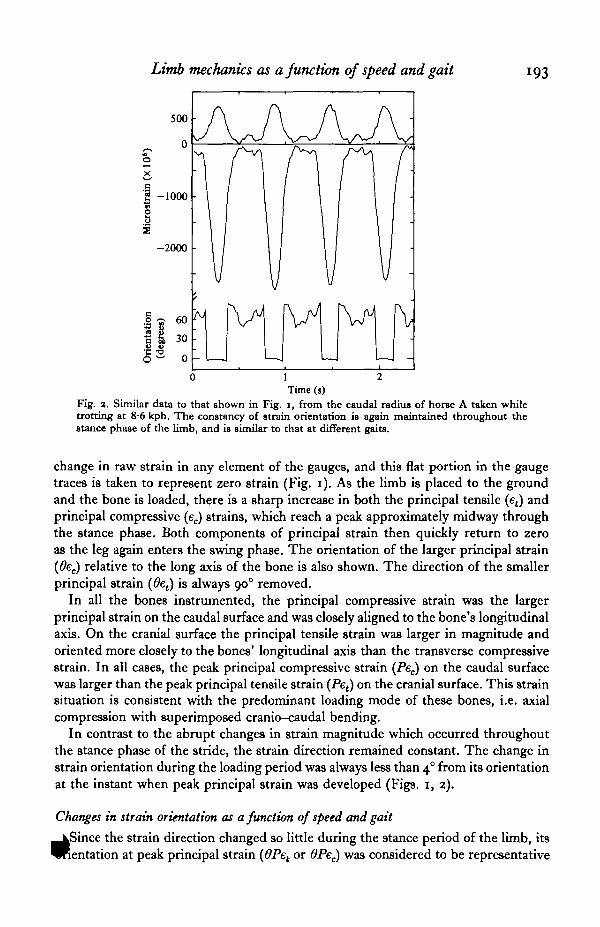
Fig. 4. Tracing from a cranio-caudal radiograph of the tibia of horse B. The size and orien-tation of the principal tension (<—•) and compression (» <) strains at the gauge site on thecaudal aspect are indicated. The increase in size, but relative constancy in orientation of thesestrains is evident.
The loading orientation of the other experimental bones diverged very little through-out the range of speed, and remained closely aligned with the longitudinal axis. Thestandard deviation of the variance in orientation produced at any given speed was nogreater than ± 2-3° for any animal (Fig. 4).
Changes in strain magnitude as a function of speed and gait
The peak strains referred to in the following sections are the larger of the two peakprincipal tensile or compressive strains on each cortex. In each case, these were alsothe strains aligned closest to the longitudinal axis of the bone (in tension on the cranialsurface and compression caudally). However, the principal strains longitudinallyoriented on the concave surface were always higher than those strains on the tensilesurface and for this reason, the results will concentrate on these larger compressivestrains.

196 CLINTON T. RUBIN AND LANCE E. LANYON
Dog tibia
The peak principal strains of dog A's caudal tibia were compressive and increasedfrom - 702 ± S.D. 35 to - 1059 + 49 microstrain (jie) during walking at speeds rangingfrom 2-5-57 kph (Fig. 3). At the walk:trot transition, strain magnitude increased49% to i58o±37/te and increased with increasing speed to -2006 ± 6 3 / ^ at thefastest trotting speed of 12*1 kph. This speed had been noted pre-operatively as thenatural gait transition speed. At this speed, while cantering, the dog used a left leglead, so that the instrumented right tibia was the ' out-of-phase' hindlimb. At thetrot:canter transition, the peak principal strain dropped 33% to - 1348 ±79/^, andthen increased linearly with speed to - 2016 ±<y) fie at 22-5 kph, at which time thedog was galloping. At the animal's maximum speed (247 kph) the strain had droppedslightly to -i998±50/i€. The peak principal longitudinal strain on the cranialsurface of the tibia was tensile, but showed similar changes in magnitude with speedand gait.
Dog radius
The peak principal strain on the caudal surface of dog B's radius increased 19%at the transition from a walk to a trot (-1503 ± 63 to - 1800± 22 fie at 4-2 kph) andreached -2384 ±49 /^ when trotting at the trot:canter transition speed of 11-4 kph.Following transition to a canter at this speed, there was a 13 % drop in peak principalstrain (to — 2087 ± 22 fie) when this leg was the non-lead leg. During the canter,peak principal strain on this in-phase forelimb increased with speed to — 2248 ± 41 fieat the fastest speed of 14-5 kph.
Horse tibia
The peak principal compressive strains on the caudal surface of horse A's tibiaranged from — 939 + 36 fie at a slow walk (4a kph) to — 3146 ± 65 fie at a fast canter(in-phase hind limb). During the walk, the peak principal strains increased withspeed in a linear fashion to —1295 ±47 fie at 5-3 kph, the predetermined normalwalk:trot transition point (Fig. 5). During trotting at this speed, peak strains wereincreased by 50% to —1943 ± So fie, and subsequently rose only slightly through thetrotting speed range, reaching — 2395 ± 93 fie at 18-5 kph, which was the fastest trotattained.
Horse A had been trained to extend her gait and to change her lead legs. Duringtrotting at 13-1 kph (4 kph below her normal trot:canter transition speed), the peakprincipal strain on the tibia was — 2363 ± 56 fie. While cantering at the same speed,this dropped 31% to —1637+127/^ when the instrumented leg was diagonallyopposite the lead forelimb (i.e. out-of-phase). The peak principal strains recorded whilethe tibia remained out of phase rose to — 2725 ± 53 fie at the fastest cantering speed of25-2 kph. When the trot:canter transition transferred to the opposite lead leg, theinstrumented tibia became in-phase whith the non-lead forelimb. The peak strainsat 137 kph fell only 2% at the transition from -2425194/^ during the trot to— 2391 ± 130/je at the canter. The peak principal strains continued to increase with
Limb mechanics as a function of speed and gait 197
-3000
-2000 •
-1000 •
10 15Speed (kph)
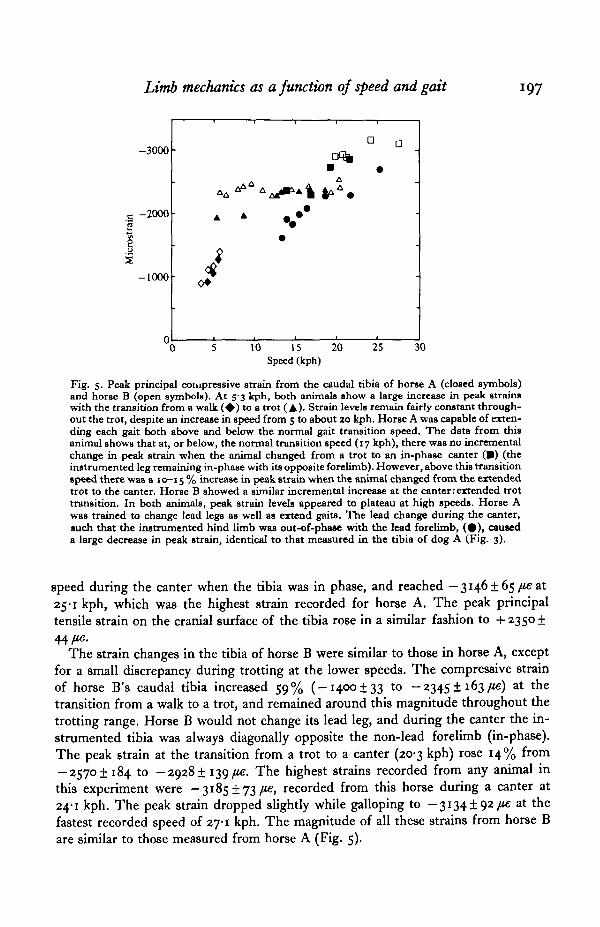
Fig. 5. Peak principal compressive strain from the caudal tibia of horse A (closed symbols)and horse B (open symbols). At 5-3 kph, both animals show a large increase in peak strainswith the transition from a walk ( • ) to a trot (A). Strain levels remain fairly constant through-out the trot, despite an increase in speed from 5 to about so kph. Horse A was capable of exten-ding each gait both above and below the normal gait transition speed. The data from thisanimal shows that at, or below, the normal transition speed (17 kph), there was no incrementalchange in peak strain when the animal changed from a trot to an in-phase canter (•) (theinstrumented leg remaining in-phase with its opposite forelimb). However, above this transitionspeed there was a 10-15 % increase in peak strain when the animal changed from the extendedtrot to the canter. Horse B showed a similar incremental increase at the canter: extended trottransition. In both animals, peak strain levels appeared to plateau at high speeds. Horse Awas trained to change lead legs as well as extend gaits. The lead change during the canter,such that the instrumented hind limb was out-of-phase with the lead forelimb, (9) , causeda large decrease in peak strain, identical to that measured in the tibia of dog A (Fig. 3).
speed during the canter when the tibia was in phase, and reached -3146±65/teat25-1 kph, which was the highest strain recorded for horse A. The peak principaltensile strain on the cranial surface of the tibia rose in a similar fashion to +2350 +
The strain changes in the tibia of horse B were similar to those in horse A, exceptfor a small discrepancy during trotting at the lower speeds. The compressive strainof horse B's caudal tibia increased 59% (-1400 ±33 to - 2 3 4 5 ! 163/«J) at thetransition from a walk to a trot, and remained around this magnitude throughout thetrotting range. Horse B would not change its lead leg, and during the canter the in-strumented tibia was always diagonally opposite the non-lead forelimb (in-phase).The peak strain at the transition from a trot to a canter (20-3 kph) rose 14% from— 2570! 184 to —29281139 fie. The highest strains recorded from any animal inthis experiment were -3185173/^ , recorded from this horse during a canter at24-1 kph. The peak strain dropped slightly while galloping to -3134192,06 at thefastest recorded speed of 27-1 kph. The magnitude of all these strains from horse Bare similar to those measured from horse A (Fig. 5).
198 CLINTON T. RUBIN AND LANCE E. LANYON
-2700
hX
1 -2000
i
-1300
* Trot
. • Walk
-
T ^
•
*
1
-
Lag-leg canter
Lead-leg canter
• * .-
1 1
10 15Speed (kph)
20 25
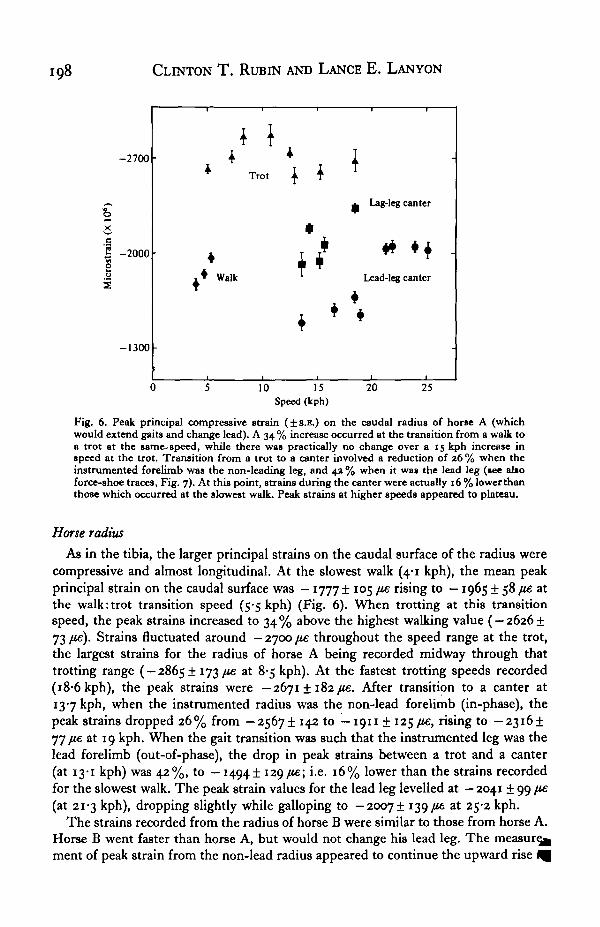
Fig. 6. Peak principal compressive strain (±s.R.) on the caudal radius of horse A (whichwould extend gaits and change lead). A 34 % increase occurred at the transition from a walk toa trot at the same-speed, while there was practically no change over a 15 kph increase inspeed at the trot. Transition from a trot to a canter involved a reduction of 26 % when theinstrumented forelimb was the non-leading leg, and 42 % when it was the lead leg (see alsoforce-shoe traces, Fig. 7). At this point, strains during the canter were actually 16 % lowerthanthose which occurred at the slowest walk. Peak strains at higher speeds appeared to plateau.
Horse radius
As in the tibia, the larger principal strains on the caudal surface of the radius werecompressive and almost longitudinal. At the slowest walk (4-1 kph), the mean peakprincipal strain on the caudal surface was — 1777 ± 105 fie rising to — 1965 ± 58 fie atthe walk:trot transition speed (5-5 kph) (Fig. 6). When trotting at this transitionspeed, the peak strains increased to 34% above the highest walking value ( — 2626173 /ie). Strains fluctuated around — 2700 fie throughout the speed range at the trot,the largest strains for the radius of horse A being recorded midway through thattrotting range ( — 2865 + 173 fie at 8-5 kph). At the fastest trotting speeds recorded(i8-6kph), the peak strains were —26711182/16. After transition to a canter at13-7 kph, when the instrumented radius was the non-lead forelimb (in-phase), thepeak strains dropped 26% from —2567114210 — 1911 + 12^ fie, rising to —23161J7 fie at 19 kph. When the gait transition was such that the instrumented leg was thelead forelimb (out-of-phase), the drop in peak strains between a trot and a canter(at 13-1 kph) was 42%, to — 14941129 fie; i.e. 16% lower than the strains recordedfor the slowest walk. The peak strain values for the lead leg levelled at — 2041199 fie(at 21-3 kph), dropping slightly while galloping to - 2 0 0 7 ! 139 fie at 25-2 kph.
The strains recorded from the radius of horse B were similar to those from horse A.Horse B went faster than horse A, but would not change his lead leg. The measure^ment of peak strain from the non-lead radius appeared to continue the upward rise ^
Limb mechanics as a function of speed and gait 199
500
-1000
..K.k.KA.K.KA. A K
-2000
8<2
Time ($)
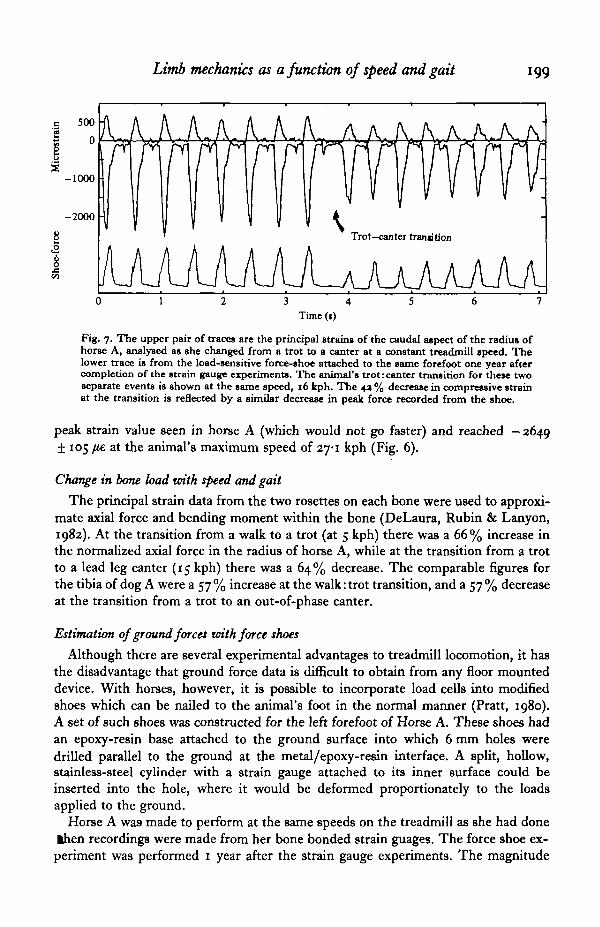
Fig. 7. The upper pair of traces are the principal strains of the caudal aspect of the radius ofhorse A, analysed as she changed from a trot to a canter at a constant treadmill speed. Thelower trace is from the load-sensitive force-shoe attached to the same forefoot one year aftercompletion of the strain gauge experiments. The animal's trot: canter transition for these twoseparate events is shown at the same speed, 16 kph. The 4a % decrease in compressive strainat the transition is reflected by a similar decrease in peak force recorded from the shoe.
peak strain value seen in horse A (which would not go faster) and reached — 2649± 105 fie at the animal's maximum speed of 27-1 kph (Fig. 6).
Change in bone load with speed and gait
The principal strain data from the two rosettes on each bone were used to approxi-mate axial force and bending moment within the bone (DeLaura, Rubin & Lanyon,1982). At the transition from a walk to a trot (at 5 kph) there was a 66% increase inthe normalized axial force in the radius of horse A, while at the transition from a trotto a lead leg canter (15 kph) there was a 64% decrease. The comparable figures forthe tibia of dog A were a 57% increase at the walk: trot transition, and a 57% decreaseat the transition from a trot to an out-of-phase canter.
Estimation of ground forces with force shoes
Although there are several experimental advantages to treadmill locomotion, it hasthe disadvantage that ground force data is difficult to obtain from any floor mounteddevice. With horses, however, it is possible to incorporate load cells into modifiedshoes which can be nailed to the animal's foot in the normal manner (Pratt, 1980).A set of such shoes was constructed for the left forefoot of Horse A. These shoes hadan epoxy-resin base attached to the ground surface into which 6 mm holes weredrilled parallel to the ground at the metal/epoxy-resin interface. A split, hollow,stainless-steel cylinder with a strain gauge attached to its inner surface could beinserted into the hole, where it would be deformed proportionately to the loadsapplied to the ground.
Horse A wa9 made to perform at the same speeds on the treadmill as she had doneihen recordings were made from her bone bonded strain guages. The force shoe ex-
periment was performed 1 year after the strain gauge experiments. The magnitude
2OO CLINTON T. RUBIN AND LANCE E. LANYON
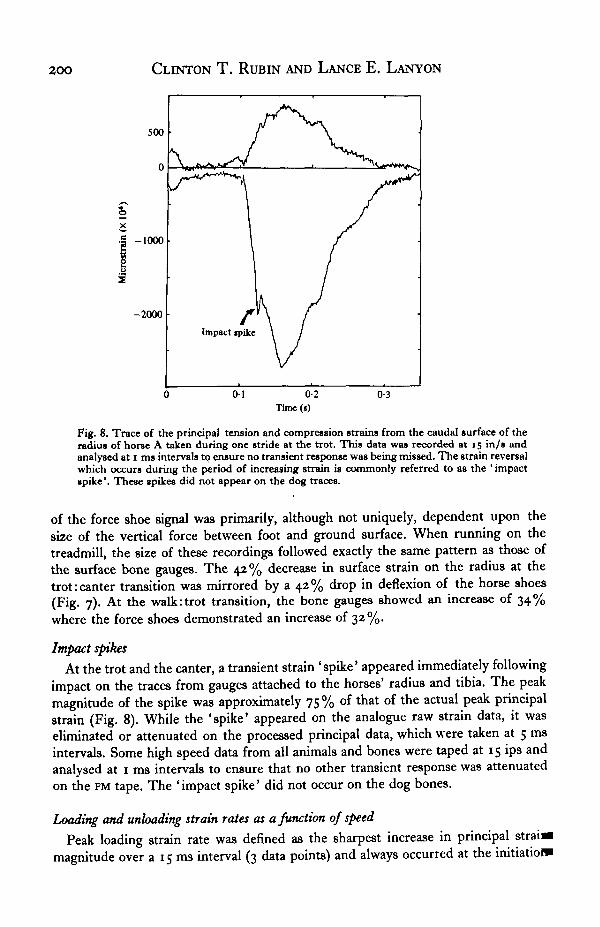
Fig. 8. Trace of the principal tension and compression strains from the caudal surface of theradius of horse A taken during one stride at the trot. This data was recorded at 15 in/s andanalysed at 1 ms intervals to ensure no transient response was being missed. The strain reversalwhich occurs during the period of increasing strain is commonly referred to as the ' impactspike'. These spikes did not appear on the dog traces.
of the force shoe signal was primarily, although not uniquely, dependent upon thesize of the vertical force between foot and ground surface. When running on thetreadmill, the size of these recordings followed exactly the same pattern as those ofthe surface bone gauges. The 42% decrease in surface strain on the radius at thetrot:canter transition was mirrored by a 42% drop in deflexion of the horse shoes(Fig. 7). At the walk:trot transition, the bone gauges showed an increase of 34%where the force shoes demonstrated an increase of 32%.
Impact spikes
At the trot and the canter, a transient strain 'spike' appeared immediately followingimpact on the traces from gauges attached to the horses' radius and tibia. The peakmagnitude of the spike was approximately 75 % of that of the actual peak principalstrain (Fig. 8). While the 'spike' appeared on the analogue raw strain data, it waseliminated or attenuated on the processed principal data, which were taken at 5 msintervals. Some high speed data from all animals and bones were taped at 15 ips andanalysed at 1 ms intervals to ensure that no other transient response was attenuatedon the FM tape. The 'impact spike' did not occur on the dog bones.
Loading and unloading strain rates as a function of speed
Peak loading strain rate was defined as the sharpest increase in principal strai tmagnitude over a 15 ms interval (3 data points) and always occurred at the initiation

Limb mechanics as a function of speed and gait 201
y = 2745 JC-3067 r = 0-95
0-08
006
| 0 0 4
0-02
15Speed (kph)
Fig. 9. The peak maximum strain rates (determined over 15 ms intervals) from the caudalsurface of horse A's tibia ( • ) , horse B's radius ( • ) and dog A's tibia ( # ) . The rates deter-mined from cantering and galloping are shown as open symbols. These strain rates appearremarkably similar considering the different bones and the 5 x difference in animal mass.Despite the discrepancies in peak strains which occur at the gait transitions, the increasein maximum strain rate appears to be linear. The equation determining the line is given.
of the stance phase. Peak unloading rate was the sharpest decrease in principal strain,and occurred as the foot was removed from the ground. The highest strain rates wereconsistently on the caudal surface of either radius or tibia, on all animals. The strainrates on the cranial surface were less, in proportion to the smaller strain magnitude onthese cortices. At the change from a trot to a canter, there was no consistent change instrain rate similar to that measured in strain magnitude. Indeed, the loading andunloading strain rates appeared to increase in a linear fashion relative to speed. Alinear regression was therefore calculated and, with only one exception (horse A'sradius), these lines represented the data with a confidence limit of P < o-ooi.
Fig. 9 demonstrates a typical relationship of strain rate vs. speed. For dog A's tibiathe peak loading strain rate increased from 4479 fit. s"1 (microstrain per second) atthe slowest walk, to 7721 /je.s"1 at the fastest walking speed. Transition to a trot atthis speed increased strain rate 125 % to 17435 /ie.s"1. After this incremental increase,strain rate increased linearly with no incremental change at the trot: canter transitionto 64060 fie.s-1 at the fastest galloping speed (25 k.h"1). The slope for this increasewas determined by least squares fit to be:
y = 2649*— 2886, r = 0-97.
(This slope represents all the rate points, including those from the walk. It is possiblethat because of the comparatively few speeds recorded for walking that there is rela-tively little effect from the transition discrepancy. This is true for all the bones.)
The data for the tibia of dog A are plotted together with the data from horse B's
202 CLINTON T. RUBIN AND LANCE E. LANYON
radius. Again, a large discrepancy exists at the walk:trot transition (191 %), but thdcorrelation of the sloped linear fit over the complete speed range remains high. Theequation of the line is similar to that for the dog tibia:
y — 2671X-2873, r = 098.
Considering the different masses of the animals (5*), and the different bones, thecombined data for both animals give a remarkably high correlation coefficient:
y = 2665*-2938, r = 0-96.
A very poor correlation of strain rate to speed existed for horse A's radius (loadingP < 0025; unloading P < o-i), and is perhaps a result of the extended gaits. However,horse A's tibia correlates very well with the strain rates measured from the otheranimals. The representative equation as determined by these points is:
y = 2894*-3450, r = 0-91.
The regression equation for data from the three animals combined is:
y = 2746*-3067, r = 0-95.
Duty factor and stride frequency
There are various ways in which the decrease in peak strain and ground force seenat the trot:canter transition could be achieved without change in speed. During thecanter, if each individual limb were to be in contact with the ground for a longer periodrelative to the entire stride cycle, this would allow more time for the necessary propul-sive force to be applied, and thus the peak ground force would decrease proportion-ately. However, measurements of ground contact time from the treadmill cine recordsin these experiments are in agreement with previous reports by other investigators,who have shown that, although duty factor changes significantly from a walk to a trot,there is no such discrepancy from a trot to a canter (Jayes & Alexander, 1978) (e.g.time of ground contact at the gait transition for dog A's tibia: trot = canter = 0-175 8)-It has also been suggested that the change in gait is made to increase the averagenumber of feet on the ground per stride (Pennycuick, 1975), which would also allowthe required propulsive force to be applied over a longer period of time. However, inthis experiment at least, there was no change in the average number of feet on theground at the trot: canter transition (e.g. dog A, average number of feet on ground:trot = 1-47; canter = 1-50).
An increase in stride frequency following the transition to a canter would also allowa decrease in load, since ground contact per second would be increased. However, ourdata confirm that although stride frequency changes significantly from a walk to a trot,no change occurs from trot to canter (Heglund, Taylor & McMahon, 1974).
Although the actual duty factor and stride frequency remain constant at the trot:canter transition, it would have been possible for the period in which significant loadtransfer occurred to be increased if the shape of the load curve were altered. However,the curve produced at the canter is similar in shape to that produced at the trot
(Fig. 7)-

Limb mechanics as a function of speed and gait 203
It appears therefore that the decrease in peak vertical force which we observed at thetrot:canter transition was most likely associated with a decrease in the vertical dis-placement of the animal's centre of mass which occurred while the feet were still incontact with the ground (Cavagna, Heglund & Taylor, 1977).
DISCUSSION
Bone Strain and the Functional Significance of Bone Architecture
The strategies available for achieving the best compromise between tissue economyand mechanical competence in the skeleton are: (1) to regulate the manner andmagnitude of skeletal loading; (2) to adjust the material properties of the tissue;(3) to adjust the mass and alignment of tissue present.
(1) Regulation of the manner and magnitude of applied loading
In the limb bones which we have investigated, the orientation of the principalstrains and the ratio of their magnitudes on opposing cortices were maintained constantduring the limb's stance phase, indicating a consistent mode of loading throughoutthe limb's period of ground contact. This mode of loading was also maintained through-out the animal's complete range of speed, regardless of change in gait.
Although the orientation and manner of loading were uniform throughout theanimal's range of speed and gait, the peak load magnitude, and thus the peak strainsachieved, were dependent upon the gait used. Large increases in peak strains occurredat the walk: trot transition, while decreases occurred at the transition from a trot to acanter. Thus, while coordination of muscle activity and external forces confines theorientation of loading within the skeleton, the sequencing of limbs and redistributionof muscular activity that accompany gait change permit increases in ground speed withregulation of the loading magnitude.
(2) Adjustment of tissue properties
Although the bone tissue in deer antlers and the temporal bulla has become adaptedfor its particular role in these locations by adjustment of mineral content (Currey,1979), it seems that in limb bones, which have a more traditional load-carryingresponsibility, the material properties of the tissue remain fairly constant (Reilly &Burstein, 1974; Schryver, 1978; Lanyon, Magee & Baggott, 1979), and strain regu-lation is primarily accomplished by adjusting the mass and disposition of the bone inrelation to its manner of loading (Woo et al. 1981). The result of this uniformity inthe physical properties of bone tissue in animals of widely differing size and typewould imply either that the functional strain levels engendered within the tissue areessentially similar, or that their bones are at a very different risk of failure. Themargins which exist between customary strains and those which will cause yield orfracture are commonly referred to as the safety factors. These safety factors have nodirect physiological relevance themselves, but reflect conflicting evolutionary pres-sures for bones to be light and economical, and yet to withstand a certain proportionof loading accidents. Using both experimentally and theoretically derived data,
J^lexander has suggested the range of skeletal safety factors to yield failure to be from
204 CLINTON T. RUBIN AND LANCE E. LANYON
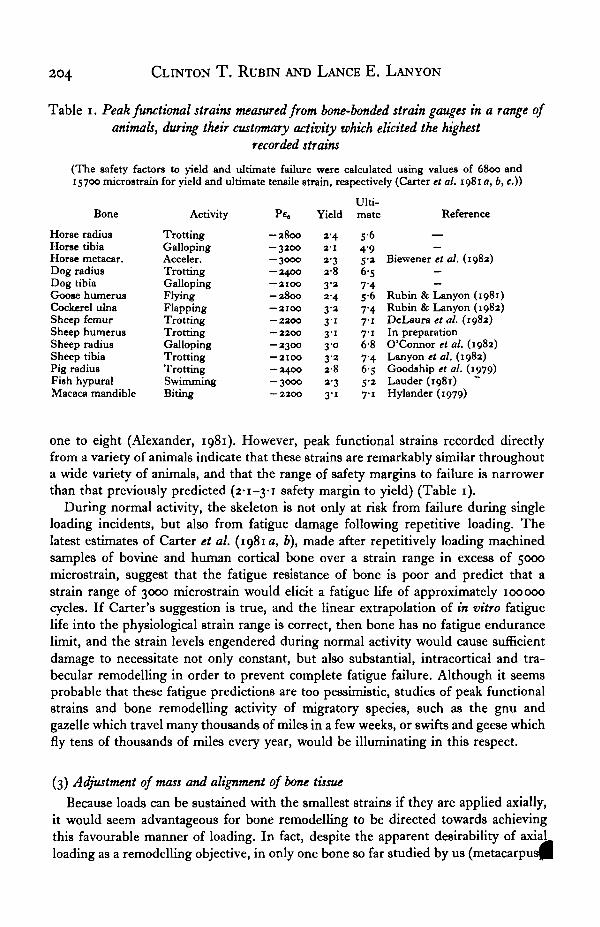
Table i. Peak functional strains measured from bone-bonded strain gauges in a range ofanimals, during their customary activity which elicited the highest
recorded strains
(The safety factors to yield and ultimate failure were calculated using values of 6800 and15700 microstrain for yield and ultimate tensile strain, respectively (Carter et al. 1981 a, b, c.))
Bone
Horse radiusHorse tibiaHorse metacar.Dog radiusDog tibiaGoose humerusCockerel ulnaSheep femurSheep humerusSheep radiusSheep tibiaPig radiusFish hypuralMacaca mandible
Activity
TrottingGallopingAcceler.TrottingGallopingFlyingFlappingTrottingTrottingGallopingTrottingTrottingSwimmingBiting
- 2 8 0 0— 3200— 3000— 2400— 2100- 2 8 0 0— 2100— 2200— 2200— 2300— 2100— 2400— 3000— 2200
Yield
2 42-1
a-32 8
3'*2-4
3 »3' i3 13 0
3 22 8
a-33-1
Ulti-mate
5-64 95-a6-57 45 67-47-17 16-87-46-S5-27-1
Reference
—Biewener et al. (1982)
——
Rubin & Lanyon (1981)Rubin & Lanyon (1982)DeLaura et al. (1982)In preparationO'Connor et al. (1982)Lanyon et al. (1982)Goodship et al. (1979)Lauder (1981)Hylander (1979)
one to eight (Alexander, 1981). However, peak functional strains recorded directlyfrom a variety of animals indicate that these strains are remarkably similar throughouta wide variety of animals, and that the range of safety margins to failure is narrowerthan that previously predicted (2-1-3-1 safety margin to yield) (Table 1).
During normal activity, the skeleton is not only at risk from failure during singleloading incidents, but also from fatigue damage following repetitive loading. Thelatest estimates of Carter et al. (1981a, b), made after repetitively loading machinedsamples of bovine and human cortical bone over a strain range in excess of 5000microstrain, suggest that the fatigue resistance of bone is poor and predict that astrain range of 3000 microstrain would elicit a fatigue life of approximately 100 000cycles. If Carter's suggestion is true, and the linear extrapolation of in vitro fatiguelife into the physiological strain range is correct, then bone has no fatigue endurancelimit, and the strain levels engendered during normal activity would cause sufficientdamage to necessitate not only constant, but also substantial, intracortical and tra-becular remodelling in order to prevent complete fatigue failure. Although it seemsprobable that these fatigue predictions are too pessimistic, studies of peak functionalstrains and bone remodelling activity of migratory species, such as the gnu andgazelle which travel many thousands of miles in a few weeks, or swifts and geese whichfly tens of thousands of miles every year, would be illuminating in this respect.
(3) Adjustment of mass and alignment of bone tissue
Because loads can be sustained with the smallest strains if they are applied axially,it would seem advantageous for bone remodelling to be directed towards achievingthis favourable manner of loading. In fact, despite the apparent desirability of axialloading as a remodelling objective, in only one bone so far studied by us (metacarpus^
Limb mechanics as a function of speed and gait 205
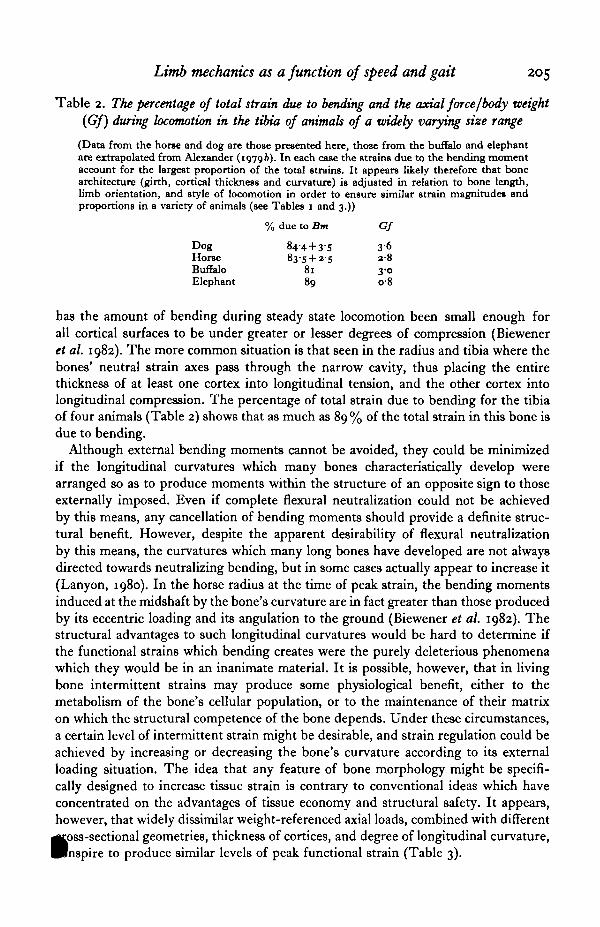
Table 2. The percentage of total strain due to bending and the axial force/body weight(Gf) during locomotion in the tibia of animals of a widely varying size range
(Data from the horse and dog are those presented here, those from the buffalo and elephantare extrapolated from Alexander (19796). In each case the strains due to the bending momentaccount for the largest proportion of the total strains. It appears likely therefore that bonearchitecture (girth, cortical thickness and curvature) is adjusted in relation to bone length,limb orientation, and style of locomotion in order to ensure similar strain magnitudet andproportions in a variety of animals (see Tables 1 and 3.))
% due to Bm Gf
Dog 84-4 + 3-5 3-6Horse 83-5 + 25 a-8Buffalo 81 3-0Elephant 89 o-8
has the amount of bending during steady state locomotion been small enough forall cortical surfaces to be under greater or lesser degrees of compression (Bieweneret al. 1982). The more common situation is that seen in the radius and tibia where thebones' neutral strain axes pass through the narrow cavity, thus placing the entirethickness of at least one cortex into longitudinal tension, and the other cortex intolongitudinal compression. The percentage of total strain due to bending for the tibiaof four animals (Table 2) shows that as much as 89 % of the total strain in this bone isdue to bending.
Although external bending moments cannot be avoided, they could be minimizedif the longitudinal curvatures which many bones characteristically develop werearranged so as to produce moments within the structure of an opposite sign to thoseexternally imposed. Even if complete flexural neutralization could not be achievedby this means, any cancellation of bending moments should provide a definite struc-tural benefit. However, despite the apparent desirability of flexural neutralizationby this means, the curvatures which many long bones have developed are not alwaysdirected towards neutralizing bending, but in some cases actually appear to increase it(Lanyon, 1980). In the horse radius at the time of peak strain, the bending momentsinduced at the midshaft by the bone's curvature are in fact greater than those producedby its eccentric loading and its angulation to the ground (Biewener et al. 1982). Thestructural advantages to such longitudinal curvatures would be hard to determine ifthe functional strains which bending creates were the purely deleterious phenomenawhich they would be in an inanimate material. It is possible, however, that in livingbone intermittent strains may produce some physiological benefit, either to themetabolism of the bone's cellular population, or to the maintenance of their matrixon which the structural competence of the bone depends. Under these circumstances,a certain level of intermittent strain might be desirable, and strain regulation could beachieved by increasing or decreasing the bone's curvature according to its externalloading situation. The idea that any feature of bone morphology might be specifi-cally designed to increase tissue strain is contrary to conventional ideas which haveconcentrated on the advantages of tissue economy and structural safety. It appears,however, that widely dissimilar weight-referenced axial loads, combined with different
•oss-sectional geometries, thickness of cortices, and degree of longitudinal curvature,I nspire to produce similar levels of peak functional strain (Table 3).
206 CLINTON T. RUBIN AND LANCE E. LANYON
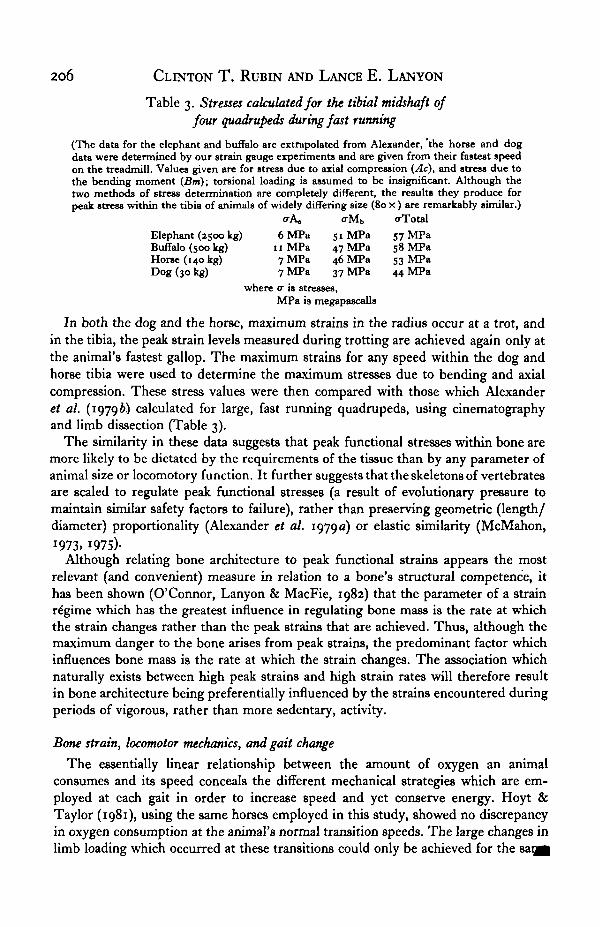
Table 3. Stresses calculated for the tibial midshaft offour quadrupeds during fast running
(The data for the elephant and buffalo are extrapolated from Alexander, 'the horse and dogdata were determined by our strain gauge experiments and are given from their fastest speedon the treadmill. Values given are for stress due to axial compression (Ac), and stress due tothe bending moment (Bm); torsional loading is assumed to be insignificant. Although thetwo methods of stress determination are completely different, the results they produce forpeak stress within the tibia of animals of widely differing size (80 x ) are remarkably similar.)
(TA. ffMb <rTotal
Elephant (2500 kg) 6 MPa 51 MPa 57 MPaBuffalo (500 kg) 11 MPa 47 MPa 58 MPaHorse (140 kg) 7 MPa 46 MPa 53 MPaDog (30 kg) 7 MPa 37 MPa 44 MPa
where <x is stresses,MPa is megapascalls
In both the dog and the horse, maximum strains in the radius occur at a trot, andin the tibia, the peak strain levels measured during trotting are achieved again only atthe animal's fastest gallop. The maximum strains for any speed within the dog andhorse tibia were used to determine the maximum stresses due to bending and axialcompression. These stress values were then compared with those which Alexanderet al. (1979 A,) calculated for large, fast running quadrupeds, using cinematographyand limb dissection (Table 3).
The similarity in these data suggests that peak functional stresses within bone aremore likely to be dictated by the requirements of the tissue than by any parameter ofanimal size or locomotory function. It further suggests that the skeletons of vertebratesare scaled to regulate peak functional stresses (a result of evolutionary pressure tomaintain similar safety factors to failure), rather than preserving geometric (length/diameter) proportionality (Alexander et al. 1979 a) or elastic similarity (McMahon,
1973. 1975)-Although relating bone architecture to peak functional strains appears the most
relevant (and convenient) measure in relation to a bone's structural competence, ithas been shown (O'Connor, Lanyon & MacFie, 1982) that the parameter of a strainregime which has the greatest influence in regulating bone mass is the rate at whichthe strain changes rather than the peak strains that are achieved. Thus, although themaximum danger to the bone arises from peak strains, the predominant factor whichinfluences bone mass is the rate at which the strain changes. The association whichnaturally exists between high peak strains and high strain rates will therefore resultin bone architecture being preferentially influenced by the strains encountered duringperiods of vigorous, rather than more sedentary, activity.
Bone strain, locomotor mechanics, and gait change
The essentially linear relationship between the amount of oxygen an animalconsumes and its speed conceals the different mechanical strategies which are em-ployed at each gait in order to increase speed and yet conserve energy. Hoyt &Taylor (1981), using the same horses employed in this study, showed no discrepancyin oxygen consumption at the animal's normal transition speeds. The large changes inlimb loading which occurred at these transitions could only be achieved for the

Limb mechanics as a function of speed and gait 207
consumption if some method of energy conservation or redeployment wereinvolved.
For locomotion at any speed, oxygen is necessary to enable muscles to developtension. However, the relationship between the amount of oxygen used, the workdone, and the tension developed, is not a simple one. Tension may be developedwithin a muscle while it is shortening and doing positive work, while it remains thesame length, or while it is being stretched and doing negative work. Since positivework is metabolically far more costly than negative work, it becomes advantageousfor any particular muscle to maximize the relative amount of negative work whichit has to do (Abbot, Bigland & Ritchie, 1952). The energetic cost of developing anylevel of peak tension will then be less, and the number of active muscle fibres necessaryto achieve this can be reduced. In addition to the benefits of obtaining high tensionlevels cheaply, negative work provides the advantage that the energy stored within themuscle and tendon during stretching can be recovered elastically and contribute tomovement at no additional metabolic cost. The extent to which this particular energyconservation strategy is used varies according to the location of the muscle and thegait which the animal employs.
When an animal is walking, there is little or no useful recovery of energy storedelastically within stretched tendons and muscles. Instead, metabolic energy expendi-ture is reduced because of the smooth exchange between potential and kinetic energyas the animal's centre of mass rises and falls, accelerating and decelerating, at eachstep. The saving which results from this transition can account for as much as 70 %of the propulsive energy required for forward movement during the walk (Cavagna,Thys & Zamboni, 1976; Cavagna et al. 1977).
At a trot in a quadruped or a run in a biped, there is an aerial period between eachsupport phase. Maximum potential and kinetic energy are in phase at these gaits, thuseliminating the possibility of energy conservation by phasic interchange. However, onlanding from the aerial phase, much of the animal's kinetic energy is converted tostrain energy by stretching the tendons, ligaments and muscles within the limb. Thisstrain energy is recovered elastically and contributes towards the propulsion intothe next airborne phase. Presumably, it is the substitution of this form of mechanicalenergy conservation for that used in the walk which allows the transition to a trot tobe accomplished without any incremental cost in oxygen consumption. This occurseven though the amount of work done increases due to an increase in the vertical dis-placement of the animal's centre of mass (Cavagna et al. 1977), which is clearlyindicated by the substantial increase in skeletal strain at this transition.
In the canter and gallop there is only one floating phase per stride instead of thetwo at the trot. The decrease in ground force measured at this transition, by both theforce shoes and the bone-bonded strain gauges, indicates a decrease in the amountof external work being done. This is presumably achieved by a reduction in thevertical excursion of the animal's centre of mass. Recruitment of the trunk at thistime introduces another large active group of muscles (Taylor, 1978; Goslow et al.1981) but, despite this, there is no incremental increase in oxygen consumption at thegait transition (Hoyt & Taylor, 1981). This can most readily be accounted for by adecreased use of the muscle groups within the limbs which were previously active
208 CLINTON T. RUBIN AND LANCE E. LANYON
during the trot. The lack of any discrepancy in bone strain rate over the trot: cantedtransition, despite a 40% decrease in peak axial load, suggests that the muscle loadingrate, and thus also the fibre type population which is active, remains constant at thattime, but that the active fibre number is reduced. This supposition is supported byglycogen depletion experiments, which demonstrate that some muscles in the limbsactually do less work during the canter than the trot (Armstrong et al. 1977).
The reduced limb bone loading, which we have shown to occur at the trot: cantertransition in these experiments, reflects a coordinated reduction in both ground forceand tension within the limb muscles. This drop could be predicted from appropriatesubstitution in the canine power output formulae published by Cavagna et al. (1977),and is consistent with their observation of a decrease in external work betweencantering and trotting at the same speed. These bone strain and force shoe measure-ments are further supported by ground-mounted force plate recordings near thetransitions, which also show a decrease in peak vertical force at the canter (Bieweneret al. 1981). For the ground force to decrease at the transition while the animal con-tinues at the same speed implies a reduction in vertical movement of the animal'scentre of mass during the period of ground contact.
CONCLUSIONS
Limb bone loading is the result of forces engendered within the muscles and forcesoriginating from the ground. During treadmill locomotion these act together with thefollowing results:
(1) A constant loading orientation of the bone is maintained during the stancephase of each limb and throughout the animals' complete range of speed and gait.This restricted mechanical environment provides a unique requirement (and shouldpermit an economical solution) to the structural demands of steady-state locomotion.
(2) Peak bone loads increase incrementally at the walk: trot transition and decreasesubstantially at the transition from a trot to a canter. This decrease is most marked inthe lead forelimb and the diagonally opposite hind limb. The decrease in limb boneloading is accompanied by a decrease in ground force. Since the manner of loadingremains constant, this implies that fewer muscle fibres are active within the limbs at aslow canter than at a fast trot. Although probably not the sole purpose of the gaitchange, the decreased limb loading which occurs at this transition permits increasedspeed without progressive erosion of the bone's safety factors to failure.
(3) The bone's rate of loading and unloading increases linearly with speed. The slopeand magnitude of maximum bone strain rate as a function of speed is similar in dogsand horses, for both radius and tibia. Since the osteogenic potential of a strain regimeis determined primarily by this rate of change of strain rather than the peak strainsachieved, the architecture of the appendicular skeleton will be primarily related to theloading situation during the animal's most vigorous activity.
(4) The maximum locomotor stress levels and the percentage of the total strain dueto bending from our experimental dogs and horses were similar to those quoted for abuffalo and an elephant. Peak strain magnitude, measured directly by strain gaugesfrom a variety of animals, appears to range between 2000-3000 microstrain. In long
Limb mechanics as a function of speed and gait 209
tones this regulation of peak functional strains is primarily achieved by adjustmentof the bones' girth, cortical thickness, and longitudinal curvature in relation to theiroverall length. Scaling within the appendicular skeleton appears therefore to be relatedto peak functional strain levels within the bone rather than any criteria related directlyto animal size, weight, or locomotory function.
The experiments described were performed at the Concord Field Station, Museumof Comparative Zoology, Harvard University. They would not have been possiblewithout the help and support of C. Richard Taylor, its director, and his colleagues,particularly D. Hoyt, W. Brown, and A. Biewener. We also wish to thank M. Fedak,N. Heglund, G. Goldspink, R. McN. Alexander, and T. McMahon for valuablecriticism of the manuscript at various stages.
REFERENCES
ABBOT, B. C , BIOLAND, B. & RITCHIE, J. M. (195a)- The physiological cost of negative work. J. Pkytiol,Lond. 117, 380—390.
ALEXANDER, R. MCN. , LANGMAN, V. A., & JAYBS, A. S. (1977). Fast locomotion of some Africanungulates. J. Zool., Lond. 183, 291-300.
ALEXANDER, R. M C N . & GOLDSPINK, G. (1977). Mechanics and Energetics of Animal Locomotion.London: Chapman & Hall.
ALEXANDER, R. M C N . & JAYES, A. S. (1978). Vertical movements in walking and running. J. Zool.,Lond. 185, 27-40.
ALEXANDER, R. MCN. , MALOIY, G. M. O., HUNTER, B., JAYES, A. S. & NTURIBI, J. (1979a). Mechanicalstresses in fast locomotion in buffalo and elephant. J. Zool., Lond. 189, 135-144.
ALEXANDER, R. MCN. , JAYES, A. S., MALOIY, G. M. O. & WATHUTA, E. M. (19796). Allometry of thelimb bones of mammals from shrews to elephant. J. Zool., Lond. 189, 305—314.
ALEXANDER, R. MCN. , JAYES, A. S., & KER, R. F. (1980). Estimates of energy cost for quadrupedalrunning gaits. J. Zool., Lond. 190, 155-192.
ALEXANDER, R. M C N . (1981). Factors of safety in the structure of animals. Sci. Prog., Oxf. 67, 109-130.ARMSTRONG, R. B., MARUM, P., SAUBERT, C. W., SEEHERMAN, H. S., & TAYLOR, C. R. (1977). Muscle
fiber activity as a function of speed and gait. J. appl. Phyt. 43, 672-677.BIEWENER, A., ALEXANDER, R. MCN. , & HEGLUND, N. C. (1981). The role of elastic storage in kangaroo
rats during locomotion. J. Zool., Lond. 195, 369-383.BIEWENBR, A., THOMASON, J., GooDSHiP, A. & LANYON, L. E. (1982). The stresses in the horse
forelimb: a comparison of two experimental techniques. J. Biomech. (in the press).CARTER, D. R. (1978). Anisotropic analysis of strain rosette information from cortical bone. J. Biomech.
xx, 199-202.CARTER, D. R., CALER, W. E., SPENGLER, D. M. & FRANKEL, V. H. (1981a). Cortical bone fatigue: the
effect of strain range, stress range, and elastic modulus. Tram. Orth. Res. Soc. 27, 44.CARTER, D. R., HARRIS, W. H., VASU, R. & CALBR, W. E. (19816). The mechanical and biological
response of cortical bone to in vivo strain histories. In Mechanical Properties of Bone. ASME Publ.AMD 45, 81-92.
CARTER, D. R., CALER, W. E., SPENGLER, D. M. & FRANKEL, V. H. (1981c). Fatigue behavior of adultcortical bone: the influence of mean strain and strain range. Acta. orthop. scand. 5a, 481-490.
CAVAGNA, G. A., THYS, H., & ZAMBONI, A. (1976). The sources of external work in level walking andrunning. J. Phytiol., Lond. 363, 639-657.
CAVAGNA, G. A., HEGLUND, N. C. & TAYLOR, C. R. (1977). Mechanical work in terrestrial locomotion:two basic mechanisms for minimizing energy expenditure. Am. J. Physiol. 333, 243-261.
CRANDALL, S. A., DAHL, N. G., & LARDNER, T. J. (1977). Introduction to the Mechanics of Solids,2nd ed. New York: McGraw-Hill.
CURREY, J. D. (1979). Mechanical properties of bone tissue with greatly differing functions. J. Biomech.13,313-319.
DALLY, J. W. & RILEY, W. F. (1978). Experimental Stress Analysis, 2nd ed. New York: McGraw-Hill.JJELAURA, R. A., RUBIN, C. T. & LANYON, L. E. (1982). A model to determine skeletal loads from^^n vivo bone bonded strain gauges. (In preparation).

210 CLINTON T. RUBIN AND LANCE E. LANYON
FEDAK, M. A. & SEBHERMAN, H. J. (1979). Reappraisal of energetics of locomotion show identicalin bipeds and quadrupeds. Nature, Land. 28a, 713-716.
GAMBARYAN, P. P. (1974). How Mammals Run. New York: Halstead Press, Wiley.GOODSHIP, A. E., LANYON, L. E. & MCFIE, H. (1979). Functional adaptation of bone to increased
stress. 7- Bonejt Surg. 61A, 530-546.GOSLOW, G. E., SKEHKRMAN, H. J., TAYLOR, C. R., MCCUTCHIN, M. N. & HECLUND, N. C. (1981).
Electrical activity and relative length changes of dog limb muscles as a function of speed and gait.J. exp. Biol. 94, 15-42.
GRAY, SIR J. (1968). Animal Locomotion. London: Weidenfeld and Nicolson.HAYES, W. C. & SNYDBR, B. (1981). Toward a quantitative formulation of Wolff's law in trabecular
bone. In Mechanical Properties of Bone. ASME publ. AMD 45: 43-°9-HEOLUND, N. C. (1979). Size and scaling in animal locomotion. Thesis, Harvard University.HEGLUND, N. C , TAYLOR, C. R. & MCMAHON, T. (1974). Scaling stride frequency and gait to animal
size: mice to horses. Science, N.Y. 186, 1112-1113.HILDKBRAND, M. (1959). Motions of the running cheetah and horse. J. Mammal. 40, 481-495.HILDEBRAND, M. (1965). Symmetrical gaits of horses. Science, N.Y. 150, 701-798.HILDEBRAND, M. (1976). Analysis of tetrapod gaits: general considerations in symmetrical gaits. In
Neural Control of Locomotion (ed. R. M. Herman, S. Grillner, P. S. Stein & D. G. Stuart), pp. 203-236. New York. Plenum Press.
HOYT, D. F. & TAYLOR, C. R. (1981). Gait and the energetics of locomotion in horses. Nature, Lond.292, 239-240.
HYLANDER, W. L. (1979). Mandibular function in Galago crassicaudatus and Macaco fascicularis: anin vivo approach to stress analysis of the mandible. J. Morph. 159, 253-296.
JAYES, A. S. & ALEXANDER, R. M C N . (1978). Mechanics of locomotion of dog8 and sheep. J. Zool., Lond.185, 289-308.
KOCH, J. C. (1917). The laws of bone architecture. Am. J. Anat. 21, 177-298.LANYON, L. E. (1973). Analysis of surface bone strain in the calcaneus of sheep during normal loco-
motion. J. Biomech. 6, 41-49.LANYON, L. E. (1976). Measurement of bone strain in vivo. Acta orthop. belg. 42, 98-108.LANYON, L. E., MAGEE, P. T. & BAGGOTT, D. G. (1979). The relationship of functional stress and
strain to the processes of bone remodelling. J. Biomech. ia, 593-600.LANYON, L. E. (1980). The influence of function on the development of bone curvature. J. Zool., Lond.
193. 457-466.LANYON, L. E., PAUL, I. L., RUBIN, C. T., THRASHER, E.L., DELAURA, R. A., ROSE, R. M. & RADIN,
E. L. (1981 b). In vivo strain measurements from bone and prosthesis following total hip replacement.J. Bonejt Surg. A63, 920-944.
LANYON, L. E., GOODSHIP, A. E. ,PYE, C . , & M C F I E , H. (1982). Mechanically adaptive bone remodelling.A quantitative study on functional adaptation in the radius following ulna osteotomy in sheep.J. Biomech. 15, 141-154.
LAUDER, G. W. (1981). Structure and function in the tail of the pumpkin seed sunfish. J. exp. Biol.(submitted).
MCMAHON, T. (1973). Sixe and shape in biology. Science, N.Y. 179, 1201-1204.MCMAHON, T. (1975). Using body size to understand the structural design of animals. J. appl. Phyt.
39, 619-627.MUYBRIDCE, E. (1957). Animals in Motion, 2nd ed. New York: Dover.O'CONNOR, J. A., LANYON, L. E. & MACFIE, H. (1982). Influence of strain rate on adaptive bone
remodelling. J. Biomech. (submitted).PENNYCUICK, C. J. (1975). On the running of the gnu and other animals. J. exp. Biol. 63, 775-799.PRATT, G. W. (1976). Force plate studies of equine biomechanics. Am. J. vet. Res. 37, 1251-1255.PRATT, G. W. (1980). Analyzing track characteristics. Thoroughbred Record a n , 771-776.REILLY, D. T. & BuRSTEiN, A. H. (1974). The mechanical properties of cortical bone. J. Bonejt Surg.
56A, 1001-1022.Roux, W. (1985). Ges Abhandlugen Ober Entunckiungtmechanik der Orgamsmen Bd. I. Funktionclle
Anpasstmg. Leipzig.RUBIN, C. T. & LANYON, L. E. (1981). Bone remodelling in response to applied dynamic loads. J.
Bone Jt Surg. Orth. Trans. 5, 237-238.RUBIN, C. T. & LANYON, L. E. (1982). Peak functional strain and fatigue properties in bone. Trans.
Orth. Res. Soc. 7, 83.SCHRYVER, H. F. (1978). Bending properties of cortical bone in the horse. Am. J. vet. Res. 39, 25-28.TAYLOR, C. R., SCHMIDT-NIELSEN, K. & RAAB, J. L. (1970). Scaling of energetic cost of running to
body size in mammals. Am. J. Physiol. 219, 1104—1107.TAYLOR, C. R. & ROWNTREE, V. J. (1973). Running on two or four legs: Which consumes more ener
Science, N.Y. 179, 186-187.
Limb mechanics as a function of speed and gait 211
AYLOR, C. R. (1978). Why change gaits? Recruitment of muscles and muscle fibres as a function ofspeed and gait. Am. Zool. 18, 153-161.
TOKUHIKI, M. (1973 a). Electromyographic and joint mechanical studies in quadrupedal locomotion.I. Walk. Jap. J. vet. Set. 35, 433-446.
TOKURIKI, M. (19736). Electromyographic and joint mechanical studies in quadrupedallcoomotion.II. Trot. Jap. J. vet. Set. 35, 5*5-533-
TOKUHIKI, M. (1974). Electromyographic and joint mechanical studies in quadrupedal locomotion.III. Gallop, jap. J. vet. Set. 36, 121-133.
WOLFF, J. (1870). Die Innere Architekture der Knochen. Arch. Anat. Physiol. V. 50.Woo, S. L-Y., KEUI, S. C, AMIEL, D., GOMEZ, M. A., HAYES, W. C, WHITE, F. C , & AKESON, W. H.
(1981). The effect of prolonged physical training on the properties of long bone: a study of Wolff'slaw. J. Bonejt Surg. 63A, 780-787.