Lightning Ridge NSW
21
Lightning Ridge NSW List members of the group, roles and % contribution to the presentation • Tameika Allport (x%) • Susan Barta (x%) • Michelle Grogan (x%) • Kristy Johnson (x%) • Courtley Mancell (x%) • Christie Paton (x%) Delete ONE of these boxes to confirm that all group members agree to the percent contributions. Lightning Ridge Central School
-
Upload
marny-anderson -
Category
Documents
-
view
24 -
download
0
description
Lightning Ridge Central School. List members of the group, roles and % contribution to the presentation Tameika Allport (x%) Susan Barta(x%) Michelle Grogan(x%) Kristy Johnson(x%) Courtley Mancell (x%) Christie Paton(x%). Lightning Ridge NSW. - PowerPoint PPT Presentation
Transcript of Lightning Ridge NSW
Lightning Ridge NSW
List members of the group, roles and % contribution to the presentation
• Tameika Allport (x%)• Susan Barta (x%)• Michelle Grogan (x%)• Kristy Johnson (x%)• Courtley Mancell (x%)• Christie Paton (x%)
Delete ONE of these boxes to confirm that all group members agree to the percent contributions.
Lightning Ridge Central School
Table of ContentsTable of Contents
1. Context Analysis1. Context Analysis
2. Priority Health Area2. Priority Health Area
3. Outcomes3. Outcomes
4. Realising Outcomes4. Realising Outcomes
5. Scope and Sequence5. Scope and Sequence
6. Scope 6. Scope
7. Recommended Resources7. Recommended Resources
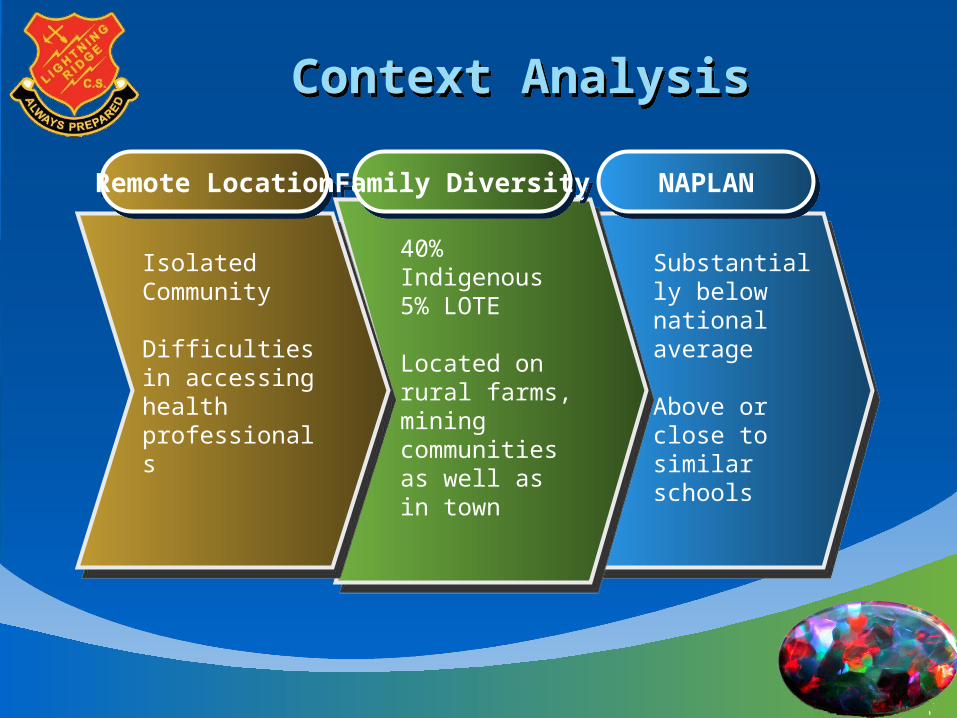
Context AnalysisContext Analysis
Substantially below national average
Above or close to similar schools
Substantially below national average
Above or close to similar schools
40% Indigenous5% LOTE
Located on rural farms, mining communities as well as in town
40% Indigenous5% LOTE
Located on rural farms, mining communities as well as in town
Isolated Community
Difficulties in accessing health professionals
Isolated Community
Difficulties in accessing health professionals
Remote LocationRemote Location Family DiversityFamily Diversity NAPLANNAPLAN
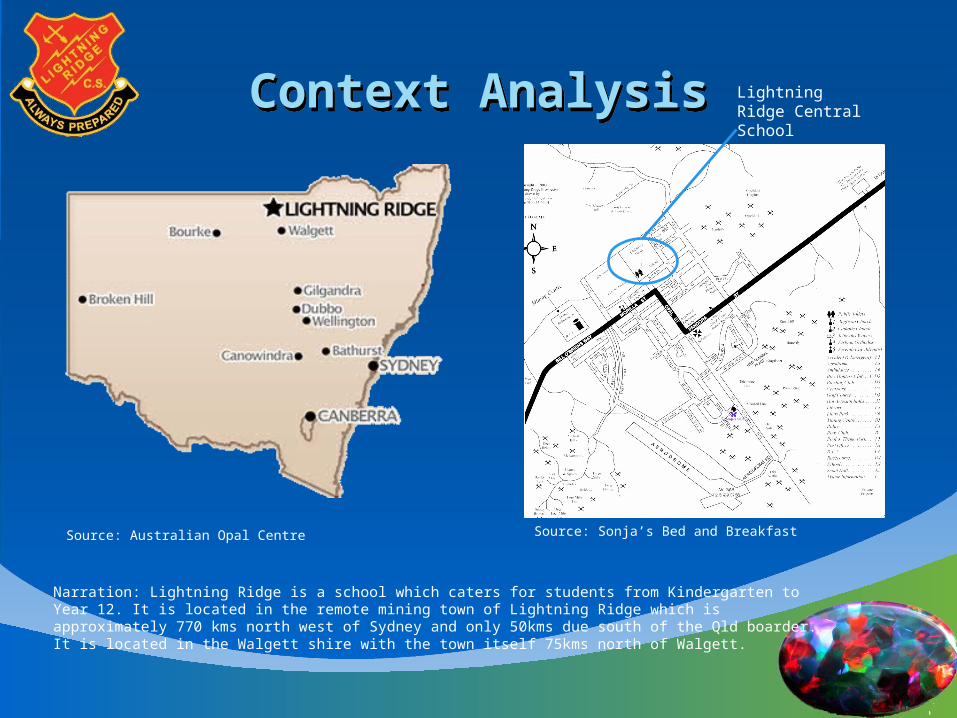
Context AnalysisContext Analysis Lightning Ridge Central School
Source: Sonja’s Bed and Breakfast
Source: Sonja’s Bed and BreakfastSource: Australian Opal Centre
Narration: Lightning Ridge is a school which caters for students from Kindergarten to Year 12. It is located in the remote mining town of Lightning Ridge which is approximately 770 kms north west of Sydney and only 50kms due south of the Qld boarder. It is located in the Walgett shire with the town itself 75kms north of Walgett.
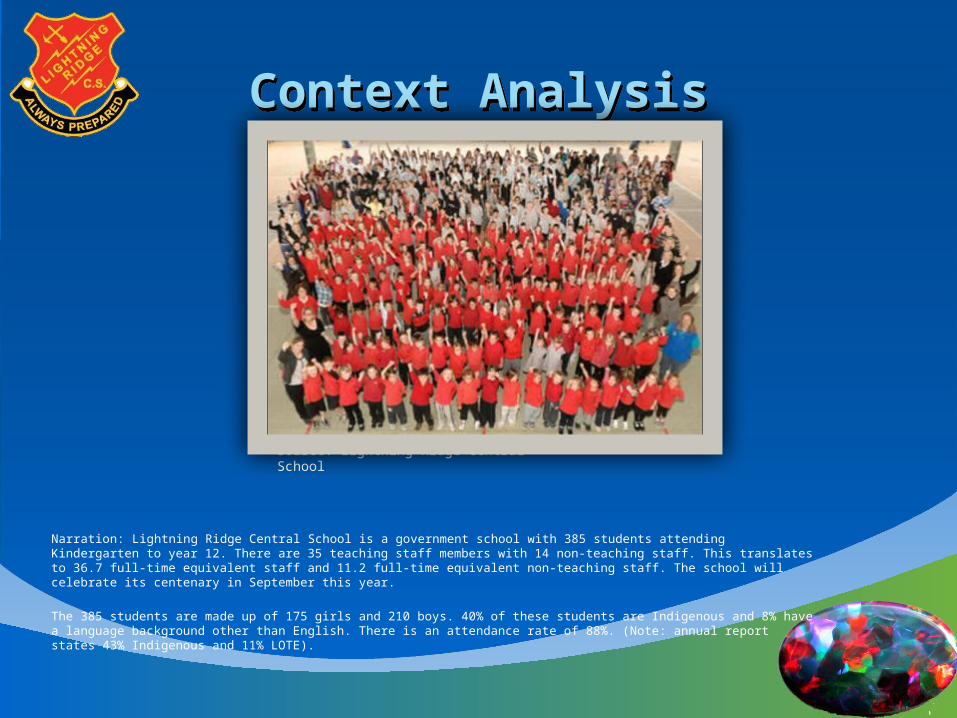
Context AnalysisContext Analysis
Source: Lightning Ridge Central School
Narration: Lightning Ridge Central School is a government school with 385 students attending Kindergarten to year 12. There are 35 teaching staff members with 14 non-teaching staff. This translates to 36.7 full-time equivalent staff and 11.2 full-time equivalent non-teaching staff. The school will celebrate its centenary in September this year.
The 385 students are made up of 175 girls and 210 boys. 40% of these students are Indigenous and 8% have a language background other than English. There is an attendance rate of 88%. (Note: annual report states 43% Indigenous and 11% LOTE).
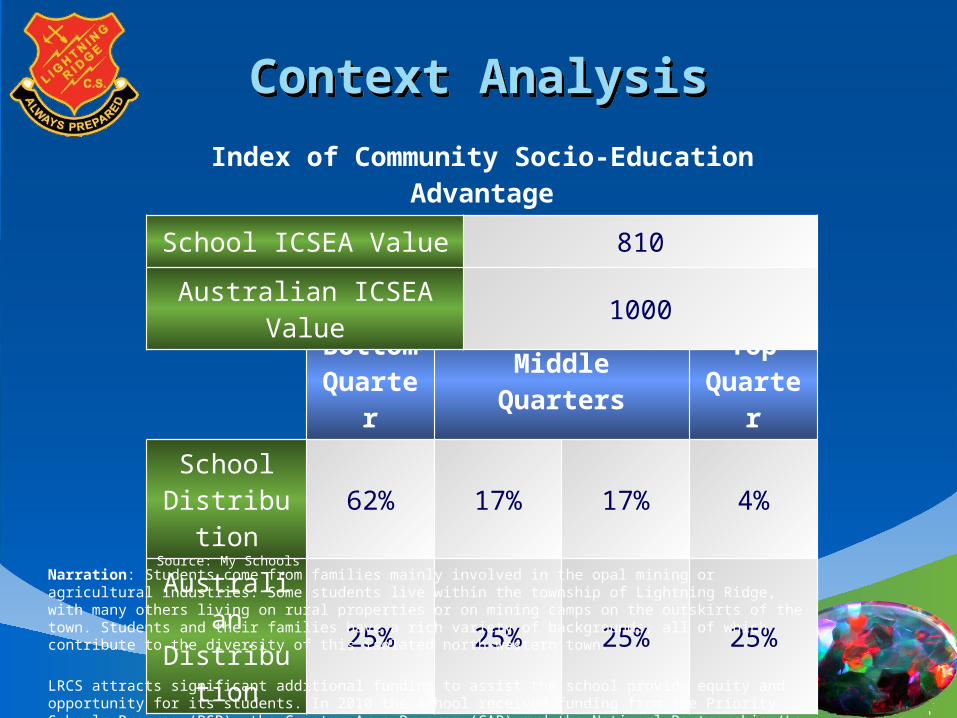
Context AnalysisContext Analysis
Bottom Quarter Middle Quarters
Top Quarter
School Distribution 62% 17% 17% 4%
Australian Distribution 25% 25% 25% 25%
Index of Community Socio-Education Advantage
School ICSEA Value 810
Australian ICSEA Value 1000
Source: My SchoolsNarration: Students come from families mainly involved in the opal mining or agricultural industries. Some students live within the township of Lightning Ridge, with many others living on rural properties or on mining camps on the outskirts of the town. Students and their families have a rich variety of backgrounds, all of which contribute to the diversity of this isolated north-western town.
LRCS attracts significant additional funding to assist the school provide equity and opportunity for its students. In 2010 the school received funding from the Priority Schools Program (PSP), the Country Area Program (CAP) and the National Partnership (Low SES) program.
According to the ‘My Schools’ data, LRCS achieves an ICSEA value of 810 compared to the average value of 100. As you can see, the majority of families fall into the bottom quarter and very few in the top. LRCS’s NAPLAN results show the students to be above or close to schools with a similar ICSEA value, however they are generally substantially below the national average.
ObesityObesity
Graph here with different health issues identifying obesity as a major one.
Second graph with obesity rates in Aust – adults and children.
Narration: Group 11 have identified obesity as a priority health area for LRCS to focus on.
Approximately one-quarter or around 600,000 children aged between 5 and 17 were identified as overweight or obese in 2007-08 as identified in the 2007-2008 National Health Survey. This is a four percentage point increase from 1995.
Looking at obesity only, the rate for children increased from 5.2% in 1995 to 7.5% in 2007-08.
Children living in the areas of greatest relative disadvantage had more than double the rate of obesity (28%) of children living in areas with the lowest relative disadvantage (13%).
The Schools Physical Activity and Nutrition Survey 2010 (SPANS) showed similar numbers with a total of 22.8% of NSW children being overweight or obese; 17.1% being overweight and 5.8% being obese. This compares to 11% of all young people aged 7-16 years in 1985 (COO 2006) <NSW Centre for Overweight and Obesity 2006, NSW Schools Physical Activity and Nutrition Survey (SPANS) 2004 Full Report, COO, Sydney.>
(Note from Michelle here - The 2004 NSW Schools Physical Activity and Nutrition Survey (SPANS) showed that 26% of boys and 24% of girls in NSW aged approximately 5-16 years were overweight or obese, compared with 11% of all young people aged 7-16 years in 1985 (COO 2006). The point being, that overweight/obesity rates have dropped from 2004 to 2010. The govt [of course] attributes this drop to the healthy eating/exercise campaigns they have run since 2004)
What is obesity. The World Health Organisation identifies obesity as an adult with a BMI of 30+. An overweight person is anyone with a BMI of 25 to less than 30. Overweight and obesity are defined according to the BMI scores. There are BMI cutoffs for children which are based on the definitions of adult overweight and obesity adjusted to specific age and sex categories for children. For a detailed list of these cutoffs, please see the National Health Survey Users' Guide (ABS cat. no. 4363.0.55.001).
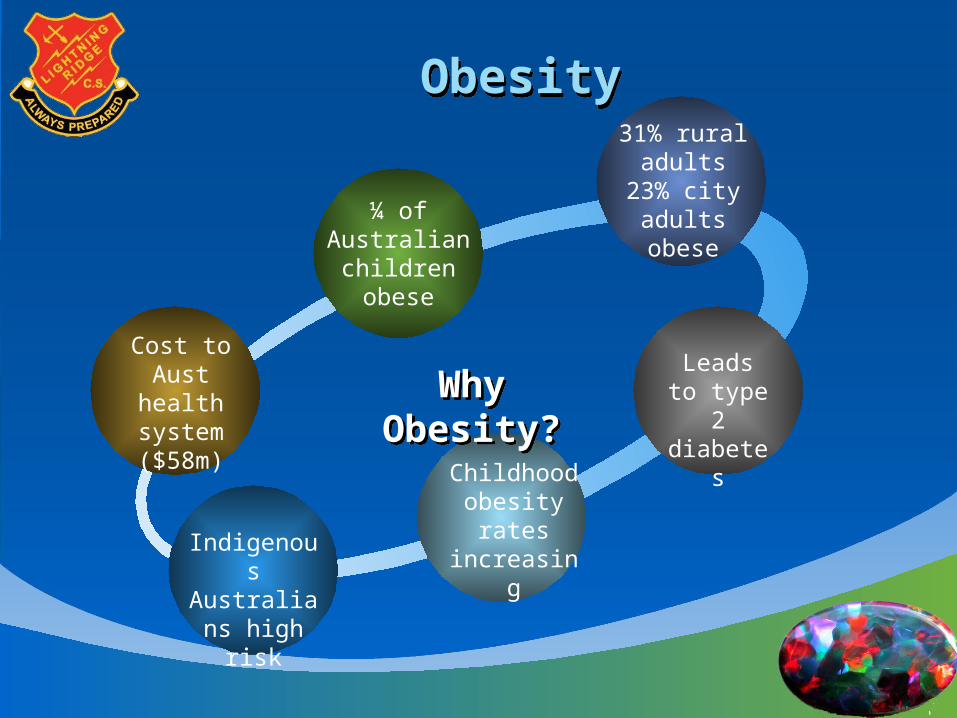
In 2008, it was estimated that the overall cost of obesity to Australian society and governments was $58 billion (Access Economics, 2008).
Group 11 chose obesity as a priority health area due to the shockingly high numbers of Australian children who are overweight or obese and the resulting problems that being obese causes as children and then into adulthood.
ObesityObesity
Cost to Aust health
system ($58m)
¼ of Australian children obese
31% rural adults
23% city adultsobese
Childhood obesity rates
increasingIndigenous Australians
high risk
Why Obesity?Why Obesity?Leads to type 2
diabetes
Why Obesity?Why Obesity?
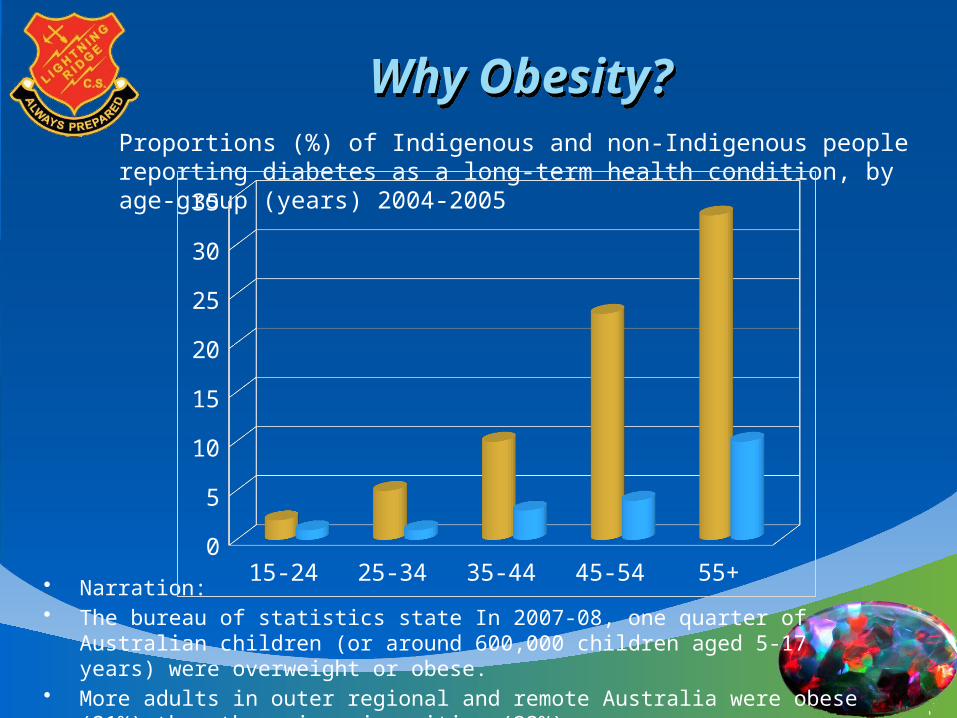
• Narration: • The bureau of statistics state In 2007-08, one quarter of Australian children (or
around 600,000 children aged 5-17 years) were overweight or obese. • More adults in outer regional and remote Australia were obese (31%) than those in
major cities (23%).• Health education programs between 2004-2010 have seen a decrease in the amount
of children diagnosed with Diabetes. • Current Strain and demand on the Australian Health System • Obesity can lead to other serious diseases and long term health risks such as Type 2
Diabetes. • Indigenous Australians are more prone to contract Diabetes.• Indigenous people living in remote areas of Australia were more than eight times
more likely to report having diabetes or HSL than non-Indigenous people.• Prevention and awareness of obesity during a child’s schooling life is crucial to
ensure a healthy start to their adult life. Studies have shown that once children become obese they are more likely to stay obese into adulthood and have an increased risk of developing diseases associated with obesity (AIHW 2004).
Proportions (%) of Indigenous and non-Indigenous people reporting diabetes as a long-term health condition, by age-group (years) 2004-2005
15-24 25-34 35-44 45-54 55+0
5
10
15
20
25
30
35
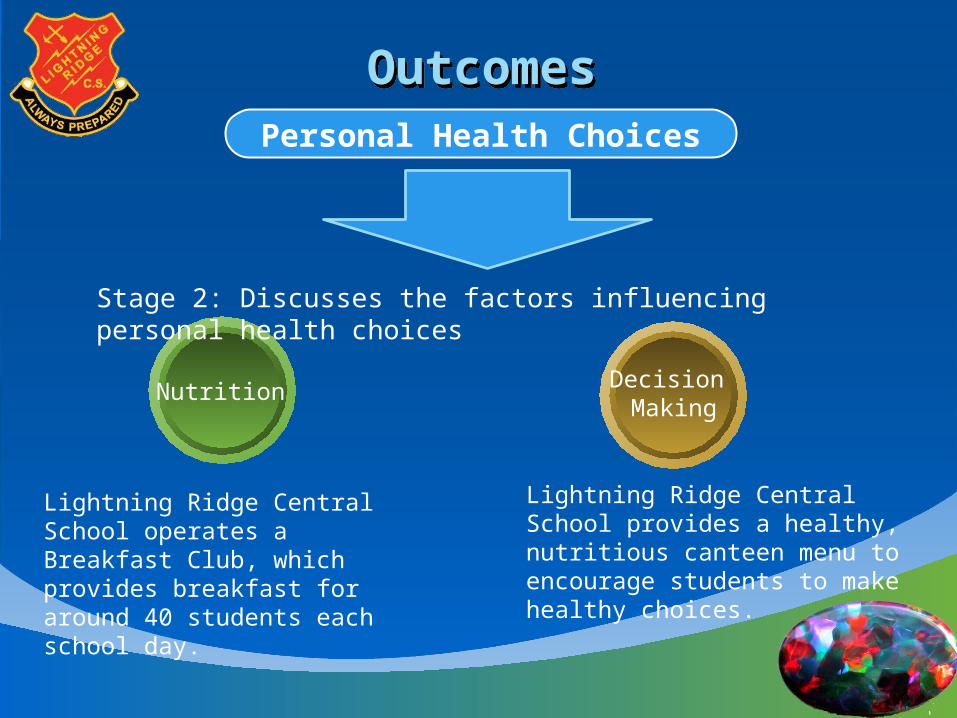
OutcomesOutcomesPersonal Health Choices
Decision Making
Nutrition
Stage 2: Discusses the factors influencing personal health choices
Lightning Ridge Central School operates a Breakfast Club, which provides breakfast for around 40 students each school day.
Lightning Ridge Central School provides a healthy, nutritious canteen menu to encourage students to make healthy choices.
Aims and ObjectivesAims and Objectives
Aim: Personal Health Choices examines the process of making lifestyle decisions and putting them into practice. The strand considers the personal health decisions that students make about their lives relating to nutrition and disease prevention.
Objectives:• Values and AttitudesTo develop students’ appreciation of, and a commitment to, healthy and socially just ways of living.• Skills To develop students’ skills in making, communicating and acting upon health decisions.• KnowledgeTo develop students’ knowledge and understanding about ways to enhance personal and community health and well-being.
Narration-- Nutrition: Health and nutrition is taught within the primary syllabus to ensure students are able to make informed decisions about healthy eating and wellbeing.Decision Making: Decision making is taught within the syllabus to allow students to make safe lifestyle decisions and put them into practice.
IndicatorsIndicators
Nutrition
S2: Discusses the nutritional factors that contribute to a healthy dietS2: Explain the benefits of balanced eating habitsS2: Explore the illnesses associated with obesity e.g. diabetes, heart diseaseS2: Analyse the impact of fast foods on personal health
Decision Making
S2: Identify physical factors that influence lifestyle choices S2: Describe the importance of how taking responsibility for ones own decisions impacts on personal health and healthy choicesS2: Explore ways in which to improve health and well being e.g. exercise and dietS2: Analyse ways in which family and peers influence decisions on lifestyle choices
Lightning RidgeCentral School Health Policy
Lightning RidgeCentral School Health Policy
Last update: 24th July 2012RATIONALE: At LRCS we believe health and well being is a whole life commitment. In our school, we will uphold
and maintain good health and well being for all in the school community.
AIM: In order to facilitate each person in committing to a healthy lifestyle, we will provide individual education so
informed decisions can be made to ensure this is a reality. The continuation of the Healthy Active Schools
program and the operation of the Breakfast Club will also advocate and model healthy eating and nutrition..
Lightning RidgeCentral School Health Policy
Lightning RidgeCentral School Health Policy
IMPLICATIONS: This will be a collaboration between students, staff, parents and the Lightning Ridge
community members, who will advocate a healthy, positive and supportive environment ,by providing quality health and physical education, specifically
catering to our school community’s health needs and interests.
REVIEW: This policy will be monitored and reviewed annually by the Health Promoting Policy group in
preparation for the LRCS Annual Report.
Realising OutcomesRealising Outcomes
Policy Plans Procedures Programs
TEXT TEXT TEXT TEXT
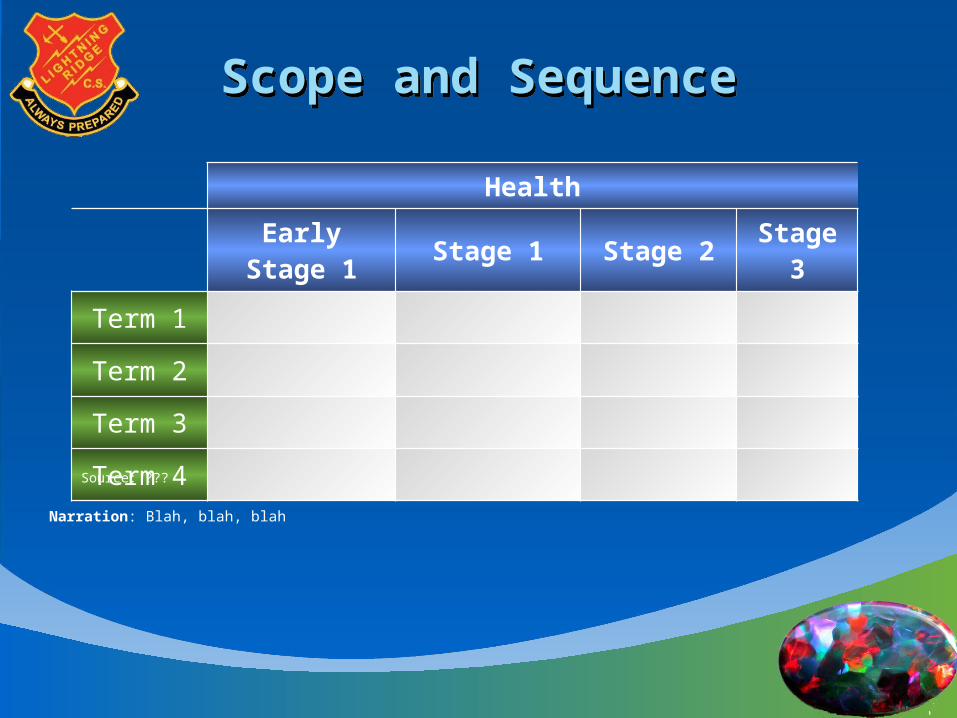
Scope and SequenceScope and Sequence
Health
Early Stage 1 Stage 1 Stage 2 Stage 3
Term 1
Term 2
Term 3
Term 4
Source: ???
Narration: Blah, blah, blah
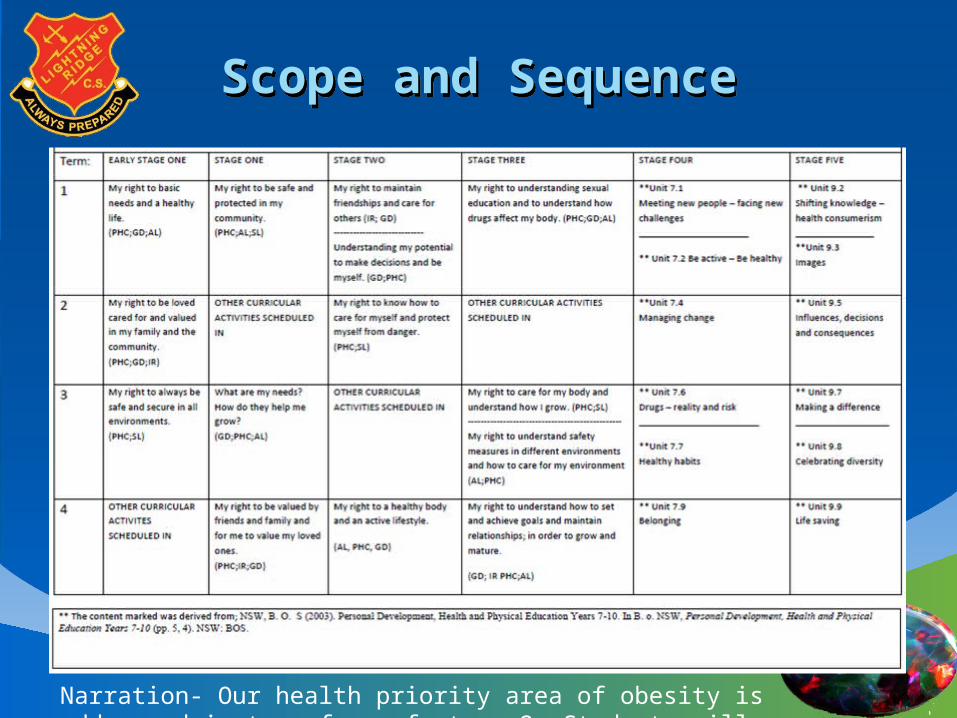
Scope and SequenceScope and Sequence
Narration- Our health priority area of obesity is addressed in term four of stage 2. Students will explore their right to a healthy body and an active lifestyle through healthy eating habits and regular physical activity.
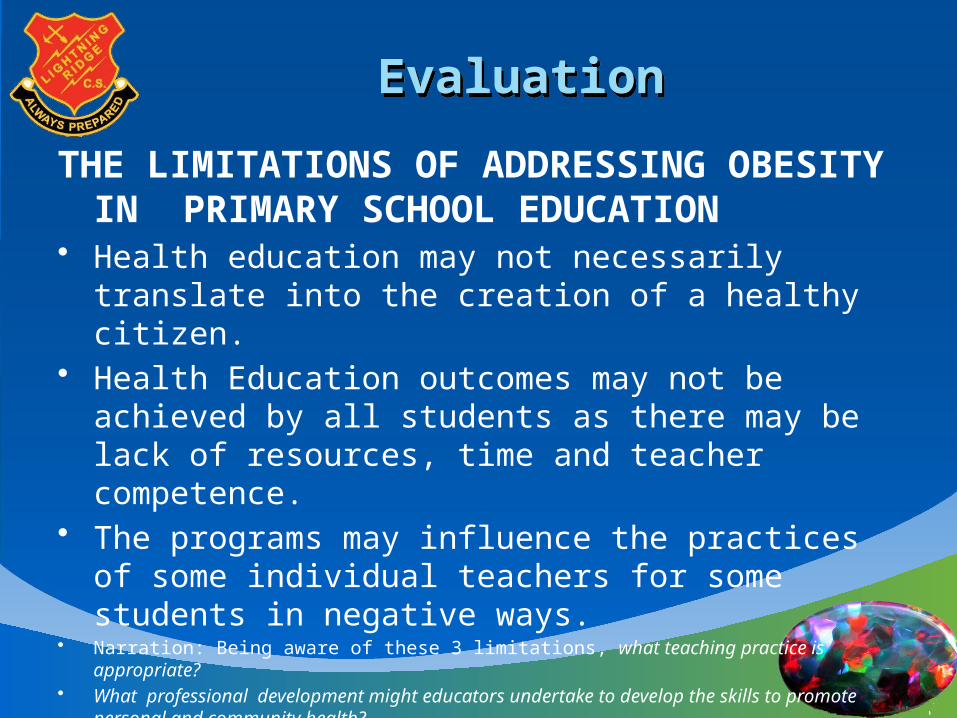
EvaluationEvaluation
THE LIMITATIONS OF ADDRESSING OBESITY IN PRIMARY SCHOOL EDUCATION
• Health education may not necessarily translate into the creation of a healthy citizen.
• Health Education outcomes may not be achieved by all students as there may be lack of resources, time and teacher competence.
• The programs may influence the practices of some individual teachers for some students in negative ways.
• Narration: Being aware of these 3 limitations, what teaching practice is appropriate?• What professional development might educators undertake to develop the skills to promote
personal and community health?• Furthermore, knowing these challenges how will the anti- obesity programs be assessed to
ensure their success and positive focus? • These are just some questions that need to acknowledged and answered.
Recommended ResourcesRecommended Resources
ReferencesReferences
3-D Pie Chart3-D Pie Chart
TEXT
TEXT
TEXT
TEXTTEXT
TEXT