Light-sheet microscopy in thick media using scanned Bessel ...
17
HAL Id: hal-00994649 https://hal-iogs.archives-ouvertes.fr/hal-00994649 Submitted on 19 Nov 2015 HAL is a multi-disciplinary open access archive for the deposit and dissemination of sci- entific research documents, whether they are pub- lished or not. The documents may come from teaching and research institutions in France or abroad, or from public or private research centers. L’archive ouverte pluridisciplinaire HAL, est destinée au dépôt et à la diffusion de documents scientifiques de niveau recherche, publiés ou non, émanant des établissements d’enseignement et de recherche français ou étrangers, des laboratoires publics ou privés. Light-sheet microscopy in thick media using scanned Bessel beams and two-photon fluorescence excitation Florian Fahrbach, Vasily Gurchenkov, Kévin Alessandri, Pierre Nassoy, Alexander Rohrbach To cite this version: Florian Fahrbach, Vasily Gurchenkov, Kévin Alessandri, Pierre Nassoy, Alexander Rohrbach. Light- sheet microscopy in thick media using scanned Bessel beams and two-photon fluorescence excita- tion. Optics Express, Optical Society of America - OSA Publishing, 2013, 21 (11), pp.13824-13839. 10.1364/OE.21.013824. hal-00994649
Transcript of Light-sheet microscopy in thick media using scanned Bessel ...

HAL Id: hal-00994649https://hal-iogs.archives-ouvertes.fr/hal-00994649
Submitted on 19 Nov 2015
HAL is a multi-disciplinary open accessarchive for the deposit and dissemination of sci-entific research documents, whether they are pub-lished or not. The documents may come fromteaching and research institutions in France orabroad, or from public or private research centers.
L’archive ouverte pluridisciplinaire HAL, estdestinée au dépôt et à la diffusion de documentsscientifiques de niveau recherche, publiés ou non,émanant des établissements d’enseignement et derecherche français ou étrangers, des laboratoirespublics ou privés.
Light-sheet microscopy in thick media using scannedBessel beams and two-photon fluorescence excitationFlorian Fahrbach, Vasily Gurchenkov, Kévin Alessandri, Pierre Nassoy,
Alexander Rohrbach
To cite this version:Florian Fahrbach, Vasily Gurchenkov, Kévin Alessandri, Pierre Nassoy, Alexander Rohrbach. Light-sheet microscopy in thick media using scanned Bessel beams and two-photon fluorescence excita-tion. Optics Express, Optical Society of America - OSA Publishing, 2013, 21 (11), pp.13824-13839.�10.1364/OE.21.013824�. �hal-00994649�

Light-sheet microscopy in thick mediausing scanned Bessel beams and
two-photon fluorescence excitation
Florian O. Fahrbach,1,2,∗ Vasily Gurchenkov,3 Kevin Alessandri,3Pierre Nassoy,3,4 and Alexander Rohrbach1,5,6
1 Laboratory for Bio- and Nano-Photonics, Department of Microsystems Engineering,University of Freiburg, Freiburg, Germany
2 Max Planck Institute of Molecular Cell Biology and Genetics, Dresden, Germany3 Institut Curie, Centre de Recherche, F-75248 Paris, France
4 LP2N, Institut d’Optique, CNRS UMR 5298 & Universite de Bordeaux 1, F-33405 Talence,France
5 Centre for Biological Signalling Studies (bioss), University of Freiburg, Freiburg, Germany6 [email protected]∗ [email protected]
Abstract: In this study we show that it is possible to successfullycombine the benefits of light-sheet microscopy, self-reconstructing Besselbeams and two-photon fluorescence excitation to improve imaging in large,scattering media such as cancer cell clusters. We achieved a nearly two-foldincrease in axial image resolution and 5-10 fold increase in contrast relativeto linear excitation with Bessel beams. The light-sheet penetration depthcould be increased by a factor of 3-5 relative to linear excitation withGaussian beams. These findings arise from both experiments and computersimulations. In addition, we provide a theoretical description of how theseresults are composed. We investigated the change of image quality along thepropagation direction of the illumination beams both for clusters of spheresand tumor multicellular spheroids. The results reveal that light-sheetsgenerated by pulsed near-infrared Bessel beams and two photon excitationprovide the highest image resolution, contrast and light-sheet penetration ata minimum amount of artifacts.
© 2013 Optical Society of AmericaOCIS codes: (180.6900) Three-Dimensional microscopy; (180.4315) Nonlinear microscopy;(110.0113) Imaging through turbid media.
References and links1. J. Huisken and D. Y. R. Stainier, “Selective plane illumination microscopy techniques in developmental biology,”
Development 136, 1963–1975 (2009).2. F. O. Fahrbach, P. Simon, and A. Rohrbach, “Microscopy with self-reconstructing beams,” Nat. Photonics 4,
780–785 (2010).3. F. O. Fahrbach and A. Rohrbach, “A line scanned light-sheet microscope with phase shaped self-reconstructing
beams.” Opt. Express. 18, 2608–2610 (2010).4. T. A. Planchon, L. Gao, D. E. Milkie, M. W. Davidson, J. A Galbraith, C. G. Galbraith, and E. Betzig, “Rapid
three-dimensional isotropic imaging of living cells using Bessel beam plane illumination.” Nat. Methods. 8,417–423 (2011).
5. O. E. Olarte, J. Licea-Rodriguez, J. A. Palero, E. J. Gualda, D. Artigas, J. Mayer, J. Swoger, J. Sharpe, I. Rocha-Mendoza, R. Rangel-Rojo, and P. Loza-Alvarez, “Image formation by linear and nonlinear digital scanned light-sheet fluorescence microscopy with Gaussian and Bessel beam profiles.” Biomed. Opt. Express. 3, 1492–1505(2012).
#187031 - $15.00 USD Received 18 Mar 2013; revised 23 Apr 2013; accepted 23 Apr 2013; published 31 May 2013(C) 2013 OSA 3 June 2013 | Vol. 21, No. 11 | DOI:10.1364/OE.21.013824 | OPTICS EXPRESS 13824

6. F. O. Fahrbach and A. Rohrbach, “Propagation stability of self-reconstructing Bessel beams enables contrast-enhanced imaging in thick media.” Nat. Commun. 3, 632 (2012).
7. L. Silvestri, A. Bria, L. Sacconi, G. Iannello, and F. S. Pavone, “Confocal light sheet microscopy: micron-scaleneuroanatomy of the entire mouse brain,” Opt. Express. 20, 20582–20598 (2012).
8. E. Baumgart and U. Kubitscheck, “Scanned light sheet microscopy with confocal slit detection,” Opt. Express20, 21805–21814 (2012).
9. J. Mertz, Introduction to Optical Microscopy (Roberts & Company Publishers,2010).10. F. Helmchen and W. Denk. “Deep tissue two-photon microscopy,” Nat. Methods 2, 932-940 (2005).11. P. Theer, M. T. Hasan, and W. Denk, “Two-photon imaging to a depth of 1000m in living brains by use of a
Ti:Al2O3 regenerative amplifier,” Opt. Lett. 28, 1022–1024 (2003).12. E. Beaurepaire, M. Oheim, and J. Mertz, “Ultra-deep two-photon fluorescence excitation in turbid media,” Opt.
Commun. 188, 25–29 (2001).13. J. Palero, S. I. C. O. Santos, D. Artigas, and P. Loza-Alvarez. “A simple scanless two-photon fluorescence mi-
croscope using selective plane illumination,” Opt. Express 18, 8491–8498 (2010).14. T. V. Truong, W. Supatto, D. S. Koos, J. M. Choi, and S. E. Fraser, “Deep and fast live imaging with two-photon
scanned light-sheet microscopy,” Nat. Methods 8, 757–760 (2011).15. E. Botcherby, R. Juskaitis, and T. Wilson, “Scanning two photon fluorescence microscopy with extended depth
of field,” Opt. Commun. 268, 253–260 (2006).16. P. Dufour, M. Pich, Y. De Koninck, and N. McCarthy, “Two-photon excitation fluorescence microscopy with a
high depth of field using an axicon,” Appl. Opt. 45, 9246–9252 (2006).17. A. Rohrbach, “Artifacts resulting from imaging in scattering media: a theoretical prediction,” Opt. Lett. 34,
3041–3043 (2009).18. J. A. Fleck, J. R. Morris, and M. D. Feit, “Time-dependent propagation of high energy laser beams through the
atmosphere.” Appl. Phys. 10, 129–160 (1976).19. M. D. Feit and J. A. Fleck, “Light propagation in graded-index optical fibers,” Appl. Opt. 17, 3990–3998 (1978).20. C. D. Bohren and D. R. Huffman, Absorption and Scattering of Light by Small Particles (Wiley-VCH, Berlin,
1998).
1. Introduction
The generation of high-quality three-dimensional images in large scattering media such as tis-sue, embryos, plants, or cell clusters in biology is a tricky task. Limited penetration and scatte-ring of illumination light inside the specimen degrade the image quality. Moreover, unnecessaryphoto-bleaching of fluorophores that are not in the image plane degrade the usability of micro-scopes. In this context, light-sheet based microscopy [1] offers the decisive advantage that onlythose parts of the object are illuminated that are in the plane of focus of an objective lens (OL).Sample illumination by a thin sheet of light reduces fluorophore bleaching significantly relativeto conventional epi-fluorescence microscopy or point-scanning confocal microscopy. Recentlyit has been shown that an alternative form of light-sheets can be generated by using laterallyscanned Bessel beams [2–5], which revealed an increased penetration depth of illuminationlight in thick media of up to 50% [2, 3]. However the advantage of beam self-reconstruction inscattering media is at the cost of a decreased image contrast: the Bessel beam’s ring system,which contains the photons necessary for beam-healing, excites fluorescence above and belowthe plane of focus. Exploiting the propagation stability of Bessel beams allowed to increaseimage contrast very efficiently. The confocal-line detection principle, where out-of-focus fluo-rescence excited by the ring system is largely blocked [6] also rejects scattered light. Therefore,this principle is also useful in combination with Gaussian beam illumination [7, 8].
However, an alternative approach would be desirable, where a thin light-sheet does not gen-erate any out-of-focus fluorescence. Two-photon excitation (TPE) of the fluorophores is such amethod that avoids the contrast degrading effect of the ring system. In TPE, two near-infrared(NIR) photons must hit the same fluorophore at the same time to excite it [9]. The resultingquadratic dependence of the fluorophore emission F(r) on the illumination intensity hill(r)is expected to suppress the fluorescence in the ring system efficiently. In addition, the nearlydoubled wavelength of the NIR excitation light should reduce scattering and increase the pen-etration depth similarly to point scanning TPE fluorescence microscopy [10–12].
#187031 - $15.00 USD Received 18 Mar 2013; revised 23 Apr 2013; accepted 23 Apr 2013; published 31 May 2013(C) 2013 OSA 3 June 2013 | Vol. 21, No. 11 | DOI:10.1364/OE.21.013824 | OPTICS EXPRESS 13825

The favorable combination of light-sheet microscopy and TPE has been employed by othergroups using static light-sheets [13], scanned Gaussian beams [14] and Bessel beams [4, 5].Moreover, TPE by Bessel beams in point-scanning systems were used, but only to increase thedepth of focus of the system [15, 16]. The results presented here are the first investigation ofTPE by Bessel beams in thick and strongly scattering media using a light-sheet microscope.This combination is especially interesting since on the one hand the light-sheet microscope isan ideal tool to study the propagation of beams in scattering media because the propagationof illumination light within the detection focal plane can be observed from the side. On theother hand, only at depths of several hundred microns inside scattering media the followingthree advantages can take effect efficiently: the reduced photo-bleaching enabled by light-sheetmicroscopy, weaker scattering artifacts due to the self-reconstruction capability of the Besselbeams and increased contrast due to the TPE principle.
We demonstrate the performance of this approach in tumor cell clusters. The motivation forobserving this form of cancerous tissue in a light-sheet microscope is the following: The discov-ery of new anticancer drugs requires High Throughput Screening (HTS) approaches. These areusually based on animal models, which generally well recapitulate the main features of humantumors. 2D-cell based in-vitro models have been extensively used in preclinical drug screeningdespite their poor predictive capability for in-vivo efficacy. 3D-tissue culture models, on theother side, are undisputedly better candidates to reconcile scientific, medical and ethical re-quirements. Multicellular Tumor Spheroids (MCTS), which were shown to be superior in-vitrotumor models as compared to 2D cell monolayers, have not yet received widespread appli-cation in cancer biology. Beside the technical difficulty of massively producing size-controlledspheroids, another limitation for their more extensive use originates from the difficulty to imagethick and highly scattering samples with reduced photo-toxicity over several days. To decipherthe molecular and cellular mechanisms of (in-vitro) tumor progression, imaging techniques arerequired that allow investigating not only the rim of peripheral cells, but also the core of thespheroid, to fully observe the spatial and temporal organization of the whole tumor mimics.
In this paper we describe briefly the technical setup of a microscope able to fully image tumormulticellular spheroids. We explain and illustrate all necessary principles and give a detailedmathematical description of the simulated and measured results or phenomena. We compare thenon-diffraction capability of single (1p) and two (2p) - photon fluorescence excitation Besselbeams in homogeneous media as well as their self-reconstruction properties in scattering me-dia. We analyze contrast and resolution for both beam types. In the last section of this paper,we demonstrate the strong benefits of 2p-Bessel beams both in widefield and confocal-linedetection mode - for light-sheet microscopy in 250µm large biological tumor cell clusters.
2. Experimental setup
In order to be able to compare the performance of various beams for linear and non-linearfluorescence excitation in a light-sheet microscope we expanded our existing setup (which isdescribed in detail in [3]) by a Ti-Sapphire-Laser (Chameleon, Coherent). This laser emitsshort pulses with a duration of 140fs with a repetition rate of 80MHz with high power (Pavg >1W) over a wide range in the near-infrared spectral range (720nm to 920nm). The setup forTPE fluorescence is sketched in Fig. 1. A switchable mirror allows quick alteration betweenillumination by the visible lasers and the NIR laser. All optical elements (mirror, lenses) aresuitable for the usage in the NIR range and for the high peak intensities generated by the pulsedlaser. Even though the achromatic doublets (Qioptiq) are optimized for the visible spectralrange, neither reflections due to the imperfect anti-reflection coating nor aberrations to theillumination beams were observed. A broadband LCOS-based spatial light modulator (SLM)was chosen (Pluto NIR II, Holoeye) which is optimized for a wide spectral range (400-1100nm)
#187031 - $15.00 USD Received 18 Mar 2013; revised 23 Apr 2013; accepted 23 Apr 2013; published 31 May 2013(C) 2013 OSA 3 June 2013 | Vol. 21, No. 11 | DOI:10.1364/OE.21.013824 | OPTICS EXPRESS 13826
x z
y
Laser
AOTF PBS
BE
SLM
TL
DO
TL
CCD
Beam shaping
Linear excitation light source
SL L GSM
Illumination unit
detectio
n u
nit
IO
A
SM
IO
DO
BFP Sample Volume
AOM
BE
fs-NIR-Laser
Two-photon excitation light source
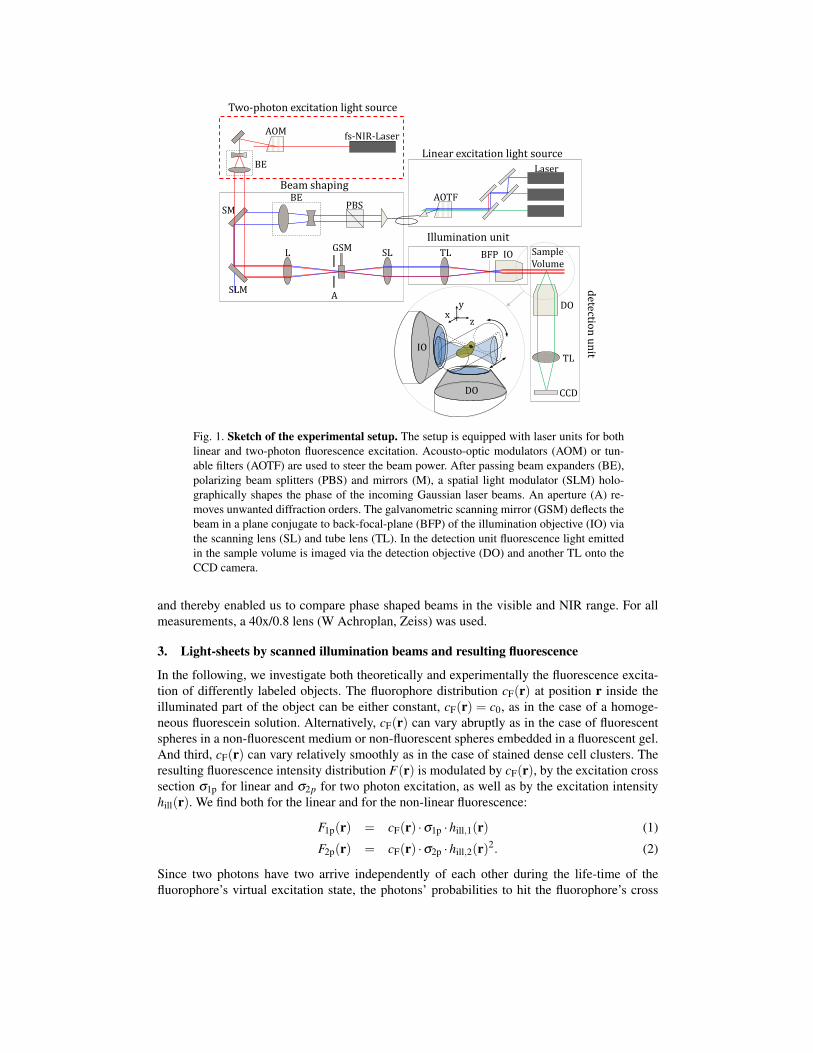
Fig. 1. Sketch of the experimental setup. The setup is equipped with laser units for bothlinear and two-photon fluorescence excitation. Acousto-optic modulators (AOM) or tun-able filters (AOTF) are used to steer the beam power. After passing beam expanders (BE),polarizing beam splitters (PBS) and mirrors (M), a spatial light modulator (SLM) holo-graphically shapes the phase of the incoming Gaussian laser beams. An aperture (A) re-moves unwanted diffraction orders. The galvanometric scanning mirror (GSM) deflects thebeam in a plane conjugate to back-focal-plane (BFP) of the illumination objective (IO) viathe scanning lens (SL) and tube lens (TL). In the detection unit fluorescence light emittedin the sample volume is imaged via the detection objective (DO) and another TL onto theCCD camera.
and thereby enabled us to compare phase shaped beams in the visible and NIR range. For allmeasurements, a 40x/0.8 lens (W Achroplan, Zeiss) was used.
3. Light-sheets by scanned illumination beams and resulting fluorescence
In the following, we investigate both theoretically and experimentally the fluorescence excita-tion of differently labeled objects. The fluorophore distribution cF(r) at position r inside theilluminated part of the object can be either constant, cF(r) = c0, as in the case of a homoge-neous fluorescein solution. Alternatively, cF(r) can vary abruptly as in the case of fluorescentspheres in a non-fluorescent medium or non-fluorescent spheres embedded in a fluorescent gel.And third, cF(r) can vary relatively smoothly as in the case of stained dense cell clusters. Theresulting fluorescence intensity distribution F(r) is modulated by cF(r), by the excitation crosssection σ1p for linear and σ2p for two photon excitation, as well as by the excitation intensityhill(r). We find both for the linear and for the non-linear fluorescence:
F1p(r) = cF(r) ·σ1p ·hill,1(r) (1)
F2p(r) = cF(r) ·σ2p ·hill,2(r)2. (2)
Since two photons have two arrive independently of each other during the life-time of thefluorophore’s virtual excitation state, the photons’ probabilities to hit the fluorophore’s cross
jmayfi
pg. 4
jmayfi
Sticky Note
Unmarked set by jmayfi

Bessel, 1p NA=0.4, e=0.9
Bessel, 2p NA=0.4, e=0.9
Conv, 2p NA=0.155, e=0
Conv, 1p NA=0.13, e=0
1µm
FSB(0,y)
Fscan(0,y)
y
y
b
c
a
hsys(y)
y
z y
x y
z y
Fig. 2. Simulated fluorescent beam profiles. Simulated fluorescence cross-sectionsF(x,y) for different types of illumination beams with the same depth of field along theillumination z-axis. A Gaussian beam for one-photon (1st column) and two-photon excita-tion (2nd column) and a Bessel beam for one-photon (3rd column) and two-photon exci-tation (4th column). a) Single beam fluorescence intensity F(x,y,0) and the correspondingline scans F(0,y,0) on the right. b) Light sheet fluorescence produced by a lateral scan∫
F(x,y,0)dx of the three beams in x-direction and line profiles∫
F(0,y,0)dx|x=0 throughthe light-sheets. c) Multiplications of the light-sheets with the detection point-spread func-tion hdet(x,z).
section must be multiplied with each other. This results in the quadratic dependence of theillumination intensity, hill,2(r)2, as described in Eq. (2). For the typical case of pulsed illu-mination light, a more precise description of the temporally averaged fluorescence would be⟨F1p(r)
⟩= cF(r) ·σ2p ·G ·
⟨hill,2(r)2
⟩, where G is a correction factor [9]. However, keeping this
in mind and disregarding dispersive effects, we hold on to the expression of Eq. (2).In many cases, the resulting fluorescence F(r) in a homogeneously stained sample illustrates
well the excitation intensity hill(r), if the detection PSF is small enough. Figure 2 displayssimulation results of linear and nonlinear fluorescence excitation by Gaussian beams and Besselbeams at λ1 and λ2, respectively. The depth of field of the fluorescence excitation ∆z = 100µmis equal for all beams. As described in the Appendix, due to the different wavelengths used,the illumination beams, hill,1(r), and hill,2(r), have to be designed differently to match theirdepth-of-field. The cross sections, F(x,y,z = 0) and the intensity line scans F(0,y,0) reveal therelatively large widths of the Gaussian beam (green line), the narrow main lobe of the Besselbeam with distinct side lobes from the ring system (blue line) and the narrow profile of the twophoton (2p) Bessel beam (red line), where the rings are strongly suppressed.
By continuously displacing the illumination beam hill(r) by bx in lateral x-direction the re-
tmiller
13828
sulting 1p- and 2p- fluorescence distributions are
F1p(r) = cF(r) ·σ1p ·∫ xm
xm
hill,1(x−bx,y,z)dbx (3)
F2p(r) = cF(r) ·σ2p ·∫ xm
xm
hill,2(x−bx,y,z)2 dbx. (4)
These dependencies are displayed in Fig. 2(b) for the four types of beams and a homogeneousfluorophore concentration cF(r) = c0. The profiles Fscan(0,y,0) through the light-sheet in theright part of Fig. 2(b) reveal the increased width of the light-sheet relative to the width of asingle beam for the 1p-Bessel beam. This effect is hardly visible for the 2p-Bessel light-sheet.
In the last step of the image generation process, fluorescence is detected by the detec-tion objective (DO) with NAdet and point-spread function hdet and imaged onto the camera.Mathematically, the 3D image p(by,r) for a light-sheet shifted vertically by by is obtained byF1p(by,r)∗hdet(r), where ∗ denotes the convolution, which corresponds to a low-pass filteringof the fluorophore distribution F(by,r) especially along the detection y-axis. The images read
p1p(by,r) =
(cF(r) ·σ1p ·
∫ xm
xm
hill,1(x−bx,y−by,z)dbx
)∗hdet(r) (5)
p2p(by,r) =
(cF(r) ·σ2p ·
∫ xm
xm
hill,2(x−bx,y−by,z)2dbx
)∗hdet(r). (6)
The image of a point-like fluorophore, cF(r) = c0 δ (r) illuminated by a light-sheet at positionby = 0 is shown in Fig. 2(c) and demonstrates the suppression of out-of-focus fluorescence forthe 2p-Bessel beam, but not for the 1p-Bessel beam.
The numerical results are confirmed experimentally by the 2D-images of single beamsp1p(x,0,z) = c0 ·σ1p ·hill,1(r)∗hdet(r)
∣∣y=0 and p2p(x,0,z) = c0 ·σ2p ·h2
ill,2(r)∗hdet(r)∣∣∣y=0
, fo-
cused at NAill≈ 0.3, that excite fluorescence in a homogeneous fluorescein solution. As demon-strated by the experimental data shown in Fig. 3, single-photon fluorescence excitation gener-ates strong fluorescence in the Bessel beam’s ring system shown in Fig. 3(a), which is still wellvisible due to the narrow hdet(r) at a Numerical Aperture NAdet = 0.8 of the detection lens. Inthe two-photon case, fluorescence from the ring system is strongly suppressed as can be seenin Fig. 3(b), which is also shown by the lateral profiles through the beam images shown in Fig.3(c).
4. Light scattering during propagation through inhomogeneous media
In most applications of light-sheet microscopy the refractive index variations inside the objectare not index-matched (cleared). Illumination and detection light are scattered at each refractiveindex change, which leads to a new propagation direction of each scattered photon. Only a smallfraction of the photons remain unscattered, so-called ballistic photons, while the other photonsare scattered very many times such that these photons become diffusive. The correspondingelectromagnetic field of the illumination beam is split into an incident and a scattered electricfield, Ei(r) and Es(r), such that the fluorescence intensity F1p(r) ∝ hill,1(r) can be expressed as:
F1p(r) = cF(r) ·σ1p ·hill,1(r)
= cF(r) ·σ1p ·∣∣Ei,1(r)+Es,1(r)
∣∣2= cF(r) ·σ1p ·
[|Ei,1|2 +
(|Es,1|2 +2cos(|Ei,1||Es,1|)(φi,1(r)−φs,1(r))
)](7)
= cF(r) ·σ1p · (hi,1(r)+hs,1(r)) .
#187031 - $15.00 USD Received 18 Mar 2013; revised 23 Apr 2013; accepted 23 Apr 2013; published 31 May 2013(C) 2013 OSA 3 June 2013 | Vol. 21, No. 11 | DOI:10.1364/OE.21.013824 | OPTICS EXPRESS 13829

a
b
20µm
20µm
z x
z x
Two-photon fluorescence excitation @ 760nm
Single-photon fluorescence excitation @ 488nm
20
0
-20
30
10
-10
-30
0
1p 2p
20
0
-20
30
10
-10
-30
0
20
0
-20
30
10
-10
-30
0
c F(x,z=5µm) F(x,z=160µm) F(x,z=320µm)
Fig. 3. Measured linear and non-linear fluorescence excitation. The fluorescence excitedby Bessel beams over a distance in a fluorescein solution is shown for linear fluorescenceexcitation (a) and TPE (b). In the linear case, the Bessel beams ring system is stronglyvisible. In contrast, in the case of TPE the ring system is efficiently suppressed so that fluo-rescence is excited almost exclusively by the beams main lobe. This effect is quantified bythe line-scans shown in (c), where hardly any changes in the profiles for different distancesz are visible.
Corresponding to Eq. (1), these equations show that the illumination intensity hill(r) can besplit into two terms: hi(r) and hs(r) both illuminate the object [17]. Thereby two images aregenerated by convolution of the object cF(r) with the detection PSF:
p(r) = ((hi(r)+hs(r)) · cF(r) ·σ)∗hdet(r) = pideal(r)+ pghost(r) (8)
The second image is called the ghost image and needs to be minimized by clever illumination ordetection techniques. In the two-photon case the sum of the ideal and the scattered illuminationbeams can be expressed as
F2p(r) = cF(r) ·σ2p ·hill,2(r)2
= cF(r) ·σ2p · (hi,2(r)+hs,2(r))2
= cF(r) ·σ2p ·hi,2(r)2 + cF(r) ·σ2p ·(hs,2(r)2 +2 ·hi,2(r) ·hs,2(r)
). (9)
The first term in Eq. (9) corresponds to Eq. (2), whereas the second term represents unwantedtwo-photon fluorescence excitation in the object. In the two-photon case the ghost image canbe expressed mathematically as
pghost(r) =(cF(r) ·σ2p ·
(hs,2(r)2 +2 ·hi,2(r) ·hs,2(r)
))∗hdet(r)→min. (10)
Theoretically, pghost approaches a minimum when the illumination beam intensity becomesminimal or when the following two terms approach each other h2
s,2(r)→ 2 ·hi,2(r) ·hs,2(r).
tmiller
13830

a
b
z x
Two-photon fluorescence excitation @ 760nm
Single-photon fluorescence excitation @ 488nm
z
x
Fig. 4. Measured fluorescence excited by a Bessel beam in a scattering medium. Thefluorescence excited by Bessel beams over a distance of 320µm in a slightly fluorescentgel containing fluorescent 0.75µm polystyrene spheres is shown for linear fluorescenceexcitation (a) and for TPE (b). In the linear case, the Bessel beams ring system illuminatesmany spheres outside the Bessel beams main lobe. For TPE, fluorescence excitation by thering system and by scattered light is suppressed so that mainly spheres along a thin linecorresponding to the Bessel beams main lobe are visible.
The fluorophore distributions described by Eq. (7) and Eq. (9) were measured by using acluster of fluorescent 0.75µm polystyrene spheres embedded in a slightly fluorescent gel asshown in Fig. 4. Whereas in the single-photon case the Bessel beam excites a lot of unwantedfluorescence, i.e. fluorescence outside the main lobe of the Bessel beam, this unwanted fluores-cence is hardly visible in the two-photon case.
By inspecting the two beams propagating through the inhomogeneous medium shown inFig. 4, the effect of a decaying intensity manifests. This results from a decreasing number ofballistic photons along the beam axis, i.e. the propagation direction z. As shown recently [2] theaxial fluorescence intensity F1p(z) falls off approximately exponentially also for Bessel beamspropagating through scattering media:
F1p(z) ≈ c0 ·σ1p ·hill,1(z = 0) · exp{−(µabs,1 +µsca,1) · z
}= c0 ·σ1p · (hi,1(z)+hs,1(z)) (11)
Here we assumed an approximately homogeneous fluorophore concentration cF(z) ≈ c0 andintegrated F1p(z) =
∫F1p(x,y,z)dxdy over a sufficiently broad area. µsca,1 = µsca(λ1) = µ ′sca,1 ·
(1− g) is the effective scattering coefficient and µabs,1 = µabs(λ1) the coefficient for the lightabsorption mainly by fluorophores. The anisotropy factor g = g(a ·ns/λ ) reduces the intensityloss along z due to scattering (a is the radius, ns is the refractive index of the scatterer). For largerscatterers with a ·ns > λ we find for where (λ1 = 488nm,λ2 = 800nm) the anisotropy factorsg→ 1 as e.g. g(0.75µm · 1.59/λ1) = 0.92, g(0.75µm · 1.59/λ2) = 0.85, g(2µm · 1.41/λ1) =0.99 or g(2µm ·1.41/λ2) = 0.97
In the two-photon case the axial decrease in illumination intensity can be described as 1c0·σ2p
·ddz F2p(z) ≈ −µabs,2 · hill,2(z)2− µsca,2 · hill,2(z) owing to the light absorbance by fluorophoresaccording to µabs,2 ·h2
ill,2 and to a loss in scattering according to µsca,2 ·hill,2. Solving the latter
#187031 - $15.00 USD Received 18 Mar 2013; revised 23 Apr 2013; accepted 23 Apr 2013; published 31 May 2013(C) 2013 OSA 3 June 2013 | Vol. 21, No. 11 | DOI:10.1364/OE.21.013824 | OPTICS EXPRESS 13831

differential equation leads to an expression with an axial intensity decay, which is similar to anexponential, but reads
hill,2(z)≈hill,2(0)
eµabs,2·z +hill,2(0) ·µabs,2/µsca,2 · (eµabs,2·z−1)(12)
Assuming an average fluorophore density independent of z (as in Fig. 4), we hardly noticedany axial decay and estimate the intensity loss due to absorption by fluorophores to be smallsuch that µabs,2 ·hill,2(z)� µsca,2. Therefore we can approximate the fluorescence decay in axialdirection for the two-photon case to be
F2p(z)≈ c0 ·σ2p ·hill,2(z)2 ≈ c0 ·σ2p ·hill,2(0)2 · exp(−2µsca,2 · z) (13)
For Rayleigh scatterers, the scattering coefficient varies as µsca(λ ) ∝ λ−4, whereas for largerscatterers in the size range of the incident wavelength one finds µsca(λ ) ∝ λ−2 (this can beeasily proven with Mie-theory [20]). Therefore we approximate µsca(λ2)≈ (λ1/λ2)
2 ·µsca(λ1).For λ1 = 488nm and λ2 = 800nm we obtain µsca(λ2) ≈ 0.37µsca(λ1). Based on this roughestimate, a Bessel beam with λ2 = 800nm wavelength has an only 1/(2× 0.37) = 1.34 foldincreased penetration depth d2 = 1/(2µsca,2) relative to a Bessel beam at λ1 = 488nm whered1 = 1/µsca,1. For λ2 = 920nm, one can expect d2 > 1.8d1. We will show in the following thatthis ratio of penetration depths can be confirmed experimentally by imaging fluorescent beadsand labelled cancer cell clusters.
5. Artifacts in non-linear light-sheet microscopy
A quadratic fluorescence dependence on the excitation intensity has two effects. On the onehand it suppresses the unwanted fluorescence in a controlled manner, for example from theBessel beam ring system. On the other hand, it might increase image artifacts such as thefrequently occurring stripes resulting from the interference of scattered and unscattered light. Toinvestigate the strength of the two effects, we used the beam propagation method (BPM) [18,19]to simulate the propagation of various illumination beams through a cluster of non-fluorescentglass spheres with a diameter d = 2µm that are embedded in a fluorescing environment. Fromthe expressions in Eq. (7) and Eq. (9) describing the fluorescence distribution for linear andnon-linear excitation, respectively, we derived the ghost image in Eqs. (8) and (10).
The results for horizontal and vertical cross-sections, p(x,y0,z) and p(x0,y,z), through the3D image stacks are displayed in Fig. 5(a)-(d). By simulating the ideal image, shown in Fig.5(e) that results from illumination by a homogenous, non-scattered light-sheet with a thicknessof only 0.2µm, we can easily generate the unwanted ghost image by subtraction of the realimage (compare Eq. (8)). The lateral standard deviations of the ideal and the ghost image as afunction of the propagation distance z are shown in Fig. 5(f) and (g), respectively (see also [2]).From these values we can estimate the image quality by calculation of the parameter Qart, whichwe define as follows:
Qart =∆pideal
∆pghost=
√1
N−1 ∑x,z (pideal(x,z)− pideal)√1
N−1 ∑x,z(
pghost(x,z)− pghost) (14)
A good light-sheet generates high contrast in the ideal image (sideal is large) and a low contrastin the ghost image (sghost is small). By inspecting Fig. 5, one can recognize two things: illumi-nation in the case of the 2p-Bessel beam results in the highest value Qart = 0.66 and secondly,most sphere images, especially those indicated by white arrows (i and ii), are reproduced at bestby the 2p-Bessel beam image.
#187031 - $15.00 USD Received 18 Mar 2013; revised 23 Apr 2013; accepted 23 Apr 2013; published 31 May 2013(C) 2013 OSA 3 June 2013 | Vol. 21, No. 11 | DOI:10.1364/OE.21.013824 | OPTICS EXPRESS 13832

Bessel, 1p: Qart=0.62
Gauss, 1p: Qart=0.56
Ideal Image (dyLS=0.2µm)
Bessel, 2p: Qart=0.66
Gauss, 2p: Qart=0.51
z x
z x
z x
z x
z x
z y
z y
5µm
z y
z y
z y
a
c d
b
e
i
ii
i
ii
i
ii
i
ii
i
ii
0.12
0.10
0.08
0.06
0.04
0.02
0.00
0.14
40 30 20 10 0
Bessel beam 1p 2p
Gaussian beam 1p 2p
z (µm)
ŝ id
eal(
z)
0.14
0.12
0.10
0.08
0.06
0.04
0.02
0.00
z (µm)
Bessel beam 1p 2p
Gaussian beam 1p 2p
40 30 20 10 0
ŝ gh
ost
(z)
f g
Fig. 5. Simulated images of beads embedded in a fluorescing gel illuminated with fourdifferent beams. All beams propagate in z-direction (from left to the right). Each imagep(x,y0,z) is shown above a cross-section p(x0,y,z) along the detection axis. The positionsx0 and y0 are indicated by dashed lines. a) 1p- Gaussian beam. b) 2p- Gaussian beam. c) 1p-Bessel beam. d) 2p- Bessel beam. e) 200nm thin ideal light sheet without scattering. TheLUT of the images is auto-scaled so that they express the relation between the amplitudeof the artifacts and the images of the spheres. Note that no information on the absoluteimage contrast can be drawn from these images. f, g) the lateral standard-deviation of theideal and the ghost image for all four imaging modes, according to Eq. (14) derived in [2].Qart gives the ratio of the total lateral standard-deviations of the ideal and the ghost imagesaccording to Eq. (14).
6. Resolution and contrast in a scattering sample
To assess resolution and image contrast inside of a scattering medium we image a volumecontaining fluorescing polystyrene spheres (diameter 0.75µm). The spheres were embedded innonfluorescent gel and imaged for linear and nonlinear fluorescence excitation by Bessel beamsat NAill ≈ 0.3. An image projection ∑y p(x,z) along the detection y-axis is shown in Figs. 6(a,d)together with a projection ∑x p(y,z) along the beam-scanning x-axis in Figs. 6(b,e). It can beclearly seen that sectioning and axial resolution is greatly enhanced over a distance of morethan 300µm by nonlinear fluorescence excitation over linear excitation by a Bessel beam. Theimages of the spheres are significantly smaller along the detection axis without any remarkabledegradation along the propagation direction (Figs 6(b,e)). The two image magnifications shownin Figs 6c, f reveal the shape and the extent of the sphere images, which come close to theexpected shapes of the detection point- spread-function hdet(r). This confirms that beam self-reconstruction works well in large scattering media both for single-photon and two-photon
tmiller
13833

z x
d
20µm
z y
e
b z
y
a z
x
f
c
Two-photon fluorescence excitation @ 800nm
Single-photon fluorescence excitation @ 488nm
x z
y
Fig. 6. Measured images of fluorescing spheres for linear and two-photon Bessel beamexcitation. Measured images of fluorescing polystyrene spheres (d = 0.75µm) embed-ded in a gel illuminated with two different Bessel beams, which propagate from left toright. The image projection ∑y p(x,z) along the detection axis y is shown above the pro-jection ∑x p(y,z) along x. a) single photon fluorescence excitation and b) two-photon fluo-rescence excitation. Magnification for single-photon excitation and two-photon excitationtaken from the area marked by a dashed rectangle in b) and e) are shown in c) and f),respectively. The total size of the image to volume is 75µmx40µmx325µm.
excitation.The signal-to-background ratio pS/pBG(z) as well as the axial resolution dy1/e(z) are an-
alyzed in more detail using profiles through images of ≈ 1200 spheres. We fitted a Gaus-sian function to each profile p(y) extracted at the (x,z)-position of a sphere as in [6]. Figure7(a) shows that the signal-to-background ratio pS/pBG(z) is significantly higher than in thecase of two-photon excitation revealing only a small drop-off for high propagation distancesz > 250µm. By analyzing the axial 1/e-widths of the bead images, dy1/e, we find an averagewidth of
⟨dy1/e
⟩≈ 2µm for the single photon illumination, whereas for TPE the average widths⟨
dy1/e⟩≈ 1µm are by a factor of two smaller. Note that over a propagation distance of more
than 300µm hardly any drop-off in resolution is visible.
7. Light-sheet imaging of tumor multicellular spheroids using two-photon fluorescenceexcitation
The so far discussed image quality parameters such as resolution, contrast, scattering artifacts,or light-sheet penetration depth have been investigated theoretically or by computer simula-tions and have been confirmed by experiments using bead clusters. However, although theirideal images remain unknown, high-quality imaging of large, scattering biological specimenis the primary goal in fluorescence microscopy. Clusters of cancerous cells (so-called tumormulticellular spheroids) represent an optimal biological test object because of their compact,spherical shapes and sizes of some 100 microns in diameter. The average scattering coefficient
#187031 - $15.00 USD Received 18 Mar 2013; revised 23 Apr 2013; accepted 23 Apr 2013; published 31 May 2013(C) 2013 OSA 3 June 2013 | Vol. 21, No. 11 | DOI:10.1364/OE.21.013824 | OPTICS EXPRESS 13834

a b
Sign
al-T
o-B
ack
gro
un
d
Axi
al R
eso
luti
on
Linear fluorescence excitation 2-photon fluorescence excitation
better better
Fig. 7. Signal-to-background analysis and axial widths of bead images. (a) signal tobackground ratios pS/pBG(z) and (b) axial bead image widths dy1/e(z) are shown as afunction of propagation distance z for 1200 beads (diameter d = 0.75µm). Results fromthe linear excitation are shown in blue (+) and for the two-photon excitation case in red (x).
of the spheroids is such that reasonable imaging from only one direction is possible, but on theother hand beam spreading is well visible and the self-reconstruction capability of Bessel beamsare of great advantage. A deeper understanding of the mechanisms of spheroid growth will re-quire investigating the main cellular components, such as actin filaments, that contribute tocell shape and motility. Here, we used tumor multicellular actin-labeled spheroids stained withAlexa-488 coupled to Phalloidin. We cultivated wild-type mouse colon carcinoma CT26 cells(American Tissue Culture Collection, ATCC CRL-2638). The spheroids were prepared by en-capsulating and growing cells in spherical nutrient-permeable hydrogel shells up to a spheroidsize of about 250µm in diameter. The cell-containing capsules were formed by a home-madeco-extrusion device. The hydrogel is made of sodium alginate (FMC, Protanal LF200S) whichis a biocompatible polysaccharide. Spheroids were then embedded in agarose gel cylinders andthen illuminated with two different scanning Bessel beams at wavelengths of λ1p = 488nm andλ2p = 920nm.
Figure 8 shows images p(x,y0,z) of the same layer of a tumor multicellular spheroid illumi-nated with three different illumination beams. The images were acquired in a plane sy = 120µminside the spheroid as indicated by the inset of Fig. 8(a). Illumination with Bessel beams pro-vides more signal in the back part of the spheroids. This finding is confirmed quantitatively bythe integrated image intensity line scans p(z)=∑i p(xi,y0,z)dx shown in Fig. 8(d). The penetra-tion depths of the Bessel beams of dBessel,1p ≈ 338µm and dBessel,2p ≈ 562µm (exponential fitsp ∝ exp{−z/d} in Fig. 8(d)) are enhanced by a factor of 2.2 and 3.7 relative to the penetrationdepth dGauss,1p ≈ 152µm of the Gaussian beam. The increase in penetration depth for Besselbeams by a factor of 1.7 is close to the theoretical prediction for predominantly Mie-Scatteringsamples made in the previous section (Eq. (12)).
8. Increased image contrast by confocal line detection
In addition, the contrast is best for the two-photon Bessel beam, i.e. the details provided bysingle cells in the back part of the spheroid, are best visible with two-photon excitation. Amore detailed contrast analysis is possible by investigating the ratio of high-frequency andlow-frequency image information. Corresponding to the method of Truong [14], the imagesp(x,z) are Fourier transformed to p(kx,kz) = FT [p(x,z)] and separated into images with high
spatial frequencies (HSF, where kr =√
k2x + k2
y ≥ kF ) and low spatial frequencies (LSF, where
kr =√
k2x + k2
y ≤ kF ) defined by the corner frequency kF = 1/2µm. The ratio of the average
#187031 - $15.00 USD Received 18 Mar 2013; revised 23 Apr 2013; accepted 23 Apr 2013; published 31 May 2013(C) 2013 OSA 3 June 2013 | Vol. 21, No. 11 | DOI:10.1364/OE.21.013824 | OPTICS EXPRESS 13835

1.0
0.8
0.6
0.4
0.2
0.0
z (µm) p
x(z)
150 100 50 200 250
Gaussian beam (1p) dGauss, 1p=152µm Bessel beam (1p) dBessel, 1p=338µm Bessel beam (2p) dBessel, 2p=562µm
a b
c d
Gaussian Beam (1p)
Bessel beam (2p)
Bessel beam (1p)
d=230µm
z y
y0=100µm 40µm
z x
z x
z x
Averaged on-axis intensity for 400 positions
Fig. 8. Images of a tumor multicellular spheroid for scanned illumination beams. a-c) show slices p(x,y0,z) from the same tumor multicellular spheroid with a diameter of230 µm. The insets show magnified parts at the back side of the spheroid that are markedby white boxes. The images were acquired y0 = 100µm inside the spheroid. All beamswhich are a) 1p- Gaussian beam, b) 1p- Bessel beam and c) 2p- Bessel beam have the samedepth of field and propagate from left or right. d) shows the intensity decay p(z) alongthe propagation z-direction for single illumination beams, acquired by multiplication of theimages of the static beam at 400 positions with a Gaussian mask (1/e-width of 750nm) andintegration along x.
high-pass and low-pass filtered intensities∣∣p(kx,ky)
∣∣ provides a quality parameter for imagecontrast Qcon , which is defined by
Qcon =HSFLSF
=
∫kr≥kF
|p(kx,kz)|dkxdkz∫∫kr<kF
|p(kx,kz)|dkxdkz(15)
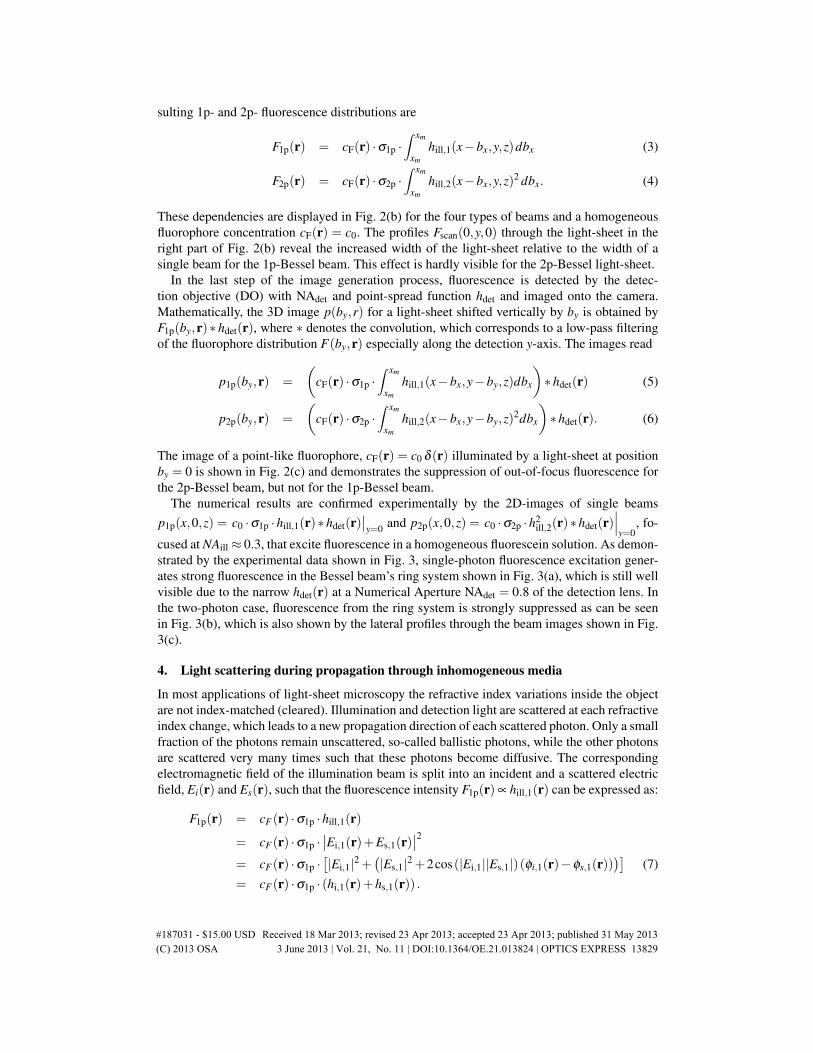
This expression represents an alternative signal-to-background ratio and effectively describesthe usable in-focus intensity signals HSF relative to the image out-of-focus intensity LSF. Weinvestigated the decrease in contrast Qcon(yi) for different image planes p(x,yi,z) along thedetection direction y, all generated with Bessel beams and two-photon fluorescence excitation.Furthermore we compared the conventional widefield detection mode, where a Bessel beam isscanned laterally during the illumination time of the CCD camera (scan-mode), with a confocal-line detection mode (CL-mode) as described in [6]. The selected image planes p(x,yi,z) at twodifferent heights (yi = 120µm and yi = 50µm) are shown in Fig. 9(a-d) for both the scan mode(left) and the CL-mode (right). The CL-mode further increases the signal-to-background ratioQcon(yi) as displayed in Fig. 9(e). It also demonstrates that the contrast Qcon(yi) depends onlyweakly on the height yi of the image plane inside the spheroid. Figure 9(e) further exhibits thatthe contrast Qcon(yi) is significantly better in images illuminated by two-photon Bessel beamsrelative to single-photon Bessel beams.
tmiller
13836
a
50µm
d=230µm z
y
sy
Scanned, 2p Confocal-line Detection, 2p
Cen
ter:
sy=
-5µ
m
Bo
tto
m:
s y=7
5µ
m
c d
b
e
2.0
1.5
1.0
0.5
0.0
80 60 40 20 0 y (µm)
1p 2p
100
Signal-To-Background
HSF
/LSF
pHSF(x,y0,z)
pLSF(x, y0,z)
f
Scanned Confocal-Line
z x
z x
z x
z x
Fig. 9. 2p-Images of a tumor multicellular spheroid with and without confocal linedetection. Image slices p(x,y0,z) from the same spheroid illuminated by a Bessel beamand two-photon fluorescence excitation. Image planes were required at y0 = 120µm (toprow) and y0 = 40µm (bottom row) inside the spheroid. Fluorescence images were acquiredby a scanned illumination beam (a,c) and by confocal line-detection (b,d). e) The signal-to-background Qcon(yi) = HSF(yi)/LSF(yi) generated from four different illumination anddetection schemes for various image planes in detection direction yi. Examples for thehigh- and low-pass filtered images, pHSF(x,y0,z) and pLSF(x,y0,z) that used to generatethe contrast parameter Qcon = HSF/LSF are shown in (f).
9. Summary and conclusion
We have successfully demonstrated how the image quality in light-sheet based microscopycan be significantly increased by using scanned Bessel beams and two-photon fluorescenceexcitation (TPE). In several hundred microns large clusters of spheres and of cells we couldvalidate the self-reconstruction ability and increased penetration depth of Bessel beams for bothvisible and NIR-wavelengths. While the ring system of the Bessel beam is maintained on theexcitation side, fluorescence from the ring system is strongly suppressed due to the quadraticdependence of the illumination intensity.
tmiller
13837
Although TPE by Bessel beams in a light-sheet microscope was used to generate high-qualityimages of small samples with sizes < 50µm [4], and in large but modestly scattering C.eleganssamples [5], the benefits in large and strongly scattering media were not exploited so far. More-over, Truong et al. [14] achieved best results for imaging large drosophila embryos, when usinga scanned Gaussian beam and two-photon excitation, but did not investigate Bessel beams.Olarte et. al. [5] presented an interesting technical approach to a setup that allows linear andtwo-photon excitation (TPE) by both Gaussian and Bessel beams, but they did not investigatethe performance differences for beams with equal depth of field. The depth of field of the illu-mination beam is the determining parameter for efficient use in a light-sheet microscope.
In particular, we estimated and showed that the penetration depth and axial fluorescencedecay of the Bessel beam at λ = 800nm is superior to that of a Bessel beam at 488nm. Whereaslinear excitation by Bessel beams shows a 2-fold increased penetration depth, TPE by Besselbeams reveals a 3-4 fold increased penetration depth relative to a comparable Gaussian beam intumor multicellular spheroids. TPE by Bessel beams increases the signal-to-background ratioby 30% - 90% relative to the linear case for equal depths of field. These proof-of-principleresults represent rough estimates of the performance of linear and two-photon Bessel beamsand will vary for different cell clusters or specimen.
In a cluster of d = 0.75µm latex spheres the signal-to-background ratio was even increasedby a factor of 5-10 and the axial resolution (detection direction) was nearly doubled relative inthe TPE relative to the linear case for Bessel beams, again with equal depth of field. Most ex-perimental results were confirmed by results from computer simulations using the beam prop-agation method (BPM), which provide a better understanding of the differences between thehypothetical ideal image and the real image containing artifacts due to scattering and interfer-ence.
So far no experiments have been performed to explicitly compare the fluorophore bleach-ing in biological specimen when using linear or two-photon excitation by Bessel beams. Bynormalizing on the same intensity signal, it has been shown that about 6 times more energyis deposited in to the sample by Bessel beam illumination relative to Gaussian beam illumina-tion [6]. However, Bessel beams provide a higher axial resolution and less background whenusing confocal-line detection. From a theoretical view-point, excitation and destruction of flu-orophores in the Bessel beam’s ring system is less probable due to the reduced intensity inthe ring system. Due to the reduced photon energy, it is even more unlikely for two-photonexcitation with NIR-light. However, over-all bleaching strongly depends on the used labeling,laser-wavelengths and pulses as well as illumination patterns and needs to be investigated sepa-rately for each case. Imaging of multi-cellular spheroids, though, seems to benefit strongly fromlight-sheet microscopy using TPE Bessel beams and may open new doors for the investigationof their multi-cellular dynamics and mechanics.
10. Append: Depth of field of Bessel beams for single- and two-photon excitation
Here we briefly discuss the requirements to adjust a 1p- and 2p- Bessel beams such that theyhave the same depth of field and the same width of the central main lobe. Adjustment is pos-sible by tuning the focusing angle α by the NA = nsin(α) of the illumination lens and by theparameter ε for thickness of the ring spectrum in the BFP of the illumination lens. For homo-geneous (annular or circular) illumination of the back-focal plane, the axial profile at the objectfor linear fluorescence excitation is
F1p(z) = cF ·σ1p ·hill,1(z)
= cF ·σ1p · I0,1 · sinc(2π · z/∆z1p)2. (16)
#187031 - $15.00 USD Received 18 Mar 2013; revised 23 Apr 2013; accepted 23 Apr 2013; published 31 May 2013(C) 2013 OSA 3 June 2013 | Vol. 21, No. 11 | DOI:10.1364/OE.21.013824 | OPTICS EXPRESS 13838

The corresponding two-photon fluorescence excitation profile is
F2p(z) = cF ·σ2p ·hill,2(z)2
= cF ·σ2p · I20,2 · sinc(2π · z/∆z2p)
4. (17)
The full-width at half of the maximum intensity I0 (FWHM) in axial direction can be found bysetting: F1p(∆z1p) = F1p(0)/2 and F2p(∆z2p) = F2p(0)/2. It follows that
∆z1p =0.88 ·λ1(√
n2− ε1NA21−√
n2−NA21
) ≈ 1.76nλ1
NA21(1− ε1)
(18)
and
∆z2p =0.64 ·λ2(√
n2− ε2NA22−√
n2−NA22
) ≈ 1.28nλ2
NA22(1− ε2)
. (19)
For the approximation the expansion for small values of ε can be used, since ε < 1 by definition.From eqns (18) and (19) above and taking into account that different wavelengths are used toexcite the same dye by linear and two-photon processes, the ratio of the depth of field forlinear and nonlinear fluorescence excitation is ∆z1p/∆z2p = 1.39 ·λ2/λ1. To obtain 1p- and 2p-fluorescence excitation profiles F(z) with equal depth of field the NA and/or the ring parameterε can be adapted. An equal depth of field ∆z1p = ∆z2p requires adaptation of the ring thicknessparameter according to
ε2 = 1+0.73 · (ε1−1) · λ2
λ1
NA21
NA22≈−0.45+1.45ε1 (20)
The latter approximation is valid for a constant numerical aperture NA1 = NA2 and when λ2 =2λ1.
Acknowledgments
We thank Dr. Roland Nitschke for help with the Coherent Chameleon laser and Cristian Gohn-Kreuz for carefully reading the manuscript and helpful discussions. This work was financed bythe Baden-Wurttemberg Stiftung.
#187031 - $15.00 USD Received 18 Mar 2013; revised 23 Apr 2013; accepted 23 Apr 2013; published 31 May 2013(C) 2013 OSA 3 June 2013 | Vol. 21, No. 11 | DOI:10.1364/OE.21.013824 | OPTICS EXPRESS 13839


![Light-sheet microscopy in thick media using scanned Bessel ......light in thick media of up to 50% [2,3]. However the advantage of beam self-reconstruction in scattering media is at](https://static.fdocuments.net/doc/165x107/60f9215868f3c210dd654374/light-sheet-microscopy-in-thick-media-using-scanned-bessel-light-in-thick.jpg)