Light limitation of summer primary production in the coastal Gulf … · MARINE ECOLOGY PROGRESS...
13
MARINE ECOLOGY PROGRESS SERIES Mar Ecol Prog Ser Vol. 402: 45–57, 2010 doi: 10.3354/meps08456 Published March 8 INTRODUCTION The northern coastal Gulf of Alaska (CGOA) is a pro- ductive ecosystem supporting high abundances of fish, shellfish, seabirds and marine mammals. Annual yields of numerous fish and shellfish stocks are linked with variations in climate conditions, including the Pacific Decadal Oscillation (PDO) in the North Pacific basin (Beamish & Bouillon 1993, Hollowed et al. 2001). The US Global Ocean Ecosystem Dynamics (GLOBEC) Northeast Pacific program was designed to explore these linkages, with a focus on the continental shelf as an area where Pacific salmon Oncorhynchus spp. experience a critical period for survival and growth (Cross et al. 2008 and references therein). Variations in primary production, leading to qualitative and quanti- tative changes in shelf food webs, are clearly one mechanism by which climate fluctuations could trans- late into variable abundances of higher trophic-level organisms such as salmon. For example, the ‘optimal window of stability’ hypothesis (Gargett 1997) pro- posed that primary production in the CGOA is primar- ily limited by availability of light (as opposed to nutri- ents); therefore, reductions in wind-mixing energy should generally lead to higher production through shoaling of the mixed layer and increased light expo- sure of phytoplankton therein. To test hypotheses such as these, we need data on the magnitude of primary production in the CGOA and its relationship with environmental variation. At pre- © Inter-Research 2010 · www.int-res.com *Email: [email protected] Light limitation of summer primary production in the coastal Gulf of Alaska: physiological and environmental causes Suzanne L. Strom*, Erin L. Macri, Kerri A. Fredrickson Shannon Point Marine Center, Western Washington University, 1900 Shannon Point Road, Anacortes, Washington 98221, USA ABSTRACT: We examined photosynthesis–irradiance (P-E) relationships for coastal Gulf of Alaska phytoplankton communities during summer 2003. Phytoplankton were adapted to high light levels, with elevated light saturation parameters (average E k 390 μmol photons m –2 s –1 ), low photosynthetic efficiencies (α), and an absence of photoinhibition. Maximum photosynthesis rates (P max ) ranged from 0.9 to 12.9 μg C μg chl a –1 h –1 and were consistently higher in the nearshore Alaska Coastal Current than elsewhere in the region. Differences between photosynthetic responses of phytoplankton com- munities from near surface versus the subsurface chlorophyll maximum layer were minor. Small phytoplankton (< 20 μm) had consistently higher P max and α-values than did large phytoplankton (> 20 μm), a difference associated with the higher C:chlorophyll ratios of the small phytoplankton. Acclimation to high light probably arose because of the shallow pycnocline and the highly variable light environment, the latter generated by internal waves and variable cloud cover. Simulations showed that estimated water column productivity, which ranged from 359 to 909 mg C m –2 d –1 , was sensitive to modeled changes in cloud cover and pycnocline depth, through both direct effects on light availability and indirect effects on phytoplankton physiology. Climate change could therefore affect summer primary production rates in the coastal Gulf of Alaska through changes in stratifica- tion, wind mixing energy, and cloud cover. However, summer phytoplankton growth in this region is also limited by nutrient availability and microzooplankton grazing, indicating a potentially complex relationship between phytoplankton production and environmental variability. KEY WORDS: Photosynthesis · Irradiance · Phytoplankton · Subsurface chlorophyll maximum Resale or republication not permitted without written consent of the publisher
Transcript of Light limitation of summer primary production in the coastal Gulf … · MARINE ECOLOGY PROGRESS...
MARINE ECOLOGY PROGRESS SERIESMar Ecol Prog Ser
Vol. 402: 45–57, 2010doi: 10.3354/meps08456
Published March 8
INTRODUCTION
The northern coastal Gulf of Alaska (CGOA) is a pro-ductive ecosystem supporting high abundances of fish,shellfish, seabirds and marine mammals. Annualyields of numerous fish and shellfish stocks are linkedwith variations in climate conditions, including thePacific Decadal Oscillation (PDO) in the North Pacificbasin (Beamish & Bouillon 1993, Hollowed et al. 2001).The US Global Ocean Ecosystem Dynamics (GLOBEC)Northeast Pacific program was designed to explorethese linkages, with a focus on the continental shelf asan area where Pacific salmon Oncorhynchus spp.experience a critical period for survival and growth(Cross et al. 2008 and references therein). Variations in
primary production, leading to qualitative and quanti-tative changes in shelf food webs, are clearly onemechanism by which climate fluctuations could trans-late into variable abundances of higher trophic-levelorganisms such as salmon. For example, the ‘optimalwindow of stability’ hypothesis (Gargett 1997) pro-posed that primary production in the CGOA is primar-ily limited by availability of light (as opposed to nutri-ents); therefore, reductions in wind-mixing energyshould generally lead to higher production throughshoaling of the mixed layer and increased light expo-sure of phytoplankton therein.
To test hypotheses such as these, we need data onthe magnitude of primary production in the CGOA andits relationship with environmental variation. At pre-
© Inter-Research 2010 · www.int-res.com*Email: [email protected]
Light limitation of summer primary production inthe coastal Gulf of Alaska: physiological and
environmental causes
Suzanne L. Strom*, Erin L. Macri, Kerri A. Fredrickson
Shannon Point Marine Center, Western Washington University, 1900 Shannon Point Road, Anacortes, Washington 98221, USA
ABSTRACT: We examined photosynthesis–irradiance (P-E) relationships for coastal Gulf of Alaskaphytoplankton communities during summer 2003. Phytoplankton were adapted to high light levels,with elevated light saturation parameters (average Ek 390 µmol photons m–2 s–1), low photosyntheticefficiencies (α), and an absence of photoinhibition. Maximum photosynthesis rates (Pmax) ranged from0.9 to 12.9 µg C µg chl a–1 h–1 and were consistently higher in the nearshore Alaska Coastal Currentthan elsewhere in the region. Differences between photosynthetic responses of phytoplankton com-munities from near surface versus the subsurface chlorophyll maximum layer were minor. Smallphytoplankton (<20 µm) had consistently higher Pmax and α-values than did large phytoplankton(>20 µm), a difference associated with the higher C:chlorophyll ratios of the small phytoplankton.Acclimation to high light probably arose because of the shallow pycnocline and the highly variablelight environment, the latter generated by internal waves and variable cloud cover. Simulationsshowed that estimated water column productivity, which ranged from 359 to 909 mg C m–2 d–1, wassensitive to modeled changes in cloud cover and pycnocline depth, through both direct effects onlight availability and indirect effects on phytoplankton physiology. Climate change could thereforeaffect summer primary production rates in the coastal Gulf of Alaska through changes in stratifica-tion, wind mixing energy, and cloud cover. However, summer phytoplankton growth in this region isalso limited by nutrient availability and microzooplankton grazing, indicating a potentially complexrelationship between phytoplankton production and environmental variability.
KEY WORDS: Photosynthesis · Irradiance · Phytoplankton · Subsurface chlorophyll maximum
Resale or republication not permitted without written consent of the publisher
Mar Ecol Prog Ser 402: 45–57, 2010
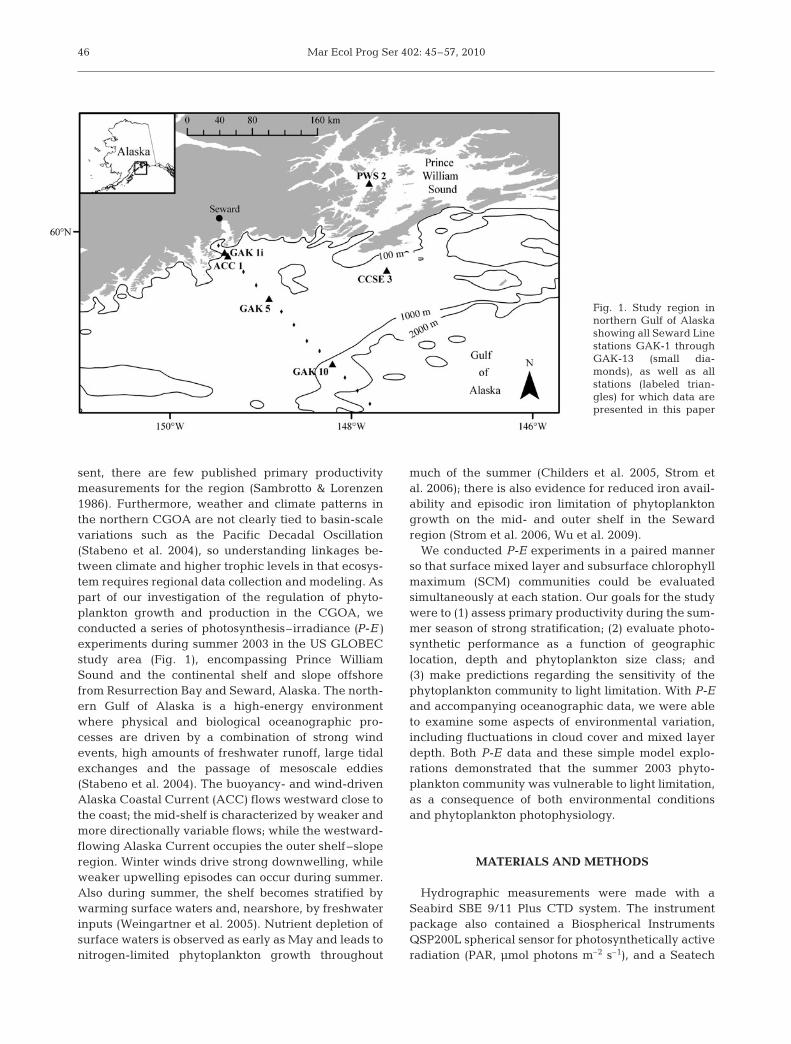
sent, there are few published primary productivitymeasurements for the region (Sambrotto & Lorenzen1986). Furthermore, weather and climate patterns inthe northern CGOA are not clearly tied to basin-scalevariations such as the Pacific Decadal Oscillation(Stabeno et al. 2004), so understanding linkages be-tween climate and higher trophic levels in that ecosys-tem requires regional data collection and modeling. Aspart of our investigation of the regulation of phyto-plankton growth and production in the CGOA, weconducted a series of photosynthesis–irradiance (P-E)experiments during summer 2003 in the US GLOBECstudy area (Fig. 1), encompassing Prince WilliamSound and the continental shelf and slope offshorefrom Resurrection Bay and Seward, Alaska. The north-ern Gulf of Alaska is a high-energy environmentwhere physical and biological oceanographic pro-cesses are driven by a combination of strong windevents, high amounts of freshwater runoff, large tidalexchanges and the passage of mesoscale eddies(Stabeno et al. 2004). The buoyancy- and wind-drivenAlaska Coastal Current (ACC) flows westward close tothe coast; the mid-shelf is characterized by weaker andmore directionally variable flows; while the westward-flowing Alaska Current occupies the outer shelf–sloperegion. Winter winds drive strong downwelling, whileweaker upwelling episodes can occur during summer.Also during summer, the shelf becomes stratified bywarming surface waters and, nearshore, by freshwaterinputs (Weingartner et al. 2005). Nutrient depletion ofsurface waters is observed as early as May and leads tonitrogen-limited phytoplankton growth throughout
much of the summer (Childers et al. 2005, Strom etal. 2006); there is also evidence for reduced iron avail-ability and episodic iron limitation of phytoplanktongrowth on the mid- and outer shelf in the Sewardregion (Strom et al. 2006, Wu et al. 2009).
We conducted P-E experiments in a paired mannerso that surface mixed layer and subsurface chlorophyllmaximum (SCM) communities could be evaluatedsimultaneously at each station. Our goals for the studywere to (1) assess primary productivity during the sum-mer season of strong stratification; (2) evaluate photo-synthetic performance as a function of geographiclocation, depth and phytoplankton size class; and(3) make predictions regarding the sensitivity of thephytoplankton community to light limitation. With P-Eand accompanying oceanographic data, we were ableto examine some aspects of environmental variation,including fluctuations in cloud cover and mixed layerdepth. Both P-E data and these simple model explo-rations demonstrated that the summer 2003 phyto-plankton community was vulnerable to light limitation,as a consequence of both environmental conditionsand phytoplankton photophysiology.
MATERIALS AND METHODS
Hydrographic measurements were made with aSeabird SBE 9/11 Plus CTD system. The instrumentpackage also contained a Biospherical InstrumentsQSP200L spherical sensor for photosynthetically activeradiation (PAR, µmol photons m–2 s–1), and a Seatech
46
Fig. 1. Study region innorthern Gulf of Alaskashowing all Seward Linestations GAK-1 throughGAK-13 (small dia-monds), as well as allstations (labeled trian-gles) for which data arepresented in this paper

Strom et al.: Light regulation of coastal photosynthesis
FL0500 submersible fluorometer for detection of in situchlorophyll a (chl a) fluorescence. Incident irradiance(E0) was measured continuously by a Li-Cor 2π PARsensor mounted on the ship’s superstructure.
Water samples for P-E experiments were collectedusing 5 l Niskin bottles with external spring closureson the CTD rosette. In all but 2 cases, P-E relationshipswere determined for 2 depths at each station (Fig. 1),one corresponding to 50% surface irradiance (50% E0)and the other to the SCM. The former ranged from 4 to9 m and the latter from 15 to 23 m. Water from eachdepth was subsampled into eleven 300 ml polycarbon-ate bottles, each of which was inoculated with 0.04 ml(10 µCi) 14C-labeled sodium bicarbonate (MoravekBiochemicals). Average total activity was determinedby subsampling (0.1 ml) 4 haphazardly selected bottlesand adding each subsample to 4 ml Ecoscint scintilla-tion cocktail buffered with 0.4 ml 0.1 M NaOH. Bottleswere screened with neutral density filters (KodakWratten) to achieve a gradient in light intensity from100 to 2% E0; a dark bottle was also included. Bottleswere incubated for 6 h in a Plexiglas incubator cooledby flowing surface seawater. All incubations were ini-tiated between 08:30 and 10:45 h local time (note thatlocal apparent noon was at ~13:00 h). Experimentswere terminated by dividing the contents of eachbottle into 2 portions, measuring the volume of each(~150 ml), and then filtering one through a 25 mm glassfiber filter (0.7 µm nominal pore size) and the otherthrough a 25 mm polycarbonate filter with 20 µm poresize. Filters were placed in 20 ml plastic scintillationvials with 0.5 ml 0.5 N HCl and allowed to acidify in afume hood for 24 h. Scintillation cocktail (10 ml) wasthen added to each vial and disintegrations per minute(dpm) were determined using a Packard Tri-Carb1900TR liquid scintillation analyzer. Samples werecounted immediately on board the research vessel andagain at Shannon Point Marine Center after severalweeks of dark storage; results were essentially identi-cal. For each vial, dpm values were converted to pho-tosynthesis rates (µg C ml–1 h–1) after subtraction ofdark uptake, according to Parsons et al. (1984).
Samples for estimation of chl a concentration weretaken in triplicate from the same 5 l Niskin bottles usedto fill the P-E incubation bottles. Duplicate samples forfloristic analysis (see Strom et al. 2006 for methods)were taken at the same time. Each chl a sample was fil-tered through a fractionation cascade containing a20 µm pore size polycarbonate filter over a glass fiberfilter (0.7 µm nominal pore size). Samples wereextracted in 90% acetone for ~24 h at –20°C and chl aconcentration determined fluorimetrically (Turner 10-AU) using the acidification method (Welschmeyer1994). Photosynthesis rates were normalized to chl aconcentration in the appropriate size fraction to yield
biomass-specific rates (P B, µg C µg chl a–1 h–1) for fur-ther analysis.
For estimation of photosynthetic parameters, valuesof PB and the corresponding irradiance (E) were fit tothe hyperbolic tangent function of Jassby & Platt(1976):
(1)
where α is photosynthetic efficiency and Pmax is maxi-mum chlorophyll-normalized photosynthesis rate.Curve fits were done in SigmaPlot 2002 for Windows v.8.02 using the Marquardt-Levenberg algorithm. Con-vergence was defined as a tolerance of 0.0001. The sat-urating irradiance for photosynthesis (Ek) was calcu-lated from Pmax/α. Ek represents the optimal irradiancefor photosynthesis (Sakshaug et al. 1997). Curve-fittingand parameter estimation was done separately for <20and >20 µm phytoplankton. No term for photoinhibi-tion was included because we saw no evidence forphotoinhibition in the data.
Euphotic zone attenuation coefficients (k, m–1) werederived from the slope of ln-transformed subsurfacePAR profiles. Separate k values were determined forthe surface mixed layer (k surf) and the SCM layer(extending from the top of the SCM to the bottom ofthe euphotic zone; kSCM). Estimation was done itera-tively so that only euphotic zone depths (i.e. to 1% E0)were included in the calculation of k. Irradiance (Ez,µmol photons m–2 h–1) at each meter depth (z) and foreach hour of the day was predicted from k values andincident irradiance (E0) according to for depths above the SCM, and ,where ESCM is irradiance at the top of the SCM layer,for depths below the top of the SCM.
Chlorophyll at each meter depth was estimated fromalgorithms comparing extracted chl a concentrations(total) with in situ fluorescence. These algorithms weredeveloped from noon CTD casts done on the same day(i.e. within several hours) and at the same station ascasts for P-E experiments. Samples for extracted chl awere taken at 10 depths within and just below theeuphotic zone and processed as described for P-E chl asamples. Linear relationships between total extractedchl a and in situ fluorescence for each cast provided agood fit to the data (r2 ≥ 0.87). These relationships,along with the average fraction of total chl a in the>20 µm size class, were used to predict chl> 20 andchl< 20 at each meter depth from 1 m averaged in situfluorescence profiles collected during morning P-Ecasts. No predictive relationship between extractedchl a and in situ fluorescence could be developed forstation GAK-10. Here we saw no evidence for a SCMand used a simple extrapolation of extracted chl a val-ues to predict chl> 20 and chl< 20 at each meter depth.
E Ezk z= Δ
SCMe SCM–
E Ezk z= Δ
0e surf–
PE
PB = ⎡
⎣⎢⎤⎦⎥
tanhmax
α
47
Mar Ecol Prog Ser 402: 45–57, 2010
Samples for nitrate and silicic acid analyses were takenfrom the same noon casts used to develop fluorescenceversus extracted chl a relationships (see Strom et al.2006 for methods).
Integrated daily water column primary productionwas estimated from the sum of P< 20 and P> 20 in eachcubic meter of the euphotic zone according to:
(2)
where chl> 20 is the concentration of chl a (mg m–3) in the>20 µm size fraction and P> 20 is the volume-normalizedprimary productivity in the >20 µm phytoplankton sizefraction (mg C m–3 h–1). Analogous calculations weredone for P< 20. To estimate daily production, measuredrates were divided by incubation time (h); hourly rateswere then scaled to each hour’s irradiance at eacheuphotic zone depth. Integrated daily primary produc-tion (PINT, mg C m–2 d–1) was then determined as thesum of hourly primary production in both chl a sizefractions over the euphotic zone. Direct estimates ofPINT were based on P-E parameters collected duringthat day at that station. In some cases we applied P-Eparameters from a nearby station in the same shelf
region to another day and location to derive indirectestimates of PINT.
RESULTS
Photosynthetic parameters
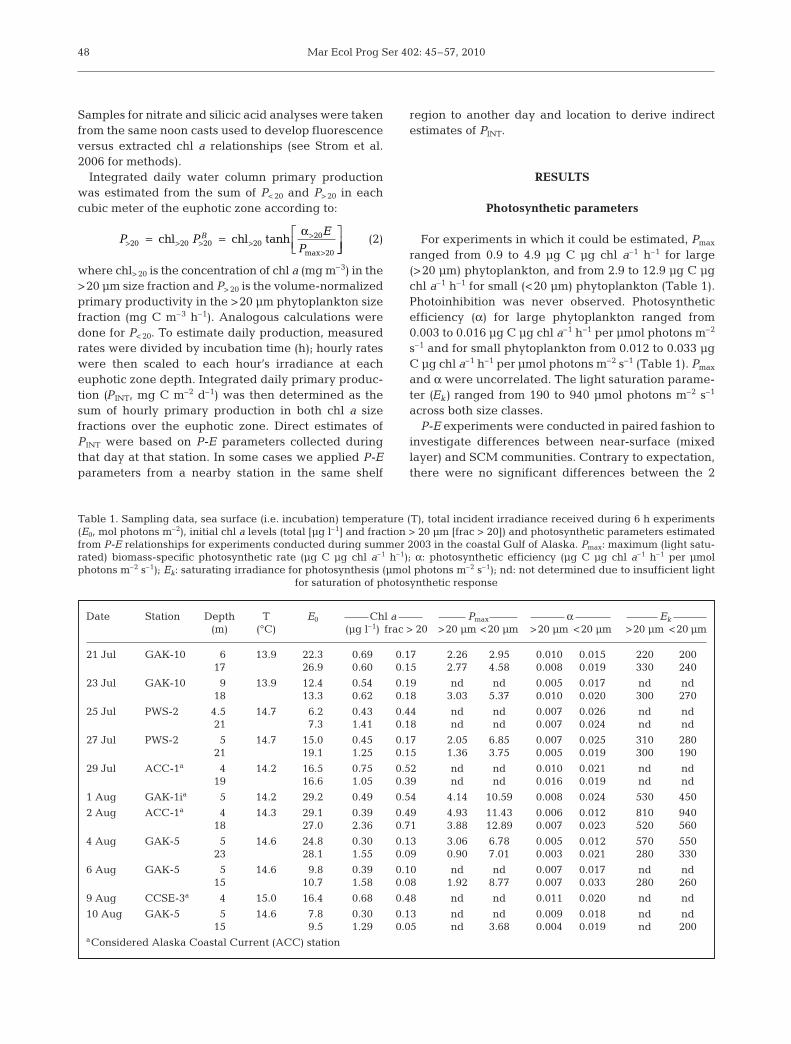
For experiments in which it could be estimated, Pmax
ranged from 0.9 to 4.9 µg C µg chl a–1 h–1 for large(>20 µm) phytoplankton, and from 2.9 to 12.9 µg C µgchl a–1 h–1 for small (<20 µm) phytoplankton (Table 1).Photoinhibition was never observed. Photosyntheticefficiency (α) for large phytoplankton ranged from0.003 to 0.016 µg C µg chl a–1 h–1 per µmol photons m–2
s–1 and for small phytoplankton from 0.012 to 0.033 µgC µg chl a–1 h–1 per µmol photons m–2 s–1 (Table 1). Pmax
and α were uncorrelated. The light saturation parame-ter (Ek) ranged from 190 to 940 µmol photons m–2 s–1
across both size classes.P-E experiments were conducted in paired fashion to
investigate differences between near-surface (mixedlayer) and SCM communities. Contrary to expectation,there were no significant differences between the 2
P P
E
PB
> > > >>
>= = ⎡
⎣⎢⎤
20 20 20 2020
20
chl chl tanhmax
α⎦⎦⎥
48
Date Station Depth T E0 Chl a Pmax α Ek
(m) (°C) (µg l–1) frac > 20 >20 µm <20 µm >20 µm <20 µm >20 µm <20 µm
21 Jul GAK-10 6 13.9 22.3 0.69 0.17 2.26 2.95 0.010 0.015 220 20017 26.9 0.60 0.15 2.77 4.58 0.008 0.019 330 240
23 Jul GAK-10 9 13.9 12.4 0.54 0.19 nd nd 0.005 0.017 nd nd18 13.3 0.62 0.18 3.03 5.37 0.010 0.020 300 270
25 Jul PWS-2 4.5 14.7 6.2 0.43 0.44 nd nd 0.007 0.026 nd nd21 7.3 1.41 0.18 nd nd 0.007 0.024 nd nd
27 Jul PWS-2 5 14.7 15.0 0.45 0.17 2.05 6.85 0.007 0.025 310 28021 19.1 1.25 0.15 1.36 3.75 0.005 0.019 300 190
29 Jul ACC-1a 4 14.2 16.5 0.75 0.52 nd nd 0.010 0.021 nd nd19 16.6 1.05 0.39 nd nd 0.016 0.019 nd nd
1 Aug GAK-1ia 5 14.2 29.2 0.49 0.54 4.14 10.59 0.008 0.024 530 450
2 Aug ACC-1a 4 14.3 29.1 0.39 0.49 4.93 11.43 0.006 0.012 810 94018 27.0 2.36 0.71 3.88 12.89 0.007 0.023 520 560
4 Aug GAK-5 5 14.6 24.8 0.30 0.13 3.06 6.78 0.005 0.012 570 55023 28.1 1.55 0.09 0.90 7.01 0.003 0.021 280 330
6 Aug GAK-5 5 14.6 9.8 0.39 0.10 nd nd 0.007 0.017 nd nd15 10.7 1.58 0.08 1.92 8.77 0.007 0.033 280 260
9 Aug CCSE-3a 4 15.0 16.4 0.68 0.48 nd nd 0.011 0.020 nd nd
10 Aug GAK-5 5 14.6 7.8 0.30 0.13 nd nd 0.009 0.018 nd nd15 9.5 1.29 0.05 nd 3.68 0.004 0.019 nd 200
aConsidered Alaska Coastal Current (ACC) station
Table 1. Sampling data, sea surface (i.e. incubation) temperature (T), total incident irradiance received during 6 h experiments(E0, mol photons m–2), initial chl a levels (total [µg l–1] and fraction > 20 µm [frac > 20]) and photosynthetic parameters estimatedfrom P-E relationships for experiments conducted during summer 2003 in the coastal Gulf of Alaska. Pmax: maximum (light satu-rated) biomass-specific photosynthetic rate (µg C µg chl a–1 h–1); α: photosynthetic efficiency (µg C µg chl a–1 h–1 per µmolphotons m–2 s–1); Ek: saturating irradiance for photosynthesis (µmol photons m–2 s–1); nd: not determined due to insufficient light
for saturation of photosynthetic response
Strom et al.: Light regulation of coastal photosynthesis
depths in either Pmax or α, for either large or smallphytoplankton (paired t-test, all p-values > 0.18).Therefore, Pmax and α data from the 2 depths werepooled for all subsequent analyses (see next para-graph). The light saturation parameter (Ek) also did notdiffer significantly between the surface and SCM(paired t-test, p = 0.18 for large phytoplankton, p = 0.10for small phytoplankton). However, when it could beestimated for both depths simultaneously, Ek waslower in the SCM than in near-surface samples inevery case except Station GAK-10, which did not havea true SCM (Table 1). Furthermore, P-E curves forSCM phytoplankton reached light saturation in mostinstances (i.e. on 13 of 18 dates and chl a size fractions),while curves for near-surface phytoplankton, incu-bated under the same light regimes, reached satura-tion less than half the time (10 of 22 dates and size frac-tions). Thus, although Pmax and α did not differsystematically between depths, there was a strong ten-dency for photosynthesis rates to saturate at a lowerirradiance in the SCM than in the near-surface com-munity.
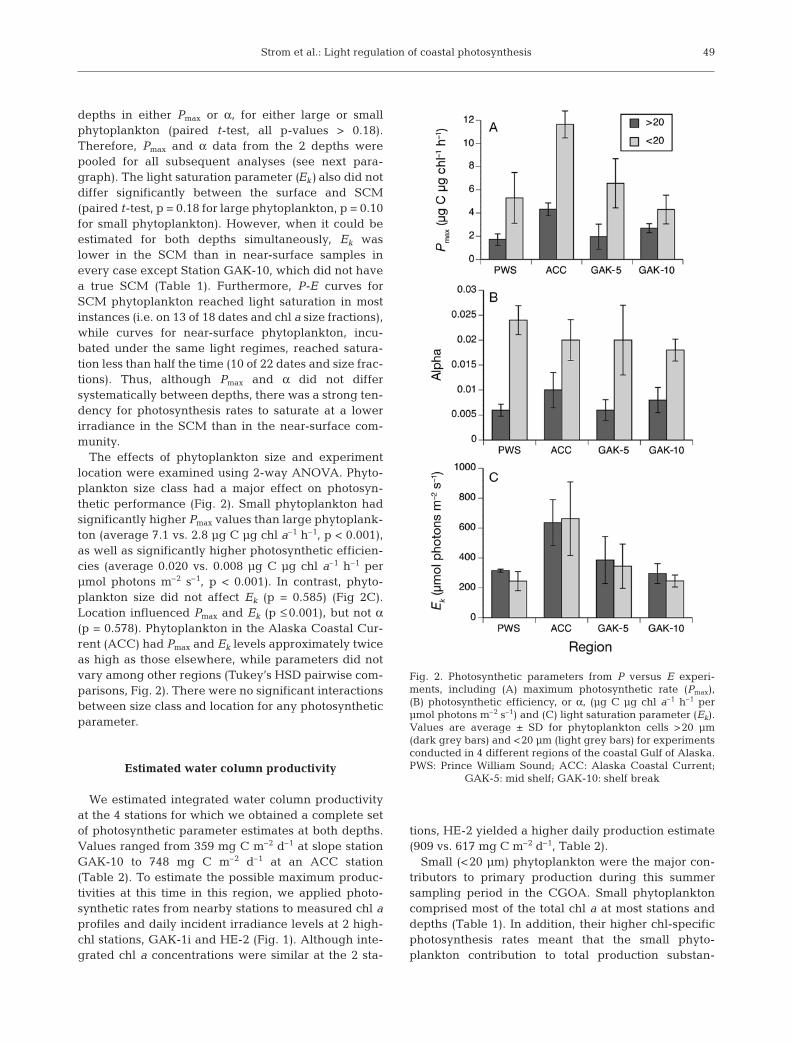
The effects of phytoplankton size and experimentlocation were examined using 2-way ANOVA. Phyto-plankton size class had a major effect on photosyn-thetic performance (Fig. 2). Small phytoplankton hadsignificantly higher Pmax values than large phytoplank-ton (average 7.1 vs. 2.8 µg C µg chl a–1 h–1, p < 0.001),as well as significantly higher photosynthetic efficien-cies (average 0.020 vs. 0.008 µg C µg chl a–1 h–1 perµmol photons m–2 s–1, p < 0.001). In contrast, phyto-plankton size did not affect Ek (p = 0.585) (Fig 2C).Location influenced Pmax and Ek (p ≤ 0.001), but not α(p = 0.578). Phytoplankton in the Alaska Coastal Cur-rent (ACC) had Pmax and Ek levels approximately twiceas high as those elsewhere, while parameters did notvary among other regions (Tukey’s HSD pairwise com-parisons, Fig. 2). There were no significant interactionsbetween size class and location for any photosyntheticparameter.
Estimated water column productivity
We estimated integrated water column productivityat the 4 stations for which we obtained a complete setof photosynthetic parameter estimates at both depths.Values ranged from 359 mg C m–2 d–1 at slope stationGAK-10 to 748 mg C m–2 d–1 at an ACC station(Table 2). To estimate the possible maximum produc-tivities at this time in this region, we applied photo-synthetic rates from nearby stations to measured chl aprofiles and daily incident irradiance levels at 2 high-chl stations, GAK-1i and HE-2 (Fig. 1). Although inte-grated chl a concentrations were similar at the 2 sta-
tions, HE-2 yielded a higher daily production estimate(909 vs. 617 mg C m–2 d–1, Table 2).
Small (<20 µm) phytoplankton were the major con-tributors to primary production during this summersampling period in the CGOA. Small phytoplanktoncomprised most of the total chl a at most stations anddepths (Table 1). In addition, their higher chl-specificphotosynthesis rates meant that the small phyto-plankton contribution to total production substan-
49
Fig. 2. Photosynthetic parameters from P versus E experi-ments, including (A) maximum photosynthetic rate (Pmax),(B) photosynthetic efficiency, or α, (µg C µg chl a–1 h–1 perµmol photons m–2 s–1) and (C) light saturation parameter (Ek).Values are average ± SD for phytoplankton cells >20 µm(dark grey bars) and <20 µm (light grey bars) for experimentsconducted in 4 different regions of the coastal Gulf of Alaska.PWS: Prince William Sound; ACC: Alaska Coastal Current;
GAK-5: mid shelf; GAK-10: shelf break

Mar Ecol Prog Ser 402: 45–57, 2010
tially exceeded their contribution to total chl a bio-mass (Table 2). Even at station HE-2, which wasdominated (77%) by large cells, small phytoplanktoncontributed nearly half of the estimated daily inte-grated production.
We assessed the contribution of the SCM to watercolumn productivity for 3 of the 4 stations with com-plete P-E data (note that station GAK-10 did notexhibit a true SCM). Although the SCM is a strikingand widespread feature of the summer shelf (Fig. 3),this feature is of variable importance to water columnproduction. At mid-shelf Station GAK-5, close to half ofthe integrated production was in the SCM (Table 3),while most of the integrated chl a was in this feature.Overall, although the SCM could account for a signifi-cant proportion of the total chl a, the surface mixedlayer was still the most important production zone,contributing more than 50% of the integrated total atall 3 stations (Table 3).
Effects of environmental variation onprimary production
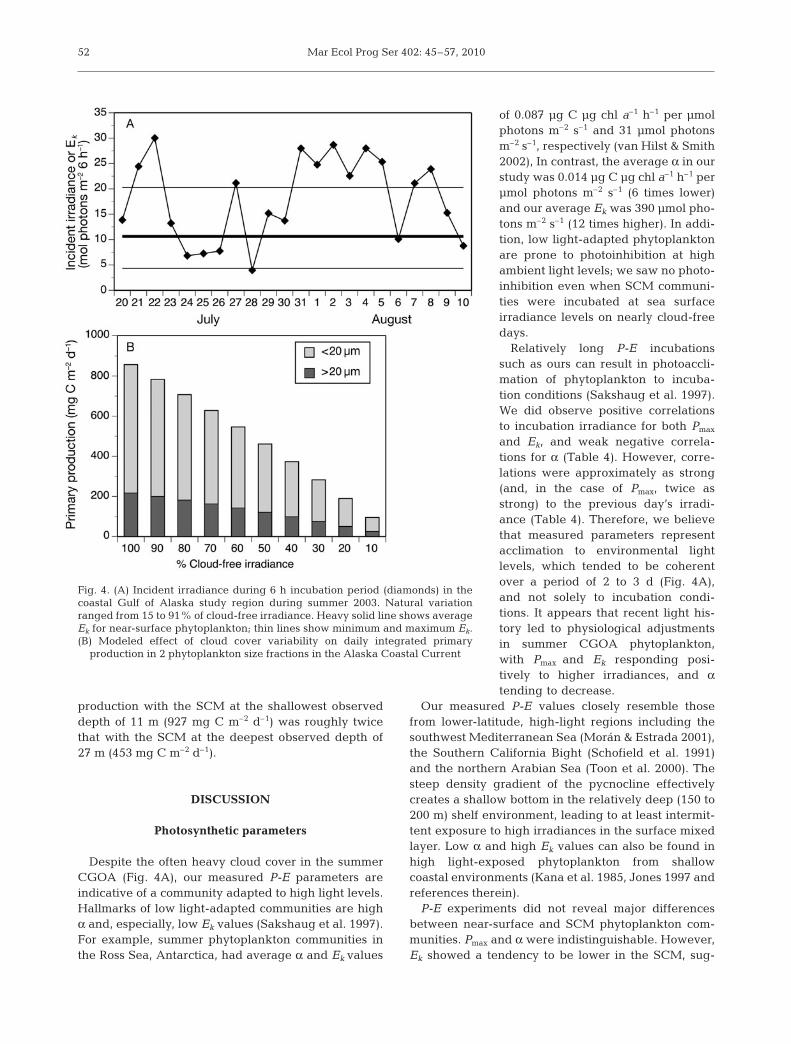
The high incidence of unsaturatedP-E relationships obtained in thisstudy (Table 1) demonstrates thatsummer irradiance was likely to belimiting to photosynthesis on numer-ous occasions in the CGOA, even insurface waters. Comparison of Ek val-ues with midday irradiance levelstaken over a 6 h period showed that,based on the study-wide average Ek of10.6 mol photons m–2 6 h–1, photosyn-thesis rates would have been belowsaturation (i.e. less than Pmax) on 6 of22 d during the cruise period, even atthe sea surface (Fig. 4A). We investi-gated this phenomenon further by
estimating integrated daily production at Station ACC-1 over the range of observed irradiance levels. Duringour cruise period (21 July to 10 August), daily incidentirradiance ranged widely, from a minimum of 8.2 to amaximum of 50.7 mol photons m–2 d–1 (15 to 91% of themaximum cloud-free irradiance of 56 mol photons m–2
d–1). Water column chl a levels and P-E parametersfrom station ACC-1 (2 August, Table 1) were used toestimate the effect of this variability on primary pro-ductivity. Integrated daily production rates were quitesensitive to observed variations in irradiance (Fig. 4B).Even modest irradiance decreases relative to thecloud-free condition caused some reduction; the cloud-iest observed day (28 July) would have yielded an inte-grated daily production <20% of that realized on acloud-free day.
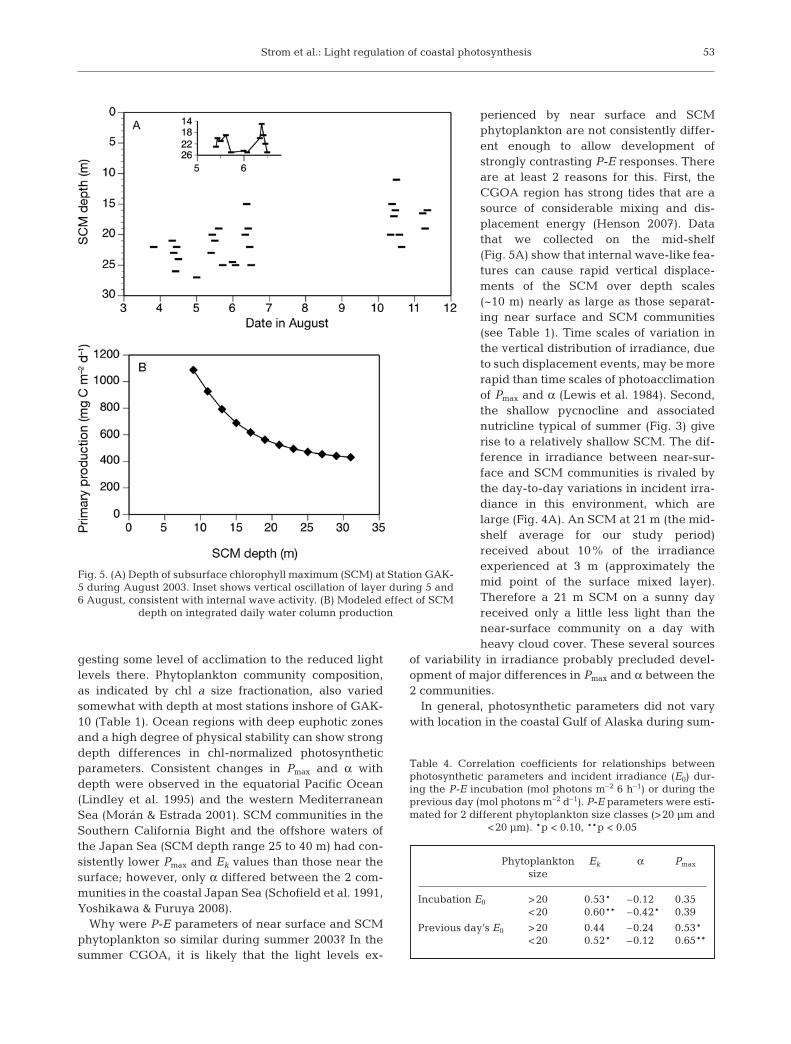
Another factor that can influence irradiance avail-ability and, hence, production is the depth of the SCM.We collected numerous in situ fluorescence profiles atmid-shelf Station GAK-5 during our cruise. These pro-files reveal that the SCM depth varied between 11 and27 m over an 8 d period in August, with an average of21 m (Fig. 5A). Observations closely spaced in time(Fig. 5A inset) show that at least some of the variabilityoccurred in wave-like oscillations, which was perhapsrelated to the passage of internal waves. Furthermore,the SCM tended to be shallower during the later partof the observation period (11 and 12 August). We sim-ulated the effect of SCM depth variation on mid-shelfprimary production by artificially relocating the ob-served GAK-5 (4 August) SCM layer so that the peakoccurred at different depths. Because of the high light-adapted nature of the phytoplankton community, inte-grated water column productivity was strongly influ-enced by SCM depth, particularly near the shallowerend of the observed range (Fig. 5B). For example, daily
50
Date Station E0 k Zeu Chl a PPInt % > 20 Int % > 20
Direct21 Jul GAK-10 37.9 0.15/0.09 41 24.8 17 359 1227 Jul PWS-2 32.8 0.14/0.09 42 26.6 21 581 72 Aug ACC-1 49.3 0.12/0.15 34 35.3 38 748 274 Aug GAK-5 50.7 0.14/0.15 32 34.5 9 524 3
Indirect1 Aug GAK-1i 43.2 0.11/0.11 41 38.6 45 617 288 Aug HE-2 37.4 0.07/0.19 24 36.2 77 909 54
Table 2. Summer 2003 water column chl a and primary production (PP) (inte-grated daily total [Int] and percent in cells > 20 µm [% > 20]) as estimated fromP-E parameters (see ‘Materials and methods’ for details). Integration was to thebase of the euphotic zone (depth of 1% surface irradiance). E0: daily incidentirradiance (mol photons m–2); k: attenuation coefficients (m–1) for the surfacemixed layer/subsurface chlorophyll maximum layer; Zeu: euphotic zone
depth (m); Int chl a (mg m–2); Int PP (mg C m–2 d–1)
Station Layer Depth PP % Chl a %Date (2003) range (m) total total
PWS-2 Surface 0–11 453 78 8.9 3327 Jul SCM 12–29 128 22 14.9 56
ACC-1 Surface 0–12 437 58 8.4 252 Aug SCM 13–24 298 40 17.0 50
GAK-5 Surface 0–13 299 57 6.1 174 Aug SCM 14–35 225 43 29.8 83
Table 3. Partitioning of daily primary production (PP, mg Cm–2 d–1) and chl a (mg chl a m–2) into surface and subsurfacechlorophyll maximum (SCM) layers at 3 stations in the coastalGulf of Alaska. Depth-integrated values for each layer areshown, as well as their percent contribution to the
integrated euphotic zone totals (% of total)

Strom et al.: Light regulation of coastal photosynthesis 51
Fig. 3. Left panels: vertical profiles of salinity, temperature, nitrate and silicic acid concentrations. Right panels: in situ chl a fluo-rescence, extracted chlorophyll concentration (<20 µm and total) and estimated daily primary production. (A,B) Station PWS-2(27 July); (C,D) Station ACC-1 (2 August); (E,F) Station GAK-5 (4 August); (G,H) Station GAK-10 (21 July). See Fig. 1 for station
locations
Mar Ecol Prog Ser 402: 45–57, 2010
production with the SCM at the shallowest observeddepth of 11 m (927 mg C m–2 d–1) was roughly twicethat with the SCM at the deepest observed depth of27 m (453 mg C m–2 d–1).
DISCUSSION
Photosynthetic parameters
Despite the often heavy cloud cover in the summerCGOA (Fig. 4A), our measured P-E parameters areindicative of a community adapted to high light levels.Hallmarks of low light-adapted communities are highα and, especially, low Ek values (Sakshaug et al. 1997).For example, summer phytoplankton communities inthe Ross Sea, Antarctica, had average α and Ek values
of 0.087 µg C µg chl a–1 h–1 per µmolphotons m–2 s–1 and 31 µmol photonsm–2 s–1, respectively (van Hilst & Smith2002), In contrast, the average α in ourstudy was 0.014 µg C µg chl a–1 h–1 perµmol photons m–2 s–1 (6 times lower)and our average Ek was 390 µmol pho-tons m–2 s–1 (12 times higher). In addi-tion, low light-adapted phytoplanktonare prone to photoinhibition at highambient light levels; we saw no photo-inhibition even when SCM communi-ties were incubated at sea surfaceirradiance levels on nearly cloud-freedays.
Relatively long P-E incubationssuch as ours can result in photoaccli-mation of phytoplankton to incuba-tion conditions (Sakshaug et al. 1997).We did observe positive correlationsto incubation irradiance for both Pmax
and Ek, and weak negative correla-tions for α (Table 4). However, corre-lations were approximately as strong(and, in the case of Pmax, twice asstrong) to the previous day’s irradi-ance (Table 4). Therefore, we believethat measured parameters representacclimation to environmental lightlevels, which tended to be coherentover a period of 2 to 3 d (Fig. 4A),and not solely to incubation condi-tions. It appears that recent light his-tory led to physiological adjustmentsin summer CGOA phytoplankton,with Pmax and Ek responding posi-tively to higher irradiances, and αtending to decrease.
Our measured P-E values closely resemble thosefrom lower-latitude, high-light regions including thesouthwest Mediterranean Sea (Morán & Estrada 2001),the Southern California Bight (Schofield et al. 1991)and the northern Arabian Sea (Toon et al. 2000). Thesteep density gradient of the pycnocline effectivelycreates a shallow bottom in the relatively deep (150 to200 m) shelf environment, leading to at least intermit-tent exposure to high irradiances in the surface mixedlayer. Low α and high Ek values can also be found inhigh light-exposed phytoplankton from shallowcoastal environments (Kana et al. 1985, Jones 1997 andreferences therein).
P-E experiments did not reveal major differencesbetween near-surface and SCM phytoplankton com-munities. Pmax and α were indistinguishable. However,Ek showed a tendency to be lower in the SCM, sug-
52
Fig. 4. (A) Incident irradiance during 6 h incubation period (diamonds) in thecoastal Gulf of Alaska study region during summer 2003. Natural variationranged from 15 to 91% of cloud-free irradiance. Heavy solid line shows averageEk for near-surface phytoplankton; thin lines show minimum and maximum Ek.(B) Modeled effect of cloud cover variability on daily integrated primary
production in 2 phytoplankton size fractions in the Alaska Coastal Current
Strom et al.: Light regulation of coastal photosynthesis
gesting some level of acclimation to the reduced lightlevels there. Phytoplankton community composition,as indicated by chl a size fractionation, also variedsomewhat with depth at most stations inshore of GAK-10 (Table 1). Ocean regions with deep euphotic zonesand a high degree of physical stability can show strongdepth differences in chl-normalized photosyntheticparameters. Consistent changes in Pmax and α withdepth were observed in the equatorial Pacific Ocean(Lindley et al. 1995) and the western MediterraneanSea (Morán & Estrada 2001). SCM communities in theSouthern California Bight and the offshore waters ofthe Japan Sea (SCM depth range 25 to 40 m) had con-sistently lower Pmax and Ek values than those near thesurface; however, only α differed between the 2 com-munities in the coastal Japan Sea (Schofield et al. 1991,Yoshikawa & Furuya 2008).
Why were P-E parameters of near surface and SCMphytoplankton so similar during summer 2003? In thesummer CGOA, it is likely that the light levels ex-
perienced by near surface and SCMphytoplankton are not consistently differ-ent enough to allow development ofstrongly contrasting P-E responses. Thereare at least 2 reasons for this. First, theCGOA region has strong tides that are asource of considerable mixing and dis-placement energy (Henson 2007). Datathat we collected on the mid-shelf(Fig. 5A) show that internal wave-like fea-tures can cause rapid vertical displace-ments of the SCM over depth scales(~10 m) nearly as large as those separat-ing near surface and SCM communities(see Table 1). Time scales of variation inthe vertical distribution of irradiance, dueto such displacement events, may be morerapid than time scales of photoacclimationof Pmax and α (Lewis et al. 1984). Second,the shallow pycnocline and associatednutricline typical of summer (Fig. 3) giverise to a relatively shallow SCM. The dif-ference in irradiance between near-sur-face and SCM communities is rivaled bythe day-to-day variations in incident irra-diance in this environment, which arelarge (Fig. 4A). An SCM at 21 m (the mid-shelf average for our study period)received about 10% of the irradianceexperienced at 3 m (approximately themid point of the surface mixed layer).Therefore a 21 m SCM on a sunny dayreceived only a little less light than thenear-surface community on a day withheavy cloud cover. These several sources
of variability in irradiance probably precluded devel-opment of major differences in Pmax and α between the2 communities.
In general, photosynthetic parameters did not varywith location in the coastal Gulf of Alaska during sum-
53
Fig. 5. (A) Depth of subsurface chlorophyll maximum (SCM) at Station GAK-5 during August 2003. Inset shows vertical oscillation of layer during 5 and6 August, consistent with internal wave activity. (B) Modeled effect of SCM
depth on integrated daily water column production
Phytoplankton Ek α Pmax
size
Incubation E0 >20 *0.53* –0.12 0.35<20 **0.60** *–0.42* 0.39
Previous day’s E0 >20 0.44 –0.24 *0.53*<20 *0.52* –0.12 **0.65**
Table 4. Correlation coefficients for relationships betweenphotosynthetic parameters and incident irradiance (E0) dur-ing the P-E incubation (mol photons m–2 6 h–1) or during theprevious day (mol photons m–2 d–1). P-E parameters were esti-mated for 2 different phytoplankton size classes (>20 µm and
<20 µm). *p < 0.10, **p < 0.05
Mar Ecol Prog Ser 402: 45–57, 2010
mer 2003. The exceptions were the 2-fold higher Pmax
and Ek values in the ACC (Fig. 2). Elevated Pmax and Ek
may be associated with a different phytoplankton spe-cies composition in the ACC, which supported a muchhigher proportion of >20 µm cells than did otherregions (Table 1). Microscopic observations showedthat Synechococcus and prymnesiophytes were com-mon at all stations, cryptophytes were common inshoreof slope Station GAK-10, while ACC communities con-tained, in addition, numerous diatoms and frequentlythe large dinoflagellate Ceratium. Chaetoceros wasthe most frequently observed diatom genus, andPseudo-nitzschia and Cylindrotheca were often notedto be present. We have presented evidence (Strom etal. 2006) that iron limitation on the mid- and outer shelfin the Seward Line region plays a role in creating asmall cell-dominated community and in restrictinggrowth of diatoms. The current data set also shows thehigh residual silicic acid concentrations and prepon-derance of small phytoplankton that would beexpected given mid- and outer shelf iron limitation(Fig. 3). Greater iron availability near shore might pro-mote changes in Ek and Pmax through direct stimulatoryeffects on light-harvesting pigments as well as thenumerous Fe-containing elements of photosyntheticelectron transport (Raven et al. 1999). Relief of iron ornitrogen limitation could also promote changes in pho-tosynthetic parameters through effects on phytoplank-ton taxonomic composition (Kirk 1994). Although oursampling methods were not trace metal clean, morethan 6 h are required for the photophysiology of nat-ural phytoplankton communities to respond to evendeliberate iron additions (Behrenfeld et al. 1996, Boydet al. 1998). Therefore, we consider our parameter esti-mates to be representative of ambient conditions.
Phytoplankton size class influenced both Pmax and α,with values of both parameters averaging 2.5 × higherfor small (<20 µm) phytoplankton than for large(>20 µm) phytoplankton (Fig. 2). The discrepancyappears to be related to the differing C:chl a ratios ofthese size fractions. Combining microscopy-based esti-mates of phytoplankton C biomass with measuredchl a values, E. Lessard (pers. comm.) estimated C:chl aratios of 25 and 65 for phytoplankton communitiesdominated by large and small cells, respectively, in thesummer 2001 CGOA. Applying these to our Pmax and αvalues to generate C-specific (rather than chl-specific)estimates yields identical values for Pmax and α for the2 size classes of 0.11 µg C µg C–1 h–1 and 3.1 × 10⁻⁴ µgC µg C–1 h–1 per µmol photons m–2 s–1, respectively.Assuming these C:chl a ratios are applicable to ourdata, these 2 size classes were performing identicallyper unit C biomass; in other words, the large phyto-plankton size class required a higher chl a content toachieve the same C-specific photosynthetic perfor-
mance as the small phytoplankton. The higher chl arequirement may arise in part from self-shading ofchloroplasts in larger cells (Kirk 1994).
Estimated water column productivity
Summer 2003 productivities in the CGOA were mod-erate, ranging from 359 to 748 mg C m–2 d–1 at studiedstations, and up to 909 mg C m–2 d–1 based on indirectestimates (Table 2). Although limited in scope (we hadonly 4 stations with complete sets of P-E data for bothnear-surface and SCM communities), these estimatesagree well with integrated production values obtainedfrom the region during July and August 2000 to 2004using 24 h incubations under simulated in situ condi-tions of water samples from multiple depths (D. Stock-well & T. Whitledge pers. comm.). On the other hand,our daily production rates were generally higher thanthose in more strongly stratified areas such as thesoutheastern Bering Sea. Rho & Whitledge (2007)reported values mostly <500 mg C m–2 d–1 for July andAugust during two 4 yr periods of study on the BeringSea shelf, although occasional productivities exceed-ing 1000 mg C m–2 d–1 did occur. Similarly, summerproductivities in strongly stratified Prince WilliamSound typically ranged between ~50 and ~500 mg Cm–2 d–1 depending on location, with a few higher val-ues in the ~700 to ~1200 mg C m–2 d–1 range (Goeringet al. 1973 as cited in Sambrotto & Lorenzen 1986). Incontrast, northeastern Pacific coastal regions withlarger nutrient inputs can have several-fold highersummer productivity levels. For example, entrainmentof subsurface (ocean-derived) nutrients into theeuphotic zone by the Fraser River plume, aided by tidalmixing and short-lived wind events, resulted in Augustproductivities of >2000 mg C m–2 d–1 at some Strait ofGeorgia stations (Yin et al. 1997).
Summer (June to September) productivities atOcean Station P in the oceanic Gulf of Alaska are strik-ingly similar to productivities we measured on theshelf. Values obtained during the 1987–1988 SUPERprogram ranged from 360 to 1540 mg C m–2 d–1 with anoverall mean of 750 mg C m–2 d–1 (n = 27, Welschmeyeret al. 1993). During the 1992 to 1997 cruises of theCanadian Joint Global Ocean Flux Study (JGOFS) pro-gram, values ranged from ~400 to ~1300 mg C m–2 d–1,with a mean of 850 mg C m–2 d–1 (n = 12, Boyd & Har-rison 1999). Intuitively it is surprising that daily sum-mer production in the low-chl, strongly iron-limitedwaters of the oceanic Gulf of Alaska should be as highas that on the shelf. Factors contributing to high pro-ductivities at Ocean Station P include the deepeuphotic zone, the preponderance of small (<20 µm)phytoplankton, which, as noted, have high chl-specific
54

Strom et al.: Light regulation of coastal photosynthesis
C fixation rates, and the relatively stable nutrient envi-ronment, which allows physiological acclimation andcommunity-level adaptation to iron limitation. Whileshelf phytoplankton appear to experience nutrientinput events leading to bursts of summer production(see above), this same variability may preclude physio-logical acclimation to the generally limiting concentra-tions of nitrogen and (in some areas) iron, just as vari-ability in day-to-day irradiance appears to precludephotoacclimation to low light.
Effects of environmental variation on primaryproduction
Our data clearly show the major role of light avail-ability in limiting photosynthesis rates and primaryproduction in the summer CGOA. Light limitationderives from at least 3 underlying causes: (1) the highincidence of days with heavy cloud cover; (2) the depthof the pycnocline and associated SCM, which reducesthe light available to the majority of the water columnphytoplankton biomass; and (3) the photophysiology ofthe phytoplankton community, which was adapted tohigh light levels. Each of these factors could be alteredby climate-driven changes in the ecosystem. Summerswith less cloud cover should result in higher primaryproduction. Somewhat counter-intuitively, summerswith more cloud cover, especially if chronic, could alsolead to increased production, because a less variableday-to-day light environment might lead to develop-ment of a phytoplankton community adapted to lowlight (i.e. phytoplankton cells able to achieve higherphotosynthesis rates at low light levels). SCM depth isanother climate-related variable important in deter-mining summer production. Phytoplankton in the SCMsometimes supported close to one half of the totalwater column productivity during summer 2003(Table 3) and, because communities were adapted tohigh light levels, productivities were quite sensitive tothe depth of this feature (Fig. 5). The depth of the SCMis set by the pycnocline, which is largely a function oftemperature stratification during summer in areas off-shore from the ACC (Weingartner et al. 2005). SummerSCM depth was relatively constant during the first 5 yrof the US GLOBEC study period, averaging 18 to 20 mfrom 1998 through 2002 (Fig. 6). However, during 2003and 2004 the summer SCM was shallower at 12 to16 m, demonstrating that substantial year-to-year dif-ferences do occur. In general, 2003 was an unusuallywarm year in the CGOA (Royer & Grosch 2006), andthis led to stronger temperature stratification and ashallower pycnocline (Fig. 6).
Because of the high latitude of the CGOA, it hasbeen hypothesized that light limitation is the main
environmental variable controlling primary productionin that ecosystem. If so, environmental changes thatdecrease the mixed layer depth (and thus increaselight availability to mixed layer phytoplankton) shouldpromote increased production (the ‘optimal window ofstability’, Gargett 1997). While this model is supportedby our P-E data, it is not supported by the completepicture of production limitation in the CGOA. Innerand mid-shelf phytoplankton demonstrate N-limitedgrowth during the late spring bloom, and this contin-ues throughout the summer stratified period. Indeed,this is an underlying reason for the summer formationof the SCM on the pycnocline and associated nutri-cline. Further, there is considerable evidence thatouter and mid-shelf phytoplankton are chronicallyiron-limited on portions of the CGOA shelf (Strom etal. 2006). Finally, phytoplankton biomass, an importantdeterminant of primary productivity, is strongly regu-lated by microzooplankton grazing in the CGOA. Datafrom spring and summer 2001 showed that all produc-tion by <20 µm phytoplankton, and approximately halfthe production of large (>20 µm) phytoplankton, wasconsumed by microzooplankton in this ecosystem(Strom et al. 2007). Therefore, effects of climate varia-tion on primary production can only be understoodthrough their combined effects on light availability,nutrient supply and microzooplankton biomass andactivity levels.
SUMMARY
P-E experiments conducted in summer on the north-ern CGOA shelf revealed a phytoplankton community
55
Fig. 6. Variation in depth of subsurface chlorophyll maximum(SCM) on the coastal Gulf of Alaska shelf during summersfrom 1998 to 2004, from US GLOBEC Long-Term ObservationProgram (LTOP) data. Values are means of SCM depth atSeward Line shelf stations GAK-1 through GAK-9 (Fig. 1)
during July and August; bars show range of observations
Mar Ecol Prog Ser 402: 45–57, 2010
adapted to high levels of light: Ek values were high,photosynthetic efficiencies were low and photoinhibi-tion was never observed. We attribute high light accli-mation to the shallow pycnocline and the large short-term variations in irradiance generated by internalwaves and variable cloud cover. Small phytoplankton(<20 µm) were responsible for most of the daily sum-mer production, due to their dominance of total chl a atmost stations and to their higher chl-specific photosyn-thesis rates. Elevated Pmax and Ek in the Alaska CoastalCurrent may have been due to greater iron availabilityand/or differences in phytoplankton species composi-tion in this near-shore region. Estimated primary pro-ductivities in the summer CGOA were moderate, gen-erally exceeding those from more strongly stratifiedsubarctic waters, but less than those in coastal NorthPacific regions with greater nutrient supply to summersurface waters. Light limitation of summer primaryproduction in the CGOA arose from both environmen-tal and physiological factors, including (1) the highincidence of days with heavy cloud cover; (2) the depthof the pycnocline and associated SCM, which reducedthe light available to the majority of the water columnphytoplankton biomass; and (3) high variability in irra-diance, which precluded development of a low-light-adapted phytoplankton community. Climate changecould thus affect summer photosynthesis rates in thecoastal Gulf of Alaska through changes in stratifica-tion, wind mixing energy and cloud cover. However,summer phytoplankton growth in this region is alsolimited by nutrient availability and microzooplanktongrazing, indicating a potentially complex relationshipbetween phytoplankton production and environmentalvariation.
Acknowledgements. We thank F. Perez and J. Swanko forhelp with on-board sampling and chlorophyll analysis, and C.Mordy for nutrient analyses. T. Weingartner provided CTDdata processing from our cruise and, with T. Royer, led theLTOP CTD sampling effort that provided data in Fig. 6. K.Bright prepared Fig. 1. J. Napp as chief scientist and the cap-tain and crew of the RV ‘Alpha Helix’ greatly assisted oursampling efforts. This research was funded by National Sci-ence Foundation grants OCE-0101397 and OCE-0639093.This is US GLOBEC contribution no. 656.
LITERATURE CITED
Beamish RJ, Bouillon DR (1993) Pacific salmon productiontrends in relation to climate. Can J Fish Aquat Sci 50:1002–1016
Behrenfeld MJ, Bale AJ, Kolber ZS, Aiken J, Falkowski PG(1996) Confirmation of iron limitation of phytoplanktonphotosynthesis in the equatorial Pacific Ocean. Nature383:508–511
Boyd P, Harrison PJ (1999) Phytoplankton dynamics in the NEsubarctic Pacific. Deep-Sea Res II 46:2405–2432
Boyd P, Berges JA, Harrison PJ (1998) In vitro iron enrichmentexperiments at iron-rich and -poor sites in the NE subarc-tic Pacific. J Exp Mar Biol Ecol 227:133–151
Childers AR, Whitledge TE, Stockwell DA (2005) Seasonaland interannual variability in the distribution of nutrientsand chlorophyll a across the Gulf of Alaska shelf:1998–2000. Deep-Sea Res II 52:193–216
Cross AD, Beauchamp DA, Myers KW, Moss JH (2008) Earlymarine growth of pink salmon in Prince William Soundand the coastal Gulf of Alaska during years of low andhigh survival. Trans Am Fish Soc 137:927–939
Gargett A (1997) The optimal stability ‘window’: a mechanismunderlying decadal fluctuations in North Pacific salmonstocks. Fish Oceanogr 6:109–117
Henson SA (2007) Water column stability and spring bloomdynamics in the Gulf of Alaska. J Mar Res 65:715–736
Hollowed AB, Hare SR, Wooster WS (2001) Pacific basin cli-mate variability and patterns of Northeast Pacific marinefish production. Prog Oceanogr 49:257–282
Jassby AD, Platt T (1976) Mathematical formulation of therelationship between photosynthesis and light for phyto-plankton. Limnol Oceanogr 21:540–547
Jones RC (1997) Seasonal and spatial patterns in phytoplank-ton photosynthetic parameters in a tidal freshwater river.Hydrobiologia 364:199–208
Kana TM, Watts JL, Glibert PM (1985) Diel periodicity in thephotosynthetic capacity of coastal and offshore phyto-plankton assemblages. Mar Ecol Prog Ser 25:131–139
Kirk JTO (1994) Light and photosynthesis in aquatic ecosys-tems. Cambridge University Press, Cambridge
Lewis MR, Cullen JJ, Platt T (1984) Relationships betweenvertical mixing and photoadaptation of phytoplankton:similarity criteria. Mar Ecol Prog Ser 15:141–149
Lindley ST, Bidigare RR, Barber RT (1995) Phytoplanktonphotosynthesis parameters along 140°W in the equatorialPacific. Deep-Sea Res II 42:441–463
Morán XAG, Estrada M (2001) Short-term variability of pho-tosynthetic parameters and particulate and dissolved pri-mary production in the Alboran Sea (SW Mediterranean).Mar Ecol Prog Ser 212:53–67
Parsons TR, Maita Y, Lalli CM (1984) A manual of chemicaland biological methods for seawater analysis. Pergamon,Oxford
Raven JA, Evans MCW, Korb RE (1999) The role of trace met-als in photosynthetic electron transport in O2-evolvingorganisms. Photosynth Res 60:111–149
Rho T, Whitledge TE (2007) Characteristics of seasonal andspatial variations of primary production over the south-eastern Bering Sea shelf. Cont Shelf Res 27:2556–2569
Royer TC, Grosch CE (2006) Ocean warming and fresheningin the northern Gulf of Alaska. Geophys Res Lett 33:L16605 doi:16610.11029/12006GL026767
Sakshaug E, Bricaud A, Dandonneau Y, Falkowski PG andothers (1997) Parameters of photosynthesis: definitions,theory and interpretation of results. J Plankton Res 19:1637–1670
Sambrotto RN, Lorenzen CJ (1986) Phytoplankton and pri-mary production. In: Hood DW, Zimmerman ST (eds) TheGulf of Alaska: physical environment and biologicalresources. US Department of Commerce, Washington DC,p 249–282
Schofield O, Prézelin BB, Smith RC, Stegmann PM, NelsonNB, Lewis MR, Baker KS (1991) Variability in spectral andnonspectral measurements of photosynthetic light utiliza-tion efficiencies. Mar Ecol Prog Ser 78:253–271
Stabeno PJ, Bond NA, Hermann AJ, Kachel NB, MordyCW, Overland JE (2004) Meteorology and oceanography
56
Strom et al.: Light regulation of coastal photosynthesis
of the Northern Gulf of Alaska. Cont Shelf Res 24:859–897
Strom SL, Olson MB, Macri EL, Mordy CW (2006) Cross-shelfgradients in phytoplankton community structure, nutrientutilization, and growth rate in the coastal Gulf of Alaska.Mar Ecol Prog Ser 328:75–92
Strom SL, Macri EL, Olson MB (2007) Microzooplankton graz-ing in the coastal Gulf of Alaska: variations in top-downcontrol of phytoplankton. Limnol Oceanogr 52:1480–1494
Toon RK, Lohrenz SE, Rathbun CE, Wood AM and others(2000) Photosynthesis–irradiance parameters and commu-nity structure associated with coastal filaments and adja-cent waters in the northern Arabian Sea. Deep-Sea Res II47:1249–1277
van Hilst CM, Smith WO Jr (2002) Photosynthesis/irradiancerelationships in the Ross Sea, Antarctica, and their controlby phytoplankton assemblage composition and environ-mental factors. Mar Ecol Prog Ser 226:1–12
Weingartner TJ, Danielson SL, Royer TC (2005) Freshwatervariability and predictability in the Alaska Coastal Cur-
rent. Deep-Sea Res II 52:169–191Welschmeyer NA (1994) Fluorometric analysis of chlorophyll
a in the presence of chlorophyll b and pheopigments.Limnol Oceanogr 39:1985–1992
Welschmeyer NA, Strom S, Goericke R, DiTullio G, Belvin M,Petersen W (1993) Primary production in the subarcticPacific Ocean: project SUPER. Prog Oceanogr 32:101–135
Wu J, Aguilar-Islas A, Rember R, Weingartner T, Danielson S,Whitledge T (2009) Size-fractionated iron distribution onthe northern Gulf of Alaska. Geophys Res Lett 36:L11606doi:11610.11029/12009GL038304
Yin K, Goldblatt RH, Harrison PJ, St. John MA, Clifford PJ,Beamish RJ (1997) Importance of wind and river dischargein influencing nutrient dynamics and phytoplankton pro-duction in summer in the central Strait of Georgia.Mar Ecol Prog Ser 161:173–183
Yoshikawa T, Furuya K (2008) Phytoplankton photosyntheticparameters and primary production in Japan Sea and theEast China Sea: toward improving primary productionmodels. Cont Shelf Res 28:962–976
57
Editorial responsibility: Matthias Seaman,Oldendorf/Luhe, Germany
Submitted: November 17, 2008; Accepted: December 11, 2009Proofs received from author(s): February 22, 2010