Recovery of deep-water megafaunal assemblages from ... ECOLOGY PROGRESS SERIES Mar Ecol Prog Ser...
12
MARINE ECOLOGY PROGRESS SERIES Mar Ecol Prog Ser Vol. 461: 71–82, 2012 doi: 10.3354/meps09827 Published August 8 INTRODUCTION Disturbance from typical best-practice hydrocar- bon drilling generally causes sedimentation and some chemical stress to benthic communities, rarely measurable beyond 250 m of the drilled area (Jones et al. 2007b, Santos et al. 2009). With increasing drilling activity in deeper waters (Radler 2006), and in environmentally sensitive areas, disturbance from drilling is an increasing threat to benthic ecosystems across the globe. The UK continental shelf and slope has around 0.3% of the world’s proven hydrocarbon reserves (Radler 2006), much of which is in the Faroe-Shetland Channel. With studies highlighting the effects of declining biodiversity on ecosystem functioning in the deep sea (Danovaro et al. 2008), it is important to understand the losses being experi- enced and the potential for recovery. The megabenthos play a key role in the function- ing of deep-sea ecosystems (Smith & Hamilton 1983), and they are important to include in environmental studies. Megabenthic organisms are difficult to study © Inter-Research 2012 · www.int-res.com *Email: [email protected] Recovery of deep-water megafaunal assemblages from hydrocarbon drilling disturbance in the Faroe-Shetland Channel Daniel O. B. Jones 1, *, Andrew R. Gates 1 , Berthold Lausen 2 1 National Oceanography Centre, European Way, Southampton SO14 3ZH, UK 2 Department of Mathematical Sciences, University of Essex, Wivenhoe Park, Colchester CO4 3SQ, UK ABSTRACT: Recovery of megabenthic assemblages from physical disturbance at the Laggan deep-water hydrocarbon drilling site in the Faroe-Shetland Channel was assessed using remotely operated vehicle quantitative video survey. Twelve undisturbed control sites and 2 well sites (A and C, disturbed 3 and 10 yr prior to this work, respectively) were analysed and compared with a previous survey immediately following disturbance at A. The megabenthic epifauna at Laggan was dominated by sponges (69.6% total fauna) represented by 20 taxa. Cnidarians (12.8%; 9 taxa) and echinoderms (7.1%; 11 taxa) were also common. Diversity was generally high and typical for the cold waters of the Faroe-Shetland Channel. Two distinct assemblages were found: one in the deeper area of the study site (also incorporating Site C), and one in the other areas (incorporating Site A). Motile faunal densities and richness were significantly elevated immediately after drilling in an area with intermediate disturbance, presumably attracted to available carcasses of organ- isms killed by drilling disturbance. After 3 and 10 yr, densities of motile organisms were less vari- able with distance, except very close to drilling where densities and richness were still reduced. Sessile faunal densities and richness increased significantly with increasing distance from drilling in all years, although both metrics were significantly higher close to drilling after 3 and 10 yr when compared to immediately after drilling. These data suggest partial megabenthic recovery between 3 and 10 yr post-disturbance. Despite this, in the area remaining completely covered by drill cuttings there were few megafauna observed even after 10 yr. KEY WORDS: Recovery · Megafauna · Disturbance · Benthic · Deep-sea · Hydrocarbon drilling · Remotely operated vehicle video · ROV video Resale or republication not permitted without written consent of the publisher OPEN PEN ACCESS CCESS
Transcript of Recovery of deep-water megafaunal assemblages from ... ECOLOGY PROGRESS SERIES Mar Ecol Prog Ser...

MARINE ECOLOGY PROGRESS SERIESMar Ecol Prog Ser
Vol. 461: 71–82, 2012doi: 10.3354/meps09827
Published August 8
INTRODUCTION
Disturbance from typical best-practice hydrocar-bon drilling generally causes sedimentation andsome chemical stress to benthic communities, rarelymeasurable beyond 250 m of the drilled area (Joneset al. 2007b, Santos et al. 2009). With increasingdrilling activity in deeper waters (Radler 2006), andin environmentally sensitive areas, disturbance fromdrilling is an increasing threat to benthic ecosystemsacross the globe. The UK continental shelf and slope
has around 0.3% of the world’s proven hydrocarbonreserves (Radler 2006), much of which is in theFaroe−Shetland Channel. With studies highlightingthe effects of declining biodiversity on ecosystemfunctioning in the deep sea (Danovaro et al. 2008), itis important to understand the losses being experi-enced and the potential for recovery.
The megabenthos play a key role in the function-ing of deep-sea ecosystems (Smith & Hamilton 1983),and they are important to include in environmentalstudies. Megabenthic organisms are difficult to study
© Inter-Research 2012 · www.int-res.com*Email: [email protected]
Recovery of deep-water megafaunal assemblagesfrom hydrocarbon drilling disturbance in
the Faroe−Shetland Channel
Daniel O. B. Jones1,*, Andrew R. Gates1, Berthold Lausen2
1National Oceanography Centre, European Way, Southampton SO14 3ZH, UK2Department of Mathematical Sciences, University of Essex, Wivenhoe Park, Colchester CO4 3SQ, UK
ABSTRACT: Recovery of megabenthic assemblages from physical disturbance at the Laggandeep-water hydrocarbon drilling site in the Faroe−Shetland Channel was assessed using remotelyoperated vehicle quantitative video survey. Twelve undisturbed control sites and 2 well sites (Aand C, disturbed 3 and 10 yr prior to this work, respectively) were analysed and compared with aprevious survey immediately following disturbance at A. The megabenthic epifauna at Lagganwas dominated by sponges (69.6% total fauna) represented by 20 taxa. Cnidarians (12.8%; 9 taxa)and echinoderms (7.1%; 11 taxa) were also common. Diversity was generally high and typical forthe cold waters of the Faroe−Shetland Channel. Two distinct assemblages were found: one in thedeeper area of the study site (also incorporating Site C), and one in the other areas (incorporatingSite A). Motile faunal densities and richness were significantly elevated immediately after drillingin an area with intermediate disturbance, presumably attracted to available carcasses of organ-isms killed by drilling disturbance. After 3 and 10 yr, densities of motile organisms were less vari-able with distance, except very close to drilling where densities and richness were still reduced.Sessile faunal densities and richness increased significantly with increasing distance from drillingin all years, although both metrics were significantly higher close to drilling after 3 and 10 yr whencompared to immediately after drilling. These data suggest partial megabenthic recoverybetween 3 and 10 yr post-disturbance. Despite this, in the area remaining completely covered bydrill cuttings there were few megafauna observed even after 10 yr.
KEY WORDS: Recovery · Megafauna · Disturbance · Benthic · Deep-sea · Hydrocarbon drilling ·Remotely operated vehicle video · ROV video
Resale or republication not permitted without written consent of the publisher
OPENPEN ACCESSCCESS

Mar Ecol Prog Ser 461: 71–82, 2012
using conventional sampling methods because oftheir low density. In addition, in rocky areas, such asthe Faroe−Shetland Channel, trawled gear and theircatch are typically badly damaged when retrieved(Thomson 1873). Recovery in epibenthic megafaunalassemblages after anthropogenic disturbance israrely investigated as it requires multi-year assess-ment over large areas at high-resolution.
The impact of hydrocarbon exploration drilling atthe Laggan field in the Faroe−Shetland Channelincludes complete smothering of the seabed withdrill cuttings (composed of sediments and drill mud;see Schaanning et al. 2008) up to 120 m from the welland a subsequent significant reduction in megafau-nal abundance and diversity (Jones et al. 2006). Inaddition to disturbance from smothering, potentialecotoxicological effects of components of the drillingmuds (Terzaghi et al. 1998, Schaanning et al. 2008,Trannum et al. 2010) and changes in sediment grainsize from coarse to fine may have reduced recoveryrates (Trannum et al. 2010). Hydrocarbon drilling, asa known and quantifiable disturbance, provides auseful model for studying the effects of anthro-pogenic disturbance in the deep sea.
Recovery typically implies a return of an ecosystemto pre-disturbance conditions as a result of the oper-ation of homeostatic ecological control mechanisms(O‘Neill 1998). Recovery is a complex phenomenoninvolving spatially and temporally dynamic bioticand abiotic changes. The recovered ecosystem mayhave altered in some way from its original state, forexample in ecosystem function, structure, speciescomplement or diversity (O‘Neill 1998). Althoughdisturbance to megafaunal assemblages from drillinghas been reported (Jones et al. 2006, 2007b, Hugheset al. 2010), there have been few assessments of re -covery associated with deep-water drilling impacts.
Study area
The Faroe−Shetland Channel is a deep channelseparating the Faroe Plateau from the Scottish conti-nental shelf (Fig. 1). It has a complex hydrographicregime, with warm North Atlantic waters overlyingthe cold water flowing from the Norwegian Sea (Tur-rell et al. 1999, Bett 2001). At 600 m depth, the Lag-gan oil field (Fig. 1) is located at the transitionbetween warmer and colder water masses: ArcticIntermediate Water (400 to 600 m; 2 to 5.5°C) andNorwegian Sea Arctic Intermediate Water (−0.5 to0.5°C in 600 to 800 m) (Turrell et al. 1999). The deep-water thermocline, at approximately 550 m depth in
the Laggan area, can vary in depth by more than40 m during a tidal cycle (Sherwin 1995).
The Faroe−Shetland Channel harbours a widevariety of megafaunal species (Bett 2001). The abun-dance of hard substratum (iceberg rafted dropstones) generally leads to a well-developed encrust-ing epifauna of poriferans, cnidarians and bryozoans.On softer substrata, echinoderms are abundant (Bett2001, Jones et al. 2007a). There is a distinct commu-nity separation between the different temperatureregimes in the channel in all faunal groups investi-gated (Bett 2001, Narayanaswamy et al. 2005, Wit-baard et al. 2005, Jones et al. 2007a).
The Laggan area (Well 206/1a-4-az; here Well A)was subject to a detailed investigation of the initialeffects of drilling disturbance in 2004 on the benthicmegafaunal assemblage (Jones et al. 2006). Twowells studied in the warmer shallower waters of theFaroe−Shetland Channel revealed different speciesbut similar disturbance regimes and responses ofmegafauna to disturbance (Jones et al. 2007b).
Aims
The objectives of this study are to determine therecovery of deep-water megafaunal density anddiversity after physical anthropogenic disturbance inthe Faroe−Shetland Channel.
72
Fig. 1. Location of the Laggan study site in the Faroe−Shetland Channel

Jones et al.: Faroe−Shetland Channel megafaunal recovery
MATERIALS AND METHODS
Survey design
The study was undertaken in April2007 and had 3 study targets:
(1) Drill Site A — drilled in March2004; i.e. studied 3 yr after drilling(also surveyed previously, in April2004, by Jones et al. 2006)
(2) Drill Site C — drilled in 1997; i.e.studied 10 yr after drilling (not sur-veyed previously; drilled using a simi-lar method to A)
(3) Background environment — ran-domly selected locations at least 500 mfrom the drilling sites and presumed tobe beyond the influence of acutedrilling impacts (see e.g. Jones et al.2006). These locations were dividedequally between 2 depth strata, basedon the approximate transition depth(600 m) between the shallower ArcticIntermediate Water and the deeperFaroe−Shetland Channel Bottom Wa -ter (Turrell et al. 1999) and associatedchanges in biology (Bett 2001).
The background environment sam-ples at Laggan (Fig. 2) were con-strained to a 6 × 6 km square (corners:NW 6759873 N, 502888 E; NE 6759873 N, 508888 E;SE 6753873 N, 508888 E; SW 6753873 N, 502888 E;Fig. 2). All positional information was recorded inUniversal Transverse Mercator (UTM) zone 30 N,based on the World Geodetic Society 1984 datum.The 2 well sites were located as follows: A at6756872.9 N, 505887.6 E (drilling commenced on25 March 2004) and C at 6758191.0 N, 503849.5 E(drilled in 1997).
Data collection
Data were collected using a Seaeye Tiger remotelyoperated vehicle (ROV) equipped with a colour videocamera, digital still camera (Kongsberg OE14-208),sonar (Tritech) and ultra-short baseline navigationtransponder. Before each transect, the camera wascentred, fully zoomed out and tilted to its most verti-cal angle (47° below horizontal) to optimise scaling ofoblique images.
Well site surveys were radiating video transects,500 m in length (Fig. 2, Table S1 in the supplement at
www.int-res.com/articles/suppl/m461p071_supp.pdf;Site A: n = 8, Site C: n = 4). Each transect was splitinto 100 m sections by distance from the well (5 distance zones: 0−100 m, 100−200 m, 200−300 m,300−400 m and 400−500 m; Site A: n = 40, Site C: n =20). The seabed water depth along transects was 595to 601 m for Site A and 631 to 640 m for Site C.
Video transects designed to characterise the nat-ural seabed conditions (prefix R; Table S1 in thesupplement; n = 12; length = 100 m) commencedfrom pre-defined random positions on randomheadings within the 2 depth strata (6 transects in550 to 600 m and 6 in 600 to 650 m water depth).Transect 5 was subsequently excluded from theanalysis as a fault with the ROV caused loss ofvideo quality. Although the survey design initiallyseparated random transects into 2 strata based onthe 600 m contour, random transects shallower than611 m and deeper than 633 m were found to be dis-tinctly different (see ‘Results’). Random transectswere subsequently divi ded by depth into 2 groups,Rshallow and Rdeep (see ‘Results’). Sampling units forall analysis consisted of segments of video repre-
73
Fig. 2. Laggan site (6 × 6 km) showing sampling locations. R = random 100 mbackground remotely operated vehicle (ROV) transects. The position ofWells A, B and C is shown. At Site A and C, 500 m ROV transects radiatefrom the drilling location. Well B was not investigated in this study. The
550 and 600 m contours are shown as dotted lines. Scale bar = 1 km
Mar Ecol Prog Ser 461: 71–82, 2012
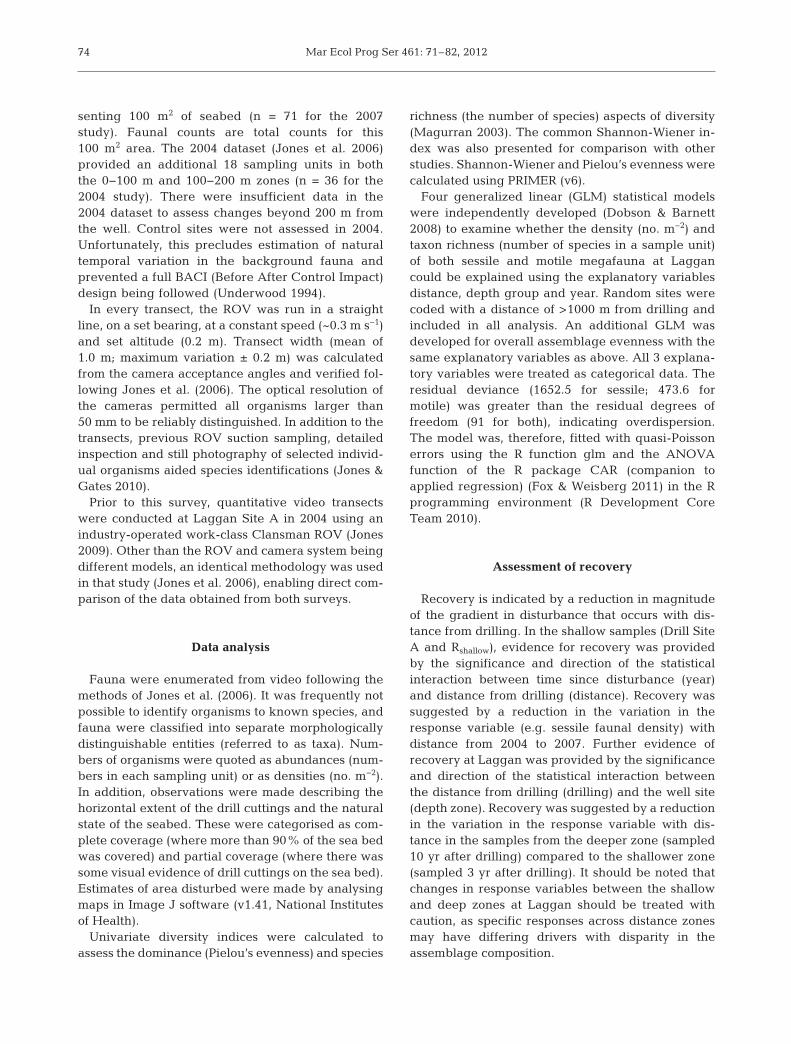
senting 100 m2 of seabed (n = 71 for the 2007study). Faunal counts are total counts for this100 m2 area. The 2004 dataset (Jones et al. 2006)provided an additional 18 sampling units in boththe 0−100 m and 100−200 m zones (n = 36 for the2004 study). There were insufficient data in the2004 dataset to assess changes beyond 200 m fromthe well. Control sites were not assessed in 2004.Unfortunately, this precludes estimation of naturaltemporal variation in the background fauna andprevented a full BACI (Before After Control Impact)design being followed (Underwood 1994).
In every transect, the ROV was run in a straightline, on a set bearing, at a constant speed (~0.3 m s−1)and set altitude (0.2 m). Transect width (mean of1.0 m; maximum variation ± 0.2 m) was calculatedfrom the camera acceptance angles and verified fol-lowing Jones et al. (2006). The optical resolution ofthe cameras permitted all organisms larger than50 mm to be reliably distinguished. In addition to thetransects, previous ROV suction sampling, detailedinspection and still photography of selected individ-ual organisms aided species identifications (Jones &Gates 2010).
Prior to this survey, quantitative video transectswere conducted at Laggan Site A in 2004 using anindustry-operated work-class Clansman ROV (Jones2009). Other than the ROV and camera system beingdifferent models, an identical methodology was usedin that study (Jones et al. 2006), enabling direct com-parison of the data obtained from both surveys.
Data analysis
Fauna were enumerated from video following themethods of Jones et al. (2006). It was frequently notpossible to identify organisms to known species, andfauna were classified into separate morphologicallydistinguishable entities (referred to as taxa). Num-bers of organisms were quoted as abundances (num-bers in each sampling unit) or as densities (no. m−2).In addition, observations were made describing thehorizontal extent of the drill cuttings and the naturalstate of the seabed. These were categorised as com-plete coverage (where more than 90% of the sea bedwas covered) and partial coverage (where there wassome visual evidence of drill cuttings on the sea bed).Estimates of area disturbed were made by analysingmaps in Image J software (v1.41, National Institutesof Health).
Univariate diversity indices were calculated toassess the dominance (Pielou’s evenness) and species
richness (the number of species) aspects of diversity(Magurran 2003). The common Shannon-Wiener in -dex was also presented for comparison with otherstudies. Shannon-Wiener and Pielou’s evenness werecalculated using PRIMER (v6).
Four generalized linear (GLM) statistical modelswere independently developed (Dobson & Barnett2008) to examine whether the density (no. m−2) andtaxon richness (number of species in a sample unit)of both sessile and motile megafauna at Laggancould be explained using the explanatory variablesdistance, depth group and year. Random sites werecoded with a distance of >1000 m from drilling andincluded in all analysis. An additional GLM wasdeveloped for overall assemblage evenness with thesame explanatory variables as above. All 3 explana-tory variables were treated as categorical data. Theresidual deviance (1652.5 for sessile; 473.6 formotile) was greater than the residual degrees offreedom (91 for both), indicating overdispersion.The model was, therefore, fitted with quasi-Poissonerrors using the R function glm and the ANOVAfunction of the R package CAR (companion toapplied regression) (Fox & Weisberg 2011) in the Rprogramming environment (R Development CoreTeam 2010).
Assessment of recovery
Recovery is indicated by a reduction in magnitudeof the gradient in disturbance that occurs with dis-tance from drilling. In the shallow samples (Drill SiteA and Rshallow), evidence for recovery was providedby the significance and direction of the statisticalinter action between time since disturbance (year)and distance from drilling (distance). Recovery wassuggested by a reduction in the variation in theresponse vari able (e.g. sessile faunal density) withdistance from 2004 to 2007. Further evidence ofrecovery at Laggan was provided by the significanceand direction of the statistical interaction betweenthe distance from drilling (drilling) and the well site(depth zone). Recovery was suggested by a reductionin the variation in the response variable with dis-tance in the samples from the deeper zone (sampled10 yr after drilling) compared to the shallower zone(sampled 3 yr after drilling). It should be noted thatchanges in response variables between the shallowand deep zones at Laggan should be treated withcaution, as specific responses across distance zonesmay have differing drivers with disparity in theassemblage composition.
74
Jones et al.: Faroe−Shetland Channel megafaunal recovery
RESULTS
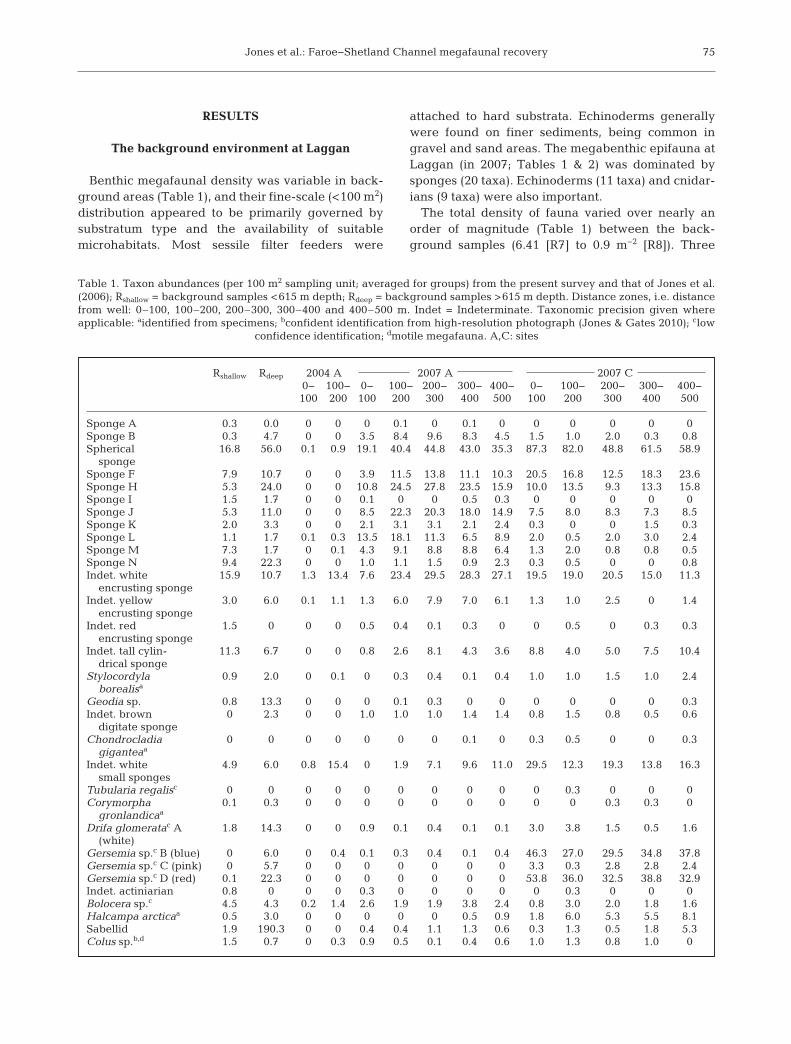
The background environment at Laggan
Benthic megafaunal density was variable in back-ground areas (Table 1), and their fine-scale (<100 m2)distribution appeared to be primarily governed bysubstratum type and the availability of suitablemicrohabitats. Most sessile filter feeders were
attached to hard substrata. Echinoderms generallywere found on finer sediments, being common ingravel and sand areas. The megabenthic epifauna atLaggan (in 2007; Tables 1 & 2) was dominated bysponges (20 taxa). Echinoderms (11 taxa) and cnidar-ians (9 taxa) were also important.
The total density of fauna varied over nearly anorder of magnitude (Table 1) between the back-ground samples (6.41 [R7] to 0.9 m−2 [R8]). Three
75
Rshallow Rdeep 2004 A 2007 A 2007 C0− 100− 0− 100− 200− 300− 400− 0− 100− 200− 300− 400−100 200 100 200 300 400 500 100 200 300 400 500
Sponge A 0.3 0.0 0 0 0 0.1 0 0.1 0 0 0 0 0 0Sponge B 0.3 4.7 0 0 3.5 8.4 9.6 8.3 4.5 1.5 1.0 2.0 0.3 0.8Spherical 16.8 56.0 0.1 0.9 19.1 40.4 44.8 43.0 35.3 87.3 82.0 48.8 61.5 58.9
spongeSponge F 7.9 10.7 0 0 3.9 11.5 13.8 11.1 10.3 20.5 16.8 12.5 18.3 23.6Sponge H 5.3 24.0 0 0 10.8 24.5 27.8 23.5 15.9 10.0 13.5 9.3 13.3 15.8Sponge I 1.5 1.7 0 0 0.1 0 0 0.5 0.3 0 0 0 0 0Sponge J 5.3 11.0 0 0 8.5 22.3 20.3 18.0 14.9 7.5 8.0 8.3 7.3 8.5Sponge K 2.0 3.3 0 0 2.1 3.1 3.1 2.1 2.4 0.3 0 0 1.5 0.3Sponge L 1.1 1.7 0.1 0.3 13.5 18.1 11.3 6.5 8.9 2.0 0.5 2.0 3.0 2.4Sponge M 7.3 1.7 0 0.1 4.3 9.1 8.8 8.8 6.4 1.3 2.0 0.8 0.8 0.5Sponge N 9.4 22.3 0 0 1.0 1.1 1.5 0.9 2.3 0.3 0.5 0 0 0.8Indet. white 15.9 10.7 1.3 13.4 7.6 23.4 29.5 28.3 27.1 19.5 19.0 20.5 15.0 11.3
encrusting spongeIndet. yellow 3.0 6.0 0.1 1.1 1.3 6.0 7.9 7.0 6.1 1.3 1.0 2.5 0 1.4
encrusting spongeIndet. red 1.5 0 0 0 0.5 0.4 0.1 0.3 0 0 0.5 0 0.3 0.3
encrusting spongeIndet. tall cylin- 11.3 6.7 0 0 0.8 2.6 8.1 4.3 3.6 8.8 4.0 5.0 7.5 10.4
drical spongeStylocordyla 0.9 2.0 0 0.1 0 0.3 0.4 0.1 0.4 1.0 1.0 1.5 1.0 2.4
borealisa
Geodia sp. 0.8 13.3 0 0 0 0.1 0.3 0 0 0 0 0 0 0.3Indet. brown 0 2.3 0 0 1.0 1.0 1.0 1.4 1.4 0.8 1.5 0.8 0.5 0.6
digitate spongeChondrocladia 0 0 0 0 0 0 0 0.1 0 0.3 0.5 0 0 0.3
giganteaa
Indet. white 4.9 6.0 0.8 15.4 0 1.9 7.1 9.6 11.0 29.5 12.3 19.3 13.8 16.3small sponges
Tubularia regalisc 0 0 0 0 0 0 0 0 0 0 0.3 0 0 0Corymorpha 0.1 0.3 0 0 0 0 0 0 0 0 0 0.3 0.3 0
gronlandicaa
Drifa glomeratac A 1.8 14.3 0 0 0.9 0.1 0.4 0.1 0.1 3.0 3.8 1.5 0.5 1.6(white)
Gersemia sp.c B (blue) 0 6.0 0 0.4 0.1 0.3 0.4 0.1 0.4 46.3 27.0 29.5 34.8 37.8Gersemia sp.c C (pink) 0 5.7 0 0 0 0 0 0 0 3.3 0.3 2.8 2.8 2.4Gersemia sp.c D (red) 0.1 22.3 0 0 0 0 0 0 0 53.8 36.0 32.5 38.8 32.9Indet. actiniarian 0.8 0 0 0 0.3 0 0 0 0 0 0.3 0 0 0Bolocera sp.c 4.5 4.3 0.2 1.4 2.6 1.9 1.9 3.8 2.4 0.8 3.0 2.0 1.8 1.6Halcampa arcticaa 0.5 3.0 0 0 0 0 0 0.5 0.9 1.8 6.0 5.3 5.5 8.1Sabellid 1.9 190.3 0 0 0.4 0.4 1.1 1.3 0.6 0.3 1.3 0.5 1.8 5.3Colus sp.b,d 1.5 0.7 0 0.3 0.9 0.5 0.1 0.4 0.6 1.0 1.3 0.8 1.0 0
Table 1. Taxon abundances (per 100 m2 sampling unit; averaged for groups) from the present survey and that of Jones et al.(2006); Rshallow = background samples <615 m depth; Rdeep = background samples >615 m depth. Distance zones, i.e. distancefrom well: 0–100, 100–200, 200–300, 300–400 and 400–500 m. Indet = Indeterminate. Taxonomic precision given where applicable: aidentified from specimens; bconfident identification from high-resolution photograph (Jones & Gates 2010); clow
confidence identification; dmotile megafauna. A,C: sites

Mar Ecol Prog Ser 461: 71–82, 2012
samples had high total densities (4.21 [R3], 2.63 [R6],6.41 [R7] m−2). The other samples had similar den -sities (mean 1.2 m−2 ± 0.19 m−2 SD). Sabellids werealmost exclusive to 2 samples (R3 = 2.17 m−2, R7 =3.54 m−2; other samples < 0.06 m−2) and only found infine sediment. The samples with the highest totalnumber of taxa (S) were R7 (31), R3 (28) and R6 (27);
R1 had the lowest S (19). Evenness was clearlyreduced in samples R7 (J ’ = 0.56) and R3 (J ’ = 0.59)compared to the other samples (J ’ = 0.82 to 0.89),owing to high sabellid densities.
There was a clear separation in assemblage com-position of background sites, with 2 distinct groups.Ten taxa were unique to Rshallow and 5 were only
76
Table 1 (continued)
Rshallow Rdeep 2004 A 2007 A 2007 C0− 100− 0− 100− 200− 300− 400− 0− 100− 200− 300− 400−100 200 100 200 300 400 500 100 200 300 400 500
Colossendeis 0 0 0 0 0 0 0 0 0 0 0 0 0 0.3proboscideaa,d
Boreonymphon sp.d 0.1 0 0.1 0.1 0 0 0 0 0 0 0 0 0 0.5Atlantopandalus
propinqvusc,d 1.3 2.3 1.9 37.7 2.0 0.8 1.1 0.4 0.8 0 0.3 0 0 0Pagurus sp.d 0 0 0.1 1.1 0.3 0.1 0 0 0.1 0 0 0 0 0Reteporella sp.b 0.1 1.0 0 0 0.1 0 0 0 0.1 0 0 0 0 0Indet. bryozoan 0.1 1.0 0 0 0 0 0 0.1 0 0 0 1.3 1.5 0.8Indet. asteroidd 1.0 0.3 0 0 1.4 1.1 2.0 1.4 0.6 0 0 0.3 0.3 0.3Henricia sp.a,d 0 0 0.6 4.9 0 0.3 0.3 0.5 0.1 0 0 0 0 0Asteropectinidaed 0.1 0 0 0.1 0 0 0 0 0 0 0 0 0 0.5Pteraster militarisa,d 0 0.3 0.1 1.2 0 0 0 0 0 0.3 0.3 0.3 0.3 0Ceramaster granularisa,d 1.5 0 1.1 4.6 0.6 2.9 2.4 2.4 1.9 0.3 0 0 0.3 0Crossaster papposusa,d 0.3 0 0 0 0.3 0.3 0.1 0 0.1 0.5 0.8 0.8 0.5 0.8Porania pulvillus 0 0 0 0 0 0.3 0.1 0.1 0 1.3 0 1.0 0.3 0.6
pulvillusb,d
Tremaster mirabilisa,d 0.4 0 0 0 0 0 0 0 0 0 0 0 0 0Indet. ophiuroidd 1.0 1.3 0 0 0 0.9 0.3 0.4 1.4 0.8 0 1.0 3.8 1.0Poliometra prolixaa,d 0 0.3 0.3 0.8 0 0 0 0 0 0 0 0.8 0.3 1.3Echinus spp. (E. alex- 5.9 0.3 1.4 8.3 7.1 10.5 10.3 11.5 8.8 0 0.5 0 0.5 0.3
andri and E. elegans)a,d
Myxine glutinosaa,d 0.3 2.0 0 0 0 0 0.1 0.1 0.1 2.3 0.5 1.0 1.8 1.3Lycodes esmarkiib,d 0.1 0 0.2 0.9 0.1 0 0.4 0.5 0.3 1.5 1.0 0.5 0.3 0.5Lycodonus mirabilisd 0.5 0.3 0 0 0.3 0.8 0.3 0.1 0.4 0 0 0 0 0Cottunculus micropsb,d 0 0 0 0.1 0 0 0 0 0 0 0.3 0.3 0 0.3Rajella fyllaeb,d 0 0 0 0.1 0 0 0.1 0.1 0.1 0 0 0 0.3 0.3Amblyraja hyperboreab,d 0 0 0 0 0.3 0.6 0.1 0.5 0.3 0.5 0 0.3 0.5 3.5Indet. juvenile fishd 0.1 0 0.2 0.4 0 0 0 0 0 0 0 0 0 0Indet. flat fishd 0 0 0 0 0 0 0.3 0 0 0 0 0 0 0Indet. organisms 0.5 1.3 0 0 5.5 7.6 3.3 2.5 2.4 0 0 0 0.3 0
Rshallow Rdeep 2004 A 2007 A 2007 C0− 100− 0− 100− 200− 300− 400− 0− 100− 200− 300− 400−100 200 100 200 300 400 500 100 200 300 400 500
Porifera 79.6 41.7 21.0 33.9 79.2 86.1 88.1 83.4 84.6 63.0 65.6 64.0 62.8 62.1Cnidaria 6.5 12.7 3.5 1.9 4.1 1.2 1.3 2.9 2.2 34.2 31.6 32.1 31.7 30.0Mollusca 1.3 0.2 0.0 0.2 0.7 0.2 0.1 0.1 0.4 0.4 0.7 0.3 0.4 0.0Annelida 1.6 43.1 0.0 0.0 0.2 0.2 0.4 0.6 0.3 0.1 0.4 0.3 0.8 1.8Arthropoda 1.2 0.5 14.1 39.8 2.2 0.5 0.6 0.1 0.5 0.0 0.1 0.0 0.0 0.3Echinodermata 8.5 0.6 35.5 22.4 9.1 7.8 7.2 10.0 9.2 0.8 0.7 1.8 2.6 1.8Bryozoa 0.2 0.5 0.0 0.0 0.1 0.0 0.0 0.0 0.2 0.0 0.0 0.5 0.5 0.3Vertebrata: Pisces 1.3 0.8 3.7 1.8 0.6 0.7 0.6 0.8 0.6 1.6 0.9 1.0 1.2 2.1
Table 2. Proportional abundance of each megafaunal phylum observed at Laggan (%). See Table 1 for definitions

Jones et al.: Faroe−Shetland Channel megafaunal recovery
found in Rdeep (Table 1). One group(R1, 2, 4, 8, 9, 10, 11, 12) was sampledin shallower water (562 to 610 m) andthe other (R3, 6, 7) in deeper water(634 to 637 m). All background imagesshow a hetero geneous seabed com-posed of fine sediments, gravel andoccasionally cobbles and boulders, butthe proportion of these visible grainsizes varied between samples. Mostsamples had a predominance of sandygravel, with cobbles and occasionalboulders. Samples R3 and R7 had avisible reduction in dominant sedi-ment grain size, confirmed in concur-rent sediment samples (see Table S2in the supplement at www.int-res.com/articles/suppl/m461p071_supp.pdf).
The survey of background sites wasdesigned to have 2 depth strata, with adivision at 600 m water depth. The preceding ana -lysis suggests that the faunal division was located a little deeper than predicted, between 610 and 634 m. This was important in subsequent analysis ofrecovery at the well sites. Site A (595 to 601 m) tran-sects were in the shallower zone and Site C (631 to640 m) transects were in the deeper zone. As a result,in subsequent analysis, Samples R1, 2, 4, 8, 9, 10, 11and 12 (collectively referred to as Rshallow; n = 8) wereconsidered to represent background samples forSite A and Samples R3, 6 and 7 (collectively referredto as Rdeep; n = 3) were considered to represent back-ground samples for Site C. Sediment properties(Table S2 in the supplement) were generally similarbetween the Rshallow and Rdeep zones. The exception tothis was the percentage of fine grains in the sedi-ment, which was significantly lower in Rshallow than inRdeep (t-test: t = −2.286, df = 10, p < 0.05). The Rshallow
and Rdeep zones had similar levels of organic matteras well as hydrocarbon and heavy metal contamina-tion (Table S2 in the supplement).
Environmental variation resulting from disturbance
In 2007, the environment beyond 100 m from thewell was visually similar to typical undisturbed areas.Within 100 m of previous drilling, disturbance wasvisible (Fig. 3) as obvious cuttings piles with fine sed-iments of a lighter colour than background and, closeto the drilling location, cement from the ‘plug-and-abandon’ phase of the drilling operations (Fig. 4,Fig. S1 in the supplement at www.int-res.com/
articles/suppl/m461p071_supp.pdf). At Site A in 2004,there was an often gradual transition between com-plete cuttings coverage and natural seabed (area ofcomplete cuttings 30 700 m2; area of complete andpartial cuttings >70 890 m2), with an extended area ofpartial cuttings (Jones et al. 2006). In this survey, theboundary between thick cuttings and typical seabedwas much more distinct at both sites. The areaimpacted by complete cuttings at A (area of completecuttings 5570 m2; area of complete and partial cut-tings 10 980 m2) had reduced from 2004 levels. Interms of distance, the extent of complete cuttings atA reduced to an average of 40 m from the drillinglocation, compared with 90 m in 2004. Conditions atSite C were similar to those found at A, with completecuttings extending from the drill location to 18 m onaverage (area of complete cuttings 920 m2; area ofcomplete and partial cuttings 2700 m2). The seabedwas smothered by cuttings to a maximum depth of1.5 m, although typically of a lesser thickness.
Response of megafaunal density
Motile faunal density (Fig. 5) was generally a smallpercentage of total density (mean 11.1% at Rshallow),but, taken alone, the densities of motile fauna werehighly variable between samples. There was a signif-icant influence of time since disturbance (year) onmotile megafaunal densities in the shallow samples(L-ratio = 25.226, df = 1, p < 0.001), with both lower(0−100 m zone) and higher (100−200 m zone) densi-ties in 2004 compared to 2007 surveys. The GLM
77
Fig. 3. Extent of complete (central dark grey area) and partial (light grey area)physical disturbance of the seabed at Laggan. Circles represent 50 m zonesradiating from the disturbance source. Filled circles represent final drilling
locations (point source of disturbance). A,C: sites

Mar Ecol Prog Ser 461: 71–82, 2012
revealed an interaction of time since disturbance anddistance in the shallow samples (L-ratio = 29.981, df =1, p < 0.001). In the shallow sites, motile organismdensities were much more consistent in 2007 than in2004, when density was very different between dis-tance zones. This is taken to provide evidence of par-tial recovery between 2004 and 2007 in motile organ-ism densities. Despite this, there was an influence ofthe distance (significant main effect) in both years (L-ratio = 151.361, df = 5, p < 0.001), with a generalincrease in density of motile fauna with increaseddistance (Fig. 5). There was a difference in motilemegafaunal density between the shallow and deepwater samples (L-ratio = 17.470, df = 1, p < 0.001),with generally greater densities of motile megafaunain the shallow samples. There was no significantinteraction between the distance from drilling and
the depth zone (L-ratio = 3.067, df = 5,not significant [ns]).
Sessile fauna made up the majorityof organisms found at Laggan (Fig. 5).There was a significant influence oftime since disturbance on shallow ses-sile megafaunal densities (L-ratio =140.803, df = 1, p < 0.001), with in -creases in density in 2007 comparedwith 2004 surveys in the shallow sam-ples. The GLM revealed an interactionof time since disturbance and dis-tance in the shallow samples (L-ratio =11.373, df = 1, p < 0.001). An increasedtime since drilling in the shallow sam-ples led to greater densities of sessileorganisms closer to the site of drilling,suggesting partial recovery between2004 and 2007 in the den sities of ses-sile megafauna. There was a weak in -fluence of distance (model with 2004and 2007 data) (L-ratio = 14.973, df = 5,p < 0.05), revealing that densities ofsessile organisms increased with in -creased distance from drilling in allsamples investigated. There was a sig-nificant interaction between distanceand depth zone (L-ratio = 49.349, df = 5,p < 0.001), and the density of sessilebenthic megafauna in creased withincreasing distance to a greater extentin shallow water than deep. This pro-vides some evidence that there hadbeen higher recovery in sessile benthicmegafaunal densities after 10 yr thanafter 3. The model suggests that there
were significantly higher sessile megafaunal den -sities in the deeper samples compared with those fromshallower water (L-ratio = 58.189, df = 1, p < 0.001).
Response of megafaunal diversity
There were fewer motile taxa than sessile taxa atLaggan and the richness of motile taxa was less vari-able between sites (Table 3). The richness of motileorganisms was not significantly different betweenthe shallow and deep sites (L-ratio = 0.028, df = 1, ns).Taxon richness in the shallow samples was virtuallyidentical between 2004 and 2007 within a distancezone (Table 3). There was a significant main effect ofdistance on richness of motile organisms (L-ratio =39.067, df = 5, p < 0.001), and richness increased with
78
Fig. 4. Example images of disturbance regime at Laggan. (A) Seabed next tothe blow-out preventer showing cuttings and Lycodes esmarkii, (B) area ofcomplete cuttings and exposed cement, (C) complete cuttings area with rip-ples, (D) edge of cuttings, (E) normal seabed with gravel and pebbles, encrust-ing sponges and Stylocordyla borealis, (F) large iceberg-rafted boulder onnormal seabed with Brosme brosme (species not seen on transect video). Scale
bar = approximately 100 mm on the seafloor at its location

Jones et al.: Faroe−Shetland Channel megafaunal recovery 79
distance from drilling in all samples. There was a sig-nificant interaction of distance zone and year in therichness of motile fauna in the shallow samples (L-ratio = 5.77, df = 1, p < 0.001). Although richnessof motile taxa was lower on average in samplesfrom the 0−100 m zone in 2004 (Smean motile = 2.8)than in 2007 (Smean motile = 3.8), sample richness in
the 100−200 m zone was higher in2004 (Smean motile = 7.0) than in 2007(Smean motile = 5.3). There was no sig -nificant interaction of distance anddepth group (L-ratio = 3.185, df = 5,ns), suggesting that motile organismsdid not recolonise the disturbed areasany more after 3 yr than after 10 yr ofrecovery time.
Taxon richness of sessile taxa var-ied between 6 and 28 (Table 3). Therewas a significant main effect of timesince drilling on richness of sessiletaxa (L-ratio = 156.084, df = 1, p <0.001), and taxon richness in the shal-low samples was significantly lowerin 2004 than in 2007. Richness of ses-sile organisms was lowest close to thewell immediately after drilling (2004A 0−100 m Ssessile = 6). Richness of sessile organisms increased with dis-tance from drilling in all samples (L-ratio = 19.716, df = 5, p < 0.01).
Both distance zones in 2004 had lower richness ofsessile megafauna than Rshallow and any of the 2007 Azones (Table 3), supporting major reduction in sessiletaxon richness as a result of drilling. In the zone clos-est to the well (0−100 m) in 2007, richness of sessileorganisms (Ssessile) had increased nearly 4 times from2004 levels. This area still had significantly lower
Fig. 5. Densities (no. m−2) of sessile and motile fauna under different disturbance regimes at Laggan. Error bars represent standard deviations. See Table 1 for definitions
n Density (no. m−2) Ssessile Smotile H ’ J ’
Rshallow 8 1.19 ± 0.02 28 14 2.97 0.79Rdeep 3 4.41 ± 0.63 28 9 2.30 0.632004 A: 0−100 18 0.09 ± 0.08 6 10 2.23 0.812004 A: 100−200 18 0.94 ± 0.43 10 12 1.93 0.622007 A: 0−100 8 1.01 ± 0.43 22 10 2.71 0.782007 A: 100−200 8 2.03 ± 0.40 22 13 2.63 0.742007 A: 200−300 8 2.20 ± 0.50 22 15 2.64 0.732007 A: 300−400 8 2.01 ± 0.76 25 13 2.64 0.722007 A: 400−500 8 1.73 ± 0.73 23 14 2.68 0.742007 C: 0−100 4 3.09 ± 1.05 24 9 2.27 0.662007 C: 100−200 4 2.47 ± 1.00 26 9 2.31 0.662007 C: 200−300 4 2.15 ± 0.49 24 11 2.52 0.722007 C: 300−400 4 2.41 ± 0.74 24 13 2.46 0.682007 C: 400−500 4 2.56 ± 0.82 26 16 2.59 0.70
Table 3. Variations in megafaunal species density and diversity measuresaround the Laggan site: density: no. m−2, mean ± SD; total taxa observed: Ssessile = total number of unique sessile taxa in sample, Smotile = total number ofunique motile taxa in sample; H ’ = Shannon-Wiener index [loge]; J ’ = Pielou’sevenness. H ’ included to provide comparison with other literature. All diver-sity indices were calculated from total numbers of each taxon for each station(i.e. several sampling units). S is not adjusted for sampling effort. See Table 1
for other definitions

Mar Ecol Prog Ser 461: 71–82, 2012
richness than either Rshallow or the areas further fromdisturbance in 2007 (Table 3), indicating incompleterecovery. None of the sessile taxa missing from the2007 A 0−100 m zone but present in Rshallow werecommon in Rshallow (Table 1). There was a significantinteraction of distance and year (L-ratio = 23.212, df =1, p < 0.001), and in the shallow samples, increasedtime since drilling led to greater richness of sessileorganisms closer to the site of drilling. There was nosig nificant interaction of distance and depth group (L-ratio = 2.021, df = 5, ns).
Evenness (measured by J ’) was similar betweensamples taken in 2007 (Table 3). The 2004 samples at0−100 m from drilling had the highest evenness (J ’ =0.81). This was higher than the 2004 A 100−200 msamples, which had the lowest evenness (J ’ = 0.62).Evenness was higher at Rshallow (J ’ = 0.79) than atRdeep (J ’ = 0.63). There were no significant differ-ences in evenness with any of the explanatory vari-ables investigated.
DISCUSSION
Community heterogeneity at Laggan
The megafaunal assemblage at Laggan was spa-tially variable; at least 2 major assemblage typeswere identified. The high spatial variability of theFaroe−Shetland Channel makes assessment of thepotential environmental impact of developmentsmore difficult. Water depth and proportion of finesediments were shown to be important for struc-turing assemblages in background sites here andin other studies in the Faroe−Shetland Channel(Bett 2001, Jones et al. 2007a) and elsewhere (Tec-chio et al. 2011). The variable temperature gradientin the Faroe−Shetland Channel (Turrell et al. 1999)may have exposed the shallow sites to higher tem-peratures than the deeper sites. Extreme bottomwater temperature variation appears to be limitedto <600 m depth in this area (Turrell et al. 1999).Deeper than approximately 600 m, continually coldconditions, characteristic of Faroe−Shetland Chan-nel bottom water, persist (Turrell et al. 1999). Inthe Laggan region this boundary was probablyslightly deeper than suggested. Most identifiedtaxa were Arctic forms, typical of the deep Faroe−Shetland Channel (Jones et al. 2007a), NorwegianSea (Dahl et al. 1976) and higher latitude areas(Mayer & Piepenburg 1996, Piepenburg & Schmid1996, Starmans et al. 1999, Piepenburg et al.2001).
Effects of disturbance on megafauna
At Laggan, the initial disturbance by physicalsmothering and burial of organisms was severewithin 100 m of drilling activity, as observed for otherforms of physical smothering disturbance (Stronk -horst et al. 2003). Outside the area of complete distur-bance, megafaunal taxa responded differently to dis-turbance, likely dependant on a complex interactionof factors including feeding mode, motility, particleremoval rate and rate of sedimentation (Nichols et al.1978). Mobile scavengers, such as Atlantopandaluspropinqvus and Pagurus sp., moved back into thearea quickly to feed on moribund organisms. At thispoint, there was a relatively wide impacted area,where seabed disturbance was visible as fine sedi-ment on the seafloor up to at least 250 m from thedrilling activity.
Removal of cuttings at Laggan probably took placeover time by lateral advection during high currentevents (velocities up to 1 m s−1; Masson et al. 2004)and from vertical redistribution in the sedimentsfrom bioturbation by abundant infaunal deposit feed-ers (Total E & P UK pers. comm.). After 3 yr, there wassignificant removal of cuttings from those initiallydeposited, particularly in the areas with relativelylow initial deposition.
After 3 yr, faunal density within 100 m of the wellhad increased considerably and was no longer signif-icantly different from conditions further away. Motilemegafauna were no longer elevated close to drilling.This response occurs rapidly in shallow water mega -fauna after disturbance from fishing (Ramsay et al.1998). Slow recovery of megafauna appears typicalfrom the limited studies in both hard (Althaus et al.2009) and soft substrata (Bluhm 2001) in the deepoceans. Deep-sea invertebrates are long-lived andslow growing (e.g. Gage 1991, Tracey et al. 2007), sosessile fauna may take a long time to reach megafau-nal sizes after recolonisation. Only 2 species found atLaggan have published growth rates, both mobileanimals from the nearby, but warmer, RockallTrough. It took at least 10 yr for a echinoid found atLaggan, Echinus elegans, to reach 50 mm test dia -meter (Gage et al. 1986) and at least 5 yr for an ophi-uroid, Ophiocten gracilis, common in samples at Laggan (and therefore probably included in the ‘in -determinate ophiuroids’ enumerated on video) toreach a disc diameter of 7 mm (Gage 2003), whichequates to approximately 50 mm total diameter(including arms). More detailed studies are requiredto determine the source of recruits to areas disturbedby drilling activity.
80

Jones et al.: Faroe−Shetland Channel megafaunal recovery
The 2007 A 0–100 m samples showed that therewere still megafaunal taxa that were displaced bydisturbance, but the relative proportion of taxa wasnot clearly affected. As overall density of sessileorganisms was low and only rarer taxa were absentfrom the more disturbed area in 2007, the reducedrichness observed may have resulted from the re -duced probability of sampling the rarer taxa (Magur-ran 2003). In 2007, the boulders that had harbouredthe majority of the organisms in the disturbed zonesin 2004 (Jones et al. 2006) were observed again; how-ever, they were no longer supporting an epilithiccommunity, suggesting a chronic and ultimatelylethal effect of either physical smothering from theinitial sedimentation event (Nichols et al. 1978) orchemical influence from the drill cuttings (Terzaghiet al. 1998, Trannum et al. 2010).
After 10 yr at C, seabed disturbance was still visibleclose to the well and appeared similar to that found atA after 3 yr. This suggests a proportion of the de -posited cuttings were resistant to erosion, probablyowing to the presence of cement. There was still lim-ited megafaunal recolonisation in this area. How-ever, within 10 m of the disturbed area, there was anabundant, diverse megafaunal community, not read-ily distinguishable from that found over 100 m fromthe drilling location. A similar response occurredin the DISCOL deep-sea disturbance experiment(Bluhm 2001), where soft sediment megafaunal re -covery was evident after 7 yr, although there werestill small differences in the taxonomic and numericalcomposition of megafauna. There were probably alsosome species-specific responses to observed variablesediment levels and chemical concentrations foundaround the drilling location at Laggan (e.g. elevatedbarium was found in some samples near to Well Aand C in 2007, Total E & P UK pers. comm.), but theheterogeneous seabed, irregular chemical distribu-tion and naturally highly variable megafauna makethese subtle effects difficult to distinguish.
Disturbance from drilling is known to affect thefunctioning of benthic communities (Schaanning etal. 2008, Trannum et al. 2010). Species diversity anddensity of the megafaunal assemblage likely corre-late with the ecosystem functions they provide(Danovaro et al. 2008), suggesting little appreciablechange in function beyond 100 m from the distur-bance. It would be extremely valuable to evaluatefunctional changes beyond these generalisations.Some sessile taxa, particularly the sponges, may besuitable as species indicating functional recovery of agiven area in space and time. The best specific exam-ple of this is the spherical sponge, which is conspicu-
ous and occurs at high densities in areas with low dis-turbance. Although their abundance decreased, theywere not completely absent in disturbed areas. Fur-ther work is also required to understand potentialfunctional change within smaller size fractions of thebenthos (e.g. the bacteria, meio- and macrofauna),which may differ from the megafauna in their re -sponse to disturbance. Recovery potential fromanthropogenic disturbance in the deep sea remainsrelatively un known. Further study, using high-reso-lution metho dologies, of community patterns and theecology of key deep-water species is required atbackground sites as anthropogenic activity in thedeep-sea realm continues to increase.
CONCLUSIONS
This study indicates that deep-water megafaunaldensity and diversity recovers partially from drillingdisturbance after 3 yr. However, al though there isincreased recovery after 10 yr, drill cuttings and asso-ciated impacts on epibenthic mega faunal assem-blages are still distinguishable after a decade. Mega -fauna may recover more slowly than the morecommonly studied smaller infauna. Carefully de -signed, high-resolution and multi-year studies, suchas this, are rare but essential to further our under-standing of recovery from anthropogenic impact.
Acknowledgements. We thank Total E & P UK and the TotalCorporate Foundation for Biodiversity and the Sea for host-ing this work and providing valuable assistance throughout.Thanks also to Fugro and the staff of the MV ‘Fugro Merca-tor’ for assistance at sea. Particular thanks to I. Park,W. Brown, P. Collins and A. Hughes for help. This documentwas improved with constructive comments from B. Bett,D. Mayor, B. Wigham and 3 anonymous reviewers. Thework was carried out as part of the SERPENT and DIEPS(Deep-water Industry, Environment, Policy and Science)projects. D.O.B.J. was funded by NERC DIEPS grantNE/C508518/1 and as part of the NERC Marine Environ-mental Mapping Programme (MAREMAP). SERPENT wasfunded for this work by a grant from the Total CorporateFoundation for Biodiversity and the Sea.
LITERATURE CITED
Althaus F, Williams A, Schlacher TA, Kloser RJ and others(2009) Impacts of bottom trawling on deep-coral ecosys-tems of seamounts are long-lasting. Mar Ecol Prog Ser397: 279−294
Bett BJ (2001) UK Atlantic margin environmental survey: Introduction and overview of bathyal benthic ecology.Cont Shelf Res 21: 917−956
Bluhm H (2001) Re-establishment of an abyssal megaben-thic community after experimental physical disturbanceof the seafloor. Deep-Sea Res II 48: 3841−3868
81

Mar Ecol Prog Ser 461: 71–82, 2012
Dahl E, Laubier L, Sibuet M, Stroemberg JO (1976) Somequantitative results on benthic communities of the deepNorwegian Sea. Astarte 9: 61−79
Danovaro R, Gambi C, Dell’Anno A, Corinaldesi C and oth-ers (2008) Exponential decline of deep-sea ecosystemfunctioning linked to benthic biodiversity loss. Curr Biol18: 1−8
Dobson AJ, Barnett AG (2008) An introduction to general-ized linear models. Chapman & Hall, London
Fox J, Weisberg S (2011) An {r} companion to appliedregression, second edition. Sage, Thousand Oaks, CA
Gage JD (1991) Biological rates in the deep sea: a perspec-tive from studies on processes in the benthic boundarylayer. Rev Aquat Sci 5: 49−100
Gage JD (2003) Growth and production of Ophiocten gra-cilis (Ophiuroidea: Echinodermata) on the Scottish conti-nental slope. Mar Biol 143: 85−97
Gage JD, Tyler PA, Nichols D (1986) Reproduction andgrowth of Echinus acutus var norvegicus Duben and Ko-ren and Echinus elegans Duben and Koren on the conti-nental slope off Scotland. J Exp Mar Biol Ecol 101: 61−83
Hughes SJM, Jones DOB, Hauton C, Gates AR, Hawkins LE(2010) An assessment of drilling disturbance on Echinusacutus var. norvegicus based on in-situ observations andexperiments using a remotely operated vehicle (ROV).J Exp Mar Biol Ecol 395: 37−47
Jones DOB (2009) Using existing industrial remotely oper-ated vehicles for deep-sea science. Zool Scr 38: 41−47
Jones DOB, Gates AR (2010) Deep-sea life of Scotland andNorway. Ophiura, Southampton
Jones DOB, Hudson IR, Bett BJ (2006) Effects of physical dis-turbance on the cold-water megafaunal communities of theFaroe−Shetland Channel. Mar Ecol Prog Ser 319: 43−54
Jones DOB, Bett BJ, Tyler PA (2007a) Megabenthic ecologyof the Faroe−Shetland Channel: a photographic study.Deep-Sea Res I 54: 1111−1128
Jones DOB, Wigham BD, Hudson IR, Bett BJ (2007b)Anthropogenic disturbance of deep-sea megabenthicassemblages: a study with remotely-operated vehicles inthe Faroe−Shetland Channel, NE Atlantic. Mar Biol 151: 1731−1741
Magurran AE (2003) Measuring biological diversity. Black-well Science, Oxford
Masson DG, Wynn RB, Bett BJ (2004) Sedimentary environ-ment of the Faroe-Shetland and Faroe Bank Channels,north-east Atlantic, and the use of bedforms as indicatorsof bottom current velocity in the deep ocean. Sedimen-tology 51:1207-1241
Mayer M, Piepenburg D (1996) Epibenthic community pat-terns on the continental slope off east Greenland at75° N. Mar Ecol Prog Ser 143: 151−164
Narayanaswamy BE, Bett BJ, Gage JD (2005) Ecology ofbathyal polychaete fauna at an Arctic−Atlantic boundary(Faroe−Shetland Channel, north-east Atlantic). Mar BiolRes 1: 20−32
Nichols JA, Rowe GT, Clifford CH, Young RA (1978) In situexperiments on the burial of marine invertebrates.J Sedi ment Petrol 48: 419−425
O‘Neill R (1998) Recovery in complex ecosystems. J AquatEcosyst Stress Recovery 6: 181−187
Piepenburg D, Schmid MK (1996) Distribution, abundance,biomass, and mineralization potential of the epibenthicmegafauna of the Northeast Greenland shelf. Mar Biol125: 321−332
Piepenburg D, Brandt A, von Juterzenka K, Mayer M andothers (2001) Patterns and determinants of the distribu-tion and structure of benthic faunal assemblages in thenorthern North Atlantic. In: Schafer P, Ritzrau M, Schlu -ter M, Thiede J (eds) The northern North Atlantic: achanging environment. Springer, Berlin, p 179−198
R Development Core Team (2010) R: A language and envi-ronment for statistical computing. R Foundation for Sta-tistical Computing, Vienna www.R-project.org
Radler M (2006) Oil production, reserves increase slightly in2006. Oil Gas J 104: 20−23
Ramsay K, Kaiser MJ, Hughes RN (1998) Responses of ben-thic scavengers to fishing disturbance by towed gears indifferent habitats. J Exp Mar Biol Ecol 224: 73−89
Santos MFL, Lana PC, Silva J, Fachel JG, Pulgati FH (2009)Effects of non-aqueous fluids cuttings discharge fromexploratory drilling activities on the deep-sea macroben-thic communities. Deep-Sea Res II 56: 32−40
Schaanning MT, Trannum HC, Øxnevad S, Carroll J, BakkeT (2008) Effects of drill cuttings on biogeochemical fluxesand macrobenthos of marine sediments. J Exp Mar BiolEcol 361: 49−57
Sherwin T (1995) Tidal oscillations of the thermocline in theFaroe−Shetland Channel. Ocean Challenge 6: 33−35
Smith CR, Hamilton SC (1983) Epibenthic megafauna of abathyal basin off southern California: Patterns of abun-dance, biomass, and dispersion. Deep-Sea Res 30: 907−928
Starmans A, Gutt J, Arntz WE (1999) Mega-epibenthic com-munities in Arctic and Antarctic shelf areas. Mar Biol135: 269−280
Stronkhorst J, Ariese F, van Hattum B, Postma JF and others(2003) Environmental impact and recovery at two dump-ing sites for dredged material in the North Sea. EnvironPollut 124: 17−31
Tecchio S, Ramírez-Llodra E, Sardà F, Company JB and oth-ers (2011) Drivers of deep Mediterranean megabenthoscommunities along longitudinal and bathymetric gradi-ents. Mar Ecol Prog Ser 439: 181−192
Terzaghi C, Buffagni M, Cantelli C, Bonfanti P, Camatini M(1998) Physical-chemical and ecotoxicological evaluationof water based drilling fluids used in Italian off-shore.Chemosphere 37: 2859−2871
Thomson CW (1873) The depths of the sea. MacMillan, London
Tracey DM, Neil H, Marriott P, Andrews AH, Cailliet GM,Sanchez JA (2007) Deep-sea scleractinian coral age anddepth distributions in the northwest Atlantic for the last225,000 years. Bull Mar Sci 81: 371−391
Trannum HC, Nilsson HC, Schaanning MT, Øxnevad S(2010) Effects of sedimentation from water-based drillcuttings and natural sediment on benthic macrofaunalcommunity structure and ecosystem processes. J ExpMar Biol Ecol 383: 111−121
Turrell WR, Slesser G, Adams RD, Payne R, Gillibrand PA(1999) Decadal variability in the composition of Faroe−Shetland Channel bottom water. Deep-Sea Res I 46: 1−25
Underwood AJ (1994) On beyond BACI: sampling designsthat might reliably detect environmental disturbances.Ecol Appl 4: 3−15
Witbaard R, Daan R, Mulder M, Lavaleye M (2005) The mol-lusc fauna along a depth transect in the Faroe ShetlandChannel: Is there a relationship with internal waves?Mar Biol Res 1: 186−201
82
Editorial responsibility: Paul Snelgrove, St. John’s, Newfoundland and Labrador, Canada
Submitted: January 27, 2012; Accepted: May 21, 2012Proofs received from author(s): August 1, 2012