Light-Induced Plasmon-Assisted Phase Transformation of...
11
www.afm-journal.de FULL PAPER © 2012 WILEY-VCH Verlag GmbH & Co. KGaA, Weinheim 2129 www.MaterialsViews.com wileyonlinelibrary.com Adv. Funct. Mater. 2012, 22, 2129–2139 Dhaval D. Kulkarni, Songkil Kim, Andrei G. Fedorov, and Vladimir V. Tsukruk* 1. Introduction Light-induced transformation of materials is a common phenomenon observed in our day-to-day life for generating energy to sustain life processes. [1,2] Over the years, studies on light–matter interactions have led to the discovery of many light-induced reactions such as photoisomerization, [3] photo- polymerization, [4] and photoionization [5] . Also, light-based phenomena, such as the photoelectric effect, [6] photomagnetic effect, [7] photoacoustic effect, [8] and photothermal effect, [9] have made their way into many device applications. In fact, photo- thermal phenomena at the nanoscale have been studied in the efforts to develop and control biochemical reactions, [10,11,12,13] induce photomechanical actuation, [14] manipulate the precise growth of nanostructures, [15] improve the efficiency of heteroge- neous catalysis, [16,17] and for therapeutic applications. [18,19] This area can also open up opportunities to bring about controlled and localized heating with nanoscale pre- cision for inducing confined phase tran- sitions in different materials, such as patterning graphene oxide with conductive domains. [20] With the miniaturization of electronic devices, these methods can be used to develop complex phase intercon- nect architectures for the semiconductor applications. Electron beam induced deposition (EBID) has been used for the nanoscale growth of amorphous carbon and metals, with complex 2D and 3D geometries. [21] These deposits can be fabricated over rela- tively small areas, making it important for nanoscale fabrication of interconnect arrays. [22,23] In fact, these deposits have been known to act as a good soldering material for improving the mechanical contact between heterogeneous materials (e.g., metal/metal or metal/semiconductor interfaces). [24] However, as deposited EBID carbon is amorphous, with significant hydrogen content and low electrical conductivity. [25] Thus, post-deposition treatment is required for dehydrogenation and directed phase transforma- tion into the electrically conductive graphitic phase for its use as a soldering material in electronic devices. [26] Amorphous carbon composed of both sp 2 and sp 3 carbon bonds is known for its high chemical stability, optical transparency, and excel- lent mechanical properties, thereby making it important in areas of protective coatings and optoelectronics. [27–30] Conduc- tive carbon nanostructures can be achieved by tuning the rela- tive sp 2 /sp 3 content and nanostructure morphologies. Different methods have been used to transform amorphous carbon films into graphitic structures. Thermal annealing at high tempera- tures has been commonly exploited for inducing the formation of electrically conductive graphitic nanostructures. Recently, we showed that the phase transformation in nano- scale EBID amorphous carbon deposits takes place between 100 and 400 °C. [23] It has been observed that at lower temperature, stress relaxation and dehydrogenation take place, followed by partial graphitization and formation of a disordered graphitic phase at temperatures above 300 °C. However, these transfor- mations involve subjecting the entire substrate to high tem- peratures and are relatively slow, thereby limiting their use to several applications including fabrication of electronic devices. As is known, bulk carbon materials can absorb light more effi- ciently and have been known to ignite or show a strong thermal emission upon excitation. [31,32] However, nanoscale carbon deposits with sub-micrometer dimensions cannot be directly Light-Induced Plasmon-Assisted Phase Transformation of Carbon on Metal Nanoparticles Highly localized light-induced phase transformation of electron beam induced deposited carbon nanostructures (dots and squares) on noble metal surfaces is reported. The phase transformation from the amorphous phase to the disordered graphitic phase is analyzed using the characteristic Raman sig- natures for amorphous and graphitized carbon and conductive force micro- scopy. The extent of the transformation is found to be largely dependent on the plasmon absorption properties of the underlying metal film. It is observed that the amorphous carbon deposits on the silver films consisting of 12 nm particles with the plasmon absorption near the laser excitation wavelength (514 nm), undergo fast graphitization to a nanocrystalline or a disordered graphitic phase. This transformation results in the formation of a highly conductive carbon/metal interface with at least seven orders of magnitude lower electrical resistivity than the initial insulating interface. It is suggested that the fast graphitization of nanoscale carbon deposits might serve as an efficient path for the formation of complex patterned nanoscale metal-carbon interconnects with high electrical conductivity. DOI: 10.1002/adfm.201102665 D. D. Kulkarni, Prof. V. V. Tsukruk School of Materials Science and Engineering Georgia Institute of Technology Atlanta, GA 30332-0245, USA E-mail: [email protected] S. K. Kim, Prof. A. G. Fedorov Woodruff School of Mechanical Engineering Georgia Institute of Technology Atlanta, GA 30332-0245, USA
Transcript of Light-Induced Plasmon-Assisted Phase Transformation of...

www.afm-journal.de
FULL P
APER
www.MaterialsViews.com
Dhaval D. Kulkarni , Songkil Kim , Andrei G. Fedorov , and Vladimir V. Tsukruk *
Light-Induced Plasmon-Assisted Phase Transformation of Carbon on Metal Nanoparticles
Highly localized light-induced phase transformation of electron beam induced deposited carbon nanostructures (dots and squares) on noble metal surfaces is reported. The phase transformation from the amorphous phase to the disordered graphitic phase is analyzed using the characteristic Raman sig-natures for amorphous and graphitized carbon and conductive force micro-scopy. The extent of the transformation is found to be largely dependent on the plasmon absorption properties of the underlying metal fi lm. It is observed that the amorphous carbon deposits on the silver fi lms consisting of 12 nm particles with the plasmon absorption near the laser excitation wavelength (514 nm), undergo fast graphitization to a nanocrystalline or a disordered graphitic phase. This transformation results in the formation of a highly conductive carbon/metal interface with at least seven orders of magnitude lower electrical resistivity than the initial insulating interface. It is suggested that the fast graphitization of nanoscale carbon deposits might serve as an effi cient path for the formation of complex patterned nanoscale metal-carbon interconnects with high electrical conductivity.
1. Introduction
Light-induced transformation of materials is a common phenomenon observed in our day-to-day life for generating energy to sustain life processes. [ 1 , 2 ] Over the years, studies on light–matter interactions have led to the discovery of many light-induced reactions such as photoisomerization, [ 3 ] photo-polymerization, [ 4 ] and photoionization [ 5 ] . Also, light-based phenomena, such as the photoelectric effect, [ 6 ] photomagnetic effect, [ 7 ] photoacoustic effect, [ 8 ] and photothermal effect, [ 9 ] have made their way into many device applications. In fact, photo-thermal phenomena at the nanoscale have been studied in the efforts to develop and control biochemical reactions, [ 10 , 11 , 12 , 13 ] induce photomechanical actuation, [ 14 ] manipulate the precise growth of nanostructures, [ 15 ] improve the effi ciency of heteroge-neous catalysis, [ 16 , 17 ] and for therapeutic applications. [ 18 , 19 ] This area can also open up opportunities to bring about controlled
© 2012 WILEY-VCH Verlag GmbH & Co. KGaA, WeinheimAdv. Funct. Mater. 2012, 22, 2129–2139
DOI: 10.1002/adfm.201102665
D. D. Kulkarni , Prof. V. V. Tsukruk School of Materials Science and EngineeringGeorgia Institute of Technology Atlanta, GA 30332-0245, USA E-mail: [email protected] S. K. Kim , Prof. A. G. Fedorov Woodruff School of Mechanical EngineeringGeorgia Institute of Technology Atlanta, GA 30332-0245, USA
and localized heating with nanoscale pre-cision for inducing confi ned phase tran-sitions in different materials, such as patterning graphene oxide with conductive domains. [ 20 ] With the miniaturization of electronic devices, these methods can be used to develop complex phase intercon-nect architectures for the semiconductor applications.
Electron beam induced deposition (EBID) has been used for the nanoscale growth of amorphous carbon and metals, with complex 2D and 3D geometries. [ 21 ] These deposits can be fabricated over rela-tively small areas, making it important for nanoscale fabrication of interconnect arrays. [ 22 , 23 ] In fact, these deposits have been known to act as a good soldering material for improving the mechanical contact between heterogeneous materials (e.g., metal/metal or metal/semiconductor interfaces). [ 24 ] However, as deposited EBID
carbon is amorphous, with signifi cant hydrogen content and low electrical conductivity. [ 25 ] Thus, post-deposition treatment is required for dehydrogenation and directed phase transforma-tion into the electrically conductive graphitic phase for its use as a soldering material in electronic devices. [ 26 ] Amorphous carbon composed of both sp 2 and sp 3 carbon bonds is known for its high chemical stability, optical transparency, and excel-lent mechanical properties, thereby making it important in areas of protective coatings and optoelectronics. [ 27 – 30 ] Conduc-tive carbon nanostructures can be achieved by tuning the rela-tive sp 2 /sp 3 content and nano structure morphologies. Different methods have been used to transform amorphous carbon fi lms into graphitic structures. Thermal annealing at high tempera-tures has been commonly exploited for inducing the formation of electrically conductive graphitic nanostructures.
Recently, we showed that the phase transformation in nano-scale EBID amorphous carbon deposits takes place between 100 and 400 ° C. [ 23 ] It has been observed that at lower temperature, stress relaxation and dehydrogenation take place, followed by partial graphitization and formation of a disordered graphitic phase at temperatures above 300 ° C. However, these transfor-mations involve subjecting the entire substrate to high tem-peratures and are relatively slow, thereby limiting their use to several applications including fabrication of electronic devices. As is known, bulk carbon materials can absorb light more effi -ciently and have been known to ignite or show a strong thermal emission upon excitation. [ 31 , 32 ] However, nanoscale carbon deposits with sub-micrometer dimensions cannot be directly
2129wileyonlinelibrary.com

FULL
PAPER
2130
www.afm-journal.dewww.MaterialsViews.com
Figure 1 . AFM images showing the morphology and sectional analysis of different fi lms: a) silicon substrate, b) gold fi lm, and c) silver fi lm. The z -scale is 20 nm for all the images.
Scheme 1 . EBID amorphous carbon nanostructures (grey blocks) fabri-cated on substrates with different composition (silicon, gold, and silver) and surface morphologies and their physical state upon exposure to a 514 nm laser source.
employed for light-induced transformations because these structures are light transparent and most of the incident light is not absorbed if special designs are not implemented.
One of the approaches is the exploitation of metal nano-structures to induce local heating at metal/carbon interfaces. Indeed, noble metal nanostructures exhibit a strong absorp-tion in the visible region because of the surface plasmon reso-nances in response to the external electromagnetic radiation. [ 33 ] This strong light absorption causes a local increase in the temperature of the nanoparticles and can increase the rate of photochemical reaction. [ 16 ] Recently, the heat generated by surface plasmons was utilized for bringing about rippling of polymer surfaces and for inducing phase transformations. [ 34 – 36 ] Brongersma et al. showed a localized photothermal growth of carbon nanotubes and silicon nanowires on metal nanoparticles exposed to a focused light beam. [ 15 ]
Here, we demonstrate a fast and highly localized phase trans-formation of amorphous carbon deposits on nanoparticulate metal fi lms without global thermal treatment and the subse-quent improvements in the deposited carbon’s electrical conduc-tivity. We highlight the critical role of surface plasmons excited by the laser source in bringing about a large local increase in the temperature, suffi cient to induce graphitization of amor-phous carbon deposits and quickly convert them to disordered graphitic phase. The annealing kinetics of the carbon deposits on different metal fi lms clearly demonstrates the role of the substrate on the carbon nanodeposit phase transformation.
In this study, EBID was used to make 0D (dots) and 2D (square) carbon nanostructures on a silicon substrate, a gold fi lm, and a silver fi lm. The change in the composition and microstructure of the deposits on different substrates after exposure to the incident light at 514 nm was evaluated using Raman spectroscopy. Also, the effect of the localized heating on the morphology of the substrate was analyzed using atomic force microscopy (AFM). Furthermore, to confi rm the increase in electrical conductivity of these deposits associated with the amorphous to graphitic phase transition, conductive force microscopy (CFM) imaging was used to contrast the enhanced electrical conductivity of regions of the carbon deposits selec-tively exposed to laser irradiation from the unexposed regions.
2. Results and Discussion
2.1. Metal Nanostructures
Three different common substrates were utilized for this study: silicon (Si) wafer, gold (Au) fi lm, and silver (Ag) fi lm (see Exper-imental Section). Figure 1 shows topographical AFM images of these substrates along with their corresponding cross-sections. Bare silicon and gold fi lms appear to be relatively smooth with a root mean square (RMS) microroughness of 0.17 nm and 0.51 nm, respectively, over a surface area of 1 μ m 2 (Figure 1 a,b). In con-trast, silver fi lm show a signifi cantly rough surface with an RMS roughness of 3.6 nm and dense granular morphology with nanoparticles measured to be 12 ± 0.9 nm in diameter (Figure 1 c). The gold fi lm shows the presence of continuous island-like morphology.
wileyonlinelibrary.com © 2012 WILEY-VCH Verlag G
2.2. EBID Deposit Fabrication
After analyzing the surface morphology of different substrates, EBID carbon deposits of similar shapes and sizes were deposited over these substrates ( Scheme 1 ). The schematic shows the for-mation of selected areas with graphitized carbon within carbon fi lms on substrates with different morphologies, as will be dis-cussed in detail. Electron beam focused at a spot for a prolonged period of time leads to the formation of dot-like structures from residual hydrocarbons (“contamination”) as a precursor. Scan-ning electron microscopy (SEM) images of deposits upon tilting the substrate at 45 ° with respect to the electron beam reveal a pillar like morphology for the dots ( Figure 2 a). Although the substrate would have an infl uence on the morphology of the EBID deposits because of the difference in the secondary elec-tron yield and surface diffusion coeffi cient, the dimensions of the deposits on the different substrates were within ± 200 nm.
mbH & Co. KGaA, Weinheim Adv. Funct. Mater. 2012, 22, 2129–2139

FULL P
APER
www.afm-journal.dewww.MaterialsViews.com
Figure 2 . Morphology of the EBID carbon deposit. a) SEM image obtained at 45 ° viewing showing an array of carbon deposits, b) AFM image of one of the carbon deposit ( z -scale: 1.5 μ m), c) corresponding 3D image showing its pillar-like morphology ( z -scale: 1.5 μ m), and d) sectional analysis.
The size and structure of the EBID carbon deposits over dif-ferent substrates were quantifi ed using AFM imaging. Figure 2 b shows the AFM image of the dots along with the corresponding 3D image (Figure 2 c) and cross-sectional profi le (Figure 2 d). 3D image of the dots also reveals a pillar-like morphology in agree-ment with the SEM image (Figure 2 a). The height of the dots is approximately 1.2 ± 0.2 μ m and their width is 0.72 ± 0.15 μ m for an electron beam exposure time of 10 min. The shape and size of the deposits can be varied by adjusting the SEM deposition settings and exposure time, as has been discussed in detail elsewhere. [ 25 ]
2.3. Phase Composition
The intrinsic physical state of the carbon deposits was analyzed from the Raman spectra collected from individual carbon struc-tures using confocal Raman micromapping under minimum laser power ( < 1 mW) to avoid any laser-induced heating. All carbon materials show characteristic D-bands and G-bands between 1350–1380 cm − 1 and 1560–1590 cm − 1 , respectively, which relate to the sp 2 and sp 3 content of the system. [ 37 , 38 ] Generally, the Raman spectra of carbon materials are dominated by the sp 2 sites because of their higher scattering cross-section. [ 39 ] Thus, depending on the peak positions and the intensity ratio of these bands, the micro-structure of the material can be identifi ed (for detailed discussion, see ref. [23]). Briefl y, amorphous and graphitized carbon show G-band peaks around 1520 cm − 1 and 1580 cm − 1 , respectively, and increase in the disorder of a graphitized system leads to the breakdown of the large graphitic domains into smaller moieties, thereby further shifting the G-band peak to 1590–1600 cm − 1 . [ 37 ] This phase is termed as “nanocrystalline graphite” and represents carbon material with a disordered graphitic microstructure with short-range ordering of graphitic planes. [ 40 ]
Also, it is worth noting that the thermal stresses in the deposits can contribute to a shift in the observed Raman
© 2012 WILEY-VCH Verlag GmbH & Co. KGaA, WeinhAdv. Funct. Mater. 2012, 22, 2129–2139
spectrum. Carbon nanotubes have been known to show a signifi cant shift in their strain sensitive Raman peaks under tensile and compression loadings. [ 41 , 42 , 43 ] Typically, the thermal strain in the system can be esti-mated from the product of the thermal expan-sion coeffi cient and the change in tempera-ture. Thus, assuming that the coeffi cient of thermal expansion of the amorphous carbon deposits is ≈ 3–5 μ C − 1 and the local temper-ature at the surface to be ≈ 400–450 ° C, the strain in the deposits can be ≈ 0.12–0.2%. [ 44 , 45 ] This can result in a shift in the G-band peak position by ≈ 3–6 cm − 1 . [ 46 , 47 ]
Figure 3 shows the high-resolution Raman map and the corresponding Raman scattering obtained from averaging over 400 individual spectra of the EBID carbon dots on different substrates. The images were obtained by inte-grating the intensity of the peaks between 1000 cm − 1 and 1800 cm − 1 to account for the characteristic D-band and G-band peaks for carbon dots. Interestingly, the carbon dots on different substrates showed signifi cantly
different Raman characteristics. The G-band peak position and the D/G ratio of the dots deposited on silicon substrate are approximately 1556 ± 1 cm − 1 and 1.2, respectively (Figure 3 a). For carbon deposits on gold fi lm, the G-band peak position is slightly higher than on silicon (1564.6 ± 1.5 cm − 1 ) with the D/G ratio of approximately 1.5 (Figure 3 b). The slight differ-ence in the G-band peak positions of the carbon dots on silicon and gold substrate may be due to the difference in the internal stresses. These stresses are formed during fabrication due to the difference in the secondary electron yield and surface diffu-sion coeffi cient.
In contrast, the Raman spectrum for the carbon deposits on the silver fi lm showed the G-band and D-band peaks com-pletely distinguishable from one another. The G-band peak position for dots deposited on the silver fi lm reached 1582 cm − 1 (Figure 3 c). Also, the D/G ratio is signifi cantly higher (1.9) than the deposits on silicon (1.2) and gold (1.5). This suggests that although the carbon deposits were fabricated under identical conditions, they exhibit different microstructure when exposed to the laser source at 514 nm.
Thus, the analysis of Raman data suggests that as-deposited carbon dots on silicon substrate are partially amorphous with some sp 2 content. However, the deposits on silver fi lm show G-band peak position shifted signifi cantly above 1580 cm − 1 , implying an increase in the graphitic ordering with the formation of the nanocrystalline carbon phase inside the structure upon laser exposure, a unique phenomenon revealed in this study.
As is known, an amorphous to graphitic transformation usually requires exposure to high temperature or high pres-sure. [ 23 , 48 ] However, in this study, the amorphous carbon deposits were subjected to an extremely low laser power ( < 1 mW) under normal atmospheric conditions. This phenom-enon suggests that the substrate must be infl uencing the phase transformation process of the as-deposited amorphous carbon deposits under laser illumination. In particular, bare silicon
2131wileyonlinelibrary.comeim

FULL
PAPER
21
www.afm-journal.dewww.MaterialsViews.com
Figure 3 . Raman spectra of carbon deposits with insets showing the Raman maps on a) silicon substrate, b) gold fi lm, and c) silver fi lm.
1000 1200 1400 1600 1800
D/G ratio: 1.2
1367.5 cm-1
1556.7 cm-1
Inte
nsity
(a.
u)
Raman shift (cm-1)
Silicon
1000 1200 1400 1600 1800
D/G ratio: 1.52
1361.2 cm-1
1564.6 cm-1
Inte
nsi
ty (a
.u.)
Raman shift (cm-1)
Gold
1000 1200 1400 1600 1800
D/G ratio: 1.9
1355.9 cm-1
1582.1 cm-1
Inte
nsity
(a.
u.)
Raman shift (cm-1)
Silver
(a)
(b)
(c)
Figure 4 . The variation of refractive index ( n ) and absorption coeffi cient ( k ) with wavelength of a) gold fi lm and b) silver fi lm.
300 400 500 600 700 800 900
0.0
0.5
1.0
1.5
2.0
2.5
3.0
3.5
n k
Wavelength (nm)
Ref
ract
ive
Inde
x
0.0
1.0
2.0
3.0
4.0
5.0
6.0E
xtin
ctio
n co
effi
cien
t
300 400 500 600 700 800 900
0.0
0.5
1.0
1.5
2.0
2.5
3.0
n k
Wavelength (nm)
Ref
ract
ive
Inde
x
0.5
1.0
1.5
2.0
2.5
3.0
3.5
4.0
4.5
5.0
Ext
inc
tion
coef
ficie
nt
(a)
(b)
substrate shows no effect on the properties of the amorphous carbon deposits. However, noble metal fi lms seem to infl uence the characteristics of the as-deposited carbon deposits in the presence of a laser source. Thus, the interaction of light with
32 wileyonlinelibrary.com © 2012 WILEY-VCH Verlag G
the metal fi lm needs to be studied in order to understand the laser-assisted phase transformation.
2.4. Optical Properties of Sputtered Metal Films
Figure 4 represents the refractive indices and extinction coef-fi cients of the gold and silver fi lms used in this study. The gold fi lm showed a slight variation of the refractive index up to 450 nm, followed by a steady decrease with an increase in wavelength (Figure 4 a). It shows a near-zero refractive index at wavelengths between 550 and 580 nm and continues to rise thereafter. A similar trend is observed for the silver fi lm (Figure 4 b). The refractive index show a slight variation in the near UV wavelengths followed by a steady decrease, approaching zero between 550 and 580 nm and continues to steadily increase up to 900 nm. These results correlate well with the optical prop-erties of evaporated metal fi lms reported by Sennett et al. [ 49 ] At shorter wavelengths, bound electrons contribute towards the absorption whereas at higher wavelengths, the absorption due to free electrons is more dominant. This transition occurs in the visible region and UV region of the electromagnetic spec-trum for gold and silver fi lms, respectively. In the case of gold fi lms, the absorption increases at wavelengths above 550 nm whereas silver fi lm strongly absorbs at all wavelengths.
mbH & Co. KGaA, Weinheim Adv. Funct. Mater. 2012, 22, 2129–2139

FULL P
APER
www.afm-journal.dewww.MaterialsViews.com
Figure 4 also gives the variation of the extinction coeffi -cient of the metal fi lms with the wavelength. The extinction coeffi cient for the gold fi lm shows an increase up to 500 nm with a small bump around 420 nm and sharply increases up to 700 nm (Figure 4 a). Above 700 nm, the extinction coeffi cient for the gold fi lm saturates. For the silver fi lm, the extinction coeffi -cient shows a near linear increase from 300 nm to 450 nm and undergoes a transition between 450 and 480 nm and continues to linearly increase up to 900 nm (Figure 4 b). It is interesting to note that the extinction coeffi cient of these fi lms shows little variation at wavelengths where the refractive index approaches a minimum.
The sudden drop in the refractive index of the metal fi lms is caused by the free electron transition, which occurs due to the resonant coupling between the surface plasmons and incident electromagnetic wave, and can be described using the Drude model for free electron oscillations. [ 50 – 53 ] At the resonant fre-quency, the real part of the permittivity approaches zero and consequently the refractive index approaches zero. A refractive index of less than 1 represents a pure metal-like behavior of the sputtered fi lms. However, these resonances occur at a slightly different wavelength than that of our laser source.
Comparing the absolute values of the extinction coeffi cient at 514 nm, the absorptive index of silver (3.0) is signifi cantly higher than that for gold (1.75), suggesting that the silver fi lm absorbs light more effi ciently than the gold fi lm. Thus, on exposure to the incident light, the surface plasmons of silver nanoparticles oscillate near its resonant frequency and absorb
Figure 5 . AFM image of the metal fi lms after exposure to the laser showing the topography ( z -scale: 20 nm) and phase ( z -scale: 60 ° ) of a) gold fi lm and b) silver fi lm.
the incident light more effi ciently than the gold surface, though the plasmon resonance of gold is also close to the laser wavelength.
Such localized electromagnetic enhance-ment of light is achieved by excitation of the surface plasmons of metal nanoparticles at or near their resonant frequency. [ 54– 56 ] As a result, metal nanoparticles act as nanoheat generators, absorbing incident light and converting it into thermal energy. [ 17 , 57 , 58 , 59 ] This heating effect is especially strong under the plasmon resonance conditions when the energy of the incident photons is close to the plasmon frequency of the metal nanoparticles. Thus, based on the optical properties of metal fi lms discussed above, we suggest that the thermal energy generated by the surface plasmons might be responsible for bringing about the phase transformation of amorphous carbon deposits.
2.5. Effect of Laser Exposure on the Substrate
To further consider the effect of the laser illumination on the metal fi lms, we studied the silver and gold fi lms under identical direct light exposure. Figure 5 shows the topographical AFM images of these exposed areas along with the corresponding phase images. It can be clearly seen that the surface
© 2012 WILEY-VCH Verlag GmAdv. Funct. Mater. 2012, 22, 2129–2139
morphology of the silver fi lm changes signifi cantly in the areas exposed to the laser, whereas the gold fi lm does not show any apparent change in its surface features. A high-resolution AFM image in Figure 6 shows that the nanoparticles within the laser-exposed regions of the silver fi lm became signifi cantly reduced in size, indicating intense changes in silver nanoparticle mor-phology after exposure to light. The average size of the silver nanoparticles in the exposed areas is 2.3 nm, as compared to 12 nm in the unexposed areas.
Ablation of metal nanostructures using a high powered laser source is well known in the literature. [ 60 , 61 , 62 ] However, the laser used in this research is a low-power continuous laser and the power density used in this study is several orders of mag-nitude (at least four) lower than that reported. [ 63 ] Thus, direct light-induced ablation of the metal nanoparticles is improb-able under our experimental conditions. We speculate that the localized excitation of surface plasmons of the silver fi lm that possess absorption near the incident laser frequency causes temperature to dramatically increase in the exposed areas, to a value high enough to affect the surface morphology of the area. Also, it is well established from our previous work that a temperature of around 350–400 ° C would be required for the EBID amorphous carbon deposit to graphitize completely. Although the exact temperature at the surface of the nanoparticles on laser exposure is a challenge to measure under the cur-rent experimental conditions, an estimate of the temperature required for silver nanoparticle morphology changes would be necessary.
2133wileyonlinelibrary.combH & Co. KGaA, Weinheim
FULL
PAPER
21
www.afm-journal.dewww.MaterialsViews.com
Figure 6 . High-resolution AFM image showing the difference between the laser-exposed and unexposed areas of silver fi lm. a) Topography (left; z -scale: 10 nm) and phase (right; z -scale: 60 ° ). Sectional analysis showing the height variation in the b) unexposed areas and c) exposed areas.
2.6. Local Temperature Estimation
Figure 7 shows the morphology of the silver fi lm annealed at
34
Figure 7 . High-resolution AFM image showing the morphology of silver fi lm at different temperatures. The z -scale is 10 nm for all images.
different temperatures. It can be seen that the surface morphology of the silver fi lm remains unaltered on annealing up to 450 ° C, with a uniform particle size distribution over the entire surface. Annealing above this tem-perature results in an increase in the lateral dimensions of the silver nanoparticles with the height decreasing to 7.3 ± .1.1 nm. These changes suggest that the silver nanoparticles melt upon annealing above 450 ° C. Thus, exposing the substrate to the highest tempera-ture results in local melting causing the silver nanoparticles to aggregate and grow in size. On the contrary, in case of the sputtered silver fi lm exposed to the laser source, the particles are in a state of confi nement in the exposed areas and account for the excess tempera-ture by the reduction of size and increasing specifi c surface area. It is logical to assume that the temperature required for bringing
wileyonlinelibrary.com © 2012 WILEY-VCH Verlag GmbH & Co. KGaA, Wei
about a change in morphology of silver nano-particles would be similar for thermal-based annealing and laser-based transformation. To further confi rm this independently, thin fi lms of common polymers, such as poly(4-vinylphenol), with a well known thermal decomposition temperature above 360 ° C, [ 64 ] were deposited on noble metal substrates and exposed to the laser under identical con-ditions. As a result, we observed an intense and highly localized thermal decomposition of a 100 nm thin fi lm of the selected poly-mers deposited on silver substrate in areas exposed to the laser, whereas the morphology remained unaffected for a similar polymer fi lm deposited on silicon. Such thermal decomposition additionally confi rms a local-ized plasmon-assisted laser-induced thermal heating on the silver surface with a tempera-ture well exceeding 360 ° C.
2.7. Application of Laser-Induced Phase Transformation of Carbon on a Copper Substrate
As a proof of concept experiment, we studied the effect of laser exposure on the physical state of the carbon deposits fabricated on top of a copper substrate, which is a commonly used material in the semiconductor industry. Figure 8 a shows the morphology of the copper substrate along with the corresponding cross-sectional analysis. Similar to the silver sub-strate, the copper substrate also showed the presence of a granular surface topography with a particle size of 9.4 ± 0.6 nm. Further,
on measuring the optical properties of the copper fi lm, it was observed that the refractive index of the fi lm approaches a minimum between 460 and 500 nm, corresponding to the free
nheim Adv. Funct. Mater. 2012, 22, 2129–2139

FULL P
APER
www.afm-journal.dewww.MaterialsViews.com
Figure 8 . a) Morphology of the copper fi lm showing granular morphology along with the cross-sectional profi le ( z -scale: 20 nm). b) The variation of refractive index ( n ) and absorption coeffi cient ( k ) with wavelength of copper fi lm. c) Topography of the EBID carbon square deposited on the copper fi lm along with the cross-sectional profi le ( z -scale: 40 nm). d) Raman spectra of the carbon square at different laser powers. The dotted line indicates the blue shift in the G-band peak position.
300 400 500 600 700 800 900
0.0
0.2
0.4
0.6
0.8
1.0
Wavelength (nm)R
efra
ctiv
e In
dex
0.3
0.4
0.5
0.6
0.7
0.8
0.9
1.0
1.1
Extin
ction coefficient
1000 1200 1400 1600 1800
Inte
nsi
ty (
a.u
.)
Low power (<1.0 mW)
Raman shift (cm-1)
High power (1.5 mW)
Height: 16.5 nm
Height: 9.4+0.6 nm
(a) (b)
(d)(c)
200 nm
2 m
electron oscillations of the surface plasmons as a response to the incident electromagnetic radiation (Figure 8 b). Thus, the surface plasmon resonance of the copper fi lm was also near the laser excitation wavelength as observed for the gold and silver fi lm.
However, on comparing the extinction coeffi cient of the copper fi lm with the gold and silver fi lms, it was observed that the copper fi lm absorbs 2.5 times less light than the gold fi lm and 5 times less light than the silver fi lm at a wavelength of 514 nm. Thus, according to the hypothesis presented in the earlier sections, the carbon deposits should not graphitize on the copper fi lm. In order to prove this, we fabricated carbon squares on top of the copper fi lm. Figure 8 c shows the morphology of the carbon square along with the corresponding cross-sectional profi le. The height of the square was around 16.5 nm with lateral dimensions of ≈ 3 μ m × 3 μ m. Upon exposing the deposit to the Raman laser at 514 nm, it was observed that the deposit showed amorphous behavior, as expected, with a G-band position around 1568 cm − 1 (Figure 8 d).
This suggests that the surface plasmons of the copper fi lm do not absorb enough light at 514 nm to bring about a local increase in the temperature that is high enough for graphitization of the carbon deposit. However, in order to increase the effective absorption of light at 514 nm, the laser power can be increased. Thus, we exposed another carbon square fabricated under similar conditions to the laser source at slightly higher power
© 2012 WILEY-VCH Verlag GmbH & Co. KGaA, WeinheimAdv. Funct. Mater. 2012, 22, 2129–2139
( ≈ 1.5 mW) and monitored the Raman spectra. It was observed that the G-band peak position blue-shifts towards the graph-itic peak position at 1580 cm − 1 (Figure 8 d). This further validates the role of surface plasmons in bringing about a localized phase transition in amorphous carbon deposits upon exposure to light.
2.8. Kinetics of Laser-Induced Phase Transformation
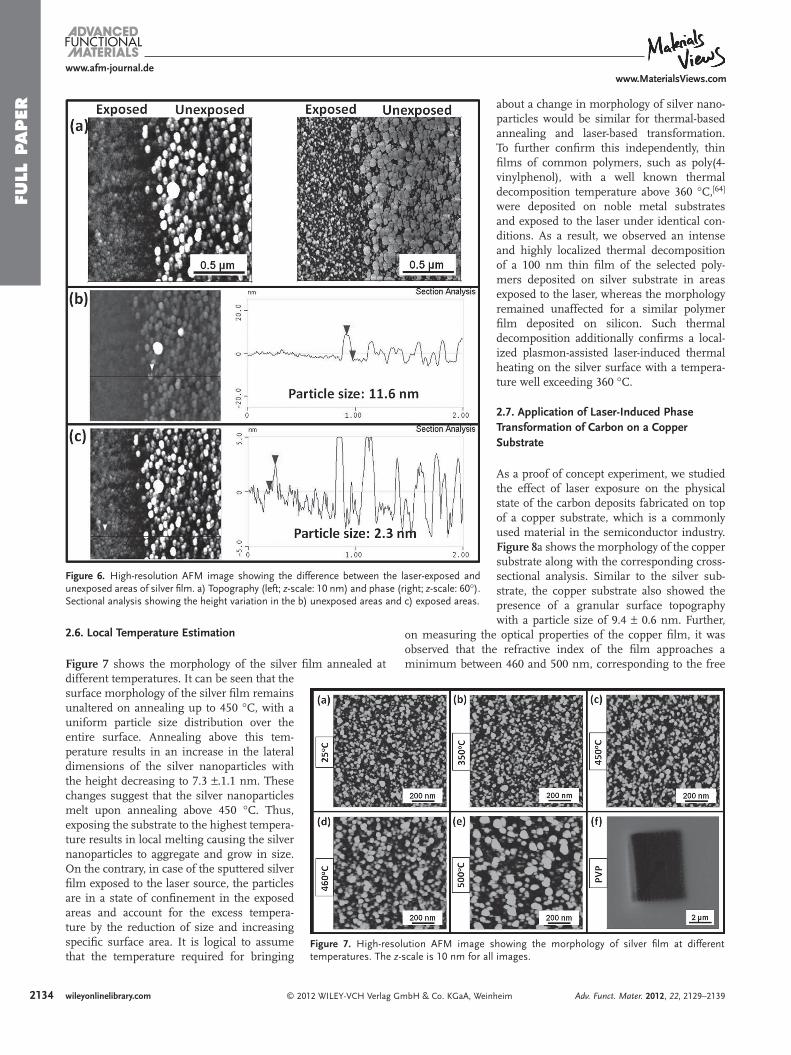
The carbon dots on different metal fi lms were exposed to the laser illumination under minimum power ( < 1 mW) for increasing periods of time and spectra were recorded after each exposure interval to monitor kinetics of phase transformation. Figure 9 shows the variation of G-band peak position and the D/G ratio for the dots deposited on silver and gold fi lms. It can be seen that initially the deposits are amorphous with the G-band peak position around 1558 cm − 1 and 1567 cm − 1 on gold and silver fi lms, respectively (Figure 9 a). Also, the D/G ratio for deposits occurs around 0.8 on gold and 1.2 on silver fi lms (Figure 9 b). As
the exposure time increases, the G-band peak position for carbon deposits on silver fi lms steadily increases and reaches 1580 cm 1 after ≈ 30 s of light exposure with the D/G ratio increasing to 1.6. Further increase in the exposure time results in the steady shift of G-band peak position towards 1590 cm − 1 , suggesting the for-mation of a nanocrystalline graphitic phase. [ 37 ] Thus, the carbon deposits on the silver fi lm undergo a rapid (tens of seconds) tran-sition from amorphous to graphitic to nanocrystalline graphitic phase upon exposure to the laser source (Figure 9 c).
The G-band peak position of deposits on gold fi lms shows a sharp increase up to 1572 cm − 1 during the initial exposure followed by a plateau region (Figure 9 ). This minor shift sug-gests that the carbon deposits on gold undergo only partial graphitization to disordered graphitic phase, without a com-plete transformation. The D/G ratio of carbon deposits on gold fi lm remains about constant around 0.9 (Figure 9 ).
2.9. Changes in the Electronic Properties of Carbon Deposits Upon Laser Ilumination
In order to address the practical applications of the amorphous to graphitic phase transformation in controlling the electrical properties of carbon/metal interfaces, we performed CFM
2135wileyonlinelibrary.com
FULL
PAPER
2
www.afm-journal.dewww.MaterialsViews.com
Figure 9 . Kinetics of phase transformation of the carbon deposit on different metal fi lms on exposure to 514 nm laser source. a) G-band peak position of the carbon deposit at different exposure times. The solid lines represent a fi t to the data points. b) Corresponding D/G ratio. The solid lines represent a fi t to the data points. c) Raman spectra of the carbon deposit on silver at different time intervals.
(b)
(c)(a)
50040030020010001555
1560
1565
1570
1575
1580
1585
1590
1595
1600
1605
1610
~ 240 s~ 30 s
G-b
and
pea
k p
osi
tio
n (
cm-1)
Exposure time (s)
Silver film Gold film
50040030020010000.0
0.4
0.8
1.2
1.6
2.0
2.4
D/G
rat
io
Exposure time (s)
Silver film Gold film
18001600140012001000
Silver film 1 s
Inte
nsi
ty (
a.u
.)
Raman Shift (cm-1)
18001600140012001000
Silver film 30 s
Inte
nsi
ty (
a.u
.)
Raman Shift (cm-1)
18001600140012001000
Silver film 240 s
Inte
nsi
ty (
a.u
.)
Raman Shift (cm)-1
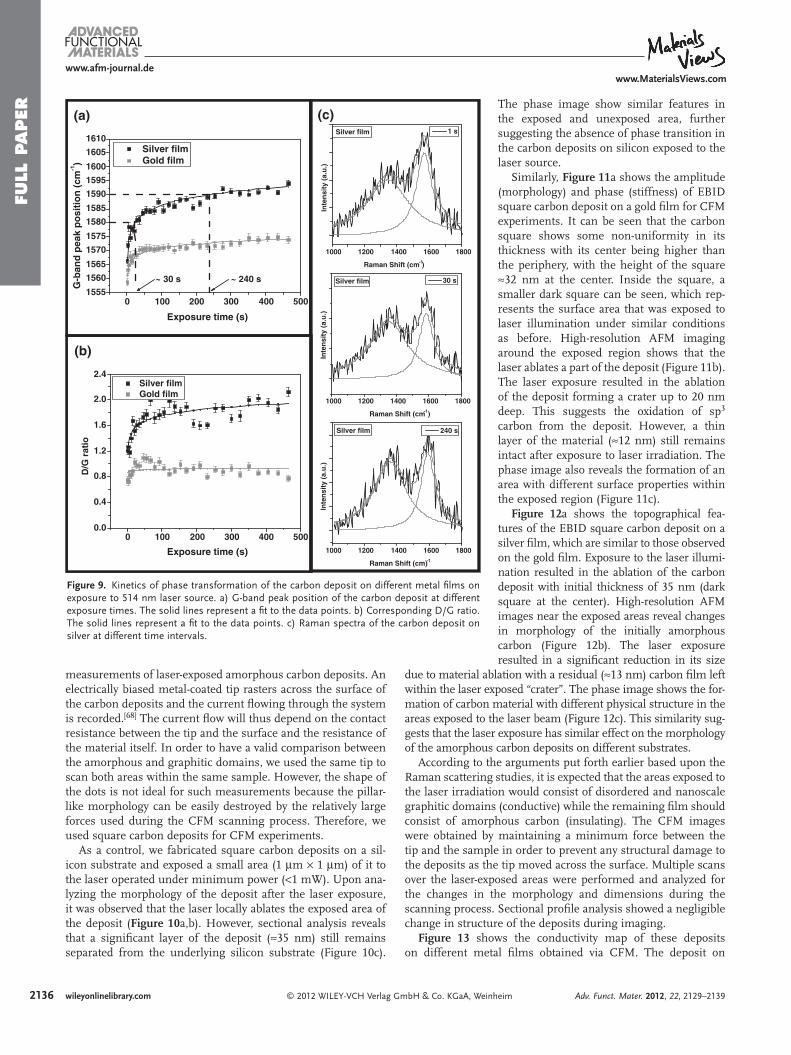
measurements of laser-exposed amorphous carbon deposits. An electrically biased metal-coated tip rasters across the surface of the carbon deposits and the current fl owing through the system is recorded. [ 68 ] The current fl ow will thus depend on the contact resistance between the tip and the surface and the resistance of the material itself. In order to have a valid comparison between the amorphous and graphitic domains, we used the same tip to scan both areas within the same sample. However, the shape of the dots is not ideal for such measurements because the pillar-like morphology can be easily destroyed by the relatively large forces used during the CFM scanning process. Therefore, we used square carbon deposits for CFM experiments.
As a control, we fabricated square carbon deposits on a sil-icon substrate and exposed a small area (1 μ m × 1 μ m) of it to the laser operated under minimum power ( < 1 mW). Upon ana-lyzing the morphology of the deposit after the laser exposure, it was observed that the laser locally ablates the exposed area of the deposit ( Figure 10 a,b). However, sectional analysis reveals that a signifi cant layer of the deposit ( ≈ 35 nm) still remains separated from the underlying silicon substrate (Figure 10 c).
136 wileyonlinelibrary.com © 2012 WILEY-VCH Verlag GmbH & Co. KGaA, Wein
The phase image show similar features in the exposed and unexposed area, further suggesting the absence of phase transition in the carbon deposits on silicon exposed to the laser source.
Similarly, Figure 11 a shows the amplitude (morphology) and phase (stiffness) of EBID square carbon deposit on a gold fi lm for CFM experiments. It can be seen that the carbon square shows some non-uniformity in its thickness with its center being higher than the periphery, with the height of the square ≈ 32 nm at the center. Inside the square, a smaller dark square can be seen, which rep-resents the surface area that was exposed to laser illumination under similar conditions as before. High-resolution AFM imaging around the exposed region shows that the laser ablates a part of the deposit (Figure 11 b). The laser exposure resulted in the ablation of the deposit forming a crater up to 20 nm deep. This suggests the oxidation of sp 3 carbon from the deposit. However, a thin layer of the material ( ≈ 12 nm) still remains intact after exposure to laser irradiation. The phase image also reveals the formation of an area with different surface properties within the exposed region (Figure 11 c).
Figure 12 a shows the topographical fea-tures of the EBID square carbon deposit on a silver fi lm, which are similar to those observed on the gold fi lm. Exposure to the laser illumi-nation resulted in the ablation of the carbon deposit with initial thickness of 35 nm (dark square at the center). High-resolution AFM images near the exposed areas reveal changes in morphology of the initially amorphous carbon (Figure 12 b). The laser exposure resulted in a signifi cant reduction in its size
due to material ablation with a residual ( ≈ 13 nm) carbon fi lm left within the laser exposed “crater”. The phase image shows the for-mation of carbon material with different physical structure in the areas exposed to the laser beam (Figure 12 c). This similarity sug-gests that the laser exposure has similar effect on the morphology of the amorphous carbon deposits on different substrates.
According to the arguments put forth earlier based upon the Raman scattering studies, it is expected that the areas exposed to the laser irradiation would consist of disordered and nanoscale graphitic domains (conductive) while the remaining fi lm should consist of amorphous carbon (insulating). The CFM images were obtained by maintaining a minimum force between the tip and the sample in order to prevent any structural damage to the deposits as the tip moved across the surface. Multiple scans over the laser-exposed areas were performed and analyzed for the changes in the morphology and dimensions during the scanning process. Sectional profi le analysis showed a negligible change in structure of the deposits during imaging.
Figure 13 shows the conductivity map of these deposits on different metal fi lms obtained via CFM. The deposit on
heim Adv. Funct. Mater. 2012, 22, 2129–2139

FULL P
APER
www.afm-journal.dewww.MaterialsViews.com
Figure 11 . Morphology of amorphous carbon square on gold fi lm. a) Topography ( z -scale: 100 nm) and the corresponding phase ( z -scale: 90 ° ) showing the square and the laser-exposed area at the center. b) High-resolution topography ( z -scale: 50 nm) and phase ( z -scale: 30 ° ) of the laser-exposed areas showing the difference in morphology and c) sec-tional analysis of the laser-exposed area.
Figure 10 . Morphology of amorphous carbon square on a silicon sub-strate. a) Topography ( z -scale: 200 nm) and the corresponding phase ( z -scale: 60 ° ) showing the square and the laser-exposed area at the center, b) high-resolution topography ( z -scale: 100 nm) and phase ( z -scale: 60 ° ) of the laser-exposed areas showing the difference in morphology, and c) sectional analysis of the laser-exposed area.
the gold fi lm shows much improved conductivity at the laser exposed areas. However, the surrounding area shows practically no current fl ow, i.e., carbon fi lm remains nearly insulating. Exact values of the resistance cannot be obtained quantita-tively because of the unknown contact resistance. However, qualitatively the CFM images clearly identify the graphitic and amorphous domains and degree of graphitization. More-over, the area of amorphous carbon exposed to the laser on the silver fi lm shows a much greater electrical conductivity (Figure 13 b, current of ≈ 0.5 mA fl ows from the CFM tip to the substrate on applying a sample bias of 3.0 V) as compared to the deposits on gold fi lm (Figure 13 a, current of ≈ 0.5 nA fl ows from the CFM tip to the substrate on applying a sample bias of 9.0 V).
It is diffi cult to estimate or compare the electrical conduc-tivity of the amorphous carbon in the unexposed areas of the square deposit since it shows no measurable current even after applying a maximum sample bias of 10 V. However, since the amorphous carbon maintains its identity in the unexposed areas, irrespective of the underlying substrate, it can be said that the electrical conductivity of amorphous carbon is signifi -cantly lower than that of partially graphitized carbon on the gold fi lm. The electrical conductivities of gold (4.2 × 10 7 S m − 1 ) and silver (6.2 × 10 7 S m − 1 ) are large and almost identical at room temperature. [ 65 ] Thus, assuming the contact resistance between the sample and the tip to be same in both cases, the
© 2012 WILEY-VCH Verlag GAdv. Funct. Mater. 2012, 22, 2129–2139
presence of the silver fi lm resulted in an increase in the elec-trical conductivity by over seven orders of magnitude (resistance of the laser exposed carbon fi lm is ≈ 0.6 kΩ s on the silver sub-strate, compared to ≈ 14 GΩ s on the gold substrate) and, thus, much improved overall electrical conductivity (or dramatically decreased resistivity) at the carbon/silver interface after laser-induced transformation.
3. Conclusions
We have shown that a localized and confi ned change in phase and electrical properties occurs in the EBID amor-phous carbon nanostructures deposited on top of nanostruc-tured metal fi lms upon exposure to the laser illumination. Microscopic amorphous carbon deposits on silicon, gold, and silver showed different structural characteristics upon laser exposure. Specifi cally, the amorphous carbon deposits maintained their character under laser illumination on a sil-icon substrate but showed partial and full graphitization on gold and silver fi lms. This change in the material properties is attributed to the local laser-induced heating of the metal nanoparticles with a close match of the light absorption fre-quency with the laser wavelength. We demonstrated that the phase transformation of carbon can also be brought about on substrates such as copper, which has a low light absorptive
2137wileyonlinelibrary.commbH & Co. KGaA, Weinheim

FULL
PAPER
213
www.afm-journal.dewww.MaterialsViews.com
Figure 12 . Morphology of amorphous carbon square on silver fi lm. a) Topography ( z -scale: 100 nm) and the corresponding phase ( z -scale: 90 ° ) showing the square and the laser-exposed area at the center. b) High-resolution topography ( z -scale: 50 nm) and phase ( z -scale: 30 ° ) of the laser-exposed areas showing the difference in morphology and c) sec-tional analysis of the laser-exposed area.
index, by tuning the incident laser intensity. Such transfor-mation resulted in dramatic increases in the electrical con-ductivity of the amorphous carbon deposits. We suggest that the surface plasmons assist in converting the incident light energy into heat that enables a localized phase transition in the amorphous carbon nanostructures to nano crystalline carbon. Localized graphitization of nanoscale amorphous carbon deposits can be important in applications where low temperature, localized, and fast carbon–metal interconnect fabrication are key issues.
8 wileyonlinelibrary.com © 2012 WILEY-VCH Verlag G
Figure 13 . CFM imaging of the deposit on a) gold fi lm and b) silver fi lm, pthe 514 nm laser.
4. Experimental Section Substrate Preparation : Silicon (100) wafers were cleaned in pirhana
solution (3:1 mixture of H 2 SO 4 /H 2 O 2, hazardous solution ) for 1 h and then rinsed thoroughly with Nanopure water (18 MΩ cm). [ 66 ] Gold and silver were sputtered on the cleaned silicon substrates for 2 min and copper was sputtered for 10 min at a 30% setpoint in a Denton Vacuum Desk IV sputterer under an argon atmosphere at a pressure of 50 mbar. The average thicknesses of the gold, silver, and copper fi lms as measured from ellipsometry were 14.4 ± 0.2 nm, 10.2 ± 0.18 nm, and 17.0 ± 0.12 nm, respectively.
Residual hydrocarbons and acetone were used as sources of the precursor molecules to induce the growth of carbon deposits over the substrates mentioned in the earlier section. [ 22 , 23 , 25 ] EBID carbon deposits were fabricated using a Quanta 200 ESEM operated under 0.01 Pa. The cone-shaped carbon deposits shown in Figure 2 were deposited by keeping the electron beam in spot mode for a period of 10 min. An electron beam energy of 25 keV with the electron beam current in the ≈ 20 pA (spot size 3) was used for deposition. The square carbon deposits shown in Figure 9 – 11 were made by scanning the electron beam at an energy of 25 keV and current of ≈ 250 pA (spot size 5), using the NPGS (Nanometer Pattern Generation System) program with 1300 mC cm − 2 of electron beam area dose. In order to keep the thickness of the squares similar, the deposition time per square was 45 min and 90 min on the gold and silver fi lms, respectively. Silver fi lms shown in Figure 7 were annealed in a Barnstead Thermolyne furnace for 5 s at different temperatures under normal atmospheric conditions.
Characterization : AFM topographical and phase images were collected with a Dimension-3000 microscope, using silicon tips with tip radii between 10 and 20 nm and a spring constant of about 40 N m − 1 , in accordance with previously reported procedures. [ 67 , 68 ] The samples were scanned at 0.5–1.0 Hz. The domain height and surface area coverage were determined from cross-sectional and bearing analysis, respectively.
Raman data were obtained using a WITec (Alpha 300R) confocal Raman microscope using Ar ion laser (514.5 nm) as an excitation source. [ 69 ] The images were obtained by scanning an area of 5 μ m × 5 μ m for the dots and 1 μ m × 1 μ m for the square with a 100 × objective (Olympus 100 × -NA (numerical aperture) = 0.9). The spectra were obtained under minimum laser power ( < 1 mW) to avoid any laser-induced annealing, as verifi ed independently. The integration time was optimized at 1 s for the all the deposits in order to obtain higher signal-to-noise ratio. The spectra were integrated between 1000 cm − 1 and 1800 cm − 1 to account for the D-band and G-band. A grating with 600 grooves mm − 1 grating with a spectral resolution of 4 cm − 1 was used for this study.
Measurement of the optical properties was carried out using a Woollam M2000U (J.A. Woollam Co., Inc., Lincoln, NE) multiangle ellipsometer with WVASE 32 analysis software for three incident angles (65 ° , 70 ° , and 75 ° ). [ 70 ] The psi (polarized angle) and delta (phase) values were measured and fi tted with the stored parameters for the gold, silver, and copper model to determine the thickness and optical constants (refractive index
mbH & Co. KGaA, Wein
artially exposed to
( n ) and extinction coeffi cient ( k )) of the metal fi lms over wavelengths of 300 nm to 900 nm.
Conductivity maps were collected using Innova AFM microscope (Veeco) using silicon tips with tip radii of 30 nm and a spring constant of about 1–3 N m − 1 , coated with 20 nm Pt/Au. The samples were scanned at 0.3–0.5 Hz. The sample bias was varied from 1.0 V to 10 V and the amplifi er gains were varied from 10 3 V A − 1 to 10 9 V A − 1 depending on the substrate.
Acknowledgements The authors would like to thank Dr. Konrad Rykaczewski for useful discussions. This work was supported by the Semiconductor Research
heim Adv. Funct. Mater. 2012, 22, 2129–2139

FULL P
APER
www.afm-journal.dewww.MaterialsViews.com
Corporation (GRC Grant 2008OJ1864.1281) and the NSF Grant DMI 0403671.
Received: November 5, 2011 Revised: December 16, 2011
Published online: February 27, 2012
[ 1 ] Oxford Dictionary of Biochemistry and Molecular Biology , (Eds: A. D. Smith , S. P. Dutta , G. Howard Smith , P. N. Campbell , R. Bentley , H. A. McKenzie , D. A. Bender , A. J. Harris , T. W. Goodwin , J. H. Parish , S. C. Stanford ), Oxford University Press , Oxford 1997 .
[ 2 ] D. A. Bryant , N. U. Frigaard , Trends Microbiol. 2006 , 14 , 488 . [ 3 ] D. H. Waldeck , Chem. Rev. 1991 , 91 , 415 . [ 4 ] J. P. Fouassier , Photoinitiation, Photopolymerization, and Photocuring:
Fundamentals and Applications , Hanser Publishers , Munich 1995 . [ 5 ] J. Berkowitz , Photoabsorption, Photoionization, and Photoelectron
Spectroscopy , Academic Press , New York 1979 . [ 6 ] S. M. Ryvkin , Photoelectric Effects in Semiconductors , Consultants
Bureau , New York 1964 . [ 7 ] W. M.Fisher , S. C. Rand , J. Appl. Phys. 2011 , 109 , 064903 . [ 8 ] A. Rosencwaig , Photoacoustics and Photoacoustic Spectroscopy , Wiley ,
New York 1980 . [ 9 ] D. P. Almond , P. M. Patel , Photothermal Science and Techniques ,
Chapman & Hall , London 1996 . [ 10 ] P. K. Jain , X. Huang , I. H. El-Sayed , M. A. El-Sayed , Acc. Chem. Res.
2008 , 41 , 1578 . [ 11 ] R. Elghain , J. J. Storhoff , R. C. Mucic , R. L. Letsinger , C. A. Mirkin ,
Science 1997 , 277 , 1078 . [ 12 ] A. J. Haes , R. P. Van Duyne , J. Am. Chem. Soc. 2002 , 124 , 10596 . [ 13 ] L. R. Hirsch , R. J. Stafford , J. A. Bankson , S. R. Sershen , B. Rivera ,
R. E. Price , J. D. Hazle , N. J. Halas , J. L. West , Proc. Natl. Acad. Sci. USA 2003 , 100 , 13549 .
[ 14 ] A. Sidorenko , C. Houphouet-Boigny , O. Villavicencio , M. Hashem-zadeh , D. V. McGrath , V. V. Tsukruk , Langmuir 2000 , 16 , 10569 .
[ 15 ] L. Cao , D. N. Barsic , A. R. Guichard , M. L. Brongersma , Nano Lett. 2007 , 7 , 3523 .
[ 16 ] A. Nitzan , L. E. Brus , J. Chem. Phys. 1981 , 75 , 2205 . [ 17 ] K. G. Stamplecoskie , N. L. Pacioni , D. Larson , J. C. Scaiano , J. Am.
Chem. Soc. 2011 , 133 , 9160 . [ 18 ] P. K. Jain , I. H. El-Sayed , M. A. El-Sayed , Nano Today 2007 , 2 , 18 . [ 19 ] M. Hu , J. Chen , Z. Li , L. Au , G. V. Hartland , X. Li , M. Marquez ,
Y. Xia , Chem. Soc. Rev. 2006 , 35 , 1084 . [ 20 ] Z. Wei , D. Wang , S. Kim , S. Y. Kim , Y. Hu , M. K. Yakes ,
A. R. Laracuente , Z. Dai , S. R. Marder , C. Berger , W. P. King , W. A. de Heer , P. E. Sheehan , E. Riedo , Science 2010 , 328 , 1373 .
[ 21 ] S. J. Randolph , J. D. Fowlkes , P. D. Rack , Crit. Rev. Solid State Mater. Sci. 2006 , 31 , 55 .
[ 22 ] K. Rykaczewski , O. J. Hilderth , D. D. Kulkarni , M. R. Henry , S. K. Kim , C. P. Wong , V. V. Tsukruk , A. G. Fedorov , ACS Appl. Mater. Interfaces 2010 , 2 , 969 .
[ 23 ] D. D. Kulkarni , K. Rykaczewski , S. Singamaneni , S. K. Kim , A. G. Fedorov , V. V. Tsukruk , ACS Appl. Mater. Interfaces 2011 , 3 , 710 .
[ 24 ] F. Banhart , Nano Lett. 2001 , 1 , 329 . [ 25 ] K. Rykaczewski , M. R. Henry , S. K. Kim , A. G. Fedorov ,
D. D. Kulkarni , S. Singamaneni , V. V. Tsukruk , Nanotechnology 2010 , 21 , 035202 .
[ 26 ] B. Marchon , N. Heiman , M. R. Khan , A. Lautie , J. W. Ager , D. K. Veirs , J. Appl. Phys. 1991 , 69 , 5748 .
[ 27 ] P. Zhang , B. K. Tay , C. Q. Sun , S. P. Lau , J. Vac. Sci. Technol. A 2002 , 20 , 1390 .
[ 28 ] M. G. Beghi , A. C. Ferrari , K. B. K. Teo , J. Robertson , C. E. Botani , A. Libassi , B. K. Tanner , Appl. Phys. Lett. 2002 , 81 , 3804 .
[ 29 ] S. J. Bull , Diamond Relat. Mater. 1995 , 4 , 827 . [ 30 ] W. S. Choi , B. Hong , Renewable Energy 2008 , 33 , 226 .
© 2012 WILEY-VCH Verlag GAdv. Funct. Mater. 2012, 22, 2129–2139
[ 31 ] P. M. Ajayan , M. Terrones , A. de la Guardia , V. Huc , N. Grobert , B. Q. Wei , H. Lezec , G. Ramanath , T. W. Ebbesen , Science 2002 , 296 , 705 .
[ 32 ] S. Osswald , K. Behler , Y. Gogotsi , J. Appl. Phys. 2008 , 104 , 074308 . [ 33 ] M. A. El-Sayed , Acc. Chem. Res. 2001 , 34 , 257 . [ 34 ] L. Rontzsch , K. H. Heinig , J. A. Schuller , M. L. Brongersma , Appl.
Phys. Lett. 2007 , 90 , 044105 . [ 35 ] A. O. Govorov , W. Zhang , T. Skeini , H. Richardson , J. Lee ,
N. A. Kotov , Nanoscale Res. Lett. 2006 , 1 , 84 . [ 36 ] B. F. Soares , F. Johnson , N. I. Zheludev , Phys. Rev. Lett. 2007 , 98 , 153905 . [ 37 ] A. C. Ferrari , J. Robertson , Philos. Trans. R. Soc. A. 2010 , 362 , 2477 . [ 38 ] F. Tuinstra , J. L. Koenig , J. Chem. Phys. 1970 , 53 , 1126 . [ 39 ] R. J. Nemanich , S. A. Solin , Phys. Rev. B 1979 , 20 , 392 . [ 40 ] Properties of Amorphous Carbon, INSPEC , (Ed. S. R. P. Silva ),
Institute of Engineering Technology , Herts, UK 2003 . [ 41 ] N. R. Raravikar , P. Keblinski , A. M. Rao , M. S. Dresselhaus ,
L. S. Schadler , P. M. Ajayan , Phys. Rev. B 2002 , 66 , 235424 . [ 42 ] L. S. Schadler , S. C. Giannaris , P. M. Ajayan , Appl. Phys. Lett. 1998 ,
73 , 3842 . [ 43 ] L. Ci , Z. Zhou , L. Song , X. Yan , D. Liu , H. Yuan , Y. Gao , J. Wang ,
L. Liu , W. Zhou , G. Wang , S. Xie , Appl. Phys. Lett. 2003 , 82 , 3098 . [ 44 ] F. C. Marques , R. G. Lacerda , A. Champi , V. Stolojan , D. C. Cox ,
S. R. P. Silva , Appl. Phys. Lett. 2003 , 83 , 3099 . [ 45 ] A. C. Ferrari , B. Kleinsorge , N. A. Morrison , A. Hart , V. Stolojan ,
J. Robertson , J. Appl. Phys. 1999 , 85 , 7191 . [ 46 ] S. B. Cronin , A. K. Swan , M. S. Unlu , B. B. Goldberg ,
M. S. Dresselhaus , M. Tinkham , Phys. Rev. B 2005 , 72 , 035425 . [ 47 ] C. Jiang , H. Ko , V. V. Tsukruk , Adv. Mater. 2005 , 17 , 2127 . [ 48 ] A. Onodera , Y. Irie , K. Higashi , J. Umemura , T. Takenaka , J. Appl.
Phys. 1991 , 69 , 2611 . [ 49 ] R. S. Sennett , G. D. Scott , J. Opt. Soc. Am. 1950 , 40 , 203 . [ 50 ] U. Kreibig , M. Vollmer , Optical Properties of Metal Clusters , Springer ,
Berlin 1995 . [ 51 ] P. K. Jain , M. A. El-Sayed , Chem. Phy. Lett. 2010 , 487 , 153 . [ 52 ] A. I. Maaroof , M. B. Cortie , G. B. Smith , J. Opt. A: Pure Appl. Opt.
2005 , 7 , 303 . [ 53 ] M. C. Dixon , T. A. Daniel , M. Hieda , D. M. Smilgies , M. H. W. Chan ,
D. L. Allara , Langmuir 2007 , 23 , 2414 . [ 54 ] B. Liedberg , C. Nylander , I. Lundstrom , Sens. Actuators 1983 , 4 , 299 . [ 55 ] H. H. Ko , S. Singamaneni , V. V. Tsukruk , Small 2008 , 4 , 1576 . [ 56 ] P. K. Jain , X. Huang , I. H. El-Sayed , M. A. El-Sayed , Plasmonics 2007 , 2 , 107 . [ 57 ] A. O. Govorov , H. H. Richardson , Nano Today 2007 , 2 , 30 . [ 58 ] H. H. Richardson , M. T. Carlson , P. J. Tandler , P. Hernandez ,
A. O. Govorov , Nano Lett. 2009 , 9 , 1139 . [ 59 ] G. Baffou , R. Quidant , C. Girard , Appl. Phys. Lett. 2009 , 94 , 153109 . [ 60 ] P. V. Kamat , M. Flumiani , G. V. Hartland , J. Phys. Chem. B 1998 ,
102 , 3123 . [ 61 ] A. Takami , H. Kurita , S. Koda , J. Phys. Chem. B 1999 , 103 , 1226 . [ 62 ] F. Stietz , Appl. Phys. A: Mater. Sci. Process 2001 , 72 , 381 . [ 63 ] N. V. Tarasenko , A. V. Butsen , E. A Nevar , Appl. Surf. Sci. 2005 , 247 , 410 . [ 64 ] Poly (4-vinyl phenol), Sigma-Aldrich database, http://www.
sigmaaldrich.com/catalog/ProductDetail.do?D7 = 0&N5 = SEARCH_CONCAT_PNO | BRAND_KEY&N4 = 436224 | ALDRICH&N25 = 0&QS = ON&F = SPEC (accessed October 2011).
[ 65 ] A. M. Russell , K. L. Lee , Structure- Property Relations in Nonferrous Metals , John Wiley & Sons Inc. , Hoboken, NJ 2005 .
[ 66 ] N. B. Sheller , S. Petrash , M. D. Foster , V. V. Tsukruk , Langmuir 1998 , 14 , 4535 .
[ 67 ] V. V. Tsukruk , Rubber Chem. Technol. 1997 , 70 , 430 . [ 68 ] M. E. McConney , S. Singamaneni , V. V. Tsukruk , Polym. Rev. 2010 ,
50 , 235 . [ 69 ] S. Singamaneni , M. K. Gupta , R. Yang , M. Tomczak , R. R. Naik ,
Z. L. Wang , V. V. Tsukruk , ACS Nano 2009 , 3 , 2593 . [ 70 ] Handbook of Ellipsometry , (Eds: H. G. Tompkins , E. A. Irene ),
Springer Science & Business , New York 2005 .
2139wileyonlinelibrary.commbH & Co. KGaA, Weinheim