LifeMode Group: Ethnic Enclaves 7D Barrios...
4
TAPESTRY SEGMENTATION TM esri.com/tapestry Households: 1,289,900 Average Household Size: 3.62 Median Age: 28.9 Median Household Income: $38,000 LifeMode Group: Ethnic Enclaves Barrios Urbanos WHO ARE WE? Family is central within these diverse communities. Hispanics make up more than 70% of the residents. More than one in four are foreign born, bringing rich cultural traditions to these neighborhoods in the urban outskirts. Dominating this market are younger families with children or single-parent households with multiple generations living under the same roof. These households balance their budgets carefully but also indulge in the latest trends and purchase with an eye to brands. Most workers are employed in skilled positions across the manufacturing, construction, or retail trade sectors. OUR NEIGHBORHOOD • Family market; over a third of all households are married couples with children, with a number of multigenerational households and single-parent families; household size is higher at 3.62. • While most residents live in single-family homes, almost 10% of householders reside in mobile home parks. • Homes are owner occupied, with slightly higher monthly costs (Index 103) but fewer mortgages (Index 83). • Most are older homes, nearly 60% built from 1950 to 1989. • Most households have one or two vehicles; many commuters car pool or walk to work (Index 145). • Barrios Urbanos residents live within the urban periphery of larger metropolitan areas across the South and West. SOCIOECONOMIC TRAITS • While a majority finished high school, over 40% have not (Index 321). • Unemployment is higher at 8.4% (Index 155); labor force participation is slightly lower at 61%. • More than one in four households is below the poverty level (Index 183). • Residents balance their budgets carefully by spending only on necessities and limiting activities like dining out. • Many have no financial investments or retirement savings, but they have their homes. Note: The Index represents the ratio of the segment rate to the US rate multiplied by 100. Consumer preferences are estimated from data by GfK MRI. 7D
Transcript of LifeMode Group: Ethnic Enclaves 7D Barrios...

TAPESTRYSEGMENTATION
TM
esri.com/tapestry
Households: 1,289,900
Average Household Size: 3.62
Median Age: 28.9
Median Household Income: $38,000
LifeMode Group: Ethnic Enclaves
Barrios Urbanos
WHO ARE WE?Family is central within these diverse communities. Hispanics make up more than 70% of the residents. More than one in four are foreign born, bringing rich cultural traditions to these neighborhoods in the urban outskirts. Dominating this market are younger families with children or single-parent households with multiple generations living under the same roof. These households balance their budgets carefully but also indulge in the latest trends and purchase with an eye to brands. Most workers are employed in skilled positions across the manufacturing, construction, or retail trade sectors.
OUR NEIGHBORHOOD• Family market; over a third of all households are married couples with children, with a number of multigenerational households and single-parent families; household size is higher at 3.62.
• While most residents live in single-family homes, almost 10% of householders reside in mobile home parks.
• Homes are owner occupied, with slightly higher monthly costs (Index 103) but fewer mortgages (Index 83).
• Most are older homes, nearly 60% built from 1950 to 1989.
• Most households have one or two vehicles; many commuters car pool or walk to work (Index 145).
• Barrios Urbanos residents live within the urban periphery of larger metropolitan areas across the South and West.
SOCIOECONOMIC TRAITS• While a majority finished high school, over 40% have not (Index 321).
• Unemployment is higher at 8.4% (Index 155); labor force participation is slightly lower at 61%.
• More than one in four households is below the poverty level (Index 183).
• Residents balance their budgets carefully by spending only on necessities and limiting activities like dining out.
• Many have no financial investments or retirement savings, but they have their homes.
Note: The Index represents the ratio of the segment rate to the US rate multiplied by 100. Consumer preferences are estimated from data by GfK MRI.
7D
TAPESTRYSEGMENTATION
TM
esri.com/tapestry
LifeMode Group: Ethnic Enclaves
Barrios Urbanos7D
85+80–8475–7970–7465–6960–6455–5950–5445–4940–4435–3930–3425–2920–2415–1910–14
5–9<5
8% 4% 0 4% 8%
Male Female
Median Household Income
Median Net Worth
$56,100
$93,300
$38,000
$26,100
$0 $100,000 $200,000 $300,000 $400,000 $500,000 $600,000
EsriMedianHHIncome
EsriMedianNetWorth
Series2 Series1
$56,100
$93,300
$38,000
$26,100
$0 $100,000 $200,000 $300,000 $400,000 $500,000 $600,000
EsriMedianHHIncome
EsriMedianNetWorth
Series2 Series1
Housing
Food
Apparel & Services
Transportation
Health Care
Entertainment & Recreation
Education
Pensions & Social Security
Other
0.0% 1.0% 2.0% 3.0% 4.0% 5.0% 6.0%
MaleAge0-4
MaleAge5-9
MaleAge10-14
MaleAge15-19
MaleAge20-24
MaleAge25-29
MaleAge30-34
MaleAge35-39
MaleAge40-44
MaleAge45-49
MaleAge50-54
MaleAge55-59
MaleAge60-64
MaleAge65-69
MaleAge70-74
MaleAge75-79
MaleAge80-84
MaleAge85+
AgebySex- Male
Series2 Series1
0.0% 0.5% 1.0% 1.5% 2.0% 2.5% 3.0% 3.5% 4.0% 4.5% 5.0%
FemaleAge0-4
FemaleAge5-9
FemaleAge10-14
FemaleAge15-19
FemaleAge20-24
FemaleAge25-29
FemaleAge30-34
FemaleAge35-39
FemaleAge40-44
FemaleAge45-49
FemaleAge50-54
FemaleAge55-59
FemaleAge60-64
FemaleAge65-69
FemaleAge70-74
FemaleAge75-79
FemaleAge80-84
FemaleAge85+
ChartTitle
Series2 Series1
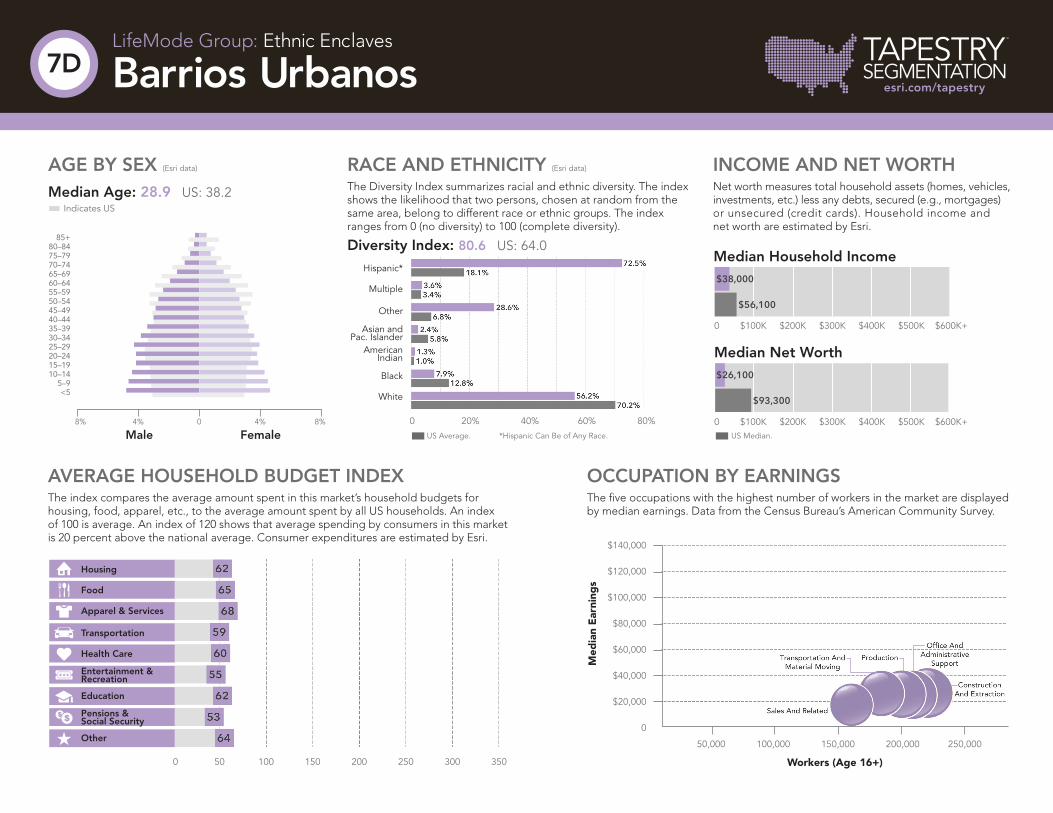
INCOME AND NET WORTHNet worth measures total household assets (homes, vehicles, investments, etc.) less any debts, secured (e.g., mortgages) or unsecured (credit cards). Household income and net worth are estimated by Esri.
OCCUPATION BY EARNINGSThe five occupations with the highest number of workers in the market are displayed by median earnings. Data from the Census Bureau’s American Community Survey.
AVERAGE HOUSEHOLD BUDGET INDEXThe index compares the average amount spent in this market’s household budgets for housing, food, apparel, etc., to the average amount spent by all US households. An index of 100 is average. An index of 120 shows that average spending by consumers in this market is 20 percent above the national average. Consumer expenditures are estimated by Esri.
AGE BY SEX (Esri data)
Median Age: 28.9 US: 38.2 Indicates US
RACE AND ETHNICITY (Esri data)
The Diversity Index summarizes racial and ethnic diversity. The index shows the likelihood that two persons, chosen at random from the same area, belong to different race or ethnic groups. The index ranges from 0 (no diversity) to 100 (complete diversity).
Diversity Index: 80.6 US: 64.0
Hispanic*
Multiple
Other
Asian and Pac. Islander
American Indian
Black
White
$140,000
$120,000
$100,000
$80,000
$60,000
$40,000
$20,000
0
50,000 100,000 150,000 200,000 250,000
*Hispanic Can Be of Any Race.
0 20% 40% 60% 80%
0 50 100 150 200 250 300 350
0 $100K $200K $300K $400K $500K $600K+
0 $100K $200K $300K $400K $500K $600K+US Average. US Median.
Med
ian
Ear
ning
s
Workers (Age 16+)
Own59.5%
Rent40.5%
ChartTitle
Own Rent
HomeOwnershipUS Percentage:
62.7% Own 37.3% Rent
Population
Population Growth (Annual %)
Population Density (Persons per sq. mile)
350
350
350
0
0
0
900,000
-0.5%
0
11,000,000
3.0%
25,000
4,708,100
1.0%
1000
Wealth Index
Socioeconomic Status Index
Housing Affordability Index
42
70
191523
TAPESTRYSEGMENTATION
TM
esri.com/tapestry
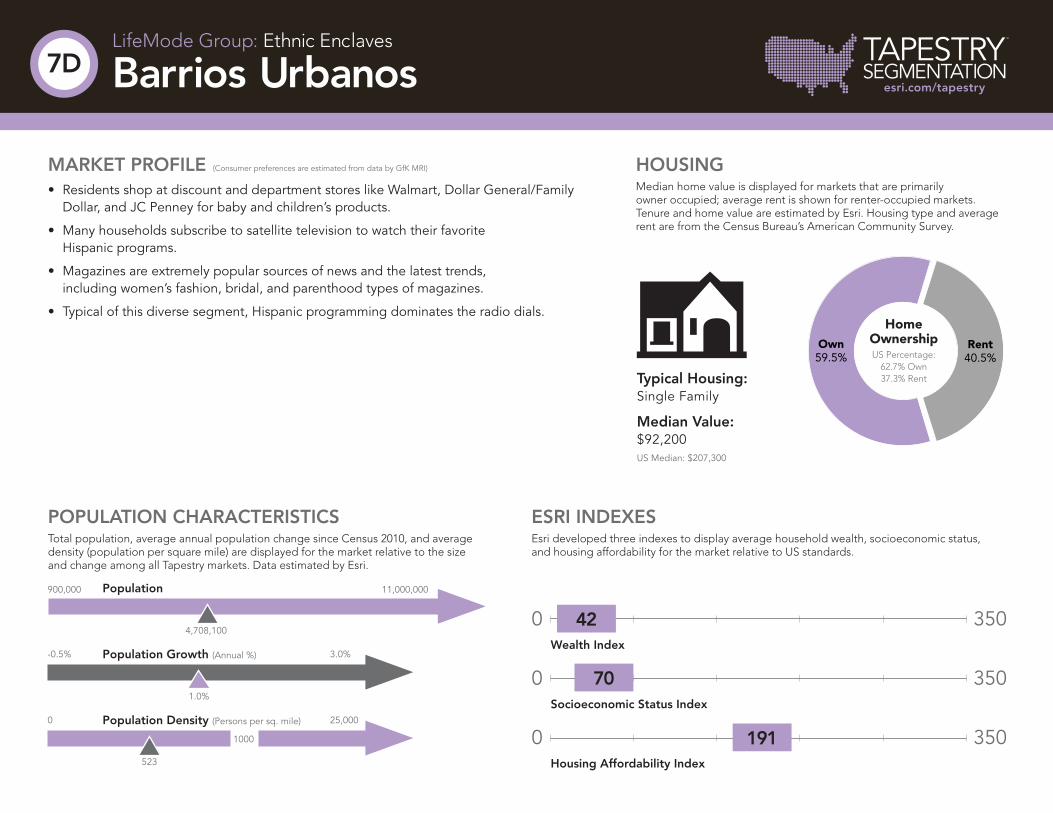
MARKET PROFILE (Consumer preferences are estimated from data by GfK MRI)
• Residents shop at discount and department stores like Walmart, Dollar General/Family Dollar, and JC Penney for baby and children’s products.
• Many households subscribe to satellite television to watch their favorite Hispanic programs.
• Magazines are extremely popular sources of news and the latest trends, including women’s fashion, bridal, and parenthood types of magazines.
• Typical of this diverse segment, Hispanic programming dominates the radio dials.
ESRI INDEXESEsri developed three indexes to display average household wealth, socioeconomic status, and housing affordability for the market relative to US standards.
POPULATION CHARACTERISTICSTotal population, average annual population change since Census 2010, and average density (population per square mile) are displayed for the market relative to the size and change among all Tapestry markets. Data estimated by Esri.
LifeMode Group: Ethnic Enclaves
Barrios Urbanos7D
HOUSINGMedian home value is displayed for markets that are primarily owner occupied; average rent is shown for renter-occupied markets. Tenure and home value are estimated by Esri. Housing type and average rent are from the Census Bureau’s American Community Survey.
Typical Housing:Single Family
Median Value:$92,200US Median: $207,300

High
Low
TAPESTRYSEGMENTATION
TM
esri.com/tapestry
SEGMENT DENSITYThis map illustrates the density and distribution of the Barrios Urbanos Tapestry Segment by households.
LifeMode Group: Ethnic Enclaves
Barrios Urbanos7D
For more information1-800-447-9778
Copyright © 2018 Esri. All rights reserved. Esri, the Esri globe logo, Tapestry, @esri.com, and esri.com are trademarks, service marks, or registered marks of Esri in the United States, the European Community, or certain other jurisdictions. Other companies and products or services mentioned herein may be trademarks, service marks, or registered marks of their respective mark owners.
G79488