This Week – 1A This Week – 1A. ANZAC Ceremony -Tuesday, 11am -Top Yard.
TAPESTRYSEGMENTATION
TM
esri.com/tapestry
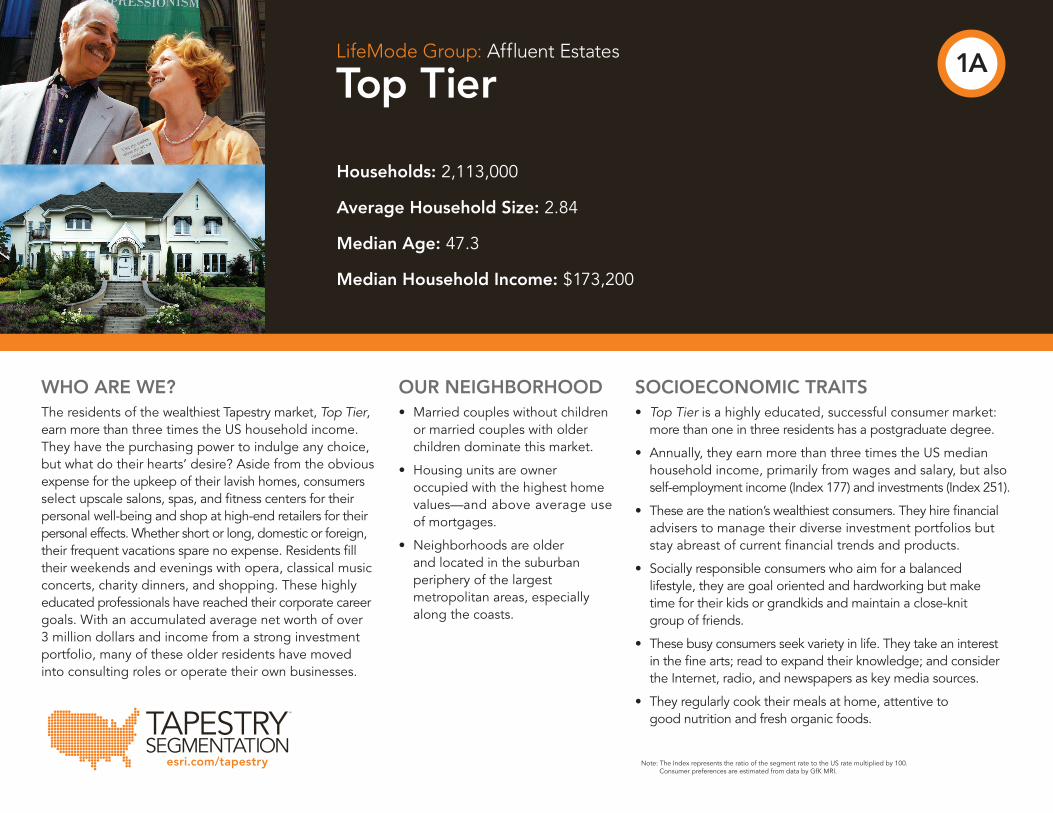
Households: 2,113,000
Average Household Size: 2.84
Median Age: 47.3
Median Household Income: $173,200
LifeMode Group: Affluent Estates
Top Tier
WHO ARE WE?The residents of the wealthiest Tapestry market, Top Tier, earn more than three times the US household income. They have the purchasing power to indulge any choice, but what do their hearts’ desire? Aside from the obvious expense for the upkeep of their lavish homes, consumers select upscale salons, spas, and fitness centers for their personal well-being and shop at high-end retailers for their personal effects. Whether short or long, domestic or foreign, their frequent vacations spare no expense. Residents fill their weekends and evenings with opera, classical music concerts, charity dinners, and shopping. These highly educated professionals have reached their corporate career goals. With an accumulated average net worth of over 3 million dollars and income from a strong investment portfolio, many of these older residents have moved into consulting roles or operate their own businesses.
OUR NEIGHBORHOOD• Married couples without children or married couples with older children dominate this market.
• Housing units are owner occupied with the highest home values—and above average use of mortgages.
• Neighborhoods are older and located in the suburban periphery of the largest metropolitan areas, especially along the coasts.
SOCIOECONOMIC TRAITS• Top Tier is a highly educated, successful consumer market: more than one in three residents has a postgraduate degree.
• Annually, they earn more than three times the US median household income, primarily from wages and salary, but also self-employment income (Index 177) and investments (Index 251).
• These are the nation’s wealthiest consumers. They hire financial advisers to manage their diverse investment portfolios but stay abreast of current financial trends and products.
• Socially responsible consumers who aim for a balanced lifestyle, they are goal oriented and hardworking but make time for their kids or grandkids and maintain a close-knit group of friends.
• These busy consumers seek variety in life. They take an interest in the fine arts; read to expand their knowledge; and consider the Internet, radio, and newspapers as key media sources.
• They regularly cook their meals at home, attentive to good nutrition and fresh organic foods.
Note: The Index represents the ratio of the segment rate to the US rate multiplied by 100. Consumer preferences are estimated from data by GfK MRI.
1A
85+80–8475–7970–7465–6960–6455–5950–5445–4940–4435–3930–3425–2920–2415–1910–14
5–9<5
8% 4% 0 4% 8%
Male Female
Median Household Income
Median Net Worth
$56,100
$93,300
$173,200
$577,500
$0 $100,000 $200,000 $300,000 $400,000 $500,000 $600,000
EsriMedianHHIncome
EsriMedianNetWorth
Series2 Series1
$56,100
$93,300
$173,200
$577,500
$0 $100,000 $200,000 $300,000 $400,000 $500,000 $600,000
EsriMedianHHIncome
EsriMedianNetWorth
Series2 Series1
Housing
Food
Apparel & Services
Transportation
Health Care
Entertainment &Recreation
Education
Pensions &Social Security
Other
0.0%0.5%1.0%1.5%2.0%2.5%3.0%3.5%4.0%4.5%5.0%
MaleAge0-4
MaleAge5-9
MaleAge10-14
MaleAge15-19
MaleAge20-24
MaleAge25-29
MaleAge30-34
MaleAge35-39
MaleAge40-44
MaleAge45-49
MaleAge50-54
MaleAge55-59
MaleAge60-64
MaleAge65-69
MaleAge70-74
MaleAge75-79
MaleAge80-84
MaleAge85+
AgebySex- Male
Series2 Series1
0.0% 0.5% 1.0% 1.5% 2.0% 2.5% 3.0% 3.5% 4.0% 4.5% 5.0%
FemaleAge0-4
FemaleAge5-9
FemaleAge10-14
FemaleAge15-19
FemaleAge20-24
FemaleAge25-29
FemaleAge30-34
FemaleAge35-39
FemaleAge40-44
FemaleAge45-49
FemaleAge50-54
FemaleAge55-59
FemaleAge60-64
FemaleAge65-69
FemaleAge70-74
FemaleAge75-79
FemaleAge80-84
FemaleAge85+
ChartTitle
Series2 Series1
281
260
288
258
278
289
381
320
303
TAPESTRYSEGMENTATION
TM
esri.com/tapestry
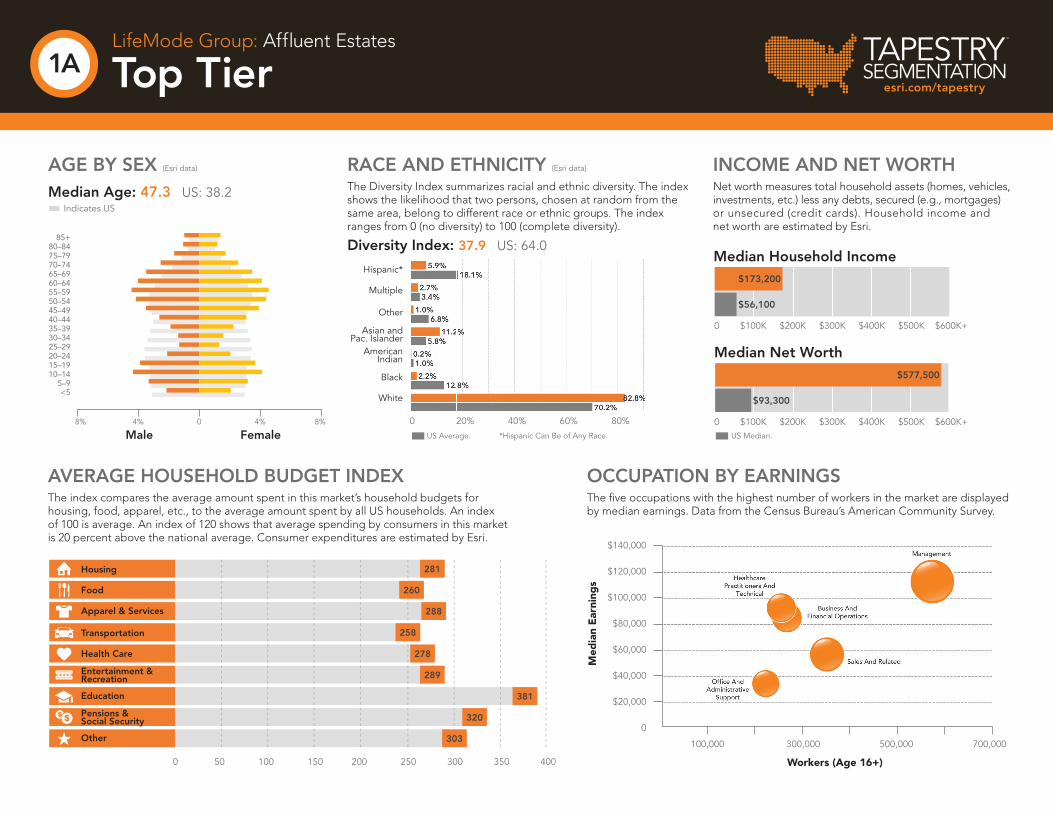
INCOME AND NET WORTHNet worth measures total household assets (homes, vehicles, investments, etc.) less any debts, secured (e.g., mortgages)or unsecured (credit cards). Household income andnet worth are estimated by Esri.
LifeMode Group: Affluent Estates
Top Tier
OCCUPATION BY EARNINGSThe fi ve occupations with the highest number of workers in the market are displayedby median earnings. Data from the Census Bureau’s American Community Survey.
AVERAGE HOUSEHOLD BUDGET INDEXThe index compares the average amount spent in this market’s household budgets for housing, food, apparel, etc., to the average amount spent by all US households. An indexof 100 is average. An index of 120 shows that average spending by consumers in this marketis 20 percent above the national average. Consumer expenditures are estimated by Esri.
AGE BY SEX (Esri data)
Median Age: 47.3 US: 38.2 Indicates US
RACE AND ETHNICITY (Esri data)
The Diversity Index summarizes racial and ethnic diversity. The index shows the likelihood that two persons, chosen at random from the same area, belong to different race or ethnic groups. The index ranges from 0 (no diversity) to 100 (complete diversity).
Diversity Index: 37.9 US: 64.0
1A
Hispanic*
Multiple
Other
Asian andPac. Islander
AmericanIndian
Black
White
$140,000
$120,000
$100,000
$80,000
$60,000
$40,000
$20,000
0
100,000 200,000 300,000 400,000 500,000 600,00 700,000
*Hispanic Can Be of Any Race.
0 20% 40% 60% 80%
0 50 100 150 200 250 300 350 400
0 $100K $200K $300K $400K $500K $600K+
0 $100K $200K $300K $400K $500K $600K+US Average. US Median.
Med
ian
Ear
ning
s
Workers (Age 16+)
Own90.2%
Rent9.8%
Population
Population Growth (Annual %)
Population Density (Persons per sq. mile)
500
500
500
0
0
0
900,000
-0.5%
0
11,000,000
3.0%
25,000
6,077,200
0.7%
999
1000
Wealth Index
Socioeconomic Status Index
Housing Affordability Index
TAPESTRYSEGMENTATION
TM
esri.com/tapestry
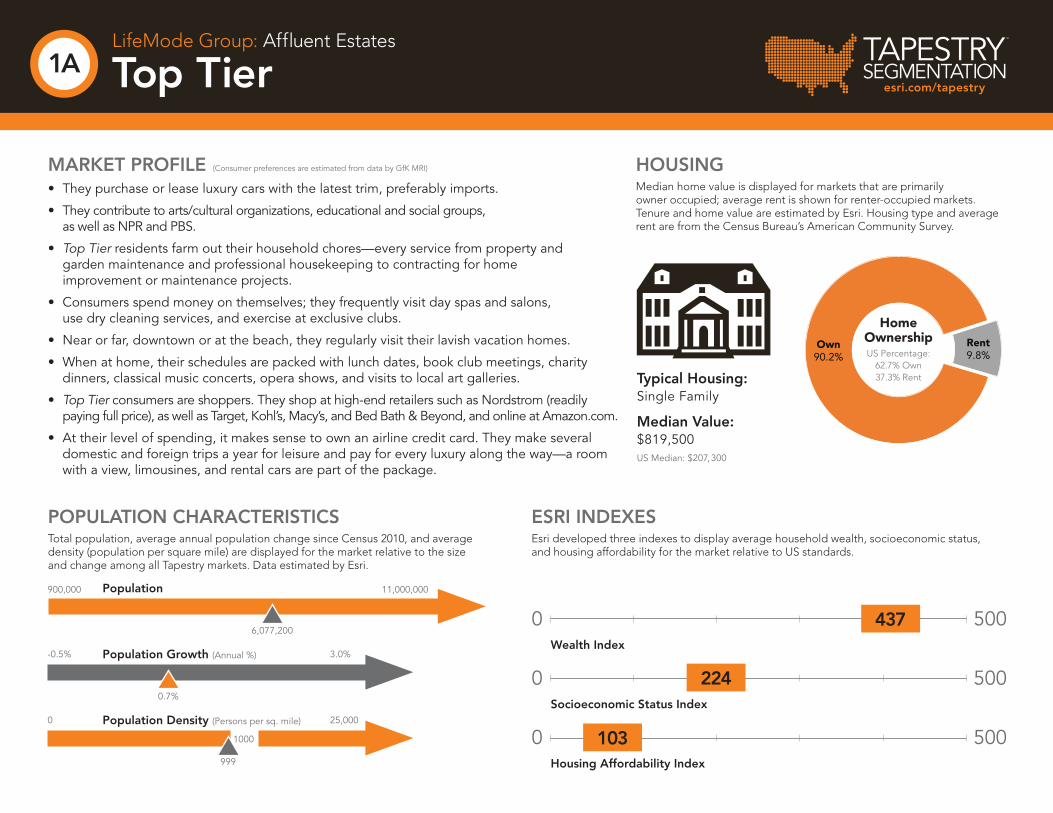
MARKET PROFILE (Consumer preferences are estimated from data by GfK MRI)
• They purchase or lease luxury cars with the latest trim, preferably imports.
• They contribute to arts/cultural organizations, educational and social groups, as well as NPR and PBS.
• Top Tier residents farm out their household chores—every service from property and garden maintenance and professional housekeeping to contracting for home improvement or maintenance projects.
• Consumers spend money on themselves; they frequently visit day spas and salons, use dry cleaning services, and exercise at exclusive clubs.
• Near or far, downtown or at the beach, they regularly visit their lavish vacation homes.
• When at home, their schedules are packed with lunch dates, book club meetings, charity dinners, classical music concerts, opera shows, and visits to local art galleries.
• Top Tier consumers are shoppers. They shop at high-end retailers such as Nordstrom (readily paying full price), as well as Target, Kohl’s, Macy’s, and Bed Bath & Beyond, and online at Amazon.com.
• At their level of spending, it makes sense to own an airline credit card. They make several domestic and foreign trips a year for leisure and pay for every luxury along the way—a room with a view, limousines, and rental cars are part of the package.
HOUSINGMedian home value is displayed for markets that are primarily owner occupied; average rent is shown for renter-occupied markets. Tenure and home value are estimated by Esri. Housing type and average rent are from the Census Bureau’s American Community Survey.
ESRI INDEXESEsri developed three indexes to display average household wealth, socioeconomic status, and housing affordability for the market relative to US standards.
POPULATION CHARACTERISTICSTotal population, average annual population change since Census 2010, and average density (population per square mile) are displayed for the market relative to the size and change among all Tapestry markets. Data estimated by Esri.
Typical Housing:Single Family
Median Value:$819,500US Median: $207,300
LifeMode Group: Affluent Estates
Top Tier1A
437
224
103
HomeOwnershipUS Percentage:
62.7% Own 37.3% Rent
High
Low
TAPESTRYSEGMENTATION
TM
esri.com/tapestry
For more information1-800-447-9778
LifeMode Group: Affluent Estates
Top Tier1A
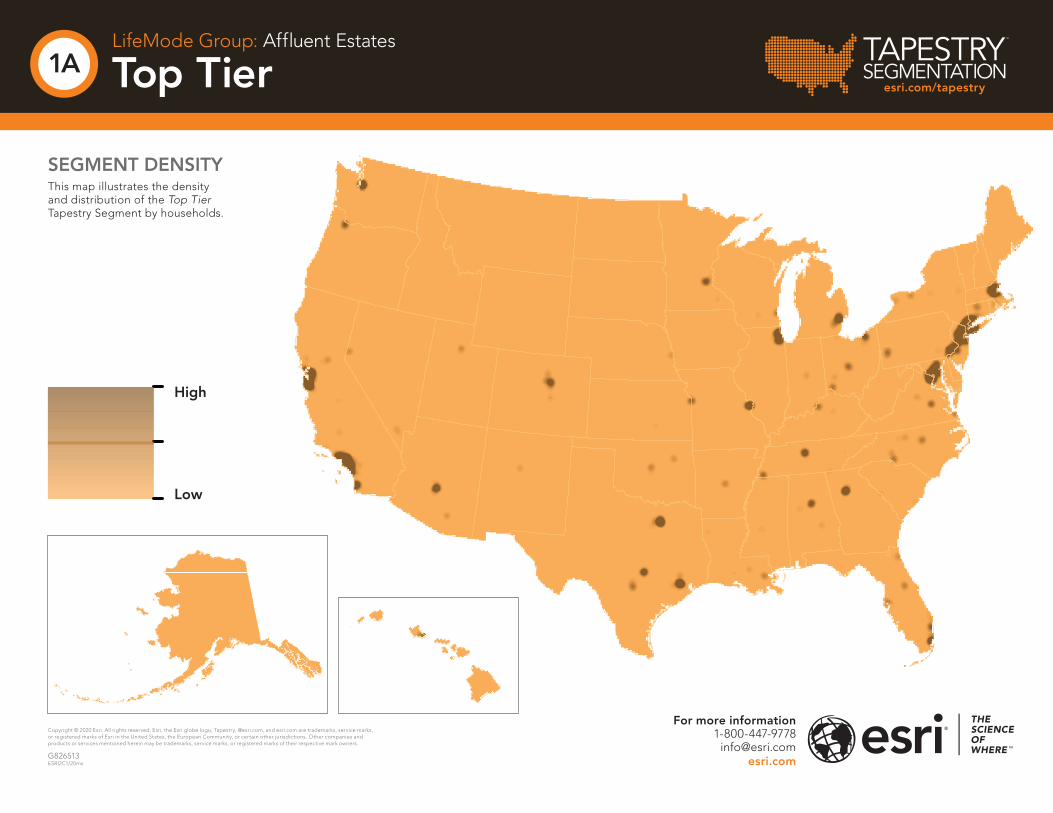
SEGMENT DENSITYThis map illustrates the density and distribution of the Top Tier Tapestry Segment by households.
Copyright © 2020 Esri. All rights reserved. Esri, the Esri globe logo, Tapestry, @esri.com, and esri.com are trademarks, service marks, or registered marks of Esri in the United States, the European Community, or certain other jurisdictions. Other companies and products or services mentioned herein may be trademarks, service marks, or registered marks of their respective mark owners.
G826513ESRI2C1/20ms