Life Insurance in a Contingent Claim Framework: Pricing ... · PDF fileLife Insurance in a...
20
The Geneva Papers on Risk andInsurance Theory, 19:53-72 (1994) 1994 The GenevaAssociation Life Insurance in a Contingent Claim Framework: Pricing and Regulatory Implications ERIC BRIYS Professor of Finance, Groupe HEC, F-78350 Jouy-en-Josas, France FRAN(~OIS DE VARENNE Ph.D. Student, Groupe HEC, France and Research Fellow, FFSA, France Abstract In this paper we developa contingent claim model to evaluate the equity and liabilities of a life insurance company. The limited liability ofshareholders is explicitly modelled. We focus ona specific type of lifeinsurance policy--namely, theprofit-sharing policy. Inthis policy, thepolicy- holderis entitled to a guaranteed interest rate anda percentage of thecompany's yearly financial revenues. The implicit equilibrium interest rate andprofit-sharing ratio are derived andanalyzed. We finally discuss regulatory measures frequently encountered inthelife insurance business such as rate ceilings,capital ratios, andasset restrictions. Key words:Life insurance, asset-liability management, solvency. I am not sure there are any serious issues confronting the life insurance in- dustry these days, unless of course you consider solvency, liquidity, junk bonds,deteriorating mortgage and real estate portfolios, risk-based capital re- quirements, asset mix, separate accounts, credit risk, congressional inquiries, shrinkingsurplus, demutualization and more. --Salvatore R. Curiale Superintendant ofNew York State Insurance Department I. Introduction The savings and loan debacle---the soaring number of insolvencies of financial institutions--have been a traumatic event for the United States. During the "roar- ing eighties," a lot of changes affected the U.S. financial landscape. The rising interest rates in the early 1980sled to a significant flow ofconsumers dollar into mutual funds. The competition for the savings dollarbecame very fierce among financial institutions. This pressure combined with regulatory mistakes (see White [1991]) had a perverse consequence on many financial institutions. They reached for riskier assets offering higher yields and operated with less capital per dollar ofassets. In that respect, the example ofthe life insurance business is very infor- mative. Life insurance companies were forced to redesign their product linesand tomigratetowardinterest-rate-sensitive products (see Wright [1991]). The ob-
Transcript of Life Insurance in a Contingent Claim Framework: Pricing ... · PDF fileLife Insurance in a...

The Geneva Papers on Risk and Insurance Theory, 19:53-72 (1994) 9 1994 The Geneva Association
Life Insurance in a Contingent Claim Framework: Pricing and Regulatory Implications ERIC BRIYS Professor of Finance, Groupe HEC, F-78350 Jouy-en-Josas, France
FRAN(~OIS DE VARENNE Ph.D. Student, Groupe HEC, France and Research Fellow, FFSA, France
A b s t r a c t
In this paper we develop a contingent claim model to evaluate the equity and liabilities of a life insurance company. The limited liability of shareholders is explicitly modelled. We focus on a specific type of life insurance policy--namely, the profit-sharing policy. In this policy, the policy- holder is entitled to a guaranteed interest rate and a percentage of the company's yearly financial revenues. The implicit equilibrium interest rate and profit-sharing ratio are derived and analyzed. We finally discuss regulatory measures frequently encountered in the life insurance business such as rate ceilings, capital ratios, and asset restrictions.
Key words: Life insurance, asset-liability management, solvency.
I am not sure there are any serious issues confronting the life insurance in- dustry these days, unless of course you consider solvency, liquidity, junk bonds, deteriorating mortgage and real estate portfolios, risk-based capital re- quirements, asset mix, separate accounts, credit risk, congressional inquiries, shrinking surplus, demutualization and more.
- -Sa lva tore R. Curiale Superintendant of New York State Insurance Department
I. Introduction
The savings and loan debacle---the soaring number of insolvencies of financial inst i tut ions--have been a traumatic event for the United States. During the "roar- ing eighties," a lot of changes affected the U.S. financial landscape. The rising interest rates in the early 1980s led to a significant flow of consumers dollar into mutual funds. The competit ion for the savings dollar became very fierce among financial institutions. This pressure combined with regulatory mistakes (see White [1991]) had a perverse consequence on many financial institutions. They reached for riskier assets offering higher yields and operated with less capital per dollar of assets. In that respect, the example of the life insurance business is very infor- mative. Life insurance companies were forced to redesign their product lines and to migrate toward interest-rate-sensitive products (see Wright [1991]). The ob-

54 ERIC BRIYS AND FRANCOIS DE VARENNE
vious consequence of this shift to investment-oriented policies was a drastic change in investment practices. Assets were restructured to search for higher yields and to trigger asset and liabilities mismatching.
The result was, as we know now, disastrous. Before 1987 fewer than ten life insurance companies insolvencies could be counted. In 1987, nineteen companies went bankrupt; in 1989, a worrisome forty; in 1991, a new record of fifty-eight insolvent life insurance companies. First Executive Corporation ($19 billion in assets) and First Capital Holdings Corporation ($10 billion in assets), for example, were trapped by junk bonds representing more than 40 percent of their assets. Baldwin United Corporation went bankrupt by mismanaging the interest-rate ex- posure of its SPDA liabilities. Monarch Life ($4.5 billion in assets), a leader in variable life, went bankrupt because of its overconcentration in high-risk real es- tate deals. This very costly turmoil triggered a great deal of regulatory action. Lessons have to be drawn from this debacle to understand what went awry and to ensure that it never happens again.
Europe has not been spared by these costly events, either. Although less pub- licity has been given to the distresses of the major European insurance companies, concern is growing among European regulators and consumers. Indeed, as Table 1 indicates, the major Scandinavian insurance companies are in a bad fix: most have been downgraded, and some have gone bankrupt.
According to a recent article published in the Economis t (July 17, 1993), firms in the United Kingdom have started to cut the bonuses on "with profits" policies. Many U.K. insurers appear to be too vulnerable to sustain high "with profits" levels. France also has exhibited the same kind of dynamics as the United States over the last ten years. Seventy-two percent of French life insurance sales are now represented by financially oriented products. Needless to say, French insur- ers have been tempted by the same devils as their American counterparts. The recent failure of the Garantie Mutuelle des Fonctionnaires is a costly example of this pattern.
The objective of the paper is to contribute to a better understanding of the driving forces of a life insurance company. Indeed, to assess the riskiness of life insurance operations, the dynamics of assets and liabilities have to be understood. The primary purpose of this article is to evaluate the equity and liabilities of a life insurance company given the risk profile of its assets and its liabilities.
Table I. Scandinavian insurers rating.
Companies 1991 rating 1993 rating
Skandia AA BBB Baltica AA BBB Hafnia AA Failure Topdanmark A BBB
Source: J.P. Morgan.

LIFE INSURANCE IN A CONTINGENT CLAIM FRAMEWORK 55
We specifically take into consideration four types of risk--asset risk, interest- rate risk, leverage risk, and default risk. To be able to do so, we use a model that is both utility free and market-value based. Although market-value accounting is still debated (see Bernard, Merton, and Palepu [1993]; Beaver, Datar, and Wolf- son [1990]; White [1991]) and may be difficult to put into practice, it is by far less misleading than the standard historical accounting approach. Our model is based on Merton's contingent-claim approach to financial intermediaries [1977, 1978, 1990]. An obvious advantage of the contingent-claim analysis is that it captures the shareholders' option to walk away when things go wrong in their firm.l Only one type of life insurance policy is considered here. It is the most common one found in France and contains only a savings component and a single premium inflow. The rate to be served on the policy is fixed and guaranteed. However, regulation imposes a profit-sharing mechanism. Indeed, by law, French life insur- ers have to pay policyholders at least 85 percent of their net financial revenues-- namely, dividends, coupons, realized capital gains, and so on.
To sum up, policyholders benefit from a guaranteed interest rate and a percent- age of the performance of the company's asset portfolio. This profit-sharing mechanism is known in France under the name of Participation aux B~n~fices and resembles the British "with profits" policies. These British policies insure customers for a lowish basic sum, which is then topped up with discretionary bonuses (the profits), depending on how the insurer's investments perform. As a result, two key inputs characterize such policies--the guaranteed interest rate and the participation level. Our model enables us to determine the fair interest rate or the fair participation level policyholders should require to fully compensate them for the risks they face. The structure of the policy is thus endogenous to the model. The whole model is driven by a competitive market assumption: life in- surance companies are both rate and participation level takers.
As an outgrowth of the model, we also examine some current regulations deal- ing with rate ceilings, asset composition, capital ratios. We show that some of these regulations are either contradictory or redundant.
The paper is structured as follows. Section 2 introduces the model and its main assumptions. In Section 3, we develop the model and derive the market values of equity and liabilities of the life insurance company. In Section 4, the fair interest rate and participation level are computed, and their properties are analyzed. We assess their sensitivity to changes in the various parameters affecting the life in- surance company. Section 5 examines regulatory issues and draws some impli- cations. A conclusion summarizes the main findings and suggests three further avenues of research.
2. The model and its assumptions
We consider a life insurance company whose planning horizon extends over a given time interval [0, T]. Time t = T can be considered as the time at which the

56 ERIC BRIYS AND FRANCOIS DE VARENNE
company is subject to a comprehensive on site audit by regulators. In the United States, these audits usually occur every three to five years. Their primary purpose is to assess the net worth of the life insurance company and to check that it is solvent. Indeed, if at the time of the audit assets are found to be less than liabili- ties, the insurance company's assets are costlessly transferred to policyholders. If the company's assets exceed liabilities, the company is allowed to pursue its operations uninterrupted. We thus lend a rather passive role to regulators like Cummins [1988] and Doherty and Garven [1986]. They follow a simple interven- tion policy. It is true that in reality regulators have a more active role and follow intervention rules that are more complex (see for instance Cummins, Harrington, and Niehaus [1993]). The purpose of the present paper, however, is not to examine regulation per se, and it considers only simple rules.
Insurance and financial markets are assumed to be competitive. The life insur- ance company is a price-taker, and therefore it will have to service policyholders on a market basis. At time t = 0, the insurance company acquires an asset port- folio A0 and finances this portfolio with paid-in capital E0 and a homogenous life insurance policy expiring at time T. If the company is not declared insolvent, new policies can be written for another period. The life insurance policy is structured as follows. The policyholder is guaranteed a fixed interest rate r*. On top of this fixed interest rate, the policyholder is entitled to a share 6 of the net financial revenues (dividends, net capital gains, coupons) of the life insurance company. This policy is quite common in France, where state regulation makes it compul- sory for life insurance companies to pass on to policyholders at least 85 percent of their financial revenues (the so-called participation bdndficiaire).
Brennan [1993] shows why "with profits" insurance policies turn out to be in- efficient under specific assumptions. Indeed, a participating or "with profits" pol- icy will be "costly or inefficient in the sense that there will exist another policy that does not involve ratcheting and provides the same distribution of final wealth while requiring a lower investment." However, both Brennan [1993] and Merton [1989] account for the existence of such policies by arguing that transaction costs provide a reason for financial intermediation. The insurance contract can then be viewed as a product that is not directly available on the mai-ket. By issuing such a contract, the insurance company contributes to a more complete market.
The regulation of participation level in France dates back to 1966. At that time, insurees still remembered the poor postwar performance of their life insurance policies. Indeed, their policies were not protected against inflation. That is why regulators decided at the time to introduce some form of indexation through the so-called participation bdn~ficiaire.
The company is thus obliged to tell policyholders the fraction 6 (6 -> 85%) that it is going to distribute to them. Although regulators claim that inflation is at the brigin of the participation mechanism, there is another way of rationalizing it.
The guaranteed rate r* is usually less than the market rate for a risk-free asset of the same maturity as the policy. The participation coefficient 6 can be viewed as making up for the difference between the two rates and embodying the required
L I F E I N S U R A N C E IN A C O N T I N G E N T C L A I M F R A M E W O R K 57
risk premium by policyholders holding risky life insurance policies. Indeed, shareholders have a limited liability, and if the company is declared insolvent at time t = T, they simply walk away. Under that scenario, policyholders re- ceive only what is left. 2 When the model is developed, this story becomes quite clear.
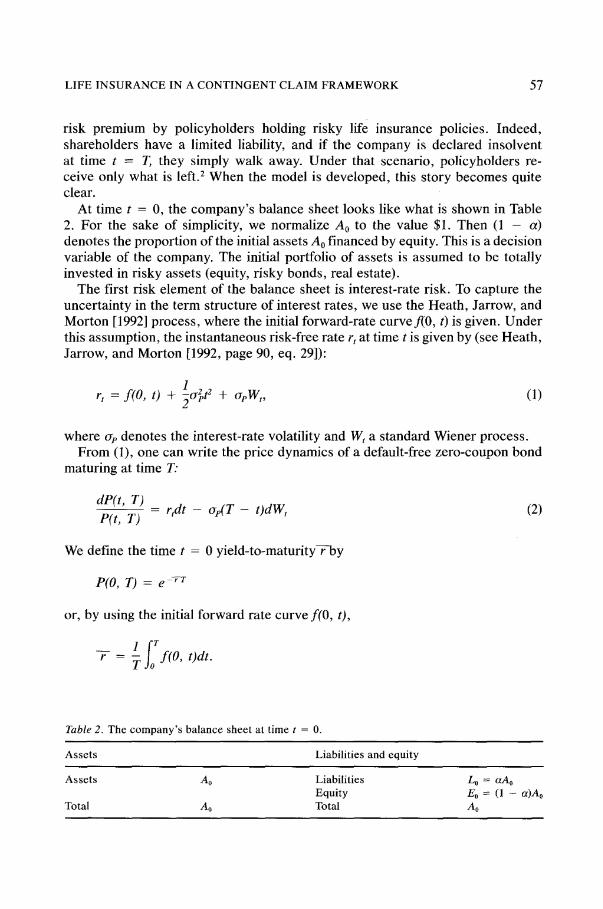
At time t = 0, the company's balance sheet looks like what is shown in Table 2. For the sake of simplicity, we normalize A0 to the value $1. Then (1 - a) denotes the proportion of the initial assets A 0 financed by equity. This is a decision variable of the company. The initial portfolio of assets is assumed to be totally invested in risky assets (equity, risky bonds, real estate).
The first risk element of the balance sheet is interest-rate risk. To capture the uncertainty in the term structure of interest rates, we use the Heath, Jarrow, and Morton [1992] process, where the initial forward-rate curve f(0, t) is given. Under this assumption, the instantaneous risk-free rate r, at time t is given by (see Heath, Jarrow, and Morton [1992, page 90, eq. 29]):
1 2 2 r t = f (O , t) +-~ae t + aeW,, (1)
where ap denotes the interest-rate volatility and W, a standard Wiener process. From (1), one can write the price dynamics of a default-free zero-coupon bond
maturing at time T:
dP(t , T) P(t, T)
- r,dt - o e ( T - OdWt (2)
We define the time t = 0 yield-to-maturity r---by
P(O, T) = e - r r
or, by using the initial forward rate curve f(O, t),
[ f T
= T Jo f(O, Odt.
Table 2. The c o m p a n y ' s ba lance shee t at t ime t = 0.
A s s e t s Liabil i t ies and equi ty
A s s e t s Ao Liabil i t ies L0 = aAo Equi ty E0 = (1 - a)Ao
Total A0 Total A0
58 ERIC BRIYS AND FRANCOIS DE VARENNE
The second risk element is asset r isk-- that is, all risk affecting assets (equity, real estate) other than the interest-rate risk. To give a complete picture of the riskiness of the insurance company, the portfolio of assets is assumed to be affected by both the interest-rate risk and the asset risk.
As a result, the portfolio of assets, At, is assumed to be governed by the follow- ing stochastic process:
dA, - #dt + aA [pdWt + lX/J--~-p2dZt], (3) At
where # and aa denote, respectively, the instantaneous expected return on assets and their instantaneous volatility. Z, is a standard Wiener process independent of W, capturing the asset risk other than the interest-rate risk. The coefficient p, included between - 1 and + 1, represents the correlation between the total value of assets A, and the interest rate rt. In other words, p corresponds to the share of interest rate risk in the total risk of the assets.
More specifically, the total variance of assets a2 can be split into two parts: an interest-rate risk component--pza~--and an asset risk component--(1 - p2)a~. Let us define Lr = aAo er*r, which is the guaranteed payoff to policyholders. The policyholders payoffs are contractually defined as follows:
1. In the first case, the insurance is totally insolvent: Ar < Lr. The time T value of assets is below the guaranteed liability. The company is declared bankrupt, and the policyholders receive what is left:
L*~ = Ar
2. In the second case, the company is able to fulfill its guaranteed commitment but unable to serve the participation bOn~ficiaire. Assuming that the policy- holders assets are earmarked, we define FRr the financial revenues to policy- holders after guaranteed commitments have been fulfilled:
FRT = 6[~oo(Ar-- A o ) - ( L T - Lo)] = b [ a . A r - L'r], (4)
where 6 denotes the contractual participation coefficient. If FRr is negative, it amounts to
A T < , a
that is,
Lr = L~.

LIFE INSURANCE IN A CONTINGENT CLAIM FRAMEWORK 59
. In the third case, FR-r is posit ive or A r >_ --.Lr Assets generate enough value to a match the guaranteed paymen t and the pol icyholders ' participation. In such a case, the liabilities at t ime T are equal to
Lv = L r + F R y
= L r + 6(aAT - L*~)
= (1 - 6 ) L T + 6aAr .
(5)
To sum up, the first case corresponds to a case of total insolvency; the second case is a partial insolvency in the sense that only guaranteed commitments are fulfilled; the third case corresponds to a fully solvent scenario.
The value L r / a delimiting the third case is not innocuous. Indeed, with our notation,
L r Lo e'*r
a Lo/Ao - - A o e r * T .
The company starts to share its profits as soon as the rate of return on the assets is bigger than the guaranteed interest rate r*.
Because of limited liability, the shareholders ' stake is a residual stake. The final payoffs Er are as follows:
First case: Ez = 0 if A r < L*~ L r Second case: Er = A~ - L~ if L~ < Ar < - -
a L*
Third case: E r = (1 - 6 a ) A r - (1 - 6)L r if ~ r <_ A r
These payoffs suggest that equity has the features of a contingent claim wri t ten on the insurance company ' s assets. Indeed, cash flows are truncated. Since the seminal works of Black and Scholes [1973] and Merton [1973], it is well known that the limited liability equity of a levered firm can be valued as a contingent claim on the f i rm's underlying assets.
3. Equity and liabilities valuation
By applying the option pricing f ramework (see Merton [1990]; Ronn and Verma [1986]; Crouhy and Galai [1991]), the marke t value of both equity and liabilities can be assessed. As far as equity is concerned, Section 2 indicates that the value of equity as of t ime T is given by
ET = Max{O, Min[A~ - L*~, (1 - 6a)AT -- (I - 6)L~]},

60 ERIC BRIYS AND FRANCOIS DE VARENNE
namely,
ET = Max[O, AT - L*~] - 6 a Max[O, A T - . a
The equity position is an hybrid position and its value as of time t, 0 <- t <- T, is given by
Et = C~(At, L'r) - 6Ce(aAt , fir), (6)
where Ce(At, L'T) and Ce(aA,~ L*O are both European calls maturing at time T - t and with exercise price LT. From Heath, Jarrow, and Morton [1992], it is easy to show that the value of the call CE(A t L*~) is given by
where
Ce(At, L'T) = A t N ( d l ) - P(t , T)L*~N(de),
l m 2 l n (A /LT*P( t , T)) + ~ a dl = a ~ v % '
d2 = dl - --ff ~/~,
~ 2 = OA 2 + paaapr + O,p2~,
r = T - t , P( t , T) = the price at time t of a riskless zero-coupon bond maturing
at time T, and
N( ) = the cumulative normal distribution.
In the same way, we can write
Ce(aa t , L'r) = a a t N ( d s ) - P( t , T)L*~(d4),
where
1 - - 2 ln(aA/L*rP(t , T)) + -~ o T
d4 = a3 - ~ - x / ~ .
and
(7)
(8)

LIFE INSURANCE IN A CONTINGENT CLAIM FRAMEWORK 61
With (7) and (8), equation (6) becomes
E, = A , [ N ( d l ) - 6aN(d3)] - P( t , T)L*r[N(dz) - 6N(d4)]. (9)
Equity is a portfolio of two European calls. The first one is the traditional limited- liability call. Shareholders have the option to walk away if things go wrong. The decond call corresponds to a short position. Indeed, shareholders have written a call to policyholders by introducing a contractual asset based participation clause. Equity is thus made of a long call position and a short call position, the latter being weighted by the participation coefficient 6. Figure 1 pictures the time T cash-flow position of the company's shareholders.
As far as liabilities are concerned, the final payoffs of Section 2 indicate that they can be priced as follows:
L, = L*rP(t, T) - PE(At, L'r) + 6 C e ( a A , , L'r), (lO)
where P e ( A , L~) denotes the price of the shareholders' put to default--that is, to walk away from their guaranteed commitments.
The liabilities are thus made of a long position on a risk-free payoff, a short position on a put to default, and a long position on a call on financial revenues. More specifically, the first two terms in (10) represent the value of a risky policy without participation (that is, a risky bond). The third term is a call option on the a fraction of the firm with the exercise price Lr.
Using the formula for the European put, equation (10) can be written as follows:
L, = A , [ N ( - d l ) + baN(d3)] + e ( t , T)L*~[N(d2) - ON(d4)]. (11)
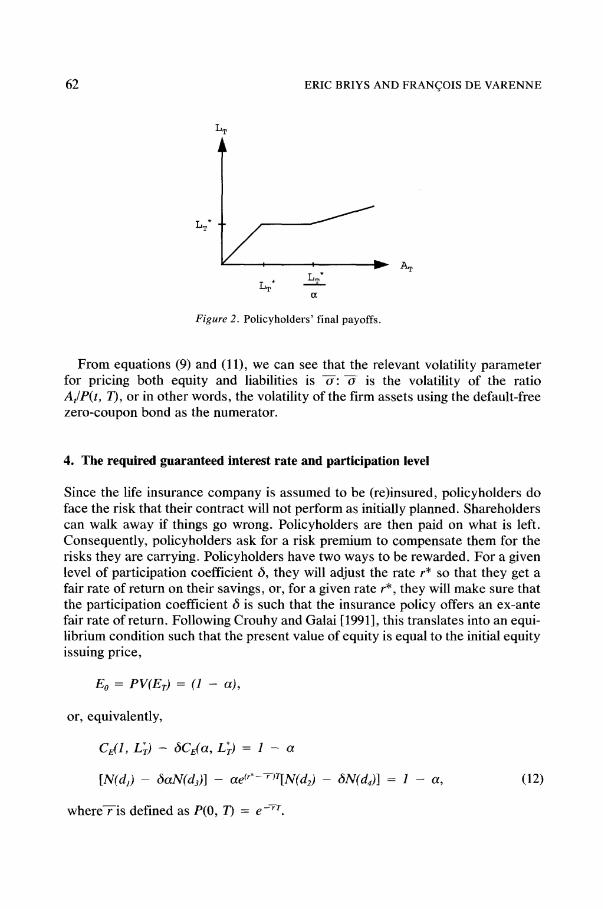
This combined position can be summarized by Figure 2, which shows liability cash flows as of time T.
L~* LT*
Figure 1. Shareholders' final payoffs.
62 ERIC BRIYS AND FRANCOIS DE VARENNE
LT* / r
LT* LT* (X
Figure 2. Policyholders' final payoffs.
2%
From equations (9) and (11), we can see that the relevant volatility parameter for pricing both equity and liabilities is -6-: ~- is the volatility of the ratio A , / P ( t , 19, or in other words, the volatility of the firm assets using the default-free zero-coupon bond as the numerator.
4. The required guaranteed interest rate and participation level
Since the life insurance company is assumed to be (re)insured, policyholders do face the risk that their contract will not perform as initially planned. Shareholders can walk away if things go wrong. Policyholders are then paid on what is left. Consequently, policyholders ask for a risk premium to compensate them for the risks they are carrying. Policyholders have two ways to be rewarded. For a given level of participation coefficient 6, they will adjust the rate r* so that they get a fair rate of return on their savings, or, for a given rate r*, they will make sure that the participation coefficient 6 is such that the insurance policy offers an ex-ante fair rate of return. Following Crouhy and Galai [1991], this translates into an equi- librium condition such that the present value of equity is equal to the initial equity issuing price,
Eo = P V ( E r ) = (1 - a ) ,
or, equivalently,
C e ( l , L 'r) - 6 C E ( a , L r ) = 1 - a
[ N ( d ~ ) - 6 a N ( d 3 ) ] - a e ( r * - ~ > r [ N ( d 2 ) - 6 N ( d 4 ) ] = 1 - a , (12)
where-r-is defined as P(0, 7) = e-r~r.

L I F E I N S U R A N C E IN A C O N T I N G E N T CLAIM F R A M E W O R K 63
Indeed, on one hand, shareholders will never invest in the life insurance com- pany if the present value of their investment is less than their initial outlay. On the other hand, policyholders will make sure that either the guaranteed rate r* or the participation level 6 is compatible with a fair risk-adjusted return on their claim.
As a result, equation (12) gives either the guaranteed rate r* or the participation level 6 as the equilibrating variable. If 6 is given, the guaranteed rate r* remains to be determined so that equation (12) is satisfied. If r* is given, equation (12) yields the equilibrating value of the participation coefficient 6. It is worthwhile noting that while r* cannot be computed explicitly, an analytical expression for the participation coefficient 6 can be derived:
6 = C e ( 1 , L*~) - (1 - a )
Cda, L~) (13)
Replacing the respective calls by their closed form solutions in (13) yields
a [ 1 - e ( r * - V - ) r N ( d 2 ) ] + N ( d l ) - 1 6 = a [ N ( d s ) - - e ( r * - T ) T N ( d 4 ) ] ' (14)
where dl, d> d3, and d4 are defined as above. By applying the put-call parity, the participation level 6 can be rewritten as a
function of the shareholders' put to default:
a - L~P(O, ~) + P d l , L*~) 6 = Cda L~) (15)
We now examine the effect of the different parameters (volatility ~-, capital ratio a, and so on) on the equilibrating values of the guaranteed interest rate r* and of the participation level 6.
Let us rewrite equation (12) as
g(r* , - -~ , a , - -~, 6 ) = I N ( d 1 ) - 6 c t N ( d s ) ] - a e ( r * - r w [ N ( d 2 ) - O N ( d 4 ) ] - (1 - a ) = O. (16)
This function g will be used in the following for computing the relevant compar- ative statics?

64 ERIC BRIYS A N D FRAN(~OIS DE V A R E N N E
4.1. The e f f ec t o f total volatility on the level o f the g u a r a n t e e d interest rate
To capture the response of the guaranteed interest rate r* to a change in total volatility ~-, one implicitly differentiates the function g as defined in (16), which yields the following:
dr* Og[O~ "2 c l ~ ------5 = Og/Or* " (17)
It is fairly easy to show that the denominator is always negative. This, in turn, implies that
sgn - o } = s g n . (18)
After computations, one can write
- - - [N ' (d~) - a6N'(d3)]. (19) O ~ 2 Z 0
Except for the case where the participation coefficient 6 is nil, the sign of this expression is ambiguous. Figure 3 depicts the guaranteed rate r* as a function of total volatility -6- for different participation levels 6.
The base case is the case where 6 is equal to zero. Indeed, it corresponds to the situation analyzed by Crouhy and Galai [1991]. As indicated in (19), the inter- est rate r* always increases when total volatility -6- increases. This effect simply
0.5
~0.4
0.2
0.i ~ delta = 0.85
0.i 0.2 0.3
volatility
0.4 0 . 5
Figure 3. The guaranteed interest rate r* as a function of total volatility ~ (a = 0.9, 7 = 0.15, T = 1).

L I F E I N S U R A N C E IN A C O N T I N G E N T CLAIM F R A M E W O R K 65
reflects an increasing risk premium required by policyholders for the growing risk they face.
The case of a nonzero 6 is not as clear cut. It can however be shown that the curve linking r* to --6- is U-shaped. For low volatility levels, the guaranteed rate r* is decreasing. For high volatility levels, r* is increasing. Policyholders face a volatility dilemma. Indeed, they are both short a put to default and long a call to participate. On one hand, an increase in volatility makes the company more prone to default. But on the other hand, it has a positive effect on the policyholders' participation to financial revenues of the insurance company. For low level of volatility, this latter effect dominates. When the participation level 6 increases, policyholders become more volatility prone.
4.2. The effect o f total volatility on the level o f the participation coefficient
By differentiating (14) with respect to -6 -2, we obtain
O6 Cda , L*r)N'(d,) - a[CE(1, L'r) - (1 - a)]N'(d3) N/~ 0 -~-2 ~- C2E(a L'r) 2 ~ ' (20)
whose sign is ambiguous. Figure 4 depicts the relationship between 6 and ~- for various levels of the capital ratio a. The same pattern as previously applies. Pol- icyholders are interested in volatility as long as it is not too high. Again, this reflects the effect of their long call position.
It is worthwhile noting that the equilibrating participation coefficient 6 may well be below the French regulatory threshold of 85 percent, as shown by Figure 4 and
1
7 0,9 0 ~ 0.8 o ~ 0.7 uO.6
"~0.5
0.4
alpha = 0.85
0.I 0.2 0.3 0.4 .5
volatility
Figure 4. The participation coefficient 6 as a function of total volatility ~ (7 = 0.15, r* = 0.12, T= 1).

66 ERIC BRIYS A N D F R A N C O I S DE V A R E N N E
Table 3. Forcing the company to apply a minimum 85 percent level may have two consequences: either the company reduces the riskiness of its assets (left shift) or it really increases it (right shift). The second solution is certainly not what is ex- pected by regulators.
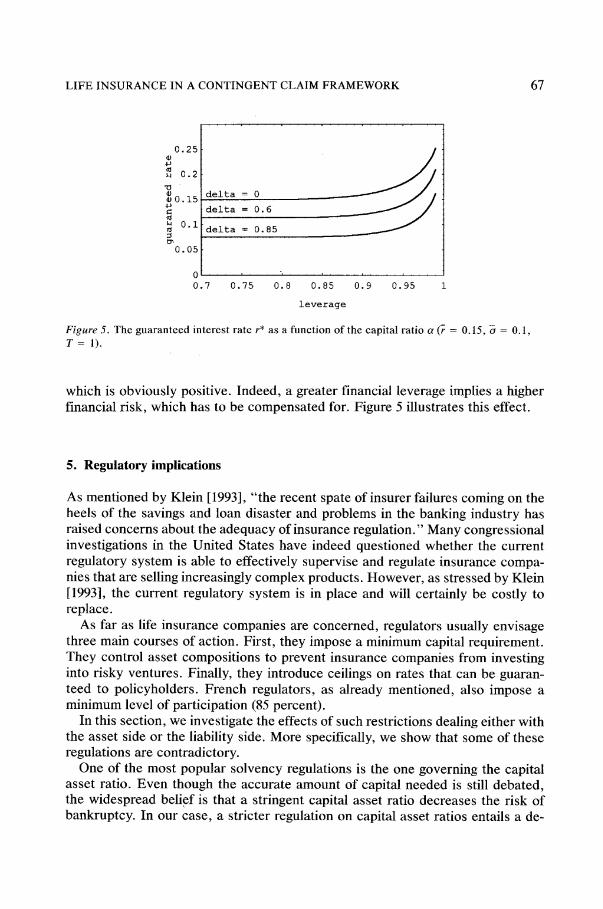
4.3. The impact of the leverage on the guaranteed rate
By the same implicit differentiation token as above, we obtain
{dr* = sgn~--d--da } s g n ( ~ ) ,
where
Og N( - dl) o a a
Table 3. The par t ic ipat ion coeff icient 6 as a func t ion o f total volati l i ty ~, leverage a and gua ran t eed in teres t rate r* (r = 0.15, T = 1).
Panel A: r* = 0.1125
a
0.70 0.75 0.80 0.85 0.90 0.95 0.99
0.05 0.85 0.85 0.85 0.85 0.85 0.87 0.96 0.10 0.61 0.61 0.61 0.63 0.67 0.78 0.95 0.15 0.47 0.48 0.50 0.55 0.65 0.79 0.95 0.20 0.40 0.43 0.48 0.57 0.67 0.82 0.96 0.25 0.38 0.42 0.49 0.59 0.70 0.84 0.97 0.30 0.38 0.45 0.53 0.62 0.73 0.86 0.97
Panel B: r* = 0.0825
a
0.70 0.75 0.80 0.85 0.90 0.95 0.99
0.05 0.97 0.97 0.97 0.97 0.97 0.97 0.99 0.10 0.82 0.82 0.82 0.82 0.84 0.89 0.97 0.15 0.68 0.68 0.70 0.72 0.78 0.87 0.97 0.20 0.58 0.60 0.63 0.69 0.76 0.87 0.97 0.25 0.53 0.57 0.62 0.68 0.77 0.88 0.97 0.30 0.51 0.56 0.62 0.70 0.79 0.89 0.98
L I F E I N S U R A N C E IN A C O N T I N G E N T CLAIM F R A M E W O R K 67
0.25
0.2
~0.15
0.I m
0.05
delta = 0
idelta = 0.6
delta = 0.85
0,7 0.75 0.8 0.85 0.9 0.95
leverage
Figure 5. The guaranteed interest rate r* as a function of the capital ratio ct (r = 0.15, a = 0.1, T = 1).
which is obviously positive. Indeed, a greater financial leverage implies a higher financial risk, which has to be compensated for. Figure 5 illustrates this effect.
5. Regulatory implications
As mentioned by Klein [1993], "the recent spate of insurer failures coming on the heels of the savings and loan disaster and problems in the banking industry has raised concerns about the adequacy of insurance regulation." Many congressional investigations in the United States have indeed questioned whether the current regulatory system is able to effectively supervise and regulate insurance compa- nies that are selling increasingly complex products. However, as stressed by Klein [1993], the current regulatory system is in place and will certainly be costly to replace.
As far as life insurance companies are concerned, regulators usually envisage three main courses of action. First, they impose a minimum capital requirement. They control asset compositions to prevent insurance companies from investing into risky ventures. Finally, they introduce ceilings on rates that can be guaran- teed to policyholders. French regulators, as already mentioned, also impose a minimum level of participation (85 percent).
In this section, we investigate the effects of such restrictions dealing either with the asset side or the liability side. More specifically, we show that some of these regulations are contradictory.
One of the most popular solvency regulations is the one governing the capital asset ratio. Even though the accurate amount of capital needed is still debated, the widespread belief is that a stringent capital asset ratio decreases the risk of bankruptcy. In our case, a stricter regulation on capital asset ratios entails a de-
68 ERIC BRIYS A N D FRAN(~OIS DE V A R E N N E
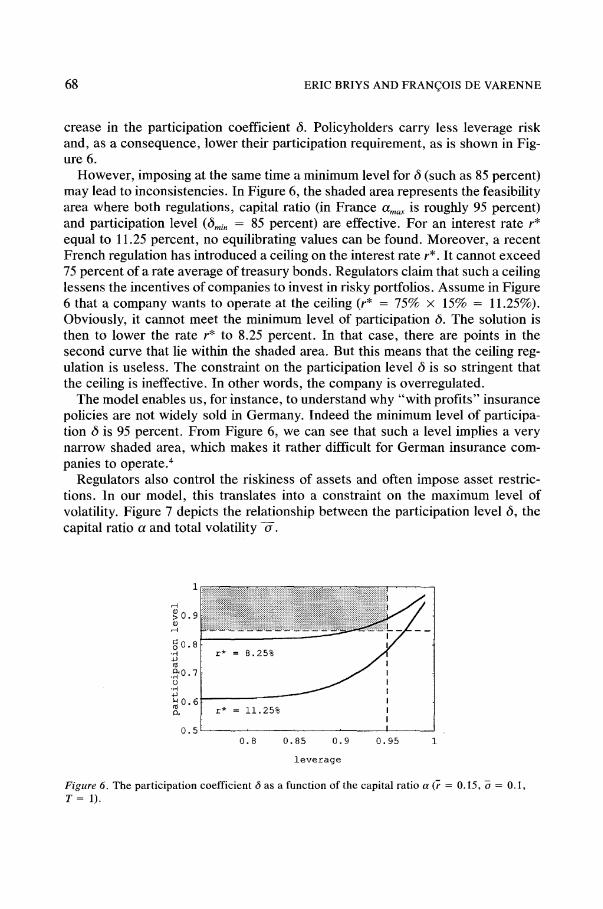
crease in the participation coefficient 6. Policyholders carry less leverage risk and, as a consequence, lower their participation requirement, as is shown in Fig- ure 6.
However , imposing at the same time a minimum level for 6 (such as 85 percent) may lead to inconsistencies. In Figure 6, the shaded area represents the feasibility area where both regulations, capital ratio (in France O~ma x is roughly 95 percent) and participation level (Omi n = 85 percent) are effective. For an interest rate r* equal to 11.25 percent, no equilibrating values can be found. Moreover , a recent French regulation has introduced a ceiling on the interest rate r*. It cannot exceed 75 percent of a rate average of t reasury bonds. Regulators claim that such a ceiling lessens the incentives of companies to invest in risky portfolios. Assume in Figure 6 that a company wants to operate at the ceiling (r* = 75% • 15% = 11.25%). Obviously, it cannot meet the minimum level of participation 6. The solution is then to lower the rate r* to 8.25 percent. In that case, there are points in the second curve that lie within the shaded area. But this means that the ceiling reg- ulation is useless. The constraint on the participation level 6 is so stringent that the ceiling is ineffective. In other words, the company is overregulated.
The model enables us, for instance, to understand why "with profi ts" insurance policies are not widely sold in Germany. Indeed the minimum level of participa- tion 6 is 95 percent. From Figure 6, we can see that such a level implies a very narrow shaded area, which makes it rather difficult for German insurance com- panies to opera te?
Regulators also control the riskiness of assets and often impose asset restric- tions. In our model, this translates into a constraint on the maximum level of volatility. Figure 7 depicts the relationship between the participation level 6, the capital ratio a and total volatility -6-.
1
~0.9 9
o~0.8
.30,7 o
. , q 4 ~
~ 0 . 6
0,~
: : : : : : : : : : : : : : : : : : : : : : : : : : : : : : : : : : : : : : : : : : : : : : : : : : : : : : : : : : : : : : : : : : : : : : : : : : : : : : : : : : : : : : : : : : : : : : : : : : : : : : : : : 9 .
r* = 8.25% / /
r* = 11.25%
0.8 0.85 0.9 0.95
leverage
Figure 6. The par t ic ipat ion coeff ic ient 6 as a func t ion o f the capital ratio a (7 = 0 . I5 , ~ = 0.1, T = 1).

L I F E I N S U R A N C E IN A C O N T I N G E N T CLAIM F R A M E W O R K 69
0.95 participation level
75 1
0.8 leverage
~.6
~'~ volatility 0.5
Figure 7. The relationship between the participation level 6, the capital ratio a and the total vola- tility ~ ( t ~ = 0.15, r* = 0.1125, T = 1).
Assume that the company is operating at a rate r*, which satisfies the ceiling constraint. Assume also that regulators impose a maximum volatility of 30 per- cent. One can see, from Figure 7, that less capitalized companies (a close to 95 percent) have greater room for maneuvering. Indeed, there are two asset struc- tures C6- < 30%) for which the participation level 6 is above its minimum. Ac- cording to the well-known result of Galai and Masulis [1976], shareholders may then have an incentive to unexpectedly shift from the less risky structure to the riskier structure. For well capitalized companies there is only one choice, which corresponds to a very low volatility level. At this low volatility level, they can enforce the minimum participation coefficient of 85 percent. Again here, some regulations are either inconsistent or redundant given market forces. Figure 4 and Figure 7 also show that for some values of the relevant parameters, the asset- structure constraint may be irrelevant. Indeed, assume that regulators impose a leverage constraint such that a has to be lower than 0.95 and that the asset restric- tion leads to a maximum volatility compatible with a equal to 0.95. Then it is obvious that the floor constraint 6 is strong enough to force insurance companies to migrate toward a low level of volatility (compatible with 6 at least equal to 0.85).
6. Conclusion
Recently, life insurance companies have been forced to redesign their product lines. The most obvious consequence of this reshuffling has been a shift toward interest-rate-sensitive policies. Life insurance companies have become more sen- sitive to interest-rate movements than in the past. This trend occurs at a time

70 ERIC BRIYS AND FRAN(~OIS DE VARENNE
where an unprecedented tide of financial insolvencies has raised growing con- cerns among politicians, claimholders, and regulators.
By relying on a contingent claim valuation framework, the model presented in this paper tries to capture the various risks that a life insurance carries. Asset risk, interest-rate risk, default risk, and leverage risk have been considered. Their respective effects on the company and its solvency have been assessed. More specifically, a competitive market assumption combined with the option pricing framework shows how assets and liabilities are intertwined. The implications of a specific asset structure, of a particular leverage ratio, and of the level of default- free interest rates for the contractual features of "with profits" policies have been drawn. Some insights on regulation have also been given.
The framework presented here is fairly general and should open at least three further avenues of research. First, an immediate outgrowth of the model is to introduce so-called embedded options. Indeed, most life insurance policies con- tain various types of options such as policy loan options and early lapsation op- tions. For instance, when insureds are allowed to drop out early while being guar- anteed a fixed rate, their position is equivalent to a long position on a (zero- coupon) bond put option. It is to be expected in that case that the participation level 6 should be lower ceteris paribus. However, imposing a floor on 6 may have some unexpected consequences and imply that embedded options are mispriced.
The second area for future research relates to the concept of immunization. From our model, interest-rate sensitivities of both assets and liabilities can be computed and used to design immunization strategies. Finally, the model can ac- commodate reinsurance contracts. Possible risk-shifting behavior between the in- surance and the reinsurance company can then be analyzed.
Acknowledgments
This paper was presented at the Twentieth Seminar of the European Group of Risk and Insurance Economists in Rotterdam, the 1994 Western Risk and Insur- ance Association meeting in Honolulu, and the 1994 Risk Theory Seminar in Aus- tin, Texas. We are grateful for comments from Professor J. Bouman, Erasmus University, Professor H. Louberg6, University of Geneva, Professor A. Shapiro, Pennsylvania State University, and Professor B. Witt, University of Texas in Aus- tin. Many thanks also to the two referees and to D. Wauters, J.P. Morgan, and V. Filatov, Smith Barney Shearson. The usual caveat applies.
Notes
1. The application of option pricing to insurance avoids some problems encountered with C A P M - - especially the effect of insolvency on the shareholders ' fair rate of return (see Doherty and Garven [1986]; D'Arcy and Doherty [1988]).

LIFE INSURANCE IN A CONTINGENT CLAIM FRAMEWORK 71
2. Ingersoll [1987] explains why the policyholders have no incentive to renegotiate their contracts in case of default.
3. The various computations and graphs have been performed through numerical methods avail- able on Mathematica.
4. We are grateful to Diego Wauters for suggesting this interpretation.
References
BEAVER, W., DATA, S., and WOLFSON, M. [1990]: "The role of market value accounting in the regulations of insured depository institutions," Working Paper, Stanford University.
BERNARD, V.L., MERTON, R.C., and PALEPU, K.G. [1993]: "Mark-to-market accounting for U.S. banks and thrifts: Lessons from the Danish experience," Working Paper 93-034, Harvard Business School.
BLACK, F. and SCHOLES, M. [1973]: "The pricing of options and corporate liabilities," Journal of Political Economy, 81,637-659.
BRENNAN, M.J. [1993]: "Aspects of insurance, intermediation and finance," Geneva Papers on Risk and Insurance Theory, 18(1), 7-30.
CROUHY, M. and GALAI, D. [1991]: "A contingent claim analysis of a regulated depository institution," Journal of Banking and Finance, 15, 73-90.
CUMMINS, J.D. [1988]: "Risk-based premiums for insurance guaranty funds," Journal of Fi- nance, 43,823-839.
CUMMINS, J.D., HARRINGTON, S., and NIEHAUS, G. [1993]: "Risk-based capital require- ments for property-liability insurers: An analysis of conceptual and measurement issues." Paper presented at the Conference on the Dynamics of the Insurance Industry, New York University Salomon Center, May 20-21.
D'ARCY, S. and DOHERTY, N.A. [1988]: "The financial theory of pricing property-liability in- surance contracts," Huebner Foundation Monograph 15, Wharton School, University of Penn- sylvania.
DOHERTY, N.A. and GARVEN, J.R. [1986]: "Price regulation in property-liability insurance: A contingent claims approach," Journal of Finance, 41, 1031-1050.
"Failed promises: Insurance company insolvencies." [1990]: Report by the Subcommittee on Oversight and Investigations of the House Committee on Energy and Commerce, Rep. John Dingell, Chair., U.S. House of Representatives (Washington, D.C.: U.S. Government Printing Office).
GALAI, D. and MASULIS, R. [1976]: "The option pricing model and the risk factor of stock," Journal of Financial Economics, 3, 53-81.
HEATH, D., JARROW, R., and MORTON, A. [1992]: "Bond pricing and the term structure of interest rates: A new methodology for contingent claims valuation," Econometrica, 60(1), 77- 105.
INGERSOLL, J.E., Jr. [1987]: Theory of Financial Decision Making. Rownam & Littlefield. KLEIN, R.W. [1993]: "Solvency monitoi-ing of insurance companies: Regulators' role and future
direction," Paper presented at the Conference on the Dynamics of the Insurance Industry, New York University Salomon Center, May 20-21.
MERTON, R.C. [1973]: "Theory of rational option pricing," Bell Journal of Economics and Man- agement Science, 4, 141-183.
MERTON, R.C. [1977]: "An analytic derivation of the cost of deposit insurance and loan guaran- tees," Journal of Banking and Finance, 1, 3-I 1.
MERTON, R.C. [1978]: "On the cost of deposit insurance when there are surveillance costs," Journal of Business, 51,439-452.

72 ERIC BRIYS AND FRANGOIS DE VARENNE
MERTON, R.C. [1989]: "On the application of the continuous-time theory of finance to financial intermediation and insurance," Geneva Papers on Risk and Insurance, 14(52), 225-261.
MERTON, R.C. [1990]: Continuous Time Finance. Cambridge: Basil BlackweU. RONN, E.I. and VERMA, A.K. [1986]: "Pricing risk-adjusted deposit insurance: An option-based
model ," Journal o f Finance, 41,871-895. WHITE, L.J. [1991]: The S&L Debacle. Oxford: Oxford University Press. WRIGHT, K.M. [1991]: "The structure conduct and regulation of the life insurance industry," in
R.W. Kopcke and R.E. Randall (Eds.), The Financial Condition and Regulation o f lnsurance Companies. Boston: Federal Reserve Bank of Boston.