
Life in the fast lane: Origins of competitive interaction
21
Strategic Management Journal Strat. Mgmt. J., 31: 1527–1547 (2010) Published online EarlyView in Wiley Online Library (wileyonlinelibrary.com) DOI: 10.1002/smj.894 Received 1 October 2008; Final revision received 2 June 2010 LIFE IN THE FAST LANE: ORIGINS OF COMPETITIVE INTERACTION IN NEW VS. ESTABLISHED MARKETS ERIC L. CHEN, 1 RIITTA KATILA, 2 * RORY MCDONALD, 2 and KATHLEEN M. EISENHARDT 2 1 Halozyme Therapeutics, San Diego, California, U.S.A. 2 Department of Management Science & Engineering, Stanford University, Stanford, California, U.S.A. Prior work examines competitive moves in relatively stable markets. In contrast, we focus on less stable markets where competitive advantages are temporary and R&D moves are essential. Using evolutionary search theory and an experiential simulation with in-depth fieldwork, we find that the relationship between performance and subsequent competitive moves depends on the type of market, not just on whether performance is high or low. High performers seek to maintain status quo, but this requires different strategies in different markets. They are conservative in established markets and bold in new ones. In contrast, low performers seek to disrupt the status quo. Again, this requires different strategies in different markets. Unlike high performers, low performers are bold in established markets and conservative in new ones where they lack understanding of how to disrupt rivals. Overall, our results incorporate unstable markets in theories of competitive dynamics and competitive interaction in theories of evolutionary search. By examining R&D moves, we also extend competitive dynamics research to include technology-based firms for whom temporary advantages are often essential. Copyright 2010 John Wiley & Sons, Ltd. INTRODUCTION How do firms generate temporary competitive advantages? Organization and strategy theorists highlight several types of competitive moves that firms use to defend or improve their position rel- ative to competitors (Chen and Hambrick, 1995; Ferrier, Smith, and Grimm, 1999; Katila and Chen, 2008). For instance, researchers have studied pric- ing and advertising (e.g., Smith, Ferrier, and Ndo- for, 2001) as well as capacity (e.g., Audia and Greve, 2006) and boundary (Ozcan and Eisenhardt, 2009) moves in varied empirical settings from air- lines (Miller and Chen, 1996) to robotics (Katila Keywords: competition; evolutionary search; temporary advantage; R&D; new markets * Correspondence to: Riitta Katila, Department of Management Science & Engineering, Huang Engineering Center, Stanford University, Stanford, California, U.S.A. E-mail: [email protected] and Chen, 2008), shipbuilding (Greve, 2003a), and Fortune 500 firms (Ferrier, 2001). The core premise is that engaging rivals through competitive moves generates a series of temporary advantages that lead to superior performance. Several insights emerge from this research. Nor- mative insights suggest that making more moves, more complex moves, and more aggressive moves (i.e., sooner) leads to higher performance (Young, Smith, and Grimm, 1996; Grimm, Lee, and Smith, 2006; Ozcan and Eisenhardt, 2009). Descriptive insights center on the motivations of executives to engage their competitors. One explanation is that strategic incentives, especially the need to improve performance, will spur competitive moves (Smith et al., 2001; Greve, 2003b). Another is that firms are more likely to enact moves if they know that their competitors are unlikely or unable to respond with damaging countermoves (Gimeno, 1999). Copyright 2010 John Wiley & Sons, Ltd.
Transcript of Life in the fast lane: Origins of competitive interaction

Strategic Management JournalStrat. Mgmt. J., 31: 1527–1547 (2010)
Published online EarlyView in Wiley Online Library (wileyonlinelibrary.com) DOI: 10.1002/smj.894Received 1 October 2008; Final revision received 2 June 2010
LIFE IN THE FAST LANE: ORIGINS OF COMPETITIVEINTERACTION IN NEW VS. ESTABLISHED MARKETSERIC L. CHEN,1 RIITTA KATILA,2* RORY MCDONALD,2
and KATHLEEN M. EISENHARDT2
1 Halozyme Therapeutics, San Diego, California, U.S.A.2 Department of Management Science & Engineering, Stanford University, Stanford,California, U.S.A.
Prior work examines competitive moves in relatively stable markets. In contrast, we focus on lessstable markets where competitive advantages are temporary and R&D moves are essential. Usingevolutionary search theory and an experiential simulation with in-depth fieldwork, we find thatthe relationship between performance and subsequent competitive moves depends on the type ofmarket, not just on whether performance is high or low. High performers seek to maintain statusquo, but this requires different strategies in different markets. They are conservative in establishedmarkets and bold in new ones. In contrast, low performers seek to disrupt the status quo. Again,this requires different strategies in different markets. Unlike high performers, low performers arebold in established markets and conservative in new ones where they lack understanding of howto disrupt rivals. Overall, our results incorporate unstable markets in theories of competitivedynamics and competitive interaction in theories of evolutionary search. By examining R&Dmoves, we also extend competitive dynamics research to include technology-based firms forwhom temporary advantages are often essential. Copyright 2010 John Wiley & Sons, Ltd.
INTRODUCTION
How do firms generate temporary competitiveadvantages? Organization and strategy theoristshighlight several types of competitive moves thatfirms use to defend or improve their position rel-ative to competitors (Chen and Hambrick, 1995;Ferrier, Smith, and Grimm, 1999; Katila and Chen,2008). For instance, researchers have studied pric-ing and advertising (e.g., Smith, Ferrier, and Ndo-for, 2001) as well as capacity (e.g., Audia andGreve, 2006) and boundary (Ozcan and Eisenhardt,2009) moves in varied empirical settings from air-lines (Miller and Chen, 1996) to robotics (Katila
Keywords: competition; evolutionary search; temporaryadvantage; R&D; new markets∗ Correspondence to: Riitta Katila, Department of ManagementScience & Engineering, Huang Engineering Center, StanfordUniversity, Stanford, California, U.S.A.E-mail: [email protected]
and Chen, 2008), shipbuilding (Greve, 2003a),and Fortune 500 firms (Ferrier, 2001). The corepremise is that engaging rivals through competitivemoves generates a series of temporary advantagesthat lead to superior performance.
Several insights emerge from this research. Nor-mative insights suggest that making more moves,more complex moves, and more aggressive moves(i.e., sooner) leads to higher performance (Young,Smith, and Grimm, 1996; Grimm, Lee, and Smith,2006; Ozcan and Eisenhardt, 2009). Descriptiveinsights center on the motivations of executivesto engage their competitors. One explanation isthat strategic incentives, especially the need toimprove performance, will spur competitive moves(Smith et al., 2001; Greve, 2003b). Another is thatfirms are more likely to enact moves if they knowthat their competitors are unlikely or unable torespond with damaging countermoves (Gimeno,1999).
Copyright 2010 John Wiley & Sons, Ltd.

1528 E. L. Chen et al.
Yet despite these influential insights, the lit-erature on competitive moves leaves open sev-eral issues. First, although theoretical argumentssuggest that temporary advantage and the needto frequently engage competitors is more likelyin some markets than in others (Grant, 1996;Thomas and D’Aveni, 2009), empirical studiesoften focus on established markets such as air-lines, shipbuilding, and banking. As a result, newmarkets in which competitive dynamics and tem-porary advantage may be especially germane arelargely unexplored. In particular, while there issome understanding of first mover entry (Lieber-man and Montgomery, 1988, 1998), there is littleunderstanding of the motivations for later competi-tive moves as new markets unfold. Indeed, authorshave encouraged research on competitive movesin new markets where the need to build tempo-rary advantages is particularly relevant (see Smithet al., 2001).
Second, while much empirical literature on com-petitive dynamics focuses on highly observablemoves such as pricing and advertising that areavailable from archival sources, it often overlooksless visible R&D moves. Yet, it seems likely thatthese moves, which are more difficult for com-petitors to track and more likely to disrupt them(and so be more advantageous), are highly rel-evant, especially in markets where advantage isotherwise extremely temporary.
Third, while much empirical literature focuseson the benefits of frequent moves, avoiding compe-tition can be advantageous as mutual forbearancesuggests.1 Reconciling these contrasting views sug-gests the need for clarifying when firms mayprefer fewer moves (and, thus, disengaging withcompetitors) as a way to extend the duration ofcompetitive advantage. The motivations to enactversus avoid market moves that engage competi-tors directly may be particularly sensitive to thenature of advantage in specific market contexts.
Our purpose is to address these open issues.Specifically, we ask ‘what motivates firms to en-gage in competitive moves in established marketswith moderately temporary advantages versus newmarkets with highly temporary advantages?’ In
1 When the same competitors interact in multiple market seg-ments, they are less likely to compete aggressively in any oneof them because they are aware of retaliation across the othersegments (Gimeno and Woo, 1999; Jayachandran, Gimeno, andVaradarajan, 1999). Edwards (1955) labeled this concept mutualforbearance.
response, we conceptualize competitive moves asevolutionary search (Nelson and Winter, 1982;Katila and Chen, 2008), and examine predictionsabout the determinants of such search in estab-lished and new markets.
Our research design is a longitudinal, experien-tial simulation in which participants manage firmsthat compete against each other in a computer-simulated environment. Our simulation includestwo different markets (i.e., an established and anew market) and, thus, provides a unique opportu-nity to contrast markets that differ with regard tothe likely duration of advantage. We collect quan-titative data for 32 runs of the simulation involving480 participants, spanning 1999 to 2006. We sup-plement these data with in-depth fieldwork withparticipant-managers.
We have three core contributions. First, we chal-lenge traditional theory by identifying intriguingdifferences in the origins of competitive movesacross markets. The relationship between perfor-mance and competitive moves depends on the typeof market, not just on whether performance is highor low. In general, high performers are motivatedto engage in competitive moves to maintain thestatus quo in a market and low performers to dis-rupt it. But these goals require different searchsolutions in different markets. High performersmove conservatively in established markets butengage in bold moves in new markets. By contrast,low performers boldly try to disrupt their rivals’positions in established markets, but move conser-vatively in new markets. Overall, our results departsignificantly from the usual explanation that highperformers are likely to make fewer moves thanlow performers.
Second, we incorporate competitive dynamics inevolutionary search theory (e.g., Katila and Chen,2008; Katila, Bahceci, and Miikkulainen, 2010).The search literature is often firm centric. Our con-tribution is to examine how rival firms that startfrom different starting positions on a landscape(i.e., high and low performing), use different typesof problem-solving moves (i.e., R&D and market-ing), and search across different landscapes (i.e.,known and emerging), enact and respond to eachothers’ moves. Overall, we find that firms do notsearch in isolation. Competitor search influencesmotivations to search, especially for low perform-ers. High performers are also influenced by com-petitors in established markets, but less so in newmarkets.
Copyright 2010 John Wiley & Sons, Ltd. Strat. Mgmt. J., 31: 1527–1547 (2010)DOI: 10.1002/smj

Origins of Competitive Interaction 1529
Our third contribution is a fresh approach tostudying competitive moves. Despite their advan-tages, experiential simulations where participant-managers interact in a computer-simulatedenvironment are rarely used to study competitivemoves and firm performance.2 Thus, our multi-method combination of simulation and fieldworkintroduces a significant empirical approach to aliterature that is ‘biased toward archival research’and leaves management intentions and interactionsunexplored (Smith et al., 2001: 2).
THEORETICAL BACKGROUND
Competitive moves and temporary advantage
Two literatures are particularly significant in char-acterizing the strategies that may generate tem-porary competitive advantages. The first focuseson characteristics of environments in which com-petitive advantage is likely to be temporary. Itsuggests that competitive advantage is likely to betemporary in high-velocity environments (Eisen-hardt, 1989) that are characterized by instabil-ity and intense rivalry. New markets, which aretypically more unpredictable and intensely com-petitive than established ones, are prototypicalhigh-velocity environments. The argument is thatinstability creates rapidly changing opportunitiesthat offer competitive advantages with temporaryduration (Santos and Eisenhardt, 2009). Sloganssuch as you snooze, you lose colloquially cap-ture strategy in these environments. Hypercom-petition among intense rivals and undefined turfsof competition further accentuate the likelihoodof temporary advantage by creating ‘competence-destroying turbulence’ (D’Aveni, 1999: 134) anda ‘constant condition of disequilibrium’ (D’Aveni,1994: xiii). Here, terms like gold rush and landgrab capture the intense competition for newopportunities. Taken together, the core argument isthat strategies that engage competitors frequently
2 Audia et al. (2000) is an exception. But, our studies differ.Audia et al. used a single-session behavioral simulation whileours is a longitudinal experiential study run across seven roundsand six weeks. Also, their study involved individual undergrad-uate students responding to scenarios, while our decision mak-ers were teams of masters students with managerial experienceinteracting with other teams in a computer-simulated indus-try environment. We also differ from many other (particularlymarketing-focused) studies that have used Markstrat simulationdata because our research focus is on origins of competitivemoves.
in the pursuit of a series of temporary advan-tages are necessary to achieve superior perfor-mance in high-velocity environments (Tushmanand Anderson, 1986; D’Aveni, 1994). Empiricalstudies of fast and frequent competitive maneu-vering in such environments support this argument(Brown and Eisenhardt, 1998; Zott, 2003; Thomasand D’Aveni, 2009).
The second literature focuses on the charac-teristics of competitive maneuvering (i.e., movesintended to defend or improve a firm’s positionrelative to its rivals) (Chen, Smith, and Grimm,1992). This literature emphasizes the interplay ofcompetitive moves, interdependence among rivals,and firm performance. In particular, it posits thatcompetitive moves can create or enhance the com-petitive advantages of the focal firm and underminethe advantages of its rivals (Chen and Hambrick,1995; Ferrier et al., 1999; Katila and Chen, 2008).For instance, researchers have studied pricing,routing, and advertising moves that are intendedto maintain the firm’s existing position (Miller andChen, 1994; Smith et al., 2001), as well as capac-ity and geographic expansion moves to extend thatposition (Audia and Greve, 2006).
Empirical research on competitive moves offersvaluable insights. Studies in a variety of con-texts, such as airlines (Miller and Chen, 1994),trucking (Audia, Locke, and Smith, 2000), radiobroadcasting (Greve, 1998), and Fortune 500 firms(Ferrier et al., 1999) examine the effects of fast,diverse, and frequent moves on firm performance.Although these studies show the benefits of engag-ing competitors speedily (Chen and Hambrick,1995; Ozcan and Eisenhardt, 2009), asynchro-nously (Katila and Chen, 2008), and diversely(Miller and Chen, 1996), the most consistent find-ings center on move frequency (Young et al., 1996;Ferrier et al., 1999; Chen, 2007). For example, in astudy of competitive moves in the software indus-try, Young et al. (1996) show that more frequentcompetitive moves yield a higher returns on assetsand sales. More frequent competitive moves arealso linked to lower likelihood of dethronement ofindustry leaders (Ferrier et al., 1999) and improvedmarket share (Ferrier, 2001).
A second set of empirical studies examines whysome firms engage in frequent moves while oth-ers do not. Some studies point to performance-based incentives. The argument is that managersenact competitive moves more frequently whentheir firms perform poorly and make fewer moves
Copyright 2010 John Wiley & Sons, Ltd. Strat. Mgmt. J., 31: 1527–1547 (2010)DOI: 10.1002/smj

1530 E. L. Chen et al.
when they are doing well (Greve, 1998, 2003b;Smith et al., 2001). Other studies find that firmsengage in more moves when their competitorsare unlikely or unable to respond with effectivecountermoves (Evans and Kessides, 1994; Chen,1996; Gimeno, 1999). Still others argue that onlyresource-rich firms can make many moves (Cyertand March, 1963). Overall, prior research offersdiverse motivations for why firms might make fre-quent competitive moves.
Despite these valuable insights, several unex-plored questions remain. First, there is little insightinto competitive moves in new markets in whichcompetitive dynamics and temporary advantagemay be especially germane, and yet the find-ings from established markets may not be rele-vant. For example, while past performance andcomparison with rivals may motivate competi-tive moves in relatively stable established markets,these comparisons are likely to be unclear, unre-liable, or simply not available in new markets.Indeed, rivals are likely to be changing (Santosand Eisenhardt, 2009), while anticipating the con-sequences of moves is likely to be challenging(Katila and Shane, 2005). Second, there is littleinsight into origins of R&D moves that are essen-tial in many markets, yet extant research basedon highly observable moves may not be help-ful. In other words, the motives to engage in lessobservable (and ambiguous) moves like R&D arelikely to differ from those to enact observable (andunambiguous) moves such as pricing. Third, theoryand evidence typically indicate that more frequentmoves are high performing. Yet, high-performingfirms may not always prefer to make many moves,particularly in markets where competitive retalia-tion is likely. Thus, it is unclear when firms wouldbe motivated (or not) to engage in moves. Over-all, the competitive dynamics literature offers anincomplete view of the origins of diverse movesin markets with varied temporary advantage. Weaddress these gaps.
Competitive moves as evolutionary search
Recent research hints that an evolutionary searchperspective in which competitive moves are con-ceptualized as problem-solving search in a land-scape (Katila, 2002; Katila and Chen, 2008) mightbe a useful theoretical lens to understand compet-itive moves in varied markets (Smith et al., 2001;Greve, 2008). Given its focus on learning through
search rather than rational optimizing (Argote,1999) and its ability to address environmentaldynamism and incorporate competition (Katila andChen, 2008), an evolutionary perspective is espe-cially likely to extend understanding of competi-tive dynamics into unstable and rivalrous settingssuch as new markets.
The search perspective rests on several funda-mental insights. One is that managers are bound-edly rational, so they avoid the need to anticipateevents, optimize, and develop long-term strategies.Rather, they solve pressing problems using localresponses (Cyert and March, 1963). A central char-acteristic of this problem solving is simplicity:search is simple minded and local in the neigh-borhood of the problem and current alternatives(Martin and Mitchell, 1998). As a consequence,immediate problems (such as poor performance)and proximate solutions motivate search.
A second is that managers search for a bettercompetitive position in a knowledge space, con-ceptualized as a landscape. They move in search ofhigh performance with their position on the land-scape topography indicating their success. Sev-eral empirical studies confirm that representingfirm behavior as search fits with how firms solveproblems, such as those in R&D and innovation(Clark et al., 1987; Helfat, 1994; Katila, 2002).Thus, the evolutionary lens is especially usefulfor examining the origins of distinct competitivemoves (R&D, market) in different market land-scapes—i.e., our research context.
HYPOTHESES: ORIGINSOF COMPETITIVE MOVES
In this section, we use evolutionary theory todevelop hypotheses about the origins of compet-itive moves. We contrast the motivations of firmsto engage in moves in markets in which advan-tage is likely to be moderately temporary (estab-lished market) and in markets in which advantageis likely to be highly temporary (new market).
Markets with moderately temporaryadvantages
From the evolutionary theory perspective, estab-lished markets with moderately temporary advan-tages can be conceptualized as search landscapesthat are relatively stable and organized into well-defined turfs of competition. These landscapes are
Copyright 2010 John Wiley & Sons, Ltd. Strat. Mgmt. J., 31: 1527–1547 (2010)DOI: 10.1002/smj

Origins of Competitive Interaction 1531
relatively stable such that few new peaks rise andold peaks sink slowly as their attractiveness wanes.They are also organized, yet crowded. Competitorsoccupy relatively well-established and well-knownpositions in the landscape and accurate maps of thelandscape—e.g., peaks and valleys—exist. Somefirms are likely to occupy areas with high peaks(with typically moderately sustainable, high per-formance) while others occupy low peaks or eventhe valleys (with low performance). Further, normsof mutual forbearance often develop to regulatecompetitive behavior (Evans and Kessides, 1994;Chen, 1996; Gimeno, 1999). Thus, establishedmarket landscapes are likely to have relatively sta-ble competitive structures.
Given the relatively stable topography of estab-lished markets, we propose in Hypothesis 1 thathigh-performing firms in established markets tendto avoid market moves in order to maintain thebeneficial status quo. Because high-performingfirms have relatively entrenched positions, they arelikely to avoid initiating competition with firms inother (nearby) market segments and instead focuson maintaining their own position (i.e., peaks).Introducing products to market segments that aretypically already occupied by other firms is likelyto invite retaliation (cf. Gimeno, 1999; Gimeno andWoo, 1999). This is especially likely because mar-ket moves are highly salient and, therefore, likelyto generate fast, vigorous competitive responses.Market moves are also relatively easy to imi-tate because they are less ambiguous than othertypes of moves, such as R&D. So, the relativebenefits of such disruptive moves may be shortlived. Moreover, high performers may be vul-nerable to retaliation in several market segmentswhere they are presently strong, making mar-ket moves particularly unattractive for them. Incontrast, since poorly performing firms occupylow-market positions (i.e., valleys) and have lit-tle to protect or lose but immediate (performance)problems to solve, these firms have high incen-tive to upset the current competitive landscape bymaking market moves to disrupt rivals’ marketsegments.
In contrast, we propose in Hypothesis 2 thathigh-performing firms are highly motivated toengage in frequent R&D moves. In order to remainattractive to customers, these firms use repeat R&Dmoves to improve their products and maintain theircurrent market positions (peaks). This is especiallyimportant in established markets where there are
many rivals and relatively low switching costs,i.e., in markets where the advantages are mod-erately temporary. In these markets, firms needto keep moving locally (i.e., innovating) to main-tain their current positions and the attractiveness oftheir peaks. In contrast, low-performing firms arelikely to rely less on R&D moves because theireffects are less immediate and less clearly helpfulfor them. Second, high-performing firms engagein frequent R&D moves because such moves helpthem modify product functionalities according totheir own idiosyncratic advantages and, thus, cre-ate products that their competitors do not have.This further helps them retain their position ona peak and defend against possible attacks. Incontrast, low-performing firms are likely to havefew, if any, idiosyncratic advantages to exploitthrough R&D. Third, high-performing firms maybe especially motivated to engage in R&D movesbecause they are less likely to incur effectiveretaliation than other types of moves (cf. Millerand Chen, 1994). These moves are less visible,making them more ambiguous than other typesof moves. Illustrating this lack of visibility, oneparticipant-manager in our simulation noted thatif a potential rival were spending a lot on R&D,‘then they were up to something,’ but it was unclearwhat. Indeed, even when competitors can observeR&D moves, they are only a possible competi-tive threat because it is unclear whether the movesare made to outcompete the focal firm or attackothers or are simply irrelevant. These possibili-ties make R&D moves confusing for other firms tointerpret, so they are less likely to enable effectiveretaliation.
Overall, we propose that high-performing firmsuse frequent R&D moves to keep offering prod-ucts that are attractive to customers, align prod-uct competition with their own advantages, andmake it more difficult for rivals to predict, plan,and execute their competitive responses. In con-trast to poorly performing firms that use marketmoves to disrupt the landscape, high-performingfirms engage in R&D moves to preserve the cur-rent topography (cf. Miller and Chen, 1994). Wepropose:
Hypothesis 1 (H1). High-performing firms willbe less likely to enact market moves than low-performing firms in markets with moderatelytemporary advantages.
Copyright 2010 John Wiley & Sons, Ltd. Strat. Mgmt. J., 31: 1527–1547 (2010)DOI: 10.1002/smj
1532 E. L. Chen et al.
Hypothesis 2 (H2). High-performing firms willbe more likely to enact R&D moves than low-performing firms in markets with moderatelytemporary advantages.
Markets with highly temporary advantages
From the evolutionary theory perspective, newmarkets with highly temporary advantages can beconceptualized as search landscapes that are unsta-ble and intensely competitive. These landscapesare unstable such that new peaks often arise fre-quently as the market unfolds and as rival firmsmake moves that reshape the landscape. Thus, theterrain is ‘in an early stage of formation’ (Santosand Eisenhardt, 2009: 644). Second, since the ter-rain is largely unknown (i.e., locations of peaksand valleys are unmapped), firms learn about theterrain only through search which further intensi-fies competition. For example, through both localand nonlocal search, firms attempt to learn moreabout new product characteristics and customersegments (Katila and Ahuja, 2002). Illustratingsearch in an unknown terrain, one participant-manager described the new market as ‘a blackbox that nobody knows. . .We sort of pitch outideas and put them on the wall, throw some num-ber in, and the actual preferences [of customers]are revealed when you start to move.’ In addi-tion to unknown customers and undefined productattributes (Hargadon and Douglas, 2001), there areno well-defined turfs of competition or spheres ofinfluence to defend (Katila and Shane, 2005). Thismakes the landscape unstable and the competitionintense.
Given the unknown topography of new markets,we propose in Hypothesis 3 that high-performingfirms are particularly motivated to engage in fre-quent market moves in new markets for severalreasons. First, since the new market landscape is influx, firms that currently occupy high-performingpositions have a high incentive to make marketmoves in order to keep pace with the changingtopography of the landscape. Product introductionsto new segments help firms understand the market(e.g., segment growth, customer preferences, effec-tive sales channels). Such moves can also providevaluable information about customers’ willingnessto pay for particular features. In contrast, low-performing firms that occupy the valleys of thenew landscape are more likely to be overwhelmedby instability, see few immediate solutions, and
adopt a wait and see strategy that lets the land-scape explore for them (i.e., wait for new peaks toarise rather than engage in instant market moves).Consistent with this logic, several high-performingteams saw the new market as a land grab oppor-tunity that needed to be exploited quickly beforeothers entered, while unsuccessful teams focusedon the ‘risks of the unknown market’ and avoidedmoves. In fact, many low performers blamed theinstability of the market for their poor perfor-mance. Second, high-performing firms are moremotivated to engage in market moves because ofmomentum. That is, executives are likely to facehigh uncertainty in new markets and, thus, lookto their recent past for simple and local solutions.Consequently, since high performers in new mar-kets are likely to have engaged in frequent marketmoves in the past (Sorenson, 2000), they are likelyto continue making market moves. Low perform-ers are similarly likely to persist, so they makefew market moves. Third, unlike established mar-kets, firms in new markets can experiment withmarket moves without incurring significant retali-ation. Information is often poor. Competitors areusually not entrenched in market segments, as thesegments are ambiguous, competitive threats areunclear or even nonexistent, and norms of mutualforbearance are unlikely to exist. Thus, marketmoves in new markets are less likely to incur retal-iation than those in established markets, especiallyif conducted by high-performing firms that canretaliate aggressively. Together, these argumentssuggest that high-performing (not low-performing)firms are motivated to engage in market moves innew markets.
We propose in Hypothesis 4 that high-performing firms are particularly motivated toengage in frequent R&D moves in new marketsfor several reasons. First, since new but unpre-dictable peaks often arise as markets clarify, high-performing firms are highly motivated to keeppace by engaging in frequent R&D moves thatoffer technical alternatives to capture them. Con-sistent with this logic, one participant-managerdescribed, ‘Since we don’t have a lot of informa-tion on customer preferences and purchase criteria[in the new market], we began development on aproduct with average specifications, and then willtweak/improve the product as additional informa-tion becomes available.’ Moreover, since undis-covered peaks are often near other peaks (Kauff-man, 1995) and, thus, reachable through locally
Copyright 2010 John Wiley & Sons, Ltd. Strat. Mgmt. J., 31: 1527–1547 (2010)DOI: 10.1002/smj

Origins of Competitive Interaction 1533
proximate R&D moves (i.e., products developedfor one segment can typically be offered in nearbysegments), high-performing firms (since they havealready discovered at least one peak) can morereadily use R&D moves to capture other peaksand so are more motivated to do so. Second,high-performing firms are likely to be more con-fident given their success and, thus, more willingto engage in R&D moves in an unknown market,as illustrated by a manager of a high-performingfirm who said ‘if it fails, we’ll struggle our wayback. . .so we’ll try to be the risk takers.’ In con-trast, low-performing firms may lack the confi-dence to act in a new market that they do notunderstand, given its instability and their lack ofsuccess. These firms may also see no immediatepath for how to use R&D moves to improve theirposition.
Overall, high-performing firms seek to maintaintheir position in new markets through aggressivemarket and R&D moves to learn about the newlandscape and stay ahead of competitors (Katilaand Chen, 2008). By contrast, low-performingfirms in the market are paralyzed by the instabil-ity, unsure what to do and, thus, avoid moves. Wehypothesize:
Hypothesis 3 (H3). High-performing firms willbe more likely to enact market moves than low-performing firms in markets with highly tempo-rary advantages.
Hypothesis 4 (H4). High-performing firms willbe more likely to enact R&D moves than low-performing firms in markets with highly tempo-rary advantages.
METHODS
Research setting
We tested the hypotheses using data from anexperiential simulation, Markstrat3 (Larreche andGatignon, 1998). Markstrat is a longitudinal sim-ulation in which participant teams comprise thefirms that compete with each other in a computer-simulated industry environment. The teams make avariety of competitive moves in each round of playin order to outmaneuver their rivals, gain compet-itive advantage, and perform well (Chen, 2007).
The Markstrat industry consists of two hypo-thetical product markets, Sonite and Vodite. At the
beginning of the simulation, all firms compete inthe established Sonite market. This market has fivecustomer segments. In each segment, customershave different preferences for specific product fea-tures. The segments also differ by size, margins,price sensitivity, and customer growth. In contrast,the Vodite market is new. Characteristic of newmarkets, the three emerging customer segments areunstable and disorganized. Customer preferences,including desired product features and adoption,preferred distribution channels, and price sensi-tivity, are unpredictable. Finally, like most newmarkets, there is very little information about theVodite market. Indeed, it does not exist until a firmintroduces a product.
A key difference between the two markets isthe degree to which competitive advantage islikely to be temporary. Competitive advantage inthe Sonite market is moderately temporary. Firmsbegin the simulation with existing products thatare purchased by customers in existing segments.Their products have revenues, some brand loyalty,and at least some fit with customer preferences.But the market also has relatively low switchingcosts and limited intellectual property protectionthrough secrecy, but not patenting. Thus, rivalscan make competitive moves that overtake or out-maneuver entrenched firms (Teece, 1986; Katila,Rosenberger, and Eisenhardt, 2008). Nonetheless,firms can create a moderately sustainable advan-tage because it takes rivals time to develop better,or at least equal, products, produce them, and per-suade customers to buy them.
By contrast, competitive advantage in the Voditemarket is highly temporary. Unlike in the Sonitesmarket, firms enter the Vodite market with fewcompetitive advantages except, perhaps, financialresources. Indeed, it is unclear who the competitorswill be and in what segments they will emerge. Asfirms begin to make competitive moves, the paceof change often accelerates. One team described‘the market [Vodite] changed so much. Our com-petitors would do things that were unpredictable. . .it didn’t make sense for us to look too far ahead.’For these reasons, competitive advantage in theVodite market is likely to be highly temporary.
Five firms compete in each Markstrat industry.Participant teams decide their own firm’s compet-itive moves and can monitor those of their com-petitors. They have several information sources.For example, teams receive an industry newsletterafter every round. The newsletter contains public
Copyright 2010 John Wiley & Sons, Ltd. Strat. Mgmt. J., 31: 1527–1547 (2010)DOI: 10.1002/smj

1534 E. L. Chen et al.
reports on the stock market, economic variables,such as inflation and GNP growth rates, and per-formance indicators for all firms. Teams can alsopurchase data on the competitive moves made byall firms, including pricing information, productintroductions and modifications, and advertisingand R&D expenses. Thus, there are many infor-mation sources to assist the teams.
Experiential simulations such as ours have sev-eral advantages. First, they provide complete,transparent information on the actions of all par-ticipants (Larreche, 1987; Lant and Montgomery,1992). For example, rather than capture onlycertain types of highly observable moves (e.g.,pricing and newsworthy moves) or certain com-petitors (e.g., largest firms) as is typical of archivalstudies, simulations typically record all moves byall firms in an industry. Thus, researchers cangather uniquely comprehensive data sets and mea-sure variables that would otherwise be difficult,costly, and perhaps impossible to obtain in real set-tings (e.g., discrete R&D investments). Second, thestandardized structure of experiential simulationscontrols for some confounding variables, such asmacroeconomic shocks and government interven-tions. This sharpens and isolates the phenomena ofinterest. Thus, like laboratory experiments, expe-riential simulations offer measurement, compara-bility, and control benefits that are less availablewith other methods. Third, the longitudinal natureof experiential simulations enables study of firmand industry evolution and, thus, leads to a moreaccurate understanding of causality.
In addition, Markstrat offers several furtheradvantages, which make it particularly appropri-ate for our research. First, the Markstrat indus-try consists of two distinct product markets withdiffering likelihood of temporary advantage. Asnoted above, the established Sonite market offerssome (although modest) possibility of a moder-ately sustainable competitive advantage, while theVodite market offers no such advantage. Second,Markstrat provides a realistic view of competi-tion. Based on several decades of theoretical andempirical research (e.g., Larreche and Gatignon,1998), it has been used extensively in prior strategyresearch, and has been shown to provide an accu-rate description of competition among firms (e.g.,Hogarth and Makridakis, 1981; Glazer, Steckel,and Winer, 1987; Lant and Hurley, 1999; Mari-nova, 2004). In fact, practicing managers whohave participated in Markstrat have identified the
simulation’s realism as one of its greatest strengths(Kinnear and Klammer, 1987). Third, the out-comes of simulation runs are idiosyncratic andemergent. Although each simulation begins withthe same initial conditions, very different out-comes emerge from the complex interactions ofrivals. For example, Markstrat industries some-times evolve into near monopolies—with a singledominant firm—or into duopolies, while at othertimes all five firms lock in head-to-head competi-tion. Since the Markstrat simulation involves firmsengaging in complex, competitive interactions witheach other (Gatignon, 1987), the likely outcomesof firm interactions and subsequent firm perfor-mance are emergent and unpredictable, just as theyare in real industries.
Like all research methods, experiential simu-lations have limitations. To focus on the keyaspects of the focal phenomena, some complex-ity is deliberately eliminated (Davis, Eisenhardt,and Bingham, 2007). In the case of Markstrat,there are restrictions. For example, firms cannotform alliances, make acquisitions, or enter newmarkets other than Vodites. Also, firms do notimplement moves beyond the time and expenserequired to make them (Lant and Montgomery,1992). Nonetheless, the simulation does enable arich exploration of firm performance and key com-petitive moves and their implications for temporaryadvantage in distinct markets.
Sample and data sources
We conducted the simulation in a core masters-level class on strategy at a major U.S. west coastuniversity. As a key component of the class,students participated in the simulation to gainhands-on, strategic experience. Groups consistingof three students formed each firm’s top manage-ment team. Although Markstrat has been foundto be very engaging and motivating due to itsrealism (Clark and Montgomery, 1996), we fur-ther motivated participants by using their firm’sperformance as a significant part of their coursegrade. Thus, participants were highly motivated toengage and perform well, just as managers of realfirms are.
We gathered data during eight academic quar-ters, spanning 1999 to 2006. The data cover 32industries (i.e., runs of the simulation) and 160firms (i.e., five firms per industry). Although eachof the five firms had a different starting position
Copyright 2010 John Wiley & Sons, Ltd. Strat. Mgmt. J., 31: 1527–1547 (2010)DOI: 10.1002/smj

Origins of Competitive Interaction 1535
(i.e., relative competitive position) in an industry,these starting positions were constant across all 32runs of the simulation. In all industries, the simu-lation ran for seven rounds over six weeks, with aconsistent number of days between each round forteams to analyze, discuss, and make their moves.We archived all data generated by the simulations.The result is a uniquely comprehensive set of quan-titative data to study competitive moves. It is ourmain data source.
We also gathered demographic data. The averageage of participants is 24 years, and most partic-ipants have at least two to three years of workexperience. Sixty-seven percent of participants aremale. Forty-four percent of participants are fromthe U.S. We formed the teams through randomassignment, but stratified them to ensure that eachhad members with diverse national backgroundsand work experiences. In an additional analysis(available from the authors) we used demographicvariables to control for team heterogeneity (Ham-brick, Cho, and Chen, 1996), and our originalresults held.
As in all experiential simulation research, wemust use care when generalizing the results beyondthe focal demographic. Prior research using Mark-strat finds no empirical differences in behaviorbetween teams of masters students and teams ofexecutives (Lant and Montgomery, 1992; Clarkand Montgomery, 1996). This may mitigate con-cerns about generalizing to real executive behav-iors and actual industry competition. Further,because the average age of the participants in ourstudy is relatively young, the participant teamsmay be especially representative of executiveteams in technology-based ventures.
To supplement our main data source of simula-tion runs, we collected additional data (both quan-titative and qualitative) on teams and their moves.First, we conducted 45-minute semi-structuredinterviews with eight participant teams. Theseinterviews provide insight into the process ofdeciding competitive moves and reveal whichmoves participants thought were most crucial.Second, we reviewed all 160 team papers andfinal presentations completed in conjunction withthe simulation. We then prepared written casesfor 20 teams stratified by starting position andindustry. In each industry, one case focuses onthe competitive moves of a high-performing teamand another focuses on the competitive movesof a low-performing team. The cases give rich
understanding of the motivation for competitivemoves. Third, we collected in-depth survey datafor a sample of the teams—i.e., we surveyed 40teams and asked them (1) What were the 2 to3 most important decisions that you made thisround? and (2) Why did you make them as youdid? Fifty-five percent responded in all rounds,and all teams responded for at least three rounds.We coded and analyzed their responses to under-stand how teams viewed the competitive movesand their significance for competitive advantage.Of the 228 distinct competitive moves mentioned,34 percent are R&D moves and 30 percent are mar-ket moves. Together, these data further confirm theimportance of R&D and market moves (the focusof our hypotheses) for competitive interaction andcompetitive advantage.
Within the categories of R&D and marketmoves, we selected six competitive moves (threeR&D and three market moves) to study further.Based on our analyses of the data described above,these six moves were considered the most impor-tant and captured the most crucial aspects of firmstrategy. We confirmed these choices by analyzingseveral other moves, such as pricing and adver-tising. These did not significantly influence theresults.
Measures
The dependent variables are frequencies ofcompetitive moves. Consistent with competitivedynamics research measuring move frequency(Young et al., 1996; Ferrier et al., 1999), we usea count of competitive moves. Our first depen-dent variable is the frequency of market moves. Webegan by separating market moves into three types:market probe, market entry, and market exit. Weused specific market moves in each market and ineach round to code these moves. We then countedtheir number. We summed these moves for eachfirm in each round to compute market moves. Oursecond dependent variable is frequency of R&Dmoves, also measured as a count of moves made byeach firm. Similar to market moves, we separatedR&D moves into three types: R&D probe, R&Dproduct, and R&D process. We used R&D movesin each market and in each round to code them,and then we counted their number. We summedthese moves for each firm in each round to com-pute R&D moves. See the Appendix for technicaldetails.
Copyright 2010 John Wiley & Sons, Ltd. Strat. Mgmt. J., 31: 1527–1547 (2010)DOI: 10.1002/smj

1536 E. L. Chen et al.
We also created two related dependent variablemeasures: diversity of market moves and diver-sity of R&D moves, because prior work has shownthat both frequency and diversity of moves mayboost competitive advantage. We measured diver-sity of moves as the diversification of the firm’smarket and R&D moves across customer segmentsin each round (number of Sonite segments rangedfrom zero to five and Vodite segments from zero tothree). We calculated diversity using a Herfindahlindex: 1 −
∑(Na/NT)2, where Na equals the num-
ber of market or R&D moves made in segmenta, and NT equals the total number of (market orR&D) moves made. The measure ranged from 0to 1, where higher values indicate greater movediversity.
The main independent variable is firm perfor-mance. We measure firm performance as the firm’smarket share in each round. Depending on thecompetitive move of interest, Sonite market shareor Vodite market share was used. As a widelyused assessment of performance relative to com-petitors (Armstrong and Collopy, 1996), marketshare measures the relative success of firms byproviding explicit comparison to rivals. It is partic-ularly appropriate for our study because it allowsus to compare across simulation runs by control-ling for industry size and other extraneous dif-ferences, such as pricing. Consistent with thesearguments, studies of competitive moves have fre-quently used market share as the firm performancemeasure (Chen and MacMillan, 1992; Makadok,1998; Ferrier et al., 1999; Ferrier, 2001). Our qual-itative data confirm our choice as most intervie-wees discussed market share (and related rev-enues) at length in describing their competitivemove strategies. We also used alternative mea-sures of performance, including revenue, stockprice, and total profit with qualitatively similarresults.
There are several control variables. We controlfor firm resources to ensure that the availabil-ity of resources (rather than firm performance)did not explain frequency of moves. We mea-sured resources as a firm’s total revenue in eachround (in millions of dollars, standardized). This isan appropriate measure because firms with morerevenue are likely to have more resources thanfirms with less (Greve, 1998). Like other studiesusing Markstrat (Ross, 1987; Glazer et al., 1987),we also used starting position as a measure offirm resources. Markstrat assigns different starting
positions in the Sonite market to each of thefive firms such that some teams begin with moreresources than others (e.g., superior product port-folios). We used a dummy variable for discretestarting positions to control for this difference. Theresults, available from the authors, were similar tothose for the original resources measure.
We control for demand diversity because diver-sity of consumer demand increases availableopportunities and, thus, may trigger diversity incompetitive moves (Miller and Chen, 1994) whilelessening the frequency of specific moves. Wemeasured demand diversity using a Herfindahl-type index per round: 1 −
∑(Pa/PT)2, where Pa
equals the number of products in segment a, andPT equals the total number of products in all thesegments in the (Sonite or Vodite) market. Themeasure ranges from 0 to 1 where higher valuesindicate greater diversity.
We control for the frequency of competitormoves. When competitors make many moves,especially relative to a focal firm, this hypercom-petitive activity by rivals is likely to spur moremoves by the focal firm (D’Aveni, 1994). We mea-sured competitor moves as the number of movesmade by all firms less those made by the focal firm.We compute this measure for each firm in eachround and for each product market (i.e., Sonite orVodite).
We control for the growth of the industry sectorusing the sector growth variable. Because slowlygrowing demand in a sector intensifies competi-tion as firms increasingly compete for the samecustomers, we control for it. We measured indus-try sector growth as the percentage change in totalindustry revenue (sum of Sonite and Vodite mar-kets) in each round.
We collected longitudinal data for each of thefirst six rounds of the Markstrat simulation. Al-though the simulation has seven rounds, we omit-ted the final round data to eliminate any possibleend game actions. All statistical models consistof round-by-round panel data. To establish cor-rect causal relationships, we use a lagged variabledesign. We recorded antecedents of moves (e.g.,performance) at round r and predicted move fre-quency in round r+1.
Statistical methods
Since our dependent variable, move frequency,is a count variable, we use Poisson regression.
Copyright 2010 John Wiley & Sons, Ltd. Strat. Mgmt. J., 31: 1527–1547 (2010)DOI: 10.1002/smj
Origins of Competitive Interaction 1537
To account for firm heterogeneity, we use theGeneralized Estimating Equations (GEE) method.The GEE method accounts for autocorrelation thatarises because each firm (team) is measured repeat-edly across multiple rounds of competition (Liangand Zeger, 1986; Haveman and Nonnemaker,2000). The standard errors are derived from theHuber/White robust estimator of variance that isinsensitive to the correlation structure in the GEEmethod.
We also predict diversity of moves, using Gener-alized Least Squares (GLS) regression. Since GLSmodels control for firm-specific variability in timeseries data, they do not produce biased estimates asOLS models might. Specifically, the GLS modelcorrects for autocorrelation and heteroscedastic-ity that arise in pooled time series data (Sayrs,1989). Our data are subject to autocorrelation sinceeach firm is measured repeatedly across multiplerounds and subject to heteroscedasticity becausemove diversity may increase over time as marketsdevelop.
RESULTS
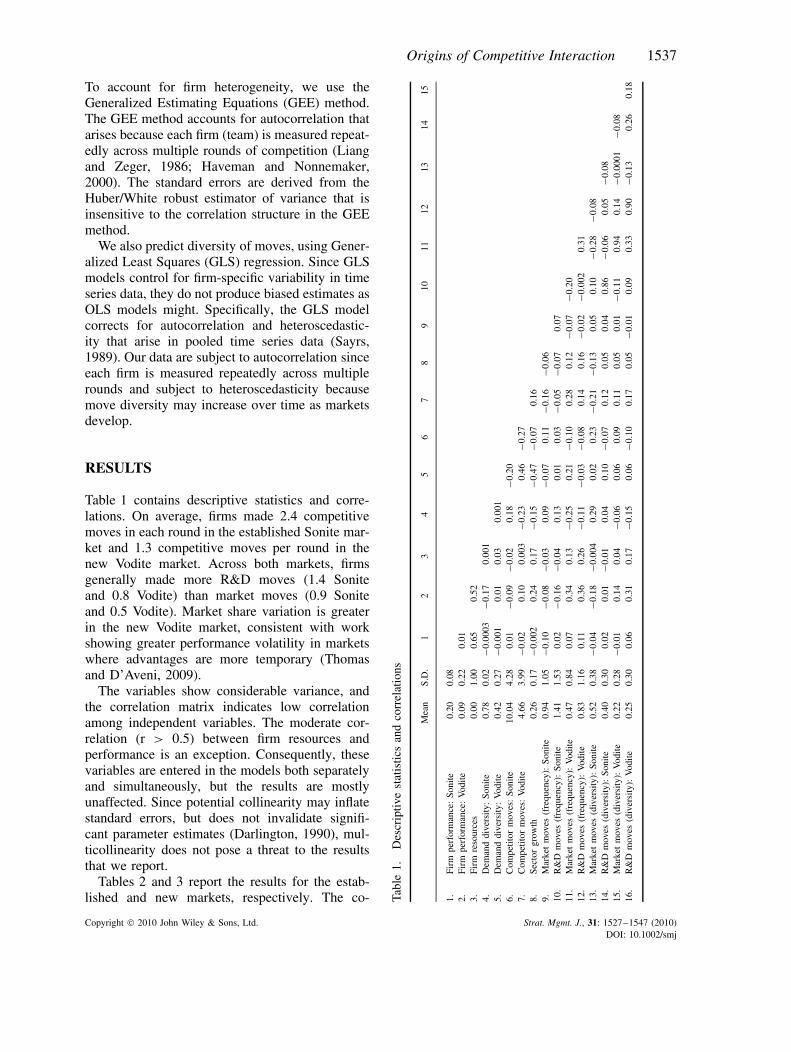
Table 1 contains descriptive statistics and corre-lations. On average, firms made 2.4 competitivemoves in each round in the established Sonite mar-ket and 1.3 competitive moves per round in thenew Vodite market. Across both markets, firmsgenerally made more R&D moves (1.4 Soniteand 0.8 Vodite) than market moves (0.9 Soniteand 0.5 Vodite). Market share variation is greaterin the new Vodite market, consistent with workshowing greater performance volatility in marketswhere advantages are more temporary (Thomasand D’Aveni, 2009).
The variables show considerable variance, andthe correlation matrix indicates low correlationamong independent variables. The moderate cor-relation (r > 0.5) between firm resources andperformance is an exception. Consequently, thesevariables are entered in the models both separatelyand simultaneously, but the results are mostlyunaffected. Since potential collinearity may inflatestandard errors, but does not invalidate signifi-cant parameter estimates (Darlington, 1990), mul-ticollinearity does not pose a threat to the resultsthat we report.
Tables 2 and 3 report the results for the estab-lished and new markets, respectively. The co- Ta
ble
1.D
escr
iptiv
est
atis
tics
and
corr
elat
ions
Mea
nS.
D.
12
34
56
78
910
1112
1314
15
1.Fi
rmpe
rfor
man
ce:
Soni
te0.
200.
082.
Firm
perf
orm
ance
:V
odite
0.09
0.22
0.01
3.Fi
rmre
sour
ces
0.00
1.00
0.65
0.52
4.D
eman
ddi
vers
ity:
Soni
te0.
780.
02−
0.00
03−
0.17
0.00
15.
Dem
and
dive
rsity
:V
odite
0.42
0.27
−0.
001
0.01
0.03
0.00
16.
Com
petit
orm
oves
:So
nite
10.0
44.
280.
01−
0.09
−0.
020.
18−
0.20
7.C
ompe
titor
mov
es:
Vodi
te4.
663.
99−
0.02
0.10
0.00
3−
0.23
0.46
−0.
278.
Sect
orgr
owth
0.26
0.17
−0.
002
0.24
0.17
−0.
15−
0.47
−0.
070.
169.
Mar
ket
mov
es(f
requ
ency
):So
nite
0.94
1.05
−0.
10−
0.08
−0.
030.
09−
0.07
0.11
−0.
16−
0.06
10.
R&
Dm
oves
(fre
quen
cy):
Soni
te1.
411.
530.
02−
0.16
−0.
040.
130.
010.
03−
0.05
−0.
070.
0711
.M
arke
tm
oves
(fre
quen
cy):
Vod
ite0.
470.
840.
070.
340.
13−
0.25
0.21
−0.
100.
280.
12−
0.07
−0.
2012
.R
&D
mov
es(f
requ
ency
):V
odite
0.83
1.16
0.11
0.36
0.26
−0.
11−
0.03
−0.
080.
140.
16−
0.02
−0.
002
0.31
13.
Mar
ket
mov
es(d
iver
sity
):So
nite
0.52
0.38
−0.
04−
0.18
−0.
004
0.29
0.02
0.23
−0.
21−
0.13
0.05
0.10
−0.
28−
0.08
14.
R&
Dm
oves
(div
ersi
ty):
Soni
te0.
400.
300.
020.
01−
0.01
0.04
0.10
−0.
070.
120.
050.
040.
86−
0.06
0.05
−0.
0815
.M
arke
tm
oves
(div
ersi
ty):
Vod
ite0.
220.
28−
0.01
0.14
0.04
−0.
060.
060.
090.
110.
050.
01−
0.11
0.94
0.14
−0.
0001
−0.
0816
.R
&D
mov
es(d
iver
sity
):V
odite
0.25
0.30
0.06
0.31
0.17
−0.
150.
06−
0.10
0.17
0.05
−0.
010.
090.
330.
90−
0.13
0.26
0.18
Copyright 2010 John Wiley & Sons, Ltd. Strat. Mgmt. J., 31: 1527–1547 (2010)DOI: 10.1002/smj
1538 E. L. Chen et al.
Table 2. Antecedents of move frequency in the established Sonite market: GEE Poisson regression resultsa
Table 2a. Frequency of market moves Table 2b. Frequency of R&D moves
1 2 3 1 2 3
Firm performance −1.957∗∗∗ −2.307∗∗∗ 0.411 1.133∗
(0.447) (0.551) (0.357) (0.492)Firm resources −0.078† 0.050 −0.029 −0.099∗
(0.040) (0.047) (0.033) (0.046)Demand diversity 3.189 3.145 3.018 3.468† 3.420† 3.571†
(2.415) (2.414) (2.416) (1.998) (1.996) (2.001)Competitor moves 0.026∗∗ 0.027∗∗ 0.027∗∗ 0.003 0.003 0.003
(0.009) (0.009) (0.009) (0.007) (0.007) (0.007)Sector growth −0.242 −0.325 −0.389 −0.396∗ −0.425∗ −0.339†
(0.230) (0.228) (0.236) (0.194) (0.192) (0.195)Constant −2.787 −2.358 −2.176 −2.363 −2.401 −2.685†
(1.873) (1.872) (1.879) (1.548) (1.548) (1.556)Wald Chi2 19.52∗∗∗ 34.51∗∗∗ 35.55∗∗∗ 10.65∗ 11.16∗ 15.43∗∗
† p < 0.10; ∗ p < 0.05; ∗∗ p < 0.01; ∗∗∗ p < 0.001; two-tailed tests; N = 800.a Robust standard errors are below coefficients.
Table 3. Antecedents of move frequency in the new Vodite market: GEE Poisson regression resultsa
Table 3a. Frequency of market moves Table 3b. Frequency of R&D moves
1 2 3 1 2 3
Firm performance 0.737∗∗∗ 0.712∗∗ 1.164∗∗∗ 0.835∗∗∗
(0.167) (0.239) (0.134) (0.190)Firm resources 0.138∗∗ 0.009 0.271∗∗∗ 0.123∗
(0.042) (0.062) (0.033) (0.049)Demand diversity 0.788∗∗ 0.797∗∗ 0.793∗∗ −0.387† −0.289 −0.376†
(0.258) (0.257) (0.259) (0.204) (0.202) (0.206)Competitor moves 0.005 0.016 0.016 0.012 0.029∗ 0.027∗
(0.014) (0.015) (0.015) (0.013) (0.013) (0.013)Sector growth −0.465 −0.323 −0.333 −0.429 −0.090 −0.261
(0.336) (0.337) (0.343) (0.278) (0.279) (0.285)Constant −0.391† −0.659∗∗ −0.649∗∗ 0.301† −0.187 −0.032
(0.211) (0.222) (0.232) (0.171) (0.183) (0.191)Wald Chi2 32.50∗∗∗ 40.21∗∗∗ 40.29∗∗∗ 67.43∗∗∗ 78.07∗∗∗ 85.09∗∗∗
† p < 0.10; ∗ p < 0.05; ∗∗ p < 0.01; ∗∗∗ p < 0.001; two-tailed tests; N = 435.a Robust standard errors are below coefficients.
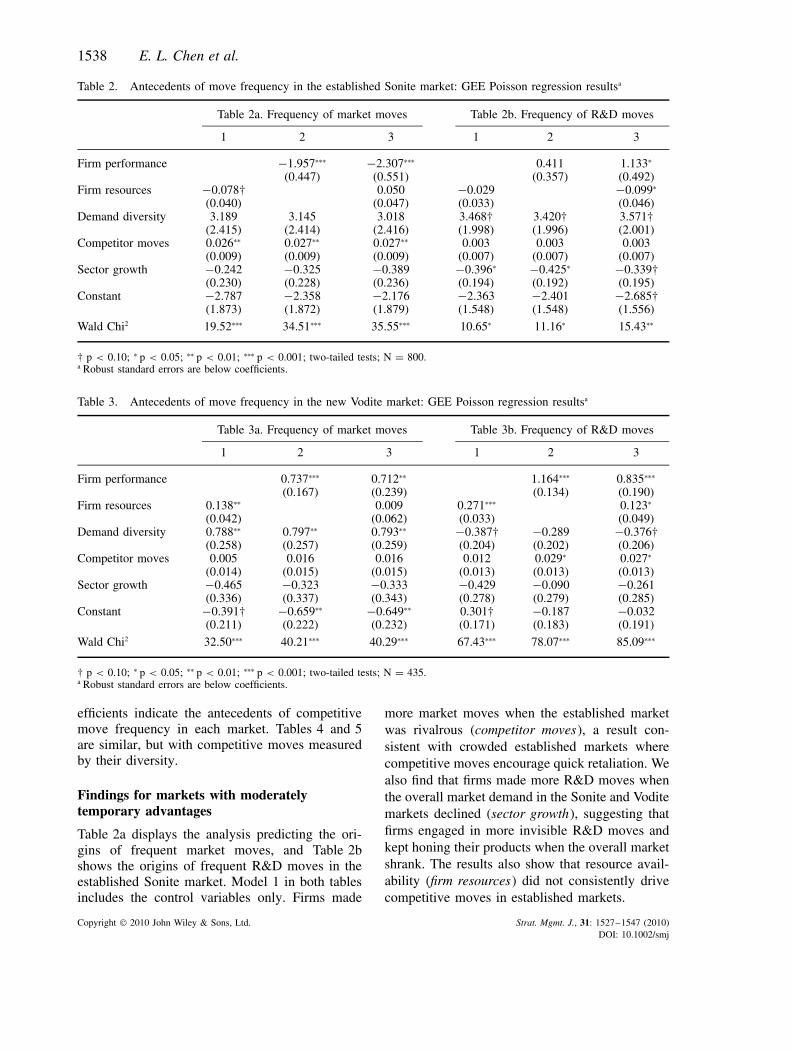
efficients indicate the antecedents of competitivemove frequency in each market. Tables 4 and 5are similar, but with competitive moves measuredby their diversity.
Findings for markets with moderatelytemporary advantages
Table 2a displays the analysis predicting the ori-gins of frequent market moves, and Table 2bshows the origins of frequent R&D moves in theestablished Sonite market. Model 1 in both tablesincludes the control variables only. Firms made
more market moves when the established marketwas rivalrous (competitor moves), a result con-sistent with crowded established markets wherecompetitive moves encourage quick retaliation. Wealso find that firms made more R&D moves whenthe overall market demand in the Sonite and Voditemarkets declined (sector growth), suggesting thatfirms engaged in more invisible R&D moves andkept honing their products when the overall marketshrank. The results also show that resource avail-ability (firm resources) did not consistently drivecompetitive moves in established markets.
Copyright 2010 John Wiley & Sons, Ltd. Strat. Mgmt. J., 31: 1527–1547 (2010)DOI: 10.1002/smj

Origins of Competitive Interaction 1539
Table 4. Antecedents of move diversity in the established Sonite market: GLS regression resultsa
Table 4a. Diversity of market moves Table 4b. Diversity of R&D moves
1 2 3 1 2 3
Firm performance −0.386∗ −0.535∗∗ 0.294∗∗ 0.296†(0.154) (0.187) (0.103) (0.161)
Firm resources −0.005 0.023 0.011∗∗ −0.0002(0.014) (0.017) (0.004) (0.008)
Demand diversity 3.028∗∗∗ 3.097∗∗∗ 3.006∗∗∗ −0.190 −0.204 −0.247(0.833) (0.823) (0.825) (0.676) (0.671) (0.668)
Competitor moves 0.022∗∗∗ 0.022∗∗∗ 0.022∗∗∗ −0.005† −0.004 −0.004(0.003) (0.003) (0.003) (0.003) (0.003) (0.003)
Sector growth −0.212∗∗ −0.221∗∗ −0.249∗∗∗ 0.079† 0.070 0.063(0.074) (0.072) (0.075) (0.041) (0.049) (0.046)
Constant −2.020∗∗ −1.992∗∗ −1.890∗∗ 0.606 0.550 0.583(0.645) (0.637) (0.641) (0.520) (0.517) (0.512)
Wald Chi2 95.76∗∗∗ 102.87∗∗∗ 106.17∗∗∗ 22.30∗∗∗ 19.86∗∗∗ 21.41∗∗∗
† p < 0.10; ∗ p < 0.05; ∗∗ p < 0.01; ∗∗∗ p < 0.001; two-tailed tests; N = 681 for market moves and N = 467 for R&D moves.a Robust standard errors are below coefficients.
Table 5. Antecedents of move diversity in the new Vodite market: GLS regression resultsa
Table 5a. Diversity of market moves Table 5b. Diversity of R&D moves
1 2 3 1 2 3
Firm performance 0.122∗ 0.200∗ 0.422∗∗∗ 0.343∗∗∗
(0.059) (0.078) (0.046) (0.064)Firm resources 0.003 −0.027 0.100∗∗∗ 0.037∗
(0.015) (0.019) (0.015) (0.019)Demand diversity 0.092 0.077 0.101 −0.005 −0.029 −0.035
(0.086) (0.084) (0.084) (0.073) (0.060) (0.067)Competitor moves −0.007 −0.004 −0.004 0.005 0.013∗∗ 0.012∗∗
(0.005) (0.005) (0.005) (0.005) (0.004) (0.004)Sector growth −0.243∗ −0.236∗ −0.194 −0.447∗∗∗ −0.353∗∗∗ −0.373∗∗∗
(0.120) (0.118) (0.120) (0.079) (0.079) (0.078)Constant 0.291∗∗∗ 0.246∗∗ 0.215∗∗ 0.432∗∗∗ 0.279∗∗∗ 0.303∗∗∗
(0.073) (0.076) (0.078) (0.055) (0.059) (0.060)Wald Chi2 8.21† 12.34∗ 15.51∗∗ 99.00∗∗∗ 138.56∗∗∗ 133.21∗∗∗
† p < 0.10; ∗ p < 0.05; ∗∗ p < 0.01; ∗∗∗ p < 0.001; two-tailed tests; N = 236 for market moves and N = 260 for R&D moves.a Robust standard errors are below coefficients.
To test Hypothesis 1 on market moves, Model 2in Table 2a introduces the firm performance vari-able. We argued that in established markets, firmsavoid market moves when they have performedwell, but make them more frequently when theyhave performed poorly (H1). As expected, thecoefficient for firm performance is negative andsignificant (p < 0.001) in Model 2 and remainssignificant in the full model that includes thesomewhat correlated firm resources variable. Thus,the results support H1 and indicate that high-performing firms avoid disruptive market moves.
To test Hypothesis 2 on R&D moves, Model2 in Table 2b similarly introduces the firm per-formance variable. We argued that in establishedmarkets, firms will be motivated to make frequentR&D moves when they perform well (H2). Thecoefficient for firm performance is positive but notstatistically significant in Model 2 and positive andsignificant (p < 0.05) in the full model. Together,the results support H2 and indicate that it is thehigh-performing rather than the low-performingfirms that are motivated to make R&D moves inestablished markets.
Copyright 2010 John Wiley & Sons, Ltd. Strat. Mgmt. J., 31: 1527–1547 (2010)DOI: 10.1002/smj

1540 E. L. Chen et al.
Findings for markets with highly temporaryadvantages
Table 3a displays the analysis predicting the ori-gins of frequent market moves, and Table 3bshows the origins of frequent R&D moves in thenew Vodite market. Model 1 in both tables con-tains control variables. Firms did not make sig-nificantly more market moves when competitorsmoved aggressively (competitor moves), consistentwith the uncrowded landscape of new markets withno well-defined turfs of competition or spheres ofinfluence to defend. But they made more mar-ket moves when new types of customer demandemerged (demand diversity). Consistent with unex-plored opportunities in new markets then, competi-tors did not focus on retaliation in existing marketsegments, but rather made market moves as newand diverse customer segments emerged. Unlikein the established market, resource-rich firms (firmresources) were more likely to make frequent mar-ket and R&D moves.
To test Hypothesis 3 on market moves, Model 2in Table 3a introduces the firm performance vari-able. We argued that in new markets, firms willengage in market moves more frequently whenthey perform well (H3). As expected, the coef-ficient for firm performance is positive and sig-nificant (p < 0.001) in Model 2 and positiveand significant (p < 0.01) in the full model.Thus, the results support H3 and suggest thathigh-performing firms engage in market moves tolearn about the new market and stay in front ofcompetitors.
To test Hypothesis 4 on R&D moves, Model2 in Table 3b introduces the firm performancevariable. We argued that firms will engage infrequent R&D moves in new markets when theyperform well (H4). As expected, the coefficientfor firm performance is positive and significant(p < 0.001) in Model 2 and in the full model.The results support H4 and indicate that it is thehigh-performing rather than the low-performingfirms that enact R&D moves.
Tables 4 and 5 report the GLS regression resultsfor the diversity of market and R&D moves inthe established Sonite and new Vodite markets,respectively. The results support our main find-ings in Tables 2 and 3. These results also suggestthat when the overall industry shrinks, firms areespecially likely to use diversifying moves into thenew Vodite market to identify new opportunities.
Together, these analyses provide strong confirma-tion of our main propositions.
Additional analyses
We conducted additional analyses. First, we furtherprobed the relationship between firm performanceand competitive moves. While our evolutionarysearch arguments suggested and found a continu-ous relationship between performance and compet-itive moves, we also considered whether firms mayinitiate search when confronted with failure rela-tive to a reference point (Cyert and March, 1963;Greve, 2003b). Based on data from the Markstratenvironment and participant interviews indicatingthat competitors used their rivals’ performance astheir benchmark (this relative performance alsoinfluenced participants’ class grades), we usedindustry mean as a reference point—i.e., weexpected that performance below the mean com-pared to the rest of the teams in the industry wouldlead the focal firm to alter the number and diver-sity of its competitive moves. Following Greve(2003b), we used the equation Yr+1 = f [β1(Pr −Lr)IPr>Lr + β2(Pr − Lr)IPr≤Lr + β3Xr] where theoutcome variable is Yr+1, (competitive move fre-quency and competitive move diversity), β1 is theeffect of performance when performance is abovethe reference point, and β2 is the effect when per-formance is below the reference point. Pr signifiesa firm’s performance while Lr signifies the ref-erence point (mean industry market share in theround). The indicator variable, I, takes the value of1 if the subscript was true and 0 otherwise. Xr is avector for control variables. This equation enabledus to test if performance relative to a referencepoint leads firms to alter the frequency (or diver-sity) of their competitive moves. Significance testsof the coefficients provide evidence of an effecton competitive moves, while the comparison ofthe coefficients indicates how the effect changesgoing from below to above a reference point.
Our results (details available from the authors)indicate that the slope of the performance vari-able indeed shifts, but the sign of the coefficientsremains unchanged for below versus above the ref-erence point. For example, in the established mar-ket, the coefficients for below-the-mean and above-the-mean performance variables are both negativeand significant in predicting frequency of marketmoves and both positive and significant in predict-ing frequency of R&D moves. But there is a slight
Copyright 2010 John Wiley & Sons, Ltd. Strat. Mgmt. J., 31: 1527–1547 (2010)DOI: 10.1002/smj

Origins of Competitive Interaction 1541
variation in the value of the coefficients. The neg-ative relationship between performance and mar-ket moves is more pronounced for below-the-meanperformers and, in contrast, the positive relation-ship between performance and R&D moves ismore pronounced for above-the-mean performers.That is, a decline in performance is particularlylikely to encourage those firms that perform worsethan the upper half of the industry to use moremarket moves. Similarly, an improvement in per-formance is particularly likely to encourage thosefirms that perform better than the lower half ofthe industry to use more R&D moves. These find-ings are consistent with our hypothesized effectsin established markets that emphasize the attrac-tiveness of market versus R&D moves to low-versus high-performing firms, respectively. Thus,these results further support our original findings.
We also conducted analyses with alternativemeasures of firm performance. In (unreported)results, we used stock price and return on invest-ment as independent variables. Because these vari-ables are not available for Sonites and Voditesseparately, we used an aggregate measure. We alsoused aggregate market share (Sonite and Vodite).These results (available from the authors) are con-sistent with our original findings.
DISCUSSION
We examine the origins of competitive moves.Specifically, using the lens of evolutionary searchtheory, we study how prior performance influencesa firm’s propensity to engage its competitors intwo markets where competitive advantage is mod-erately and highly temporary, respectively. Relyingon experiential simulation methods coupled within-depth fieldwork and covering 32 industries with160 firms, we have several key findings.
Key findings for competitive moves
Market moves
We find that market moves originate for differ-ent reasons in the two markets. In establishedmarkets with moderately temporary advantages,high-performing firms are motivated to avoid mar-ket moves. Consistent with prior research (Gimenoand Woo, 1996), norms of mutual forbearanceemerge in these markets because it is easy for
rivals to detect and respond to market moves thatencroach in their occupied customer segments.Thus, high-performing teams conservatively seekto maintain the status quo. As one successful teamnoted ‘we envision our Sonite [established] mar-ket share stabilizing around 30 percent, making ourcompany a secondary player with no interest in tak-ing over the market.’ In contrast, low-performingteams eschew the status quo. For example, a low-performing team felt ‘compelled to compete in thelow end [Sonite market segment]’ to prevent aparticularly aggressive firm from ‘obtaining a com-plete stranglehold.’ Thus, these low-performingteams attempt to disrupt the status quo despite therisks of challenging rivals in their established turfs.Overall, our findings provide strong qualitative andquantitative evidence that, as predicted by our evo-lutionary theory hypothesis, high-performing firmsavoid market moves that attempt to scale occupiedpeaks, while low-performing firms engage in themin order to disrupt the advantages of others.
Conversely, high-performing firms are moti-vated to make frequent market moves in new mar-kets with highly temporary advantages. In thesemarkets, customer segments have not developed,rivals are confused, and advantages are likely to behighly temporary. In the language of landscapes,peaks are ambiguous, unpredictable, and fluctuat-ing such that they are often unknown, unstable, orindefensible. A consistent finding in our writtencases is that high-performing firms often quicklyreleased products into the new Vodite market with-out much information. These moves were moti-vated by their interest in exploring the new market.But their effect was often to surprise and con-fuse other firms, especially low-performing firms.For example, one low-performing team expressedsurprise by saying ‘it was without knowing anyinformation, that they [the other firm] introduceda product just right there. They were a reallyrisky team.’ While the team ascribed their rival’suninformed market move to an inherent propen-sity for risk, they failed to consider that theirrival was engaging in search to locate successfulproduct-market combinations. In contrast, a high-performing team described their release of a verybasic product that they intended to ‘tweak andimprove’ as they learned, illustrating the confi-dent use of market entry moves to explore andlearn the new landscape. In contrast, low perform-ers avoided market moves because they did not see
Copyright 2010 John Wiley & Sons, Ltd. Strat. Mgmt. J., 31: 1527–1547 (2010)DOI: 10.1002/smj

1542 E. L. Chen et al.
an immediate way to use them to disrupt others ina new market.
R&D moves
We find that high-performing firms prefer to en-gage in more frequent R&D moves than low-performing firms in both established and newmarkets, but for different reasons. In establishedmarkets, as anticipated by our evolutionary theoryhypothesis, the R&D moves of high-performingfirms focus on creating a series of temporaryadvantages in order to remain on existing peaksand possibly raise them. In contrast, such fine-tuning moves did not make sense to poorly per-forming firms that currently occupied valleys.Rather, they focused on market moves that canhave immediate effects. As one participant-manager on a low-performing team stated ‘wewould look at our market share and we would focuson those products where we were losing out. Wewould increase our advertising on those.’ Othersrecognized the value of R&D moves only in hind-sight: ‘[Last round] our competitors were a stepahead of us. They did R&D to improve their prod-ucts and we didn’t. We just relied on sales andmarketing.’ In other words, while market moveswere a natural proximate solution to pressing per-formance problems, poorly performing firms oftendid not recognize that longer-term R&D movesmight also be a solution.
In new markets, R&D moves play a differentrole that focuses on wide-ranging exploration ofthe new landscape. Intriguingly, high-performingfirms moved aggressively while lagging firms werehesitant. As one low-performing manager noted,‘In regard to the Vodite market, we thought ‘let’swait and see’. . . We decided to focus on only oneproject so as to learn more about the market andthen conduct R&D later to differentiate more. Wedid not want to commit to multiple projects for a sofar unproven market.’ Another weak-performingteam noted that ‘we have adopted more of a ‘waitand see’ strategy for the Vodite market beforewe start expensive R&D.’ In contrast, a high-performing team said that ‘we spent a lot on R&D.’Thus, we find strong qualitative and quantitativesupport for the argument that high performers areespecially motivated to engage in R&D moves innew markets.
Overall, our results are a significant departurefrom the usual explanation that high performers are
likely to make fewer moves than low performers.Rather, we find that this result is contingent onmarket type and move type—i.e., high performersare likely to make more market moves in newmarkets and more R&D moves in both kinds ofmarkets.
Contributions to theories of temporaryadvantage
More broadly, we add insights to severalliteratures through our focus on temporary compet-itive advantage. First, we contribute to competitivedynamics. This literature emphasizes establishedmarkets like airlines, radio stations, and truck-ing. In contrast, we contribute by extendingcompetitive dynamics to markets with varyingtemporary advantages. Our results suggest thathigh-performing firms are motivated to maintainstatus quo, but that this requires different searchstrategies in different markets. In established mar-kets, high performers bolster their positions onexisting peaks. In new markets, they boldly attemptto capture new peaks. By contrast, low-performingfirms seek to disrupt the status quo, but this simi-larly requires different strategies in different mar-kets. In established markets, low performers areaggressive risk takers that disrupt their rivals. Innew markets, they are paralyzed risk avoidersbecause they lack the market understanding nec-essary to disrupt rivals.
Our findings conflict with traditional predictionsof competitive dynamics. In markets with highlytemporary advantages, strong performance (ratherthan a poor one as predicted by conventional the-ory) motivates moves. One explanation is thatwhile high performers avoid competitive con-frontation in the established market (whereentrenched rivals have somewhat sustainable ad-vantages and clear visibility of rivalrous moves),the ambiguity of new markets provides a shieldto engage in moves (Zajac and Bazerman, 1991).In fact, our fieldwork suggests that managersof poorly performing firms were often surprisedby the competitive moves of their higher per-forming rivals. As one said ‘we did not expect[one of the market leaders] to invest in an R&Dproject. . .without any prior market information.’Another manager anticipated entry, but not latermoves and said ‘before the Vodite entry, we knewthat they were going to Vodites. But after that,we weren’t sure if they were improving a lot of
Copyright 2010 John Wiley & Sons, Ltd. Strat. Mgmt. J., 31: 1527–1547 (2010)DOI: 10.1002/smj

Origins of Competitive Interaction 1543
existing products or introducing a lot of new prod-ucts.’ Such moves left poor performers confusedand reactive. Overall, high performance promptedfirms to seize the initiative in new markets. In fact,we saw that high-performing firms often adoptedan all or nothing strategy and seemed inspiredby the opportunity for a land grab. One high-performing manager enthusiastically described thenew Vodite market as ‘the Wild West.’
We also contribute to theories of temporaryadvantage with insights into mutual forbearance.Prior research shows that when firms compete inoverlapping market segments (Gimeno and Woo,1996), they refrain from engaging one another.This mutual forbearance is typically beneficial,especially when firms occupy spheres of influence(Gimeno, 1999). We extend the implications ofmutual forbearance by confirming that high per-formers act in accordance with mutual forbearancein established markets where competitive advan-tages are moderately temporary. But we contributethe further insight that forbearance breaks downwhen competitive advantages are highly tempo-rary. Here, high-performing firms are motivated toengage in land grabbing, and are not concernedwith mutual forbearance. Indeed, mutual forbear-ance is likely to be irrelevant when there is nostatus quo to disrupt. This suggests a key boundarycondition for the widely observed finding that firmsrefrain from moves because of mutual forbear-ance—i.e., the relevance of mutual forbearance iscontingent upon the market.
Contributions to theories of evolutionarysearch
We also extend the scope of evolutionary the-ory to competitive markets and to markets inwhich the duration of competitive advantage dif-fers. Research using evolutionary theory oftenfocuses on search by single firms on one (usu-ally stable) landscape. We add to the theory byexamining competitive interaction and search ondifferent landscapes, including new ones in whichadvantages are highly temporary.
Importantly, we contribute to the growinginterest in competition that creates instability onlandscapes. Recent research has begun to incorpo-rate competition in evolutionary theory by mod-eling landscapes in which learning from rivals ismore or less difficult (Rivkin, 2000; Csaszar andSiggelkow, 2009) and where firms search by taking
into account how others search (Katila and Chen,2008; Katila et al., 2010). For example, Katila andChen (2008) find that firms innovate more effec-tively when they search either early or late andavoid synchronizing their search with rivals. Ourresults further suggest that these performance pat-terns may persist: high performers are motivatedto be out of sync by avoiding lock-step moves incongested established markets, and boldly searchto get a head start in wide-open new marketlandscapes. In contrast, low performers are muchmore likely to be driven to counterproductive insync search with their competitors. Our contri-bution to evolutionary search theory is, thus, anuanced view of how different starting positionsdifferently influence competitive search in differ-ent landscapes.
Our second contribution is to use evolutionarytheory to develop the theoretical roots of com-petitive dynamics as encouraged by Smith et al.(2001). By building on evolutionary theory, weconceptualize competitive moves as a search tosolve problems. In particular, the evolutionarysearch lens provides an accurate portrait of theorigins of competitive dynamics in fast-paced andunpredictable (new) markets and for diverse (R&Dand market) competitive moves. Most importantly,we use evolutionary theory to combine the litera-tures on high-velocity, hyper-competitive environ-ments with competitive dynamics and, thus, forge aricher theory of strategy when competitive advan-tage is temporary.
Finally, we contribute a new methodology tostudy competition. While past competitive dynam-ics research relies almost exclusively on archivaldata, we use a longitudinal experiential simulation.Like all research designs, this one has limitations.These limitations relate primarily to restrictionsin the simulation (e.g., inability to make acqui-sitions [Puranam, Singh, and Zollo, 2006]). Butthis method also enables the capture of uniquelycomprehensive information about moves and mar-kets, controls for many extraneous factors and iso-lates the phenomena of interest. Thus, by usingan experiential simulation coupled with fieldwork,we respond to a challenge by Smith et al. (2001:46) to glean ‘primary data directly from managerswho actually make decisions and implement com-petitive actions.’
Copyright 2010 John Wiley & Sons, Ltd. Strat. Mgmt. J., 31: 1527–1547 (2010)DOI: 10.1002/smj

1544 E. L. Chen et al.
Limitations and future work
Like all research, ours has limitations that open upopportunities for future work. First, we focus ontwo markets where competitive advantage is tem-porary, but we leave unexplored markets (includ-ing new ones) where advantages are moresustainable. Future research could explore theimplications of such markets for the origins ofmoves. Second, since we focus on the originsof moves, we neglect implications for perfor-mance. For example, while we observe that low-performing firms engage in disruptive marketmoves in established markets, we do not exam-ine whether this strategy is effective. Similarly,we leave open whether some originally low-performing firms (in the established market) canprosper by starting over in the new market. Indeed,studying interactions across the two markets is anintriguing path for future research. Third, since ouradditional analyses offer only a glimpse of per-formance threshold effects, more detailed analysescould examine these effects further. For example,we focus on the effects of failure (and success)relative to an industry reference point. So, furtheranalysis including other reference points might beinformative. Finally, since our study uses expe-riential simulation with fieldwork, future researchcould re-examine our predictions in an (albeit less-controlled) industry setting.
CONCLUSION
To understand how firms live life in the fast lane,we examine firm performance and competitiveinteraction in new versus established markets. Weconclude that high performance motivates searchfor continued dominance. This means conservativemoves to bolster strategic position in more sta-ble established markets, but bold moves to capturenew opportunities in new markets where advan-tages are highly temporary. Conversely, low per-formance motivates disruptive market moves inestablished markets where advantages aremoderately temporary, but conservative restraintin new markets where advantages are highly tem-porary. Together, the findings confirm that an evo-lutionary theory perspective that joins competitivedynamics with varied environments can provide arich understanding of temporary advantage and theorigins of competitive moves.
ACKNOWLEDGEMENTS
We appreciate the thoughtful comments of Edi-tor Giovanni Battista Dagnino and our anonymousreviewers, as well as those of the seminar audi-ences at the West Coast Research Symposiumand the Academy of Management meetings. Weacknowledge the generous research support of theNational Science Foundation (Grant SBE-0915236for the second author) and the Stanford TechnologyVentures Program.
REFERENCES
Armstrong JS, Collopy F. 1996. Competitor orientation:effects of objectives and information on managerialdecisions and profitability. Journal of MarketingResearch 33(2): 188–199.
Argote L. 1999. Organizational Learning: Creating,Retaining and Transferring Knowledge. KluwerAcademic Publishers: Boston, MA.
Audia PG, Greve H. 2006. Less likely to fail: lowperformance, firm size, and factory expansion inthe shipbuilding industry. Management Science 52(1):83–94.
Audia PG, Locke EA, Smith KG. 2000. The paradox ofsuccess: an archival and a laboratory study of strategicpersistence following radical environmental change.Academy of Management Journal 43(5): 837–853.
Brown SL, Eisenhardt KM. 1997. The art of continuouschange: linking complexity theory and time-pacedevolution in relentlessly shifting organizations.Administrative Science Quarterly 42(1): 1–34.
Brown SL, Eisenhardt KM. 1998. Competing on theEdge: Strategy as Structured Chaos . Harvard BusinessSchool Press: Boston, MA.
Chen E. 2007. Strategy as competitive moves. PhDdissertation, Stanford University, Stanford, CA.
Chen MJ. 1996. Competitor analysis and interfirmrivalry: toward a theoretical integration. Academy ofManagement Review 21(1): 100–134.
Chen MJ, Hambrick DC. 1995. Speed, stealth, andselective attack: how small firms differ fromlarge firms in competitive behavior. Academy ofManagement Journal 38(2): 453–482.
Chen MJ, MacMillan IC. 1992. Nonresponse and delayedresponse to competitive moves: the roles of competitordependence and action irreversibility. Academy ofManagement Journal 35(3): 539–570.
Chen MJ, Smith KG, Grimm CM. 1992. Action charac-teristics as predictors of competitive responses. Man-agement Science 38(3): 439–455.
Clark KB, Chew WB, Fujimoto T, Meyer J, Scherer FM.1987. Product development in the world auto industry.Brookings Papers on Economic Activity 3: 729–781.
Clark BH, Montgomery DB. 1996. Perceiving competi-tive reactions: the value of accuracy (and paranoia).Marketing Letters 7(2): 115–129.
Copyright 2010 John Wiley & Sons, Ltd. Strat. Mgmt. J., 31: 1527–1547 (2010)DOI: 10.1002/smj

Origins of Competitive Interaction 1545
Csaszar FA, Siggelkow N. 2009. How much to copy?Determinants of effective imitation breadth. Organi-zation Science 21(3): 661–676.
Cyert RM, March JG. 1963. A Behavioral Theory of theFirm . Prentice-Hall: Englewood Cliffs, NJ.
Darlington RB. 1990. Regression and Linear Models .McGraw-Hill: New York.
D’Aveni RA. 1994. Hypercompetition: Managing theDynamics of Strategic Maneuvering . Free Press: NewYork.
D’Aveni RA. 1999. Strategic supremacy through disrup-tion and dominance. MIT Sloan Management Review40(3): 127–135.
Davis JP, Eisenhardt KM, Bingham CB. 2007. Develop-ing theory through simulation methods. Academy ofManagement Review 32(2): 480–499.
Edwards CD. 1955. Conglomerate Bigness as a Source ofPower . Princeton University Press: Princeton, NJ.
Eisenhardt KM. 1989. Making fast strategic decisions inhigh-velocity environments. Academy of ManagementJournal 32(3): 543–576.
Evans WN, Kessides IN. 1994. Living by the ‘goldenrule’: multimarket contact in the U.S. airline industry.Quarterly Journal of Economics 109(2): 341–366.
Ferrier WJ. 2001. Navigating the competitive landscape:the drivers and consequences of competitive aggres-siveness. Academy of Management Journal 44(4):858–877.
Ferrier WJ, Smith KG, Grimm CM. 1999. The roleof competitive action in market share erosion andindustry dethronement: a study of industry leaders andchallengers. Academy of Management Journal 42(4):372–388.
Gatignon H. 1987. Strategic studies in Markstrat. Journalof Business Research 15(6): 469–480.
Gimeno J. 1999. Reciprocal threats in multimarketrivalry: staking out ‘spheres of influence’ in the U.S.airline industry. Strategic Management Journal 20(2):101–128.
Gimeno J, Woo CY. 1996. Hypercompetition in amultimarket environment: the role of strategicsimilarity and multimarket contact in competitive de-escalation. Organization Science 7(3): 322–341.
Gimeno J, Woo CY. 1999. Multimarket contact, econo-mies of scope, and firm performance. Academy ofManagement Journal 42(3): 239–259.
Glazer RJ, Steckel H, Winer RS. 1987. Group processand decision performance in a simulated marketingenvironment. Journal of Business Research 15(6):545–557.
Grant RM. 1996. Prospering in dynamically-competitiveenvironments: organizational capability as knowledgeintegration. Organization Science 7(4): 375–387.
Greve HR. 1998. Performance, aspirations, and riskyorganizational change. Administrative Science Quar-terly 43(1): 58–86.
Greve HR. 2003a. Investment and the behavioral theoryof the firm: evidence from shipbuilding. Industrial andCorporate Change 12(5): 1051–1076.
Greve HR. 2003b. Organizational Learning from Perfor-mance Feedback: A Behavioral Perspective on Innova-tion and Change. Cambridge University Press: Cam-bridge, U.K.
Greve HR. 2008. A behavioral theory of firm growth:sequential attention to size and performance goals.Academy of Management Journal 51(3): 476–494.
Grimm CM, Lee H, Smith KG. 2006. Strategy as Action:Competitive Dynamics and Competitive Advantage.Oxford University Press: New York.
Hambrick DC, Cho TS, Chen MJ. 1996. The influenceof top management team heterogeneity on firms’competitive moves. Administrative Science Quarterly41(4): 659–684.
Hargadon AB, Douglas Y. 2001. When innovation meetsinstitutions: Edison and the design of the electric light.Administrative Science Quarterly 46(3): 476–501.
Haveman HA, Nonnemaker L. 2000. Competition inmultiple geographic markets: the impact on growthand market entry. Administrative Science Quarterly45(2): 232–267.
Helfat CE. 1994. Evolutionary trajectories in petroleumfirm R&D. Management Science 40(12): 1720–1747.
Hogarth RM, Makridakis S. 1981. The value of decisionmaking in a complex environment: an experimentalapproach. Management Science 27(1): 93–107.
Jayachandran S, Gimeno J, Varadarajan PR. 1999. The-ory of multipoint competition: a synthesis and impli-cations for marketing strategy. Journal of Marketing63(3): 49–66.
Katila R. 2002. New product search over time: pastideas in their prime? Academy of Management Journal45(5): 995–1010.
Katila R, Ahuja G. 2002. Something old, somethingnew: a longitudinal study of search behavior andnew product introduction. Academy of ManagementJournal 45(6): 1183–1194.
Katila R, Bahceci E, Miikkulainen R. 2010. Organizingfor innovation: search in competitive environments.Working paper, Stanford University, Stanford, CA.
Katila R, Chen EL. 2008. Effects of search timing oninnovation: the value of not being in sync with rivals.Administrative Science Quarterly 53(4): 593–625.
Katila R, Rosenberger J, Eisenhardt KM. 2008. Swim-ming with sharks: technology ventures, defense mech-anisms, and corporate relationships. AdministrativeScience Quarterly 53(2): 295–332.
Katila R, Shane S. 2005. When does lack of resourcesmake new firms innovative? Academy of ManagementJournal 48(5): 814–829.
Kauffman, S. 1995. At Home in the Universe. OxfordUniversity Press: New York.
Kinnear TC, Klammer SK. 1987. Management perspec-tives on Markstrat: the GE experience and beyond.Journal of Business Research 15(6): 491–501.
Lant TK, Hurley AE. 1999. A contingency model ofresponse to performance feedback: escalation of com-mitment and incremental adaptation in resource invest-ment decisions. Group and Organization Management24(4): 421–437.
Lant TK, Montgomery DB. 1992. Simulation games asa research method for studying strategic decision
Copyright 2010 John Wiley & Sons, Ltd. Strat. Mgmt. J., 31: 1527–1547 (2010)DOI: 10.1002/smj

1546 E. L. Chen et al.
making: the case of Markstrat. Stanford GraduateSchool of Business Research Paper 1242, Stanford,CA.
Larreche JC. 1987. On simulations in business educationand research. Journal of Business Research 15(6):559–571.
Larreche JC, Gatignon H. 1998. MARKSTRAT3: TheStrategic Marketing Simulation . South-Western Col-lege Publishing: Florence, KY.
Liang KY, Zeger SL. 1986. Longitudinal data analysisusing generalized linear models. Biometrika 73(1):13–22.
Lieberman MB, Montgomery DB. 1988. First-moveradvantages. Strategic Management Journal 9(S1):41–58.
Lieberman MB, Montgomery DB. 1998. First-mover(dis)advantages: retrospective and link with theresource-based view. Strategic Management Journal19(12): 1111–1125.
Makadok R. 1998. Can first-mover and early-moveradvantages be sustained in an industry with lowbarriers to entry/imitation? Strategic ManagementJournal 19(7): 683–696.
Marinova D. 2004. Actualizing innovation effort: theimpact of market knowledge diffusion in a dynamicsystem of competition. Journal of Marketing 68(3):1–20.
Martin X, Mitchell W. 1998. The influence of localsearch and performance heuristics on new designintroduction in a new product market. Research Policy26(7): 753–771.
Miller D, Chen MJ. 1994. Sources and consequences ofcompetitive inertia: a study of the U.S. airline industry.Administrative Science Quarterly 39(1): 1–23.
Miller D, Chen MJ. 1996. The simplicity of competitiverepertoires: an empirical analysis. Strategic Manage-ment Journal 17(6): 419–439.
Nelson RR, Winter SG. 1982. An Evolutionary Theory ofEconomic Change. Harvard University Press: Boston,MA.
Ozcan P, Eisenhardt KM. 2009. Origin of allianceportfolios: entrepreneurs, network strategies, and firmperformance. Academy of Management Journal 52(2):246–279.
Puranam P, Singh H, Zollo M. 2006. Organizing forinnovation: managing the coordination-autonomy
dilemma in technology acquisitions. Academy ofManagement Journal 49(2): 263–280.
Rivkin JW. 2000. Imitation of complex strategies.Management Science 46(6): 824–844.
Ross WT. 1987. A re-examination of the results ofHogarth and Makridakis’ ‘the value of decisionmaking in a complex environment: an experimentalapproach.’ Management Science 33(2): 288–296.
Santos FM, Eisenhardt KM. 2009. Constructing marketsand shaping boundaries: entrepreneurial power innascent fields. Academy of Management Journal52(4): 643–671.
Sayrs LW. 1989. Pooled Time Series Analysis . Sage:Thousand Oaks, CA.
Smith KG, Ferrier WJ, Ndofor H. 2001. Competitivedynamics research: critique and future directions.In Handbook of Strategic Management , Hitt MA,Freeman RE, Harrison J (eds). Blackwell Publishers:London, U.K.: 315–361.
Sorenson O. 2000. Letting the market work for you: anevolutionary perspective on product strategy. StrategicManagement Journal 21(5): 577–592.
Teece D. 1986. Profiting from technological innovation:implications for integration, collaboration, licensing,and public policy. Research Policy 15: 285–305.
Thomas LG, D’Aveni R. 2009. The changing nature ofcompetition in the U.S. manufacturing sector, 1950 to2002. Strategic Organization 7(4): 387–431.
Tushman ML, Anderson P. 1986. Technological discon-tinuities and organizational environments. Administra-tive Science Quarterly 31(3): 439–465.
Young G, Smith KG, Grimm CM. 1996. ‘Austrian’ andindustrial organization perspectives on firm-levelcompetitive activity and performance. OrganizationScience 7(3): 243–254.
Zajac EJ, Bazerman MH. 1991. Blind spots in industryand competitor analysis: implications of interfirm(mis)perceptions for strategic decisions. Academy ofManagement Review 16(1): 37–56.
Zott C. 2003. Dynamic capabilities and the emergenceof intraindustry differential firm performance: insightsfrom a simulation study. Strategic ManagementJournal 24(2): 97–125.
Copyright 2010 John Wiley & Sons, Ltd. Strat. Mgmt. J., 31: 1527–1547 (2010)DOI: 10.1002/smj

Origins of Competitive Interaction 1547
APPENDIX
Measures of a firm’s commercialization and mar-ket moves (labeled as market moves) were basedon any changes in the customer segments inwhich the firm marketed products in each round.There were three types. Market probe is an entryinto a customer segment in which the firm didnot compete in the prior round, with a prod-uct that is supported by minimal advertising (lessthan $1.5 million). Our interviewees indicated thatMarkstrat participants view $1.5 million as a mod-est advertising expenditure, consistent with anexperiment to learn about a market (Brown andEisenhardt, 1997). By contrast, we measure mar-ket entry as entry into a customer segment in whichthe firm did not compete in the prior round, witha product that is supported by significant adver-tising (greater than $1.5 million). Since this is amajor market investment, actual advertising expen-ditures were much higher, continued over several
rounds of competing in the customer segment, andoften consumed significant portions of the teams’budgets. We measure market exit as withdrawalof all products from a customer segment in whichthe firm is competing. We summed these moves tocompute market moves.
Measures of a firm’s R&D investment moves(labeled as R&D moves) were based on three typesof R&D investments. An R&D probe is a $100,000investment to create a prototype of a new prod-uct. Its rationale is typically to experiment to learnmore about feasibility and cost. By contrast, anR&D product move is an R&D investment exceed-ing $100,000 to further develop a new product.Thus, product moves are much more costly andconsiderably larger than a probe. We measure anR&D process move as an R&D investment in anexisting product that reduces its production cost.We then summed these moves to compute R&Dmoves.
Copyright 2010 John Wiley & Sons, Ltd. Strat. Mgmt. J., 31: 1527–1547 (2010)DOI: 10.1002/smj


![05[2] Strategy competitors, competitive rivalry, competitive behavior, and competitive dynamics · PDF fileDefine competitors, competitive rivalry, competitive behavior, and competitive](https://static.fdocuments.net/doc/165x107/5aa5b2eb7f8b9ac8748d8018/052-strategy-competitors-competitive-rivalry-competitive-behavior-and-competitive.jpg)


![Overview of Electricity Marketshome.engineering.iastate.edu/~jdm/ee458_2011/Market_Summary.pdfOverview of Electricity Markets A good overview is contained in [1]. 1.0 Origins of competitive](https://static.fdocuments.net/doc/165x107/5f5889163cf7c252645c036a/overview-of-electricity-jdmee4582011marketsummarypdf-overview-of-electricity.jpg)
