Level 3 MyPyramid - USDA
20
Teamnutrition.usda.gov MyPyramid Level 3 Lessons for Grades 5 and 6
Transcript of Level 3 MyPyramid - USDA

Teamnutrition.usda.gov
MyPyramid Level 3
Lessons for Grades 5 and 6

United States Department of AgricultureFood and Nutrition Service FNS-386September 2005
The U.S. Department of Agriculture (USDA) prohibits discrimination in all its programs and activities on the basis of race, color, national origin, sex, age, or disability.
To file a complaint of discrimination, write USDA, Director, Office of Civil Rights, Room 326-W, Whitten Building, 14th and Independence Avenue, SW, Washington, DC 20250-9410 or call (202) 720-5964 (voice or TDD). USDA is an equal opportunity provider and employer.

Getting the Most Nutrition from Your Food
Eating Out and Eating In — Go Lean With Protein
Get Your Calcium-Rich Foods
Students identify the food groups and nutrition messages that make up MyPyra-mid for Kids and learn how to choose healthier foods from each food group.
Students identify foods in the meat and beans group and analyze meat and bean choices from fast food restaurants.
Students identify foods in the milk group and learn their health and nutrition benefits. Students learn to compare the calcium and fat content in foods using food labels.
Students record the foods they eat for an entire day and categorize the foods into food groups.
Using the Where’s the Fat? worksheet, students practice comparing the fat content of foods in the meat and beans group.
Using the What’s on the Label? and What’s the Score? handouts, students practice comparing the nutrient content of foods in the milk group.
Students play the MyPyramid Blast-Off game.
Students determine their own MyPyramid Plan by visiting MyPyramid.gov.
Students participate in a blind taste test with four different types of milk (fat-free, 1%, 2%, and whole milk). Students are asked to compare the taste of each.
Students categorize lunchroom foods according to the food groups in MyPyramid for Kids.
Students review the lunch menu to find all the foods from the meat and beans group.Students are asked to create signs to help promote lean protein choices to other students.
Students analyze the food choices available in the school vending machines. The class is asked to start a campaign to add milk to the choices available in the vending machines.
Topic Objective Individual Student Group Activity Lunchroom Link Activity
Dear Teacher,The U.S Department of Agriculture (USDA) has developed these lessons to help you teach children in grades 5 and 6 about MyPyramid. The lessons feature a graphic developed specifically for elementary students titled MyPyramid for Kids. The lessons are designed to integrate nutrition with science, math, language arts, and health. Physical activity is also emphasized.The lessons:• Communicate nutrition concepts through age-appropriate, fun activities• Contain handouts to be duplicated• May be taught with minimal preparation• Include a link with the school lunch program• Provide information to send home to parents.Also included in the lessons are: a MyPyramid for Kids poster, 50
Tips for Families flyers to send home to parents, a CD ROM with an interactive computer game, and a CD ROM with all the lesson materials and supplemental materials for educators. Your students will have fun as they learn to eat well and be physically active.
Here is a snapshot of what the three lessons cover:


Table of ContentsLesson 1: Getting the Most Nutrition From Your Food
Lesson 2: Eating Out and Eating In – Go Lean With Protein
Lesson 3: Get Your Calcium-Rich Foods
Reproducibles:
MyPyramid for Kids Black-and-white handout
MyPyramid Worksheet
Where’s the Fat?
What’s on the Label?
What’s the Score?
Popular Fast FoodsFood
Total Fat (grams)Hamburger
9Quarter-pound hamburger
18Fried fi sh fi let sandwich
18Crispy fried chicken
23Chicken nuggets (10 pieces)
24Beef soft taco without cheese
8Beef taco, regular style, without cheese
7Bean burrito, no cheese
8Taco salad with ground beef, no cheese
39
1. How many grams of fat are in a quarter-pound hamburger? _________________2. How many grams of fat are in a regular hamburger? ________________________3. Circle the food with less fat:
Taco salad OR Beef soft taco Bean burrito OR Fried fi sh fi let sandwich
Crispy fried chicken OR Hamburger4. List three ways you can make lowfat choices when you’re eating out.1. _____________________________________________________________________________________________
2. _____________________________________________________________________________________________
3. _____________________________________________________________________________________________
Where’s the Fat?
R E P R O D U C I B L E
Name:
What’s on the Label?
Milk
fat-free
Milk 1%,
lowfat chocolateMilk 2%
Milk
whole
Vanilla
ice cream
American
cheese
Fruit-fl avored
yogurt
Cottage
cheese
R E P R O D U C I B L E
Name:
Here is a way to compare foods to see which foods are the best choices for you.
Answer the questions below for these four foods, using What’s on the Label?
Fat-free milk 1% chocolate milk 2% milk Whole milk
1. What is the serving size for this item?1 cup (8 fl oz) 1 cup (8 fl oz) 1 cup (8 fl oz) 1 cup (8 fl oz)
2. Is the serving size realistic? (Is this how
much you would normally eat/drink?)
3. How many calories in one serving?
90
160
120
150
4. How may grams of fat in one serving?0
2.5
4.5
8
5. How much calcium in one serving?30% DV
30% DV30% DV
30% DV
Based on this information, which type of milk offers the most calcium
with the lowest fat?Answer: Fat-freeNow look at all the labels on the page. Answer these questions:
1. If Manuel drinks 8 fl uid ounces of lowfat chocolate milk and eats 6 ounces of fruit-fl avored yogurt,
how much calcium has he had? Answer: 50% DV
How many grams of fat? Answer: 62. Which food item on the sheet has the least calcium and the highest amount of fat?
Answer: Vanilla ice cream3. Which food item on the sheet has the most calcium and the lowest amount of fat?
Answer: Fat-free milk
What’s the Score? Answer Key
Name:
A N S W E R K E Y
R E P R O D U C I B L E
MyPyramid WorksheetCheck how you did today and set a goal to aim for tomorrow.
Write In Your Choices for TodayFood Group
Tip Goal Based On a 2400 Calorie Pattern List Each Food Choice
In Its Food Group* Estimate Your Total
GrainsMake at least half your grains whole grains 8 ounce equivalents
(1 ounce equivalent is about 1 slice
bread, 1 cup dry cereal, or ½ cup cooked
rice, pasta, or cereal)
ounce equivalents
Vegetables Try to have vegetables from several subgroups each day
3 cups Subgroups: Dark Green, Orange, Starchy,
Dry Beans and Peas, Other Veggies
cups
FruitsMake most choices fruit, not juice
2 cups
cups
MilkChoose fat-free or lowfat most often
3 cups (1½ ounces cheese = 1 cup milk)
cups
Meat and Beans Choose lean meat and poultry. Vary your choices—more fi sh, beans, peas, nuts, and seeds
6½ ounce equivalents (1 ounce equivalent is 1 ounce meat,
poultry, or fi sh, 1 egg, 1 T. peanut butter,
½ ounce nuts, or ¼ cup dry beans)
*Some foods don’t fi t into any group. These “extras” may be mainly fat or sugar—limit your intake of these.
ounce equivalents
Physical Activity Build more physical activity into your daily routine at home and work.
At least 30 minutes of moderate to
vigorous activity a day, 10 minutes or
more at a time.
minutes
How did you do today? Great So-So Not so Great
My food goal for tomorrow is: _______________________________________________________________________________________________________
My activity goal for tomorrow is: _____________________________________________________________________________________________________
R E P R O D U C I B L E
Name:
Lesson 1
Lesson 1
Lesson 2
Lesson 3
Lesson 3
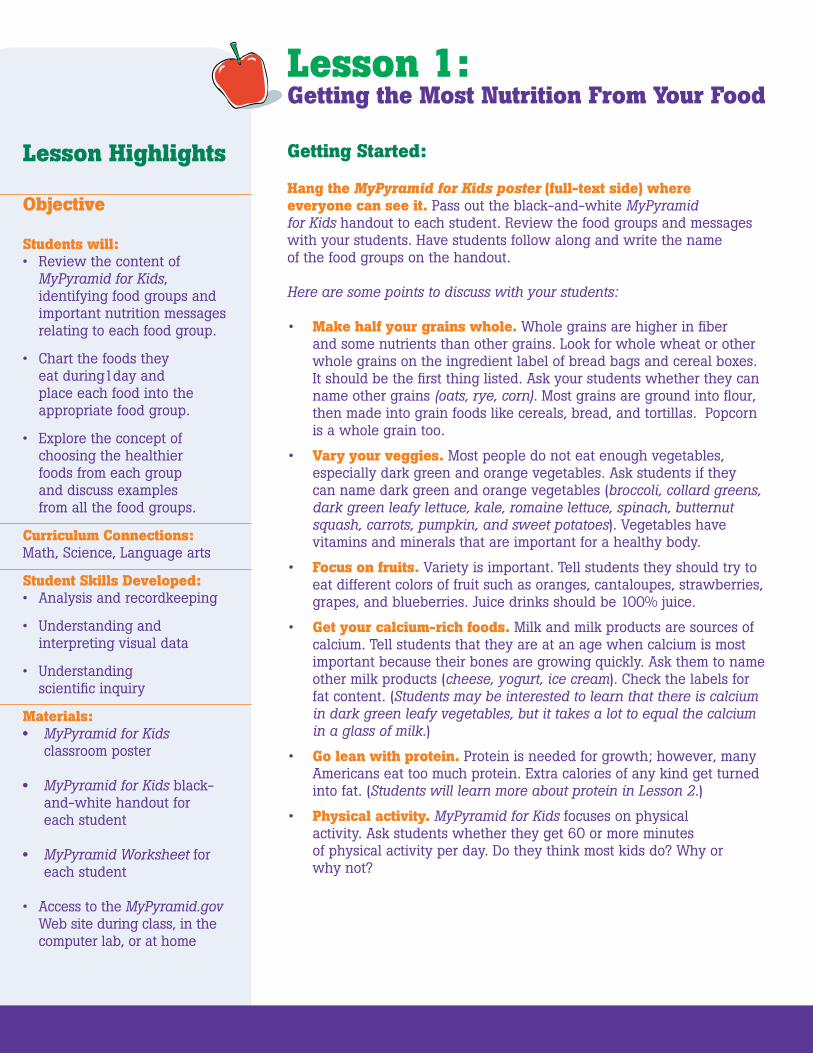
Lesson 1: Getting the Most Nutrition From Your Food
Getting Started:
Hang the MyPyramid for Kids poster (full-text side) where everyone can see it. Pass out the black-and-white MyPyramid for Kids handout to each student. Review the food groups and messages with your students. Have students follow along and write the name of the food groups on the handout.
Here are some points to discuss with your students:
• Make half your grains whole. Whole grains are higher in fiber and some nutrients than other grains. Look for whole wheat or other whole grains on the ingredient label of bread bags and cereal boxes. It should be the first thing listed. Ask your students whether they can name other grains (oats, rye, corn). Most grains are ground into flour, then made into grain foods like cereals, bread, and tortillas. Popcorn is a whole grain too.
• Vary your veggies. Most people do not eat enough vegetables, especially dark green and orange vegetables. Ask students if they can name dark green and orange vegetables (broccoli, collard greens, dark green leafy lettuce, kale, romaine lettuce, spinach, butternut squash, carrots, pumpkin, and sweet potatoes). Vegetables have vitamins and minerals that are important for a healthy body.
• Focus on fruits. Variety is important. Tell students they should try to eat different colors of fruit such as oranges, cantaloupes, strawberries, grapes, and blueberries. Juice drinks should be 100% juice.
• Get your calcium-rich foods. Milk and milk products are sources of calcium. Tell students that they are at an age when calcium is most important because their bones are growing quickly. Ask them to name other milk products (cheese, yogurt, ice cream). Check the labels for fat content. (Students may be interested to learn that there is calcium in dark green leafy vegetables, but it takes a lot to equal the calcium in a glass of milk.)
• Go lean with protein. Protein is needed for growth; however, many Americans eat too much protein. Extra calories of any kind get turned into fat. (Students will learn more about protein in Lesson 2.)
• Physical activity. MyPyramid for Kids focuses on physical activity. Ask students whether they get 60 or more minutes of physical activity per day. Do they think most kids do? Why or why not?
Lesson Highlights
Objective Students will:• Review the content of
MyPyramid for Kids, identifying food groups and important nutrition messages relating to each food group.
• Chart the foods they eat during1day and place each food into the appropriate food group.
• Explore the concept of choosing the healthier foods from each group and discuss examples from all the food groups.
Curriculum Connections:Math, Science, Language arts
Student Skills Developed:• Analysis and recordkeeping
• Understanding and interpreting visual data
• Understanding scientific inquiry
Materials: • MyPyramid for Kids classroom poster • MyPyramid for Kids black- and-white handout for each student • MyPyramid Worksheet for each student
• Access to the MyPyramid.gov Web site during class, in the computer lab, or at home

• Point out that MyPyramid for Kids gives the amounts to eat in ounces and cups – ounces for the grain and meat and beans groups and vegetables, fruit, and milk are given in cups.
Note: ounce equivalents for grains can also be measured in cups, e.g., 1 cup ready-to-eat cereal or ½ cup cooked cereal, and ounce equivalents for meats and beans can also be measured in tablespoons, e.g., peanut butter.
Getting the most nutrition from your food:
• Ask your students if they know why the food group stripes are wider at the bottom of MyPyramid for Kids. Explain that every food group has foods that you should eat more often than others; these are at the bottom of MyPyramid for Kids. The wider stripes at the bottom remind you to eat more of these healthier foods.
• Explain that the foods at the bottom of MyPyramid for Kids provide vitamins and minerals without a lot of solid fat or added sugar. Examples include: a slice of whole-wheat bread, a piece of fruit, steamed vegetables, fat-free milk, or a baked chicken breast. Tell your students that they should choose these foods most often because it is important to get the nutrients the body needs without eating too much solid fat or added sugar.
• Foods with higher amounts of solid fat and added sugar are in the narrower top area of MyPyramid for Kids. Tell students that occasionally everyone can enjoy these foods (for example, cake, candy, sweetened drinks, chips, and fried foods). But, eating too many of the foods from the top of MyPyramid for Kids could lead to weight gain.
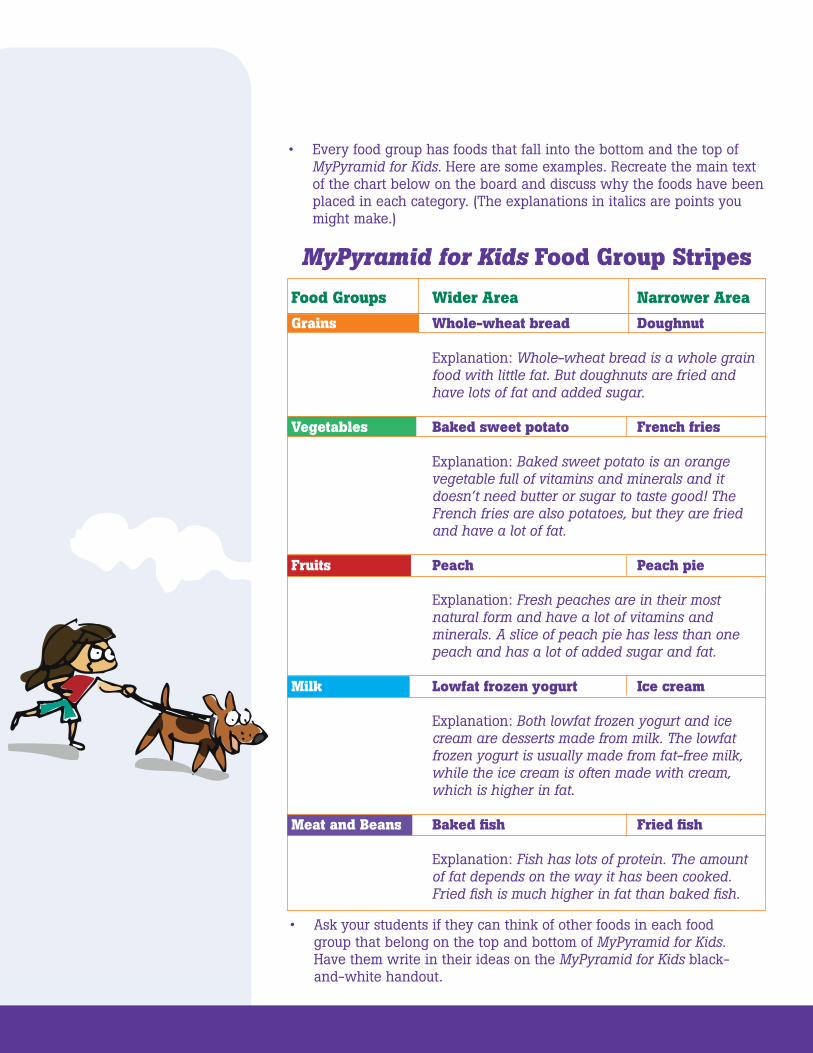
• Every food group has foods that fall into the bottom and the top of MyPyramid for Kids. Here are some examples. Recreate the main text of the chart below on the board and discuss why the foods have been placed in each category. (The explanations in italics are points you might make.)
• Ask your students if they can think of other foods in each food group that belong on the top and bottom of MyPyramid for Kids. Have them write in their ideas on the MyPyramid for Kids black- and-white handout.
MyPyramid for Kids Food Group Stripes
Grains Whole-wheat bread Doughnut
Explanation: Whole-wheat bread is a whole grain food with little fat. But doughnuts are fried and have lots of fat and added sugar.
Vegetables Baked sweet potato French fries
Explanation: Baked sweet potato is an orange vegetable full of vitamins and minerals and it doesn’t need butter or sugar to taste good! The French fries are also potatoes, but they are fried and have a lot of fat.
Fruits Peach Peach pie
Explanation: Fresh peaches are in their most natural form and have a lot of vitamins and minerals. A slice of peach pie has less than one peach and has a lot of added sugar and fat.
Milk Lowfat frozen yogurt Ice cream
Explanation: Both lowfat frozen yogurt and ice cream are desserts made from milk. The lowfat frozen yogurt is usually made from fat-free milk, while the ice cream is often made with cream, which is higher in fat.
Meat and Beans Baked fish Fried fish
Explanation: Fish has lots of protein. The amount of fat depends on the way it has been cooked. Fried fish is much higher in fat than baked fish.
Food Groups Wider Area Narrower Area

Activity: MyPyramid Worksheet
Pass out the MyPyramid for Kids Worksheet to students. Ask students to fill out the worksheet by listing all the foods (and the amounts) they ate yesterday for breakfast, lunch, dinner, and snacks. After students have completed this task, have students categorize the foods they ate yesterday into food groups. (You may need to help students with combination foods. For example, a slice of pizza would fit into several food groups such as grains, vegetables, milk, and meat and beans.) Next, have them list their physical activity and time spent on each activity. Then have the students rate how they did yesterday and set goals for tomorrow.
Group Activity: Play the MyPyramid Blast-Off Game
As a follow-up to the lesson, have students play the MyPyramid Blast-Off Game on the enclosed CD ROM or at teamnutrition.usda.gov or MyPyramid.gov educators’ page. In this game, students see if they can make the MyPyramid rocket fly. To do this they need to fill the rocket with the right “fuel”— a day’s worth of smart food choices and physical activity. They will use the knowledge learned from this lesson to help them make the best choices. After students have played the game, ask what they have learned.
Lunchroom Link:
Have students analyze 1 week of lunchroom menus, identifying which foods come from each of the food groups and if the foods fit on the top or bottom of MyPyramid for Kids.

RE
PR
OD
UC
IB
LE
Re
pR
od
uc
ib
le
t
ea
mn
ut
Ri
ti
on
.u
sd
a.
go
v

Nam
e:M
yPyr
amid
Wor
ksh
eet
Ch
eck
how
you
did
yes
terd
ay a
nd
set
a go
al t
o ai
m f
or t
omor
row
Gra
ins
Vege
tabl
es
Frui
ts
Mil
k
Mea
t an
d
Bea
ns
Phys
ical
A
ctiv
ity
Mak
e at
leas
t ha
lf yo
ur g
rain
s w
hole
gra
ins.
Colo
r yo
ur p
late
with
al
l kin
ds o
f gre
at t
astin
g ve
ggie
s.
Mak
e m
ost
choi
ces
frui
t,
not
juic
e.
Choo
se fa
t-fr
ee o
r lo
wfa
t m
ost
ofte
n.
Choo
se le
an m
eat
and
chic
ken
or t
urke
y. V
ary
your
ch
oice
s—m
ore
fish,
bea
ns,
peas
, nut
s, a
nd s
eeds
.
Build
mor
e ph
ysic
al a
ctiv
ity
into
you
r da
ily r
outin
e at
ho
me
and
scho
ol.
6 o
unce
eq
uiva
len
ts
(1 o
unce
equ
ival
ent
is a
bout
1 s
lice
brea
d,
1 cu
p dr
y ce
real
, or
½ c
up c
ooke
d ri
ce,
past
a, o
r ce
real
)
2½
cup
s
(Cho
ose
from
dar
k gr
een,
ora
nge,
sta
rchy
, dr
y be
ans
and
peas
, or
othe
r ve
ggie
s).
1½
cup
s
3 c
ups
(1
cup
yog
urt
or 1
½ o
unce
s ch
eese
= 1
cup
m
ilk)
5 o
unce
eq
uiva
len
ts
(1 o
unce
equ
ival
ent
is 1
oun
ce m
eat,
chic
ken
or t
urke
y, o
r fis
h, 1
egg
, 1 T
. pea
nut
butt
er, ½
oun
ce n
uts,
or
¼ c
up d
ry b
eans
)
At
leas
t 6
0 m
inut
es o
f mod
erat
e to
vi
goro
us a
ctiv
ity a
day
or
mos
t da
ys.
How
did
you
do
yest
erda
y?
G
reat
So-
So
N
ot S
o G
reat
My
food
goa
l for
tom
orro
w is
: __
____
____
____
____
____
____
____
____
____
____
____
____
____
____
____
____
My
activ
ity g
oal f
or t
omor
row
is: _
____
____
____
____
____
____
____
____
____
____
____
____
____
____
____
___
* So
me
food
s do
n’t
fit in
to a
ny
grou
p. T
hese
“ex
tras
” m
ay b
e m
ainl
y fa
t or
sug
ar—
limit
your
in
take
of t
hese
.
ounc
e eq
uiva
lent
s
ounc
e eq
uiva
lent
s
cups
min
utes
cups
cups
Brea
kfas
t:
Lunc
h:
Snac
k:
Din
ner:
Phys
ical
act
ivity
:
Wri
te I
n Y
our
Ch
oice
s Fr
om Y
este
rday
Food
an
dA
ctiv
ity
Tip
Goa
l(B
ased
On
a 1
80
0 C
alor
ie P
atte
rn)
List
Eac
h F
ood
Ch
oice
In I
ts F
ood
Gru
op*
Est
imat
eYo
ur T
otal
RE
PR
OD
UC
IB
LE
T
EA
MN
UT
RI
TI
ON
.U
SD
A.
GO
V

Lesson 2:Eating Out and Eating In–Go Lean With Protein
Lesson Highlights
Objectives Students will:• Identify foods in the
meat and beans group.
• Analyze food choices from fast food restaurants, choosing lower fat alternatives.
Curriculum Connections: Math, Language arts, Health
Student Skills Developed:• Using viewing skills and
strategies to understand and interpret visual media
• Reading and interpreting data from charts
• Recording data
Materials: • Where’s the Fat?
worksheet for each student
• Computers with Internet access
Getting Started:
• Ask several students to share what they ate for dinner yesterday. Let several students respond. Point out that many students started by naming a food that is a member of the meat and beans group – chicken, hamburger, fish.
• Tell students that these are foods that contain protein. Challenge students to list as many foods as they can from this food group.
• Did students list the plant foods that are part of this group – dry peas and beans? (black beans, chickpeas, falafel, kidney beans, lentils, lima beans, navy beans, pinto beans, soy beans, split peas, tofu, white beans) Nuts and seeds? (almonds, cashews, hazelnuts, mixed nuts, pecans, pistachios, pumpkin seeds, sesame seeds, sunflower seeds, walnuts) Peanuts and peanut butter? Point out that these foods are staples in many cultures.
• Tell students that all these foods include protein. Scientists sometimes call protein the building block for bones, muscles, cartilage, skin, and blood.
• Point out that most people get enough of these foods. One of the challenges is in choosing foods from this group that are lower in fat.
Activity: Where’s the Fat?
• Hand out the Where’s the Fat? worksheet. Tell students that it includes information about fat found in many meat and bean foods. Point out that while they probably don’t decide what their family is going to eat for dinner, students may select what they eat when their family eats out. Some of their favorite meat and bean foods may be very high in fat.
• Tell students that nearly all chain restaurants have nutrition information available. They can ask for information before they make their choice.
• Have students answer the questions at the bottom of the worksheet. Working in groups, have them list at least three ways they can make lowfat choices.
Group Activity: MyPyramid Plan
Have students visit MyPyramid.gov. Using the instructions on the site, have students determine their own MyPyramid Plan, entering their individual age, sex, and activity level. Then have them print out their own MyPyramid worksheet.
Extension Activity:
Many chain restaurants provide nutrition information for all the foods on their menus. This information is usually available online or at the restaurants. Have students collect this information from the chain restaurants where they eat.
Divide students into groups. Each group will have nutrition information from one restaurant. Have each group prepare a short presentation to the class on smart choices from that restaurant’s menu.
Lunchroom Link:
Have students review the lunch menu. Find all the protein choices, including proteins from plant foods. Encourage them to make signs that highlight the lean protein choices to advertise to other students.

Popular Fast Foods
Food Total Fat (grams)
Hamburger 9
Quarter-pound hamburger 18
Fried fish filet sandwich 18
Crispy fried chicken 23
Chicken nuggets (10 pieces) 24
Beef soft taco without cheese 8
Beef taco, regular style, without cheese 7
Bean burrito, no cheese 8
Taco salad with ground beef, no cheese 39
1. How many grams of total fat are in a quarter-pound hamburger? ____________
2. How many grams of total fat are in a regular hamburger? ___________________
3. Circle the food with less fat:
Taco salad OR Beef soft taco
Bean burrito OR Fried fish filet sandwich
Crispy fried chicken OR Hamburger
4. List three ways you can make lowfat choices when you’re eating out.
1. _____________________________________________________________________________________________
2. _____________________________________________________________________________________________
3. _____________________________________________________________________________________________
Where’s the Fat?
R E P R O D U C I B L E T E A M N U T R I T I O N . U S D A . G O V
Name:

Popular Fast Foods
Food Total Fat (grams)
Hamburger 9
Quarter-pound hamburger 18
Fried fish filet sandwich 18
Crispy fried chicken 23
Chicken nuggets (10 pieces) 24
Beef soft taco without cheese 8
Beef taco, regular style, without cheese 7
Bean burrito, no cheese 8
Taco salad with ground beef, no cheese 39
1. How many grams of total fat are in a quarter-pound hamburger? Answer: 18 grams
2. How many grams of total fat are in a regular hamburger? Answer: 9 grams
3. Circle the food with less fat:
Taco salad OR Beef soft taco
Bean burrito OR Fried fish filet sandwich
Crispy fried chicken OR Hamburger
4. List three ways you can make lowfat choices when you’re eating out.
1. Choose grilled (not fried)
2. Choose the smaller size (hamburger versus the quarter-pound hamburger)
3. Look at nutrition information provided by the restaurant before making your selection.
Where’s the Fat? Answer Key
R E P R O D U C I B L E T E A M N U T R I T I O N . U S D A . G O V
Name:

Activity: What’s on the Label?
Make the following points about the health benefits of calcium-rich foods:• Diets that are rich in lowfat and fat-free milk and milk products help
build and maintain bone mass.
• Students their age especially need to drink milk, because this is when their bone mass is being built.
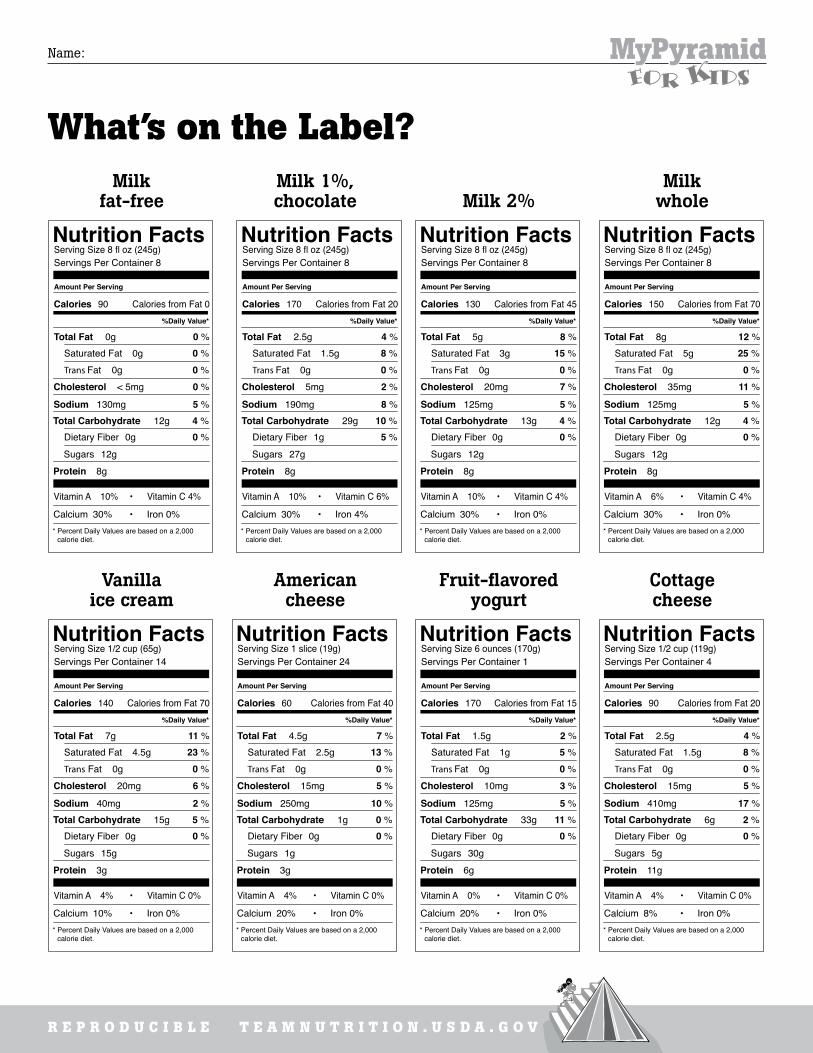
Now pass out What’s on the Label? handout. Tell students that food labels give them important information about the nutritional value of the food. Discuss the following information with the students: • Ask students to look for the words “Serving Size” on the labels. In the
case of milk, the serving size is 8 fluid ounces – 1 cup.
• Next, have students find first the number of calories in a single serving of the food. Each of the first four labels is for an 8 fluid ounce glass of milk; yet they have a very different number of calories per serving. Why? Because of the fat and sugar content. Look at the calorie content for 1% chocolate milk. It is higher than the calorie content for whole milk. The extra calories come from sugar and chocolate.
• At the bottom of the food label, students will find some numbers followed by percent signs. This is where calcium is listed. Use the % Daily Value (DV) column when possible: 5% DV or less is low, 20% DV or more is high.
Pass out the What’s the Score? worksheet. Have students complete the chart at the top of the page, filling in numbers from the four nutrition labels for milk. Later, check students’ answers.
Next, have students use What’s on the Label? to help them complete the questions on What’s the Score? Check student answers and discuss.
Lesson 3:Get Your Calcium-Rich Foods
Lesson Highlights
Objectives Students will:• Identify foods in
the milk group.
• Identify the health and nutrition benefits from eating foods rich in calcium.
• Analyze food labels to determine which foods contain the most calcium.
• Compare food labels to determine which calcium-rich foods are lowest in fat.
Curriculum Connections:Math, Health, Science
Student Skills Developed:• Reading charts
• Thinking skills – making comparisons
• Math computation
Materials: • What’s on the Label? handout for each student • What’s the Score? worksheet for each student
• Samples of fat-free, 1%, 2%, and whole milk
• Four plastic glasses (for each student trying the taste test)
• Marker

Group Activity: Taste Test
Bring in samples of fat-free, 1%, 2%, and whole milk. With a marker, label four plastic glasses A, B, C, and D. Without showing students what you are doing, pour a small amount of the four types of milk into the glasses. (Prepare one set of glasses for each student participant.)
Now have a student come up to taste each of the four milks. Describe the tastes. Rate each. Repeat with other students trying the taste test.
Later, have students talk about how they can reduce the fat they consume by switching the milk they drink. If they usually drink whole milk, they should switch gradually to 2% milk, then to 1% milk, and finally to fat-free milk.
Lunchroom Link:
Does your school have vending machines? Do they offer milk for sale? If not, perhaps your class could start a campaign to add fat-free or lowfat milk to the choices available in your school vending machines.
What’s on the Label?Milk
fat-freeMilk 1%, chocolate Milk 2%
Milk whole
Vanilla ice cream
American cheese
Fruit-flavored yogurt
Cottage cheese
Serving Size 8 fl oz (245g)Servings Per Container 8
Amount Per Serving
%Daily Value*
Nutrition Facts
* Percent Daily Values are based on a 2,000 calorie diet.
Calories 90 Calories from Fat 0
Total Fat 0g 0 %
Cholesterol < 5mg 0 %
Sodium 130mg 5 %Total Carbohydrate 12g 4 %
Protein 8g
Trans Fat 0g 0 %Saturated Fat 0g 0 %
Dietary Fiber 0g 0 %Sugars 12g
Vitamin A 10% • Vitamin C 4%
Calcium 30% • Iron 0%
Serving Size 8 fl oz (245g)Servings Per Container 8
Amount Per Serving
%Daily Value*
Nutrition Facts
* Percent Daily Values are based on a 2,000 calorie diet.
Calories 150 Calories from Fat 70
Total Fat 8g 12 %
Cholesterol 35mg 11 %
Sodium 125mg 5 %Total Carbohydrate 12g 4 %
Protein 8g
Trans Fat 0g 0 %Saturated Fat 5g 25 %
Dietary Fiber 0g 0 %Sugars 12g
Vitamin A 6% • Vitamin C 4%
Calcium 30% • Iron 0%
Serving Size 8 fl oz (245g)Servings Per Container 8
Amount Per Serving
%Daily Value*
Nutrition Facts
* Percent Daily Values are based on a 2,000 calorie diet.
Calories 170 Calories from Fat 20
Total Fat 2.5g 4 %
Cholesterol 5mg 2 %
Sodium 190mg 8 %Total Carbohydrate 29g 10 %
Protein 8g
Trans Fat 0g 0 %Saturated Fat 1.5g 8 %
Dietary Fiber 1g 5 %Sugars 27g
Vitamin A 10% • Vitamin C 6%
Calcium 30% • Iron 4%
Serving Size 6 ounces (170g)Servings Per Container 1
Amount Per Serving
%Daily Value*
Nutrition Facts
* Percent Daily Values are based on a 2,000 calorie diet.
Calories 170 Calories from Fat 15
Total Fat 1.5g 2 %
Cholesterol 10mg 3 %
Sodium 125mg 5 %Total Carbohydrate 33g 11 %
Protein 6g
Trans Fat 0g 0 %Saturated Fat 1g 5 %
Dietary Fiber 0g 0 %Sugars 30g
Vitamin A 0% • Vitamin C 0%
Calcium 20% • Iron 0%
Serving Size 1 slice (19g)Servings Per Container 24
Amount Per Serving
%Daily Value*
Nutrition Facts
* Percent Daily Values are based on a 2,000 calorie diet.
Calories 60 Calories from Fat 40
Total Fat 4.5g 7 %
Cholesterol 15mg 5 %
Sodium 250mg 10 %Total Carbohydrate 1g 0 %
Protein 3g
Trans Fat 0g 0 %Saturated Fat 2.5g 13 %
Dietary Fiber 0g 0 %Sugars 1g
Vitamin A 4% • Vitamin C 0%
Calcium 20% • Iron 0%
Serving Size 8 fl oz (245g)Servings Per Container 8
Amount Per Serving
%Daily Value*
Nutrition Facts
* Percent Daily Values are based on a 2,000 calorie diet.
Calories 130 Calories from Fat 45
Total Fat 5g 8 %
Cholesterol 20mg 7 %
Sodium 125mg 5 %Total Carbohydrate 13g 4 %
Protein 8g
Trans Fat 0g 0 %Saturated Fat 3g 15 %
Dietary Fiber 0g 0 %Sugars 12g
Vitamin A 10% • Vitamin C 4%
Calcium 30% • Iron 0%
Serving Size 1/2 cup (65g)Servings Per Container 14
Amount Per Serving
%Daily Value*
Nutrition Facts
* Percent Daily Values are based on a 2,000 calorie diet.
Calories 140 Calories from Fat 70
Total Fat 7g 11 %
Cholesterol 20mg 6 %
Sodium 40mg 2 %Total Carbohydrate 15g 5 %
Protein 3g
Trans Fat 0g 0 %Saturated Fat 4.5g 23 %
Dietary Fiber 0g 0 %Sugars 15g
Vitamin A 4% • Vitamin C 0%
Calcium 10% • Iron 0%
Serving Size 1/2 cup (119g)Servings Per Container 4
Amount Per Serving
%Daily Value*
Nutrition Facts
* Percent Daily Values are based on a 2,000 calorie diet.
Calories 90 Calories from Fat 20
Total Fat 2.5g 4 %
Cholesterol 15mg 5 %
Sodium 410mg 17 %Total Carbohydrate 6g 2 %
Protein 11g
Trans Fat 0g 0 %Saturated Fat 1.5g 8 %
Dietary Fiber 0g 0 %Sugars 5g
Vitamin A 4% • Vitamin C 0%
Calcium 8% • Iron 0%
R E P R O D U C I B L E T E A M N U T R I T I O N . U S D A . G O V
Name:

Here is a way to compare foods to see which foods are the best choices for you. Answer the questions below for these four foods, using What’s on the Label?
Fat-free milk
1% chocolate milk
2% milk
Whole milk
1. What is the serving size for this item?
2. Is the serving size realistic? (Is this how much you would normally eat/drink?)
3. How many total calories in one serving?
4. How many total grams of fat in one serving?
5. What percent of calcium in one serving?
Based on this information, which type of milk offers the most calcium with the lowest fat?
__________________________________________________________________________________________________
Now look at all the labels on the page. Answer these questions:
1. If Manuel drinks 8 fluid ounces of 1% chocolate milk and eats 6 ounces of fruit-flavored yogurt, how much calcium has he had? ____________________________________________________________________
How many grams of fat? __________________________________________________________________________
2. Which food item on the sheet has the least calcium with the highest amount of fat?
________________________________________________________________________________________________
3. Which food item on the sheet has the most calcium with the lowest amount of fat?
________________________________________________________________________________________________
What’s the Score?
R E P R O D U C I B L E T E A M N U T R I T I O N . U S D A . G O V
Name:

Here is a way to compare foods to see which foods are the best choices for you. Answer the questions below for these four foods, using What’s on the Label?
Fat-free milk
1% chocolate milk
2% milk
Whole milk
1. What is the serving size for this item? 1 cup (8 fl oz) 1 cup (8 fl oz) 1 cup (8 fl oz) 1 cup (8 fl oz)
2. Is the serving size realistic? (Is this how much you would normally eat/drink?)
3. How many calories in one serving? 90 170 130 150
4. How many total grams of fat in one serving? 0 2.5 5 8
5. What percentage of calcium in one serving? 30% DV 30% DV 30% DV 30% DV
Based on this information, which type of milk offers the most calcium with the lowest fat?
Answer: Fat-free
Now look at all the labels on the page. Answer these questions:
1. If Manuel drinks 8 fluid ounces of 1% chocolate milk and eats 6 ounces of fruit-flavored yogurt, how much calcium has he had? Answer: 50% DV
How many grams of fat? Answer: 4 grams
2. Which food item on the sheet has the least calcium with the highest amount of fat?
Answer: Vanilla ice cream
3. Which food item on the sheet has the most calcium with the lowest amount of fat?
Answer: Fat-free milk
What’s the Score? Answer Key
R E P R O D U C I B L E T E A M N U T R I T I O N . U S D A . G O V
Name: