Lessons from Asian Experiences of Industrial Agglomeration...
53
1 Lessons from Asian Experiences of Industrial Agglomeration and Trade Akifumi Kuchiki, Professor, Nihon University Summary: This paper proposes that growth strategy in Africa may take an industrial cluster policy of establishing an export processing zone to become an industrial cluster in future. The strategy in the 21 st century is an unbalanced growth by A.O. Hirschman (1958) under the liberalization of international trade and investment. The flowchart approach to industrial cluster policy is effective in taking the strategy and suggests us to find actors in Africa. 1. Introduction While there are many large industrial agglomerations or clusters in East Asia, there are nearly none in Sub-Saharan Africa. It may be difficult to narrow the gaps in the world without any industrial clusters in Africa. In his development theory, Nurkse (1953) explained that there exist vicious cycles of poverty in developing countries. Nelson (1956) also proved that there exists a low-level equilibrium trap. Yokoyama (1997) derived the policy implications as follows: To get out of the trap and take off, developing countries must attain critical minimum effort via the big push concept. Rostow (1960), Rosenstein-Rodan (1943), and Leibenstein (1957) advanced these concepts of take-off, big push, critical minimum effort, respectively. Lewis (1954), Ranis and Fei (1961), Jorgenson (1967), and others discussed a dual economy that consists of traditional customary economy and modern market economy. A modern economy is needed to give employment opportunities to
Transcript of Lessons from Asian Experiences of Industrial Agglomeration...

1
Lessons from Asian Experiences of Industrial Agglomeration and Trade
Akifumi Kuchiki, Professor, Nihon University
Summary:
This paper proposes that growth strategy in Africa may take an industrial cluster policy
of establishing an export processing zone to become an industrial cluster in future.
The strategy in the 21st century is an unbalanced growth by A.O. Hirschman (1958)
under the liberalization of international trade and investment. The flowchart approach
to industrial cluster policy is effective in taking the strategy and suggests us to find
actors in Africa.
1. Introduction
While there are many large industrial agglomerations or clusters in East Asia,
there are nearly none in Sub-Saharan Africa. It may be difficult to narrow the gaps in
the world without any industrial clusters in Africa.
In his development theory, Nurkse (1953) explained that there exist vicious
cycles of poverty in developing countries. Nelson (1956) also proved that there exists a
low-level equilibrium trap. Yokoyama (1997) derived the policy implications as
follows: To get out of the trap and take off, developing countries must attain critical
minimum effort via the big push concept. Rostow (1960), Rosenstein-Rodan (1943),
and Leibenstein (1957) advanced these concepts of take-off, big push, critical minimum
effort, respectively. Lewis (1954), Ranis and Fei (1961), Jorgenson (1967), and others
discussed a dual economy that consists of traditional customary economy and modern
market economy. A modern economy is needed to give employment opportunities to
2
redundant labor in the traditional economy. Hirschman (1958) recommended fostering
industries with high values of backward linkage effects at growing points or poles.
A closed economy, protectionism and centralization dominated the economies
before the 1980s. However, the economic conditions saw a marked change after the
1980s. President Ronald Reagan introduced a new economic policy called
Reaganomics, the Chinese government adopted an Open-Door Policy, and the World
Bank implemented its Structural Adjustment Policy. All these policies promoted the
shift from the planned economy to the market economy. The principles of the open
economy, free market, and decentralization started to dominate. Global trade and
investment were liberalized.
Economies moved away from the import substitution policy, which dominated
the era before the 1980s, and toward the export-led policy that the World Bank called
the “export push strategy” adopted in Asia. The most important change in the
development strategy, however, happened when Asian economies introduced the foreign
direct investment (FDI) by liberalizing trade and the inflow of foreign investment.
In sum, foreign investors in the modern economy were instrumental to the big
push that paved the way for Asian countries to liberalize themselves from their
low-level equilibrium trap after the 1980s. The idea of industrial clusters was tapped
to make foreign investors agglomerate in industrial zones in the Asian economies.
This paper proposes that growth strategy in Africa may take an industrial
cluster policy of establishing an export processing zone to become an industrial cluster
in future. The strategy is an unbalanced growth and needs leadership to implement it.
Our flowchart approach to industrial cluster policy is effective in taking the growth
strategy and suggests us to find actors to implement policy measures in Africa.

3
The policies recommended by the flowchart approach are as follows: First, an
export processing zone is needed to invite anchor firms since domestic markets of
countries in Africa are small; Second, on capacity building, primary education should
be strengthened; Third, incentives for anchor firms, such as cheap land prices, the
construction of roads and railways for the firm, and the establishment of international
hospitals and schools, are effective in inviting them to the export processing zone;
Fourth, the flowchart approach makes clear who are actors at each step of the flowchart
in forming an industrial cluster.
Section 2 reexamines development theories including Hirschman (1958) in
the past. Section 3 reclassifies industrial clusters by Markusen (1996) and Iammarino
and McCann (2006). Section 4 defines our flowchart approach to industrial cluster
policy. Section 5 explains the development of the electronics industry cluster policy in
northern Vietnam using the flowchart approach and introducing an interview method to
find the bottlenecks of its industrial cluster policy. Section 6 applies the flowchart
approach to cities in Africa and concludes the paper.
2. Reexamination of development strategy
There is a critical minimum level of per capita income which must be reached in
order for sustained growth to take place. To escape the low-level equilibrium trap, per
capita income must rise to the critical minimum level. Leibenstein (1957) explained
that, on the big push, the depressing forces operating below the critical minimum rate of
growth include (a) population growth and the reduction in available capital per worker,
(b) a rise in the incremental capital-output ratio, (c) insufficient stimulus to
entrepreneurial activity, and (d) resistance to new ideas, technical progress, and

4
non-productive conspicuous consumption (pp. 189-90).
Lewis (1954), Ranis and Fei (1961), Jorgenson (1967), and others discussed a dual
economy. The Lewis model consists of the traditional agricultural sector with low or
zero marginal products and the modern industrial sector with high rising marginal
products. The Lewis model argues economic growth requires structural change in the
economy whereby surplus labor in traditional agricultural sector migrates to the modern
industrial sector. A modern economy is needed to give employment opportunities to
redundant labor in the traditional economy. Hirschman (1958) proposed fostering
industries with high values of backward linkage effects at growing points or poles. In
Hirschman’s concept of unbalanced growth leading sectors induce growth in other sectors.
Individual firms create backward linkages through the purchase of inputs in the local
market or they create forward linkages through selling output as intermediate input to
other local firms. A theory of protecting infant industries supported the import
substitution policy of fostering domestic industries that Hirschman recommended by the
protection policy. That is, the government should foster domestic industries by
intervening in the dynamic market failure and protecting the industries of import
substitution.
Though a closed economy, protectionism and centralization dominated the
economies before the 1980s, the economic conditions saw a marked change after the
1980s. Reaganomics, Open-Door Policy, and the Structural Adjustment Policy by the
World Bank promoted the shift from the planned economy to the market economy and
international trade and investment have been liberalized.
Economies moved away from the import substitution policy, which dominated the
era before the 1980s, and toward the export-led policy that the World Bank called the
5
“export push strategy adopted in Asia” in a book titled ‘East Asian Miracle’ published in
1993. The most important change in the development strategy, however, was that Asian
economies introduced foreign direct investment (FDI) to export processing zones, special
economic zones or free trade zones by liberalizing the inflow of foreign investment.
Development strategy changed from import substitution policy to export-oriented policy
in the 1980s and 1990s. Most of Asian economies positively introduced foreign direct
investment one by one and their development pattern was called patterns of flying geese.
Then industrial policy lost its support in 1997 since Asian economies including South
Korea and Japan faced economic crises originated from Asian Currency Crisis. The
growth strategy of Asian countries used export processing zones, free trade zones or
special economic zones and experienced its bottlenecks. So they made efforts to solve
the bottlenecks.
They made an emphasis especially on institutional reforms after Mr. Wolfensohn
became the president of the World Bank. In growth theory, the Harrod (1939) – Domar
(1946) model emphasized the importance of physical investment, that is, social
overhead capital, the Solow (1956) model made clear that technological progress
contributes to economic growth, and Romer (1986) explained that human capital is the
origin of economic growth. We could understand that economic growth needs physical
investment, technological progress and human resource development. Investment
divides into domestic investment and foreign investment. We explained that domestic
investment played central roles in economic growth before the 1980s, and that foreign
investment substituted it after the 1980s. Official development assistance focused on
supplying social overhead capital as physical infrastructure before the 1980s, while it
emphasized the importance of (1) human capital, (2) institutions, and (3) social capital

6
after the 1980s.
Economics lost its weight in development strategy while sociology and politics
increased their weight. Poverty reduction strategy papers have been written since 1998
as institutional reforms became more and more important. ODA contributed to
introduce market economies into developing economies and instituted laws and
regulations for good governance and transparency. The papers promoted to build
capacity for development strategy and made clear that institutional reforms are
unavoidable for economic growth. Governance became the first priority of institutional
reforms in developing countries. In particular, control on corruption was one of the
most serious issues in the reforms.
Development theory before the 1980s told us that the big push of the manufacturing
sector is needed for poor countries to get out of the vicious cycle of poverty. The
manufacturing industries with high values of backward linkage are suitable for the
industries. Some countries took industrial policy of import substitution before the
1980s.
But international trade and investment have been liberalized and many countries in
Asia formed industrial agglomerations by inviting foreign investors to export processing
zones since the 1980s. Then Asian Currency Crisis happened in 1997. After the crisis,
it became common that, since it presupposed protectionism, industrial policy taken in
Asia is not applicable to all countries except such countries as South Korea and Japan that
bureaucrats are excellent. The investment environment in Asia, particularly in the
coastal area in China, was prepared to promote industrial agglomerations by introducing
foreign direct investment. For that purpose institutional reforms were emphasized to be
important. One of the most critical issues of institutional reforms for development is to

7
reduce corruption.
The summary of this section is as follows: first, industrial policy as import
substitution is not desirable; second, roles of markets of international trade and
investment should be played; third, institutional reforms in governance are necessary.
In summary, unbalanced growth is needed to get away from the vicious cycle of
poverty. The growing industry may belong to an industry with high backward linkages.
International trade and investment has been liberalized since the 1980s. While
Hirschman (1958) recommended us to foster the domestic industry by protecting
domestic firms before the 1980s, we should introduce his unbalanced growth strategy
under the liberalization of international trade and investment after the 1980s. One of the
strategies is industrial cluster policy.
3. New classification of industrial clusters
Markusen (1996) classified industrial districts into the five of Marshallian
industrial district, Italian variant, Hub-spoke districts, Satellite industrial platforms,
State-anchored industrial districts. The paper explains the five districts as follows.
Marshallian industrial district is a traditional industrial agglomeration whose business
structure is dominated by small locally owned firms. It has its recent Italian variety.
Hub-and-spoke districts are dominated by one or several large, vertically integrated
firms in one or more sectors, surrounded by smaller and less powerful suppliers. The
smaller firms are quite dependent upon the anchor firm. Satellite platforms are a
congregation of branch facilities of externally based multi-plant firms. State-anchored
districts have their business structure dominated by one or several large, government
institutions such as military bases, state or national capitals, large public universities,

8
surrounded by suppliers and customers.
Iammarino and McCann (2006) classified industrial agglomerations into (1) pure
agglomeration, (2) industrial complex, and (3) social network (pp.1022-23). (1) In the
model of pure agglomeration, inter-firm relations are inherently transient. Firms are
essentially atomistic in the sense of having no market power. (2) The industrial
complex is characterized primarily by long-term stable and predictable relations
between the firms in the cluster. Component firms within the spatial cluster each
undertake significant long-term investments in order to become part of the grouping.
The rationale is that proximity is required in order to minimize inter-firm transport
transactions costs. (3) The social network model argues that mutual trust relations
between key decision-making agents in different organizations may be as important as
decision-making hierarchies within individual organizations. These trust relations will
be manifested by a variety of features such as joint lobbying, informal alliances, and so
on. Trust relations are assumed to reduce inter-firm transactions costs. The paper
argues how an observed industrial cluster may evolve over time and used some
examples to illustrate the different directions of shifts in cluster types in order to
identify typical evolutionary paths and transitions.
The evolutionary process of the automobile industry is from pure agglomeration to
industrial complex. The evolutionary process of the high-fashion garment industry
clusters is from old social network to new social network, or to pure network. The
evolutionary transition of the Silicon Valley cluster is from old social network to new
social network to pure agglomeration. On the other hand, no real evolutionary path is
discernible in the case of the Scottish Electronics Industry.
Hershberg, Nabeshima and Yusuf (2007) overviewed papers on
9
University-Industry Linkages (UILs) and National Innovation Systems (NISs) in Asia.
Their paper pointed out the following conclusions related to our paper: first, the leading
universities in Korea and Singapore have only recently begun giving more attention to
research and its commercialization; second, the economies in East Asia, especially
Japan, Korea, and Taiwan, are slowly changing the way in which their universities and
research institutes interact with firms; third, the leading university and research
institutions are unlikely to be satisfied with their traditional roles of educating and
imparting science and technology skills; lastly, contracting out research to universities,
entering into alliances with research institutes and collaborating with university
researchers can confer substantial advantages.
Kuchiki&Tsuji (2008) proposed a flowchart approach as industrial cluster policy.
We think that the re-classification of industrial clusters by Markusen (1996) is effective
in implementing industrial cluster policy successfully based on the Asian experiences of
growth.
This section tries to reclassify the classifications of Markusen (1996) and
Iammarino and McCann(2006) and position University-Industry Linkages (UILs) and
National Innovation Systems (NISs) overviewed by Hershberg, Nabeshima and Yusuf
(2007) at the third step of our flowchart approach by Kuchiki&Tsuji (2008) that is
composed of two steps of agglomeration and innovation. Kuchiki&Tsuji (2008) needs
to take into account the third step of activating innovation in order to understand the
dynamics of industrial clusters by Iammarino and McCann (2006).
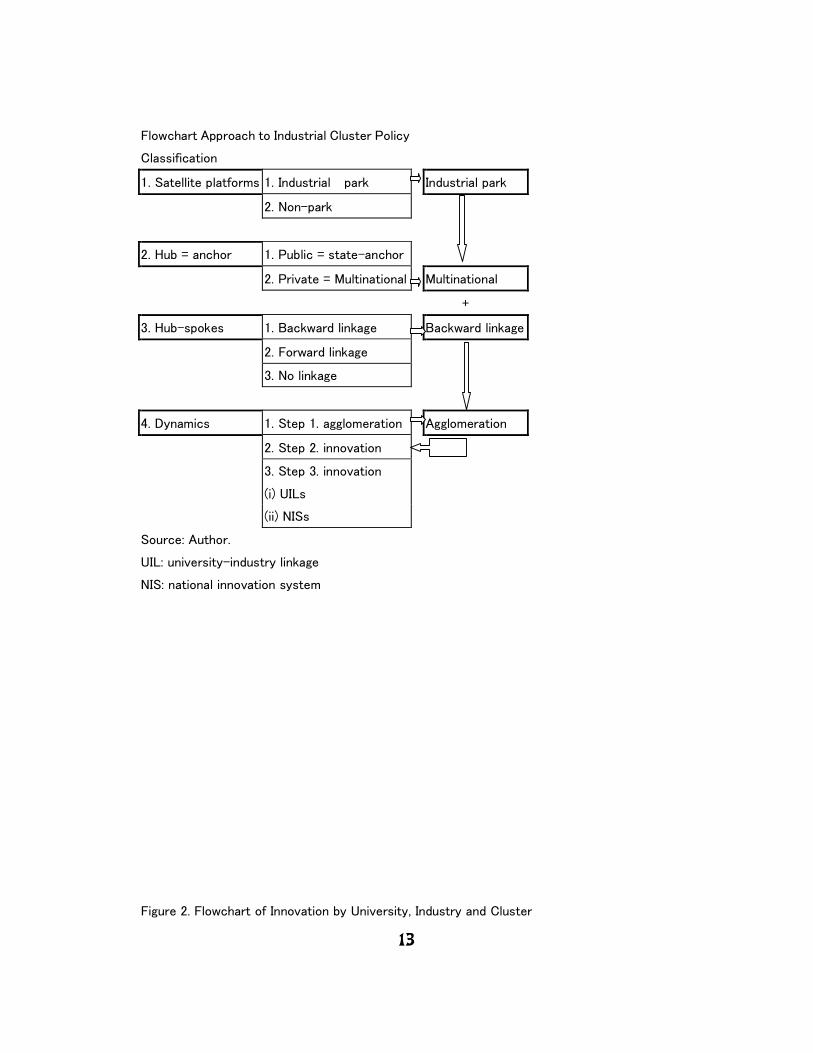
Figure 1 shows our new classification consisting of the following four
dimensions: the first dimension is whether there are industrial zones or industrial parks;
the second dimension is which type of ownership of anchor firms is, public, private or

10
semi-public; the third dimension is which linkage is, backward linkage, forward linkage
or little linkage; the fourth dimension is which step an agglomeration locates, the first
step of agglomeration, the second step of innovation, or the third step of innovation with
University-Industry Linkages (UILs) and National Innovation Systems (NISs).
Four dimensions of the classification on industrial clusters in detail are as follows.
The first dimension is whether industrial zones or science parks exist or not.
Markusen (1996) illustrated Manaus Export Processing Zone in Brazil and Research
Triangle Park in U.S.A. as Satellite Platforms. Satellite Platforms are cases where
industrial zones or science parks exist. Industrial agglomerations without industrial
zones are possible to exist.
The second dimension is which type of ownership it is, (i) public, (ii) private, or
(iii) semi-public. The hub in the case of the hub-spoke in Markusen (1996) is an
anchor firm and its ownership can be in the case of the public sector or the private sector.
In general, hub firms are considered to be multinational corporations, particularly in the
automobile industry and electronics industry. Markusen (1996) illustrated Toyota of a
Japanese automobile firm in Toyota City in Japan as its case. But the ownership of
Proton of Malaysia, Maruti Suzuki of India, and First Automobile Works Group of
China are owned by the public sector. Many governments in Asia established
automobile firms by adopting industrial policy and tried to form the automobile industry
cluster. In sum, the ownership of hub firms can be either state-anchored or
multinational corporation-anchored.
The third dimension is which linkage an anchor firm has, (i) backward linkage,
(ii) forward linkage, or (iii) little linkage. There are three types of industrial linkages.
Close industrial linkage will strengthen the relationship between a hub firm, or anchor

11
firm, and spokes. The automobile assembly industry has high value of industrial linkage
since an automobile is composed of more than twenty thousands of parts and
components. An ink jet printer in the electronics industry is composed of eight
hundred of parts and components. The size of industrial agglomeration, or the number
of spokes, depends on the strength of industrial linkage between a hub firm and its
spoke firms. Though the steel industry has not backward linkage but strong forward
linkage, its industrial agglomeration of the steel industry in Kitakyushu was formed
since Nippon Steel in Kitakyushu in Japan was large at the cost of about 100 billion U.S.
dollar.
The fourth dimension is which step an agglomeration locates, (i) the first step of
agglomeration, (ii) the second step of innovation, or (iii) the third step of innovation
with University-Industry Linkages (UILs) and National Innovation Systems (NISs).
The dynamic evolution of industrial clusters will depend on the change in transaction
costs according to Iammarino and McCann (2006). We apply their theory to the Asian
experiences in the following. Pure agglomeration of Iammarino and McCann (2006)
corresponds to the first step of our flowchart approach. This is a case where firms
agglomerate without innovation. This case will evolve to the second step when
innovation in the agglomeration will start. The third step is a step when innovation is
positively active due to University-Industry Linkages (UILs) and National Innovation
Systems (NISs).
We analyze the Asian experiences of growth since the 1980s using our new
classification with the four dimensions. Figure 1 is a result of the application of the
new classification to the flowchart approach to Kuchiki & Tsuji (2008). An Asian
growth model is to construct an industrial zone at the first dimension, to invite a foreign
12
investor as an anchor firm to the industrial zone at the second dimension, to make its
related firms agglomerate at the third dimension, resulting in the first step of industrial
clustering of the flowchart approach. Figure 2 is a prototype model of the third step of
innovation under University-Industry Linkages (UILs) and National Innovation Systems
(NISs).
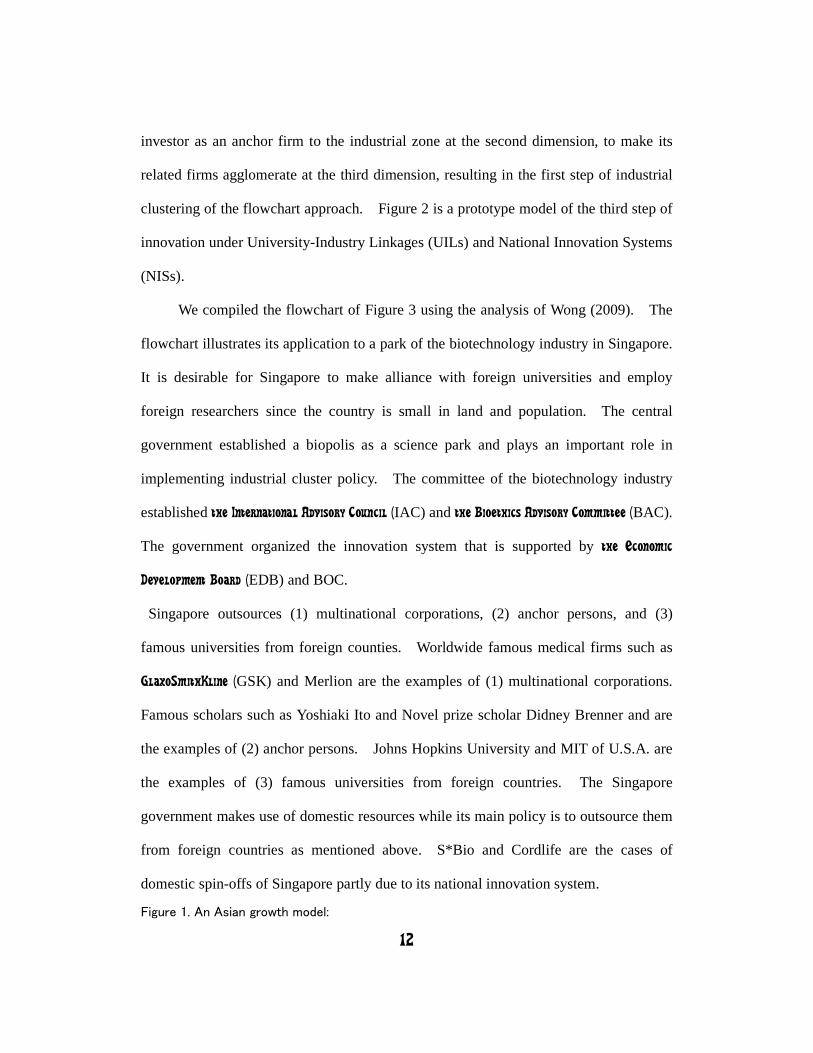
We compiled the flowchart of Figure 3 using the analysis of Wong (2009). The
flowchart illustrates its application to a park of the biotechnology industry in Singapore.
It is desirable for Singapore to make alliance with foreign universities and employ
foreign researchers since the country is small in land and population. The central
government established a biopolis as a science park and plays an important role in
implementing industrial cluster policy. The committee of the biotechnology industry
established the International Advisory Council (IAC) and the Bioethics Advisory Committee (BAC).
The government organized the innovation system that is supported by the Economic
Development Board (EDB) and BOC.
Singapore outsources (1) multinational corporations, (2) anchor persons, and (3)
famous universities from foreign counties. Worldwide famous medical firms such as
GlaxoSmithKline (GSK) and Merlion are the examples of (1) multinational corporations.
Famous scholars such as Yoshiaki Ito and Novel prize scholar Didney Brenner and are
the examples of (2) anchor persons. Johns Hopkins University and MIT of U.S.A. are
the examples of (3) famous universities from foreign countries. The Singapore
government makes use of domestic resources while its main policy is to outsource them
from foreign countries as mentioned above. S*Bio and Cordlife are the cases of
domestic spin-offs of Singapore partly due to its national innovation system.
Figure 1. An Asian growth model:
13
Flowchart Approach to Industrial Cluster Policy
Classification
1. Satellite platforms 1. Industrial park Industrial park
2. Non-park
2. Hub = anchor 1. Public = state-anchor
2. Private = Multinational Multinational
+
3. Hub-spokes 1. Backward linkage Backward linkage
2. Forward linkage
3. No linkage
4. Dynamics 1. Step 1. agglomeration Agglomeration
2. Step 2. innovation
3. Step 3. innovation
(i) UILs
(ii) NISs
Source: Author.
UIL: university-industry linkage
NIS: national innovation system
Figure 2. Flowchart of Innovation by University, Industry and Cluster

14
Actors Gov. U I
step II Prioritization Central Local
Innovation UniversityUniversityUniversityUniversity
Pre-condition Yes
No
Science park o o
Yes 2. NIS,RIS,MIS2. NIS,RIS,MIS2. NIS,RIS,MIS2. NIS,RIS,MIS Return
Capacity building No o o
Spin-off s Education Return o
Anchor person o
Agglomeratio
n
IndustryIndustryIndustryIndustry o
research institutesresearch institutesresearch institutesresearch institutes
1. UILs linkages1. UILs linkages1. UILs linkages1. UILs linkages o o
2. NIS,RIS,MIS2. NIS,RIS,MIS2. NIS,RIS,MIS2. NIS,RIS,MIS
Output =Output =Output =Output =
(note) innovation innovation innovation innovation
3. Clustering3. Clustering3. Clustering3. Clustering
Source:
Author.
Note: Innovation = f
(UILs, NIS: Cluster)
where UILs denotes university-industry
linkages, NIS denotes national innovation
system.
U = University/Research Institutes Gov.
= .Government, MIS=municipal innovation system,
I=3.Industry, RIS=regional innovation system.
Figure 3. The Biology Industry Cluster in Singapore:
The roles of parks, anchor persons and capacity building

15
BiopolisBiopolisBiopolisBiopolis Industrial park
The government A*STAR the bio committees IAC
organizations EDB BAC
BSG NISNISNISNIS (National Innovation System)
BOC
MNCs GSK
Merlion
Outsource
Schering-Plough
LSB etc.
Anchor personsAnchor personsAnchor personsAnchor persons etc.
Sidney Brenner
Yoshiaki Ito etc.
Alliances with universities
Johns Hopkins NSU: National
MIT etc. with NSU University of Singapore
Spin-offs S*Bio
Cordlife
Local KOOPrime etc.
Capacity buildingCapacity buildingCapacity buildingCapacity building
UILsUILsUILsUILs
Recruit world-class scientists Source: Author.
S*Bio was established as a joint venture between Chiron and the EDB using Chiron’s technology

16
platform to develop products for cancer and infectious diseases, especially those in Asia. Merlion
originated as a joint venture between GSK and the EDB to perform more traditional drug. The
government strengthens University-Industry Linkages (UILs) by building capacity.
4. Patterns of the flowchart approach
This section aims to propose a flowchart that shows sufficient conditions that can
lead to the successful formation of an industrial cluster.
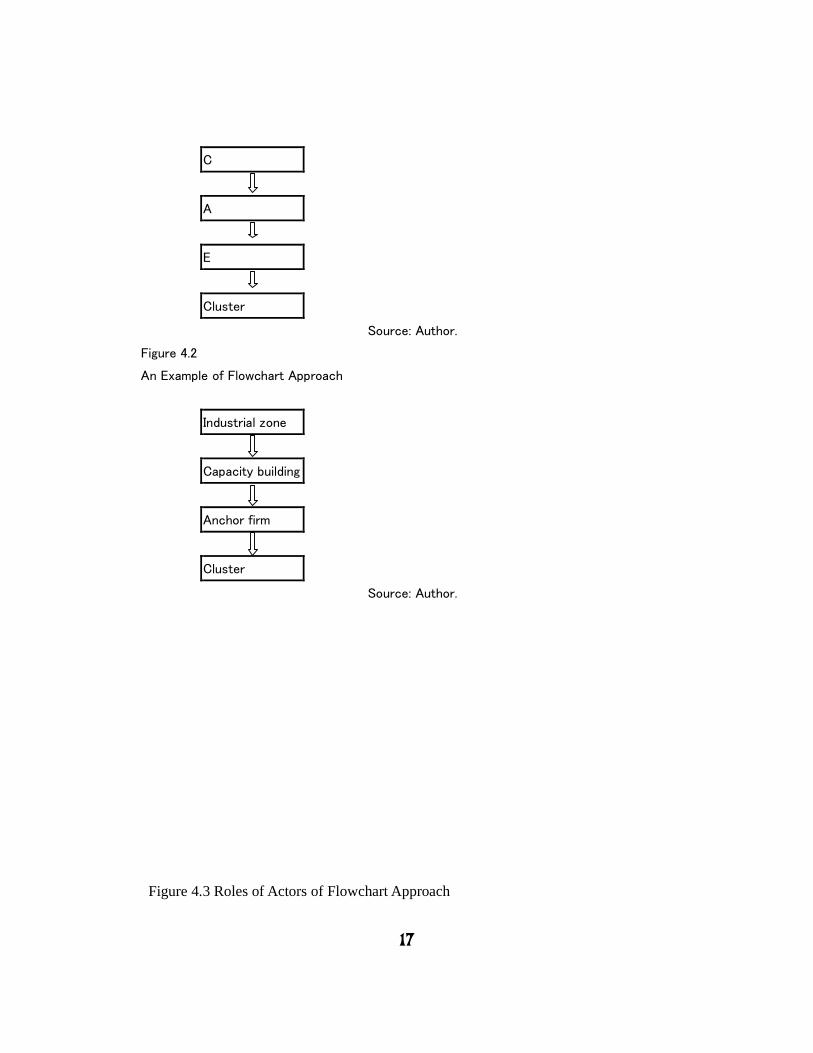
4.1 A general model of the flowchart approach: From the diamond model in the form
of a plane to the flowchart model in the form of a line
Our flowchart approach is not an empty theory but a practical hypothesis
applicable to the industrial cluster policy. We can form a cluster if we follow the
following steps: Find ingredients or factors such as establishing industrial zones, build
capacity, and invite an anchor firm. Figure 4.1 shows ‘industrial zone’, ‘capacity
building’, and ‘anchor firm’,
(i) From the flowchart above, select the minimum number of ingredients.
Figure 4.2 shows C, A and E.
(ii) Order the ingredients along a flowchart (Figure 4.3). The number of ways
we prioritize them is a mathematical ‘permutation’ and 3! = 3*2*1. In
general, n! = n*(n-1)*(n-2)*…*3*2*1. We can, however, implement only
one policy. Therefore, we must prioritize the policy measures.
Figure 4.1
A Model of Flowchart Approach
17
C
A
E
Cluster
Source: Author.
Figure 4.2
An Example of Flowchart Approach
Industrial zone
Capacity building
Anchor firm
Cluster
Source: Author.
Figure 4.3 Roles of Actors of Flowchart Approach

18
(iii) Specify actors such as central government, local government,
non-governmental organizations, or private firms and move forward one
step in the flowchart if the answer is ”No”.
The flowchart approach has three functions: It prioritizes policy measures, specifies
players and gives prescriptions regarding the industrial cluster policy.
4.2 A prototype flowchart model for the cluster policy of the manufacturing sector
Our flowchart of the manufacturing industry cluster policy proceeds as follows:
First, a local government establishes an industrial zone to attract foreign investors.
Second, the government builds capacity for improving the business and living

19
conditions of foreign investors. Elements of capacity building include: (i) constructing
physical infrastructure: (ii) building institutions; (iii) developing human resources; and
(iv) creating living conditions amenable to foreign investors. Physical infrastructure
refers to roads, ports, communications, etc. Institutional building, which is also crucial
in attracting foreign investors, includes streamlining investment procedures through
one-stop services, deregulation, and introduction of preferential tax systems. Human
resources, which are usually an initial condition for foreign investors, include unskilled
labor, skilled labor, managers, researchers, and professionals. The living environment,
on the other hand, includes the provision of hospitals and international schools.
An anchor firm will be ready to invest after this capacity building has been
carried out. The anchor firm is defined as one with a high value of the backward
linkage in manufacturing. Along this line, the Rasmussen method is based on the
column sums of the Leontief inverse to measure intersectoral linkages. The backward
linkage based on the Leontief inverse matrix is defined as the column sums of the
inverse matrix.
BLRj=Σni=1 l ij,
where l ij is the ij’ th element of Leontief inverse matrix that is denoted by L = (I - A)-1.
BLRj is backward linkage for sector j which reflects the effects of an increase
in final demand. It represents the power of an industry to generate derived demand
from other industries. Core competencies of a region should be established to attract
the anchor firm.
4.3 Step I. Agglomeration
Our flowchart approach is illustrated in Figure 5. First, we ask whether

20
industrial zones have been established. If they have not, we must decide which actors
should establish such zones. Once these actors are identified, we return to the main
stream of the flowchart.
Next, we look at the second step, capacity building, which takes place after the
establishment of industrial zones. We examine whether there is adequate water supply
for the industrial zones (Figure 6). We then proceed along the flowchart to examine
power supply, communication, and transportation.
After looking at the physical infrastructure, we examine whether institutions are
in place. The central government must institutionalize national tax systems and the local
government must institutionalize local tax systems. One-stop investment procedures are
crucial for successfully attracting foreign investors.
In the area of human resource development, an abundance of unskilled labor with a high
literacy rate is a necessary condition for luring foreign investors whose purpose is to
employ cheap labor. On the other hand, an industrial cluster sometimes faces a shortage
of skilled labor after industrialization has progressed. Universities and on-the-job
training centers for innovation are then needed for further development.

21
Figure 5: Flowchart Approach: Step I. Agglomeration

22
Living conditions are equally crucial in the equation. Researchers from investor
companies have incentives for work hard if they can enjoy their lives; it is important to
create satisfactory conditions in areas such as housing, schools, hospitals, etc. These are
the final conditions that must be satisfied to bring in anchor firms.
Figure 6. Flowchart Approach: StepⅠⅠⅠⅠ. Infrastructure
(Capacity Building)

23
Here, the anchor firm is defined as one belonging to the manufacturing industry and
having a high value of backward linkage effect in its input-output relationship
4.4 Step II. Innovation
Intellectual property rights should be enforced in Step II (innovation), as shown in
Figure 7. Preconditions for Step II are: (i) Related services: finance and insurance,

24
logistics, marketing companies, repair shops, and used car shops; and (ii) Professional
and other services: lawyers, restaurants, retail shops, and tourism.
Figure 7. Flowchart Approach: Step ⅡⅡⅡⅡ. Innovation

25
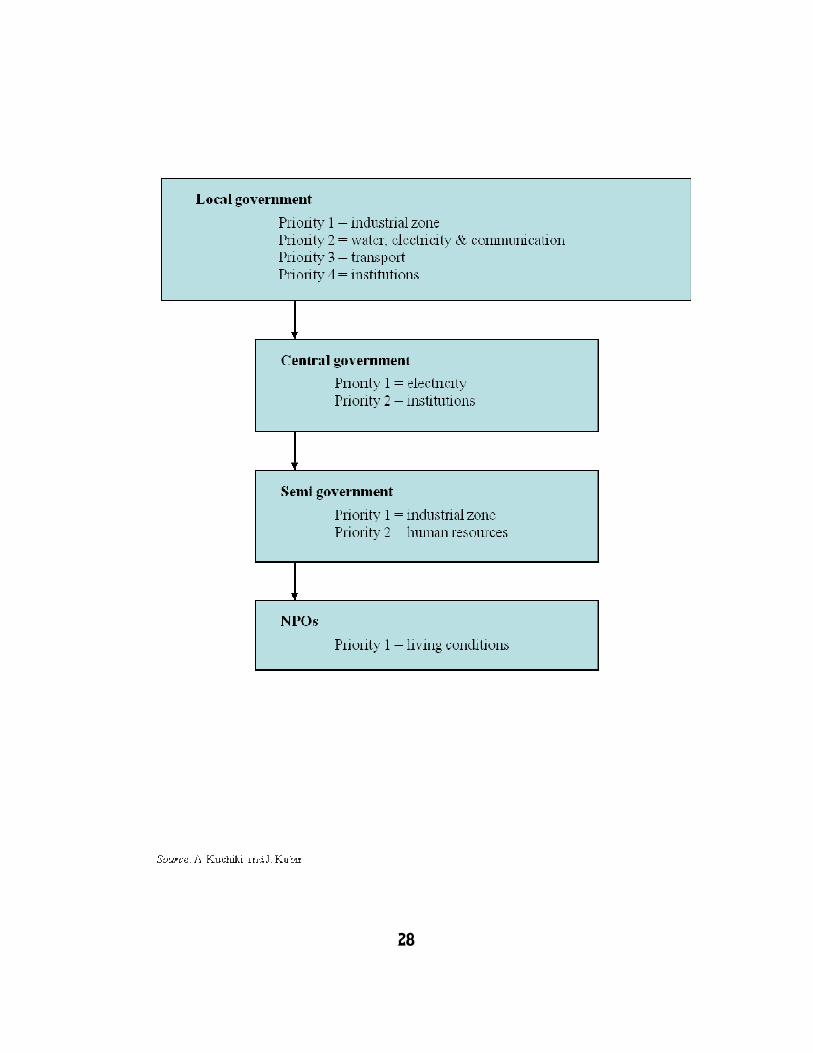
As shown in Figure 8, the factors that lead to innovation are: (i) universities and
26
research institutes; (ii) capacity building of infrastructure, institutional reforms, human
resources, and living conditions: and (iii) anchor persons.
Meanwhile, joint actions or activities that support innovation are: (i) facilitating
cluster skill centers; (ii) establishing collective projects; (iii) creating business
associations; and (iv) implementing a branding strategy.
The linear instruments and interactive approach of policy instruments for
innovation may be as follows:
Linear instruments: (i) direct R&D aids; (ii) transfer of research-based knowledge
to firms; and (iii) financial support:
Interactive approach: (i) improvement of institutions and programs that provide
technology transfer services; and (ii) policy to stimulate networking and business
clusters.
We earlier identified the minimum prerequisites, i.e., universities and research
institutes, capacity building and anchor persons, to simplify the flowchart of Step II and
prioritize policy measures. Most Asian countries are still at the door of innovation,
and we cannot find a huge number of the experiences on innovation in Asia. Step II is
still a hypothesis to be further examined.
Figure 8 shows the priorities of each actor or player. Local governments play a
crucial role in establishing industrial zones, supplying electricity, facilitating transport,
and forming institutions. The first priority of local government in Figure 8 is to
construct industrial zones for foreign investors. The second priority during that stage is
to supply electricity, facilitate transportation, and form institutions. The central
government’s main priorities are to supply electricity and build institutions.
The flowchart approach to industrial cluster policy can be applied to other regions

27
in the following cases:
(i) Where there are newly-formed industrial clusters (ex-ante application): Examine
whether each step of the flowchart is a “Yes” or ”No” and find players if the answer
is ”No”.
(ii) To evaluate the failed cases of industrial cluster policies (ex-post evaluation):
Examine whether each step of the flowchart is a ”Yes” or ”No”, find reasons why it
failed if the answer is ”No”, and proceed to the next step.
Figure 8. Priorities of actors
28

29
(iii) Where industrial cluster policies have been successful, so as to prescribe such for
their next upgrading (ex-post prescription): Examine whether each step of the flowchart
is a "Yes” or ” No”. Find players if the answer is “No”, and prescribe the region for its
industrial cluster policy.
This section further recommends that for the “flowchart approach to an industrial
cluster policy” to help form industrial clusters in the manufacturing industry in Asia,
certain conditions would first have to be met. The formation of industrial clusters in
East Asia was typically theorized by defining the role of “quasi-public goods”. Also, the
industrial cluster policy was proven to enhance economic growth under a production
function of “increasing returns to scale”. Another factor was the critical amount of
production under “scale economies”, which firms used as basis for deciding whether or
not to invest in clusters.

30
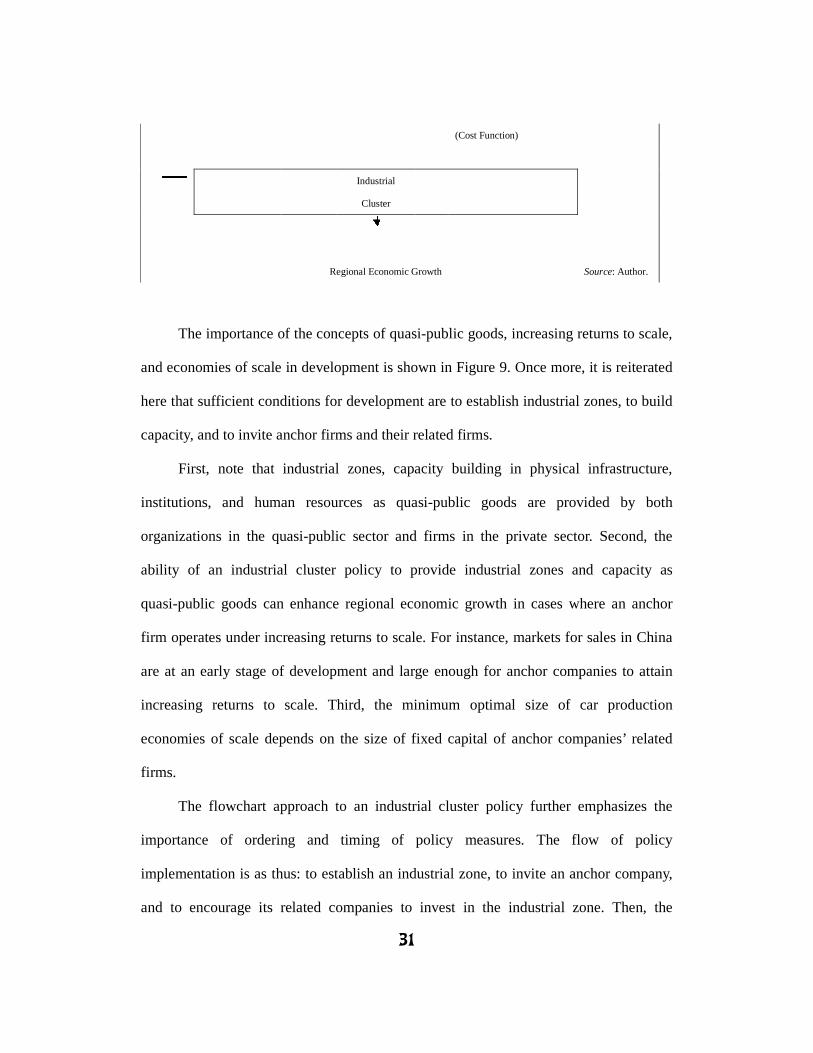
Figure 9. An Industrial Cluster Formed by an Anchor Firm
Market with Saucers
Domestic Export
Industrial Zone
(a) Industrial Zone Export Processing Zone
1. Quasi-Public Goods
(b) Capacity Building
1. Infrastructure
2. Institutions
3. Human Resources
4. Living Conditions
1. Quasi-Public Goods
Market
(c) Anchor Firm
2. Increasing Returns to Scale
(Production Function)
Fixed capital
(d) Related Firms
3. Economies of Scale
31
(Cost Function)
Industrial
Cluster
Regional Economic Growth Source: Author.
The importance of the concepts of quasi-public goods, increasing returns to scale,
and economies of scale in development is shown in Figure 9. Once more, it is reiterated
here that sufficient conditions for development are to establish industrial zones, to build
capacity, and to invite anchor firms and their related firms.
First, note that industrial zones, capacity building in physical infrastructure,
institutions, and human resources as quasi-public goods are provided by both
organizations in the quasi-public sector and firms in the private sector. Second, the
ability of an industrial cluster policy to provide industrial zones and capacity as
quasi-public goods can enhance regional economic growth in cases where an anchor
firm operates under increasing returns to scale. For instance, markets for sales in China
are at an early stage of development and large enough for anchor companies to attain
increasing returns to scale. Third, the minimum optimal size of car production
economies of scale depends on the size of fixed capital of anchor companies’ related
firms.
The flowchart approach to an industrial cluster policy further emphasizes the
importance of ordering and timing of policy measures. The flow of policy
implementation is as thus: to establish an industrial zone, to invite an anchor company,
and to encourage its related companies to invest in the industrial zone. Then, the

32
recipient country’s government reduces its role in order to promote competition. It
transfers greater authority to local governments and makes more use of the quasi-public
sector (i.e., public corporations and state enterprises). As a result, the quasi-public sector
is likely to supply quasi-public goods. The improvement and expansion of networks in
Asia by both multinational corporations and the quasi-public sector are thus
prerequisites to the upgrade of Asia’s industrial structures. Leadership, too, is crucial
to the success of an industrial cluster policy.
5. The electronics industry cluster policy in northern Vietnam
In this section, we propose that, upon considering the current status of northern
Vietnam using the flowchart approach, an industrial policy can take one of the
following three options. First, the flowchart goes to Step II: Innovation. Second, the
flowchart feeds back to the capacity building stage. Third, the local related firms
venture into partnerships with foreign firms.
(1) Thang Long Industrial Park (TLIP)
We explain industrial clusters in Hanoi and Haiphong that are located west and
east of national highway Route 5. Hanoi is centrally positioned from Hochiminh in
Vietnam, Bangkok in Bangkok, Kunming and Guangzhou in China. It is located 1,100
km from Hochiminh, 950 km from Bangkok, 600 km from Kunming, and 850 km from
Guangzhou. Therefore we can expect northern Vietnam to be merged with southern
China from the supply chain management viewpoint in the future.
Highway Route 5 is 100 km long and links Hanoi in the west and Haiphong in the
east. Hanoi is the capital of Vietnam and Haiphong is a port city. Thang Long
Industrial Park (TLIP) located in Hanoi was established by Sumitomo Corporation. Its

33
total area is 220 hectare. Nomura Haiphong Industrial Zone (NHIZ) located in
Haiphong was established by Nomura Security Company.
Figure 10. Industrial Clusters in Northern Vietnam
Hanoi Haiphong Haiphong Port
Nomura Haiphong IZHighway No.5
Northern Vietnam
A Model of Forming Industrial Clusters
Thang Long IP
Nomura Haiphonng IZ + Capacity building【ODA】Highway No.5, Haiphong Port
Institutional Reform (One stop service, tax)
Anchor Companies Canon, Honda, Panasonic
Related and Other Companies Japanese companies, other foreign and local companies
Industrial Clusters Development of Northern Vietnam
Canon Effect
Source: Kuchiki (2007).
Both TLIP and NHIZ offer good quality infrastructure as a common incentive.
TLIP illustrates national highway Route 5 from Hanoi to the Haiphong port as is shown
in Figure 10. NHIZ analyzed the positive effect in a relatively short time due to
completion of national highway Route 5 as follows: It took 1 hour and 15 minutes by
car from Hanoi to NHIP in 2002 though it had taken 3 to 4 hours before the completion
of national highway Route 5.
One factor that influences foreign investors’ decision on investment is capacity
building within recipient countries. Capacity depends on the following four conditions:
1. Human resources, 2. Infrastructure, 3. Living conditions, and 4. Institutions.
Regarding infrastructure, the Japanese official development assistance loans

34
contributed to facilitating infrastructure in northern Vietnam. National highway Route
5 and the Haiphong port constructed and rehabilitated by the loans are effective in
forming industrial agglomeration.
Regarding living conditions, apartments, supermarkets, restaurants, hotels, direct
air flights from host countries to recipient countries, schools, hospitals, and amusement
facilities are a key to inviting foreign investment. The Hanoi area cleared the key
condition.
Regarding institutions, one-stop service plays a large role in streamlining
investment procedures. This means that, at an office of TLIP, tenant companies can get
all approval related to investment licenses, factory operation on export procedures, and
so on required from ministries. Streamlined customs clearance helps reduce tenant
companies’ costs. Industrial zones in Asia offer preferential tax treatment. Corporate
tax in Vietnam is exempted for four years after a company makes profit. After the four
years the tax rate is 5% for a further four years and then 10%.
The Japan Bank for International Cooperation (2001) survey showed that
institutional reform is a key to developing the private sector in Vietnam. Japan’s
minister of finance in April 1999, Miyazawa, pledged to provide 20 billion yen to
support programs for developing the private sector as requested by Vietnam’s former
Prime Minister Phan Van Khai. The loan was agreed and implemented in September
1999.
According to the survey, private companies positively rated trade liberalization,
change from an approval system to a registration system to establish companies, and
abolishment of the industries restricted or prohibited by some ministries. The number of
restricted or prohibited industries was reduced from 400 to 250. The registration system
35
in establishing companies has streamlined administrative procedures and reduced the
average required time to less than one month from three months before 2000. All of the
private companies were permitted to export and import without licenses to guarantee
free trade. As a result the institutional reforms have been highly rated. We can
conclude from the survey that institutional reforms for streamlining the procedures are
effective in developing the private sector and promoting foreign direct investment.
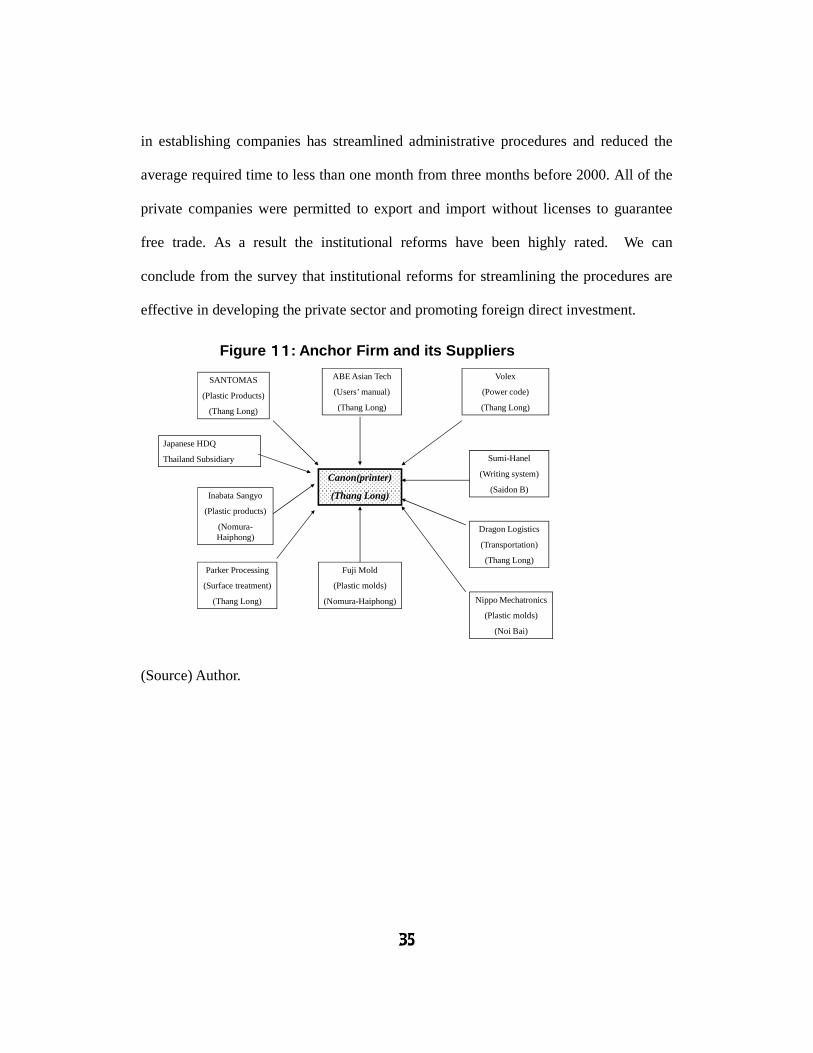
Figure 11111111: Anchor Firm and its Suppliers
Canon(printer)
(Thang Long)
SANTOMAS
(Plastic Products)
(Thang Long)
Inabata Sangyo
(Plastic products)
(Nomura-Haiphong)
Parker Processing
(Surface treatment)
(Thang Long)
ABE Asian Tech
(Users’ manual)
(Thang Long)
Volex
(Power code)
(Thang Long)
Sumi-Hanel
(Writing system)
(Saidon B)
Dragon Logistics
(Transportation)
(Thang Long)
Nippo Mechatronics
(Plastic molds)
(Noi Bai)
Fuji Mold
(Plastic molds)
(Nomura-Haiphong)
Japanese HDQ
Thailand Subsidiary
(Source) Author.
36
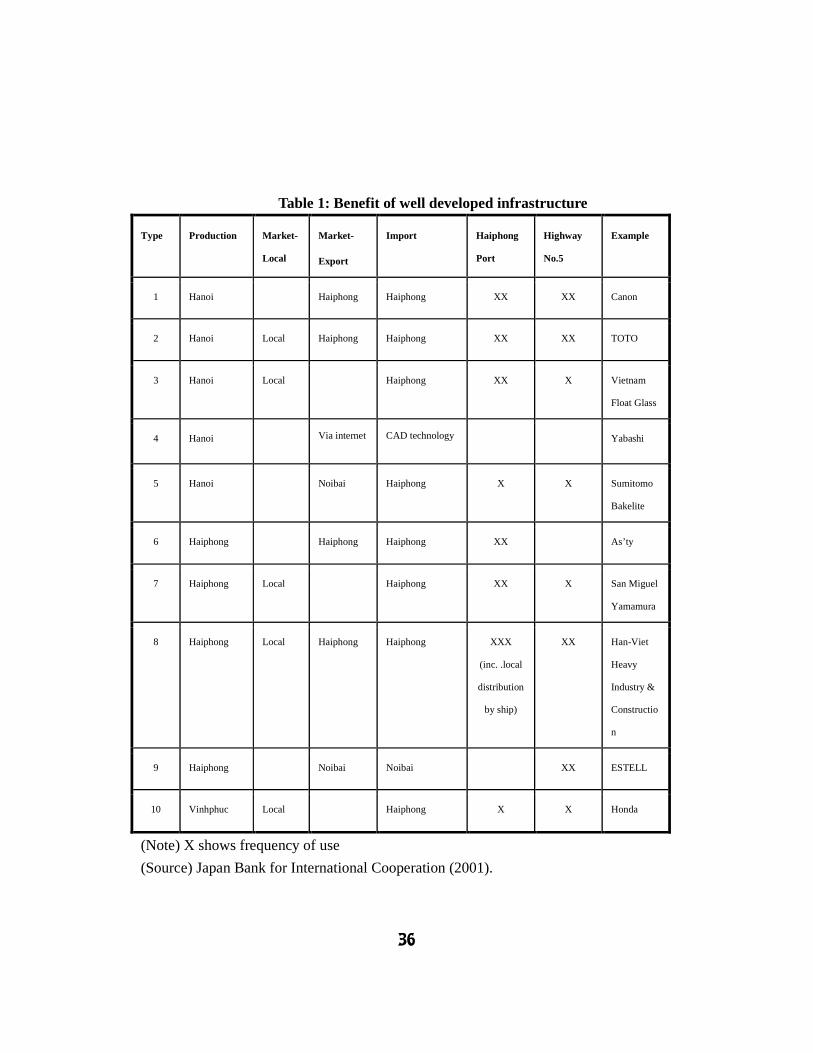
Table 1: Benefit of well developed infrastructure
Type Production Market-
Local
Market-
Export
Import Haiphong
Port
Highway
No.5
Example
1 Hanoi Haiphong Haiphong XX XX Canon
2 Hanoi Local Haiphong Haiphong XX XX TOTO
3 Hanoi Local Haiphong XX X Vietnam
Float Glass
4 Hanoi Via internet CAD technology Yabashi
5 Hanoi Noibai Haiphong X X Sumitomo
Bakelite
6 Haiphong Haiphong Haiphong XX As’ty
7 Haiphong Local Haiphong XX X San Miguel
Yamamura
8 Haiphong Local Haiphong Haiphong XXX
(inc. .local
distribution
by ship)
XX Han-Viet
Heavy
Industry &
Constructio
n
9 Haiphong Noibai Noibai XX ESTELL
10 Vinhphuc Local Haiphong X X Honda
(Note) X shows frequency of use
(Source) Japan Bank for International Cooperation (2001).

37
(2) Canon’s effect
Sumitomo Corporation began selling TLIP land lots in 1997. Canon that was
established in April 2001 started operation in May 2002. Companies that provided
parts to Canon decided to move into TLIP particularly in 2002. Canon and its related
firms established factories in TLIP after national highway Route 5 was constructed and
Haiphong port rehabilitated in period 2 starting from 2002.
Table 1 shows that eight of the ten firms use highway Route 5 and that eight of
the ten firms use Haiphong Port. Firms moved into TLIP and NHIZ in 2001 and 2002
after Canon established its factory and the number of projects by foreign direct
investment increased in Hanoi and Haiphong after 2001. Two companies in 2000, six
in 2001, and 11 in 2002 singed up to invest in TLIP. As is shown in Figure 8, Parker
Processing VN Co., whose products are paint and surface treatment for metal parts,
moved into TLIP in August 2000 to provide parts to Canon. Volex Cable Assembly
started producing power supply cords and interconnectors in 2001. The Singaporean
company started providing products to Canon, though its intention was not only to sell
to Canon. Companies that provided parts to Canon decided to move into TLIP
particularly in 2002. They are Sumitomo Coil Center that produces parts for printers,
a Japanese company producing dye-casting products, and a Malaysian company,
Santomas VN Co. that produces precision plastic injection molding. So Canon is an
anchor company to lead other companies to provide parts and components as is shown
in Figure 11 based on the analysis of Tran, Kuchiki, Idei, and Sakata (2003).
38
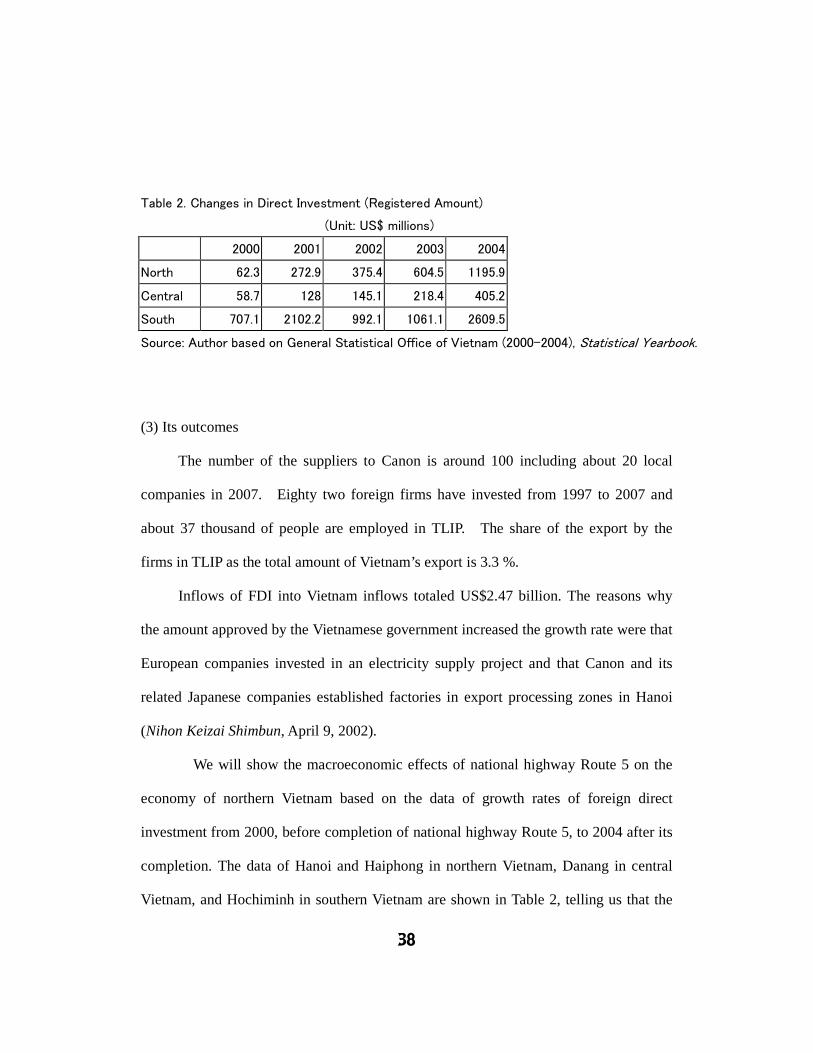
Table 2. Changes in Direct Investment (Registered Amount)
(Unit: US$ millions)
2000 2001 2002 2003 2004
North 62.3 272.9 375.4 604.5 1195.9
Central 58.7 128 145.1 218.4 405.2
South 707.1 2102.2 992.1 1061.1 2609.5
Source: Author based on General Statistical Office of Vietnam (2000-2004), Statistical Yearbook.
(3) Its outcomes
The number of the suppliers to Canon is around 100 including about 20 local
companies in 2007. Eighty two foreign firms have invested from 1997 to 2007 and
about 37 thousand of people are employed in TLIP. The share of the export by the
firms in TLIP as the total amount of Vietnam’s export is 3.3 %.
Inflows of FDI into Vietnam inflows totaled US$2.47 billion. The reasons why
the amount approved by the Vietnamese government increased the growth rate were that
European companies invested in an electricity supply project and that Canon and its
related Japanese companies established factories in export processing zones in Hanoi
(Nihon Keizai Shimbun, April 9, 2002).
We will show the macroeconomic effects of national highway Route 5 on the
economy of northern Vietnam based on the data of growth rates of foreign direct
investment from 2000, before completion of national highway Route 5, to 2004 after its
completion. The data of Hanoi and Haiphong in northern Vietnam, Danang in central
Vietnam, and Hochiminh in southern Vietnam are shown in Table 2, telling us that the

39
growth rates in northern Vietnam are higher than the central and southern averages and
that national highway Route 5 had the positive effects on Hanoi and Haiphong in 2002
as follows. The growth rate in North is high at 19.2% while the growth rates in Center
and South are low at 6.9 % and 3.7 %, respectively. The growth of Hanoi began to
diffuse over northern Vietnam.
(4) The bottlenecks of the industrial cluster policy in northern Vietnam
In 2008, we examined the second option and raise the following 12 questions to
find the bottlenecks of the industrial cluster policy: 1. Do industrial zones exist
sufficiently? : In terms of capacity building: 2. Is the transport infrastructure sufficient?:
3. Does the electricity infrastructure exist?: 4. Does the communication infrastructure
exist?: 5. Does the port infrastructure exist?: 6. Do institutions exist?: On human
resource: 7. Does unskilled labor exist?: 8. Is skilled labor sufficient?: On living
conditions: 9. Are there sufficient hospitals?: 10. Are there sufficient schools?: 11. Are
there sufficient entertainment venues?: 12. Are there incidences of theft in the area?
We carried out a survey on the industrial cluster policy of Northern Vietnam to
determine whether we can solve its problems using our flowchart approach. We
interviewed 10 professionals. The 10 respondents included six staff of companies in
Hanoi, three staff of Japanese semi-government organizations in Hanoi, and one
Japanese professor studying the Vietnamese economy. The six results are summarized
in Table 3.

40
Table 3. Questionnaires on industrial cluster policy: Hanoi
1 2 3 4 5 6 7 8 9 10 Results Problems
1. Do industrial zones exist
sufficiently? O O O O O O O O O O 10
Capacity building: Physical
infrastructure
2. Does transport infrastructure exist
sufficiently? X X X X X X X X X X 0 X
3. Does electricity infrastructure exist
sufficiently? X X X X X X X O O O 3 X
4. Does communication infrastructure
exist sufficiently? O O O O O O O X O X 8
5. Does port infrastructure exist
sufficiently? X X O O X X X X X X 2 X
6. Do institutions exist sufficiently? X X X X X X X X X X 0 X
Human resources
7. Does unskilled labor exist
sufficiently? X X X X X X X X X X 0 X
8. Does skilled labor exist
sufficiently? X X O O O O O O O O 8
Living conditions
9. Do hospitals exist sufficiently? O O X X O O X O O X 6
10. Do schools exist sufficiently? O O O O O O O O O O 10
11. Do entertainments exist
sufficiently? O O X X X X X O O O 5 X
12. Do thefts happen? X X X X X O O O O O 5 X
Source: A. Kuchiki and T. Gokan (interviews in Hanoi on Aug. 28-30, 2008)
On the issue of industrial zones, no respondent answered “Yes.” Our survey

41
confirmed that roads, electricity and ports are insufficient in their support of industrial
clusters. Specifically, on the question surrounding highway roads meant for
automobiles, all 10 respondents answered “No.” Such refers in particular to the roads
in these areas: (i) Hanoi – Haiphong; (ii) Hanoi – southern China; and (iii) Hanoi –
Noibai Airport. Seven out of 10 gave a “No” reply regarding the sufficiency of the
electricity supply. Three who belonged to firms located in Thanglong Industrial Park,
answered “No”. They had no problem regarding electricity supply since their
companies were given priority for such.
In terms of communication, two of the 10 respondents answered “No”. That is,
the connectivity of the email system in Vietnam sometimes encountered issues.
On the issue of ports, eight respondents answered “No”. The other two also
answered “No” but were unaware of problems at the ports since they often availed of
the services of logistics companies in the delivery of their materials and products, and
therefore did not directly use ports. In sum, these mean that all respondents
highlighted the problem with the ports. Haiphong Port in Northern Vietnam is a river
port and has a shallow depth of 5-7 meters. Cailan Port is located in Halong Bay and
an alternative to Haiphong Port. However, one of the concerns here is that the
development of Cailan Port would harm Halong Bay, which is a world heritage.
Therefore, it has become necessary to expand the facility of Haiphong Port. Currently,
cargoes at the port are loaded into a small ship, sent to the Hong Kong Port, and loaded
into a large ship again.
Meanwhile, when it comes to institutions, all respondents answered “No” as well.
Of all the 12 questions, this is where the problem was found to be most serious. In
particular, it is in customs clearance where there are four grave issues. First, every

42
document passing through customs clearance needs to be translated into the Vietnamese
language. Second, every document should be original. Third, companies should put
their stamps on their documents. Fourth, every document needs the signatures of
companies. In short, having these original documents pass on from one place to
another in Northern Vietnam for the required stamps and signatures carry with them
certain costs.
Transporting cargos from Hanoi to the border of southern China also faces three
problems. First, working hours at the customs clearance office at the border is short.
Operating hours at the Vietnam-China border of 8:00 A.M. to 5:00 P.M. differs from the
usual working hours of 9:00 A.M. to 4:00 P.M. Also, because the time difference
between Vietnam and China is one hour, actual operation hours at the border total six
hours only. Thus, trucks would be required to spend one night at the border whenever
they fail to reach the border during the given operating hours. Each night spent
presents a cost.
Second, costs add up whenever container cargos have to be trans-shipped (That is,
whenever cargos are unloaded from one truck in Hanoi and loaded to another truck at
the Chinese border). Other problems related to transshipment of container cargos
include theft, damage to goods, and the usual delay. Given that a truck consists of its
cab and container parts, transportation costs could be reduced if the container part
would be allowed to pass beyond the Vietnam and China border.
Third, the road situation is in a sorry state. First, there are a lot of fatal traffic
accidents on the Vietnamese highways since these are not exclusive to automobiles only.
That is, bicycles and motorcycles are allowed on the highways. Also, the speed of
trucks on the Vietnamese highways is slower compared with those in Thailand and Lao

43
due to the former’s road conditions. For instance, according to one respondent at the
Thanglong Industrial Park, the speed in Vietnam is 30 kilometer per hour while that in
Thailand is 50 kilometer per hour.
Meanwhile, implementing rules at the customs clearance office in Vietnam are
not transparent. Rules allegedly change so often and implemented in a discretionary
manner.
All 10 respondents also gave a “No” reply to the question on unskilled labor,
partly because illegal strikes occurred in many firms in 2008. Firms have been obliged
to establish labor unions starting 2008. Also, the power to designate the labor union
president has been transferred from the company boards to the labor unions themselves
starting 2009. It is therefore understandable why corporate boards now feel uneasy
regarding the future of labor unions.
The unskilled labor market in Hanoi has contracted. For example, when firm A
began hiring in 2007 and 2008, the number of its applicants at the Thanglong Industrial
Park dropped to 170 in 2008 from 700 in 2007. In the past, this firm employed its
workers around the Hanoi area but was increasingly forced to consider those from the
mountainous areas far from Hanoi. Later, the firm had to construct an apartment for
the workers to live in. The share of workers from Hanoi dropped from 70 percent to
30 percent. Meanwhile, the share of workers from the mountain areas rose to 10
percent by 2008.
On the other hand, two of the 10 respondents answered “No” on the issue of
skilled labor. Like in most Asian countries, the phenomenon called job hopping is
common. One respondent pointed out that it is difficult to find Vietnamese applicants
who can speak Japanese, and that Japanese firms should employ Vietnamese who can

44
speak English instead. There is also a shortage of Vietnamese who can speak the
Chinese and Korean languages.
On the issue of living conditions, most respondents answered ”Yes”, although
four replied ”No” on the question specific to hospitals. Respondents usually opt to go
to hospitals in Bangkok or Singapore for serious illnesses rather than to a Hanoi-based
one. In addition, a few firms periodically bring in food from Japan as a precaution
against bird influenza in Vietnam.
On the question on entertainment, some respondents answered “No”. They
could not enjoy Saturdays and Sundays due to the shortage of entertainment facilities
such as shopping centers and movies.
Five respondents pointed out that theft of raw materials such as copper coils
happens since some workers have not yet imbibed the values these companies espouse.
It takes time before workers begin to change their values.
In sum, the issues critical to the improvement of Vietnam’s investment
environment in 2008 are those on highways, electricity, ports, customs clearance, and
unskilled labor.
(5) Recommendations on the industrial cluster policy of Northern Vietnam
according to the flowchart approach
Recommendations regarding the industrial cluster policy in Northern Vietnam are
shown in Figure 12. Northern Vietnam needs the infrastructure that will facilitate its
next-stage growth since it has reached around $900 per capita income in 2008. First, the
new route 5 highway specific to cars between Hanoi and Haiphong is needed. Second,
there is also a need for a highway between Hanoi and Southern China. Such should be
of the same level as China’s three-lane highway each way. Third, a highway between

45
Noibai Airport and the center of Hanoi is needed. Vietnam would benefit from a
highway that links Noibai Airport to Hoalac Hitech Park, and Hoalac Hitech Park and
the center of Hanoi. The three lanes-per way highways will contribute to economic
growth and reduce the number of traffic accidents.

46
Figure 12. Northern Vietnam's Flowchart Flowchart Prescriptions
Roads → ①.Highway 5 for Automobiles
↓Yes No ②.Highway to link Hanoi and southern
China
③.Highway to link Noibai Airport and
the center of Hanoi
↙Return
Electricity → Increase of power supply → Build-Operation-Transfer, Official
Development Assistance
↓Yes No
↙Return
Ports → Upgrade of Haiphong Port
↓Yes No
↙Return
Institutions → Customs clearance → ①.The simplification of paper
procedures
↓Yes No ②.The simplification of exchange in
container trucks at the border
↙Return
Unskilled
labor → Employment of labor from rural area → The end of this flowchart
↓Yes No No

47
↙Return
Entertainments → Facilitation of entertainments → Private companies
↓Yes No
↙Return
Thefts → Ethical education
Source: Author.
Meanwhile, there would be electricity supply issues in Hanoi even if Northern
Vietnam imports electricity from China. Such industry needs to be developed by the
private sector through a build-operate-transfer scheme or official development
assistance.
Cairan Port should be expanded and Haiphong Port should be further improved.
Customs clearance procedures should be more transparent and simplified. For
example, the format of customs clearance should be straightforward by omitting
signatures and stamps. Transshipment rules should be amended. Rules should allow
containers to travel from points of origin to destination instead of having to unload
contents at borders and transfer these into another truck.
Unskilled labor should be sourced from all over the country, including local
villages. Thus, apartments for the unskilled labor have to be constructed. Their
employment will help reduce the income gap of residents living between Hanoi and
mountain areas. Meanwhile, the problem of theft takes time to eradicate as this
requires educating people on moral ethics.
Guangzhou is losing its competitiveness in the labor-intensive industries and has
been moving toward the innovative process stage of Step II in our flowchart approach.

48
On the other hand, the per-capita income in Northern Vietnam has reached almost
$1000 and is therefore moving toward its turning point; therefore, it should be preparing
by upgrading its infrastructure such as loads, ports, and electricity. Hanoi and
Guangzhou benefit each other by constructing a highway between Hanoi and Youyi
Xian in Southern China and simplifying customs clearance procedures. The reduction
of a tariff rate from China to Vietnam will be effective in linking the two cities since the
tariff rate is 5 percent higher than that from Vietnam to China.
Regarding the industrial cluster policy, we can refer to the Asian experiences.
Official Development Aid functioned effectively to develop the economy in northern
Vietnam. The rehabilitation of Haiphong Port, the construction of highway route 5,
and the deregulation of investment procedures of ODA contributed to industrial cluster
policy in northern Vietnam.
6. Application of the flowchart approach to cities in Africa and its conclusions
This section proposes policy recommendations to form industrial clusters in
Africa by applying the flowchart approach to cities in Africa based on the lessons from
the Asian experiences of industrial cluster policy. Kuchiki (2009) introduced an
interview method and an investment environment survey method to find the bottlenecks
of industrial cluster policy.
The contribution of this paper is as follows. First, we reclassified industrial
clusters based on Markusen (1996) and Iammarino and McCann (2006). Second, we
proposed the analysis method of the flowchart approach that can explain an Asian
growth model since the 1980s. Third, we applied our flowchart approach to cities in
Africa and proposed their policy measures to form industrial clusters.

49
Unbalanced growth is needed to get away from the vicious cycle of poverty. The
growing industry may belong to an industry with high backward linkages.
International trade and investment has been liberalized since the 1980s. While
Hirschman (1958) recommended fostering the domestic industry by protecting domestic
firms before the 1980s, we should introduce his unbalanced growth strategy under the
liberalization of international trade and investment after the 1980s. One of the
strategies can be industrial cluster policy.
Regarding the industrial cluster policy, we can refer to the Asian experiences.
Official Development Aid for northern Vietnam functioned effectively to develop its
economy. The ODA contributed to the rehabilitation of Haiphong Port, the
construction of highway route 5, and the deregulation of investment procedures that
were effective in the industrial cluster policy in northern Vietnam. The flowchart
approach derives the ordering of policy measures to foster an industrial cluster and
makes clear the bottlenecks of the industrial cluster policy. Capacity should be built to
invite an anchor firm with high backward linkages.
The policies recommended by the flowchart approach are as follows: First, an
export processing zone is needed to invite multinational firms as anchor firms since
domestic markets in Africa are small; On capacity building, primary education should
be strengthened; Second, incentives for anchor firms, such as cheap land prices, the
construction of roads and railways for the firm, and the establishment of international
hospitals and schools, are effective in inviting them to the export processing zone; Third,
the flowchart approach makes clear who are actors in forming an industrial cluster.
We have the two methods that can be applied to cities in Africa and finds the
players and priorities of policy measures in implementing industrial cluster policy.
50
The methods are an interview method and an investment environment survey method.
The candidates of anchor firms for Maputo in Mozambique will be illustrated as
the following three types of actors. First, African cities must find multinational as
anchor firms with high backward linkages. An automobile is composed of more than
20,000 parts and components. An ink-jet printer in the electronics industry is
composed of around 800 parts and components. Second, a Japanese trading
corporation establishes an export processing zone and introduces its tenants to the zone.
We illustrate the following incentives for anchor firms in the case of Asian export
processing zones. They are favorable preferential land prices to anchor firms,
exemption or reduction of taxes, transportation facilities specific for the firms, and the
establishment of international hospitals and schools. Lock-in effects function since the
tenants are difficult to close its factory once an anchor firm establishes a company.
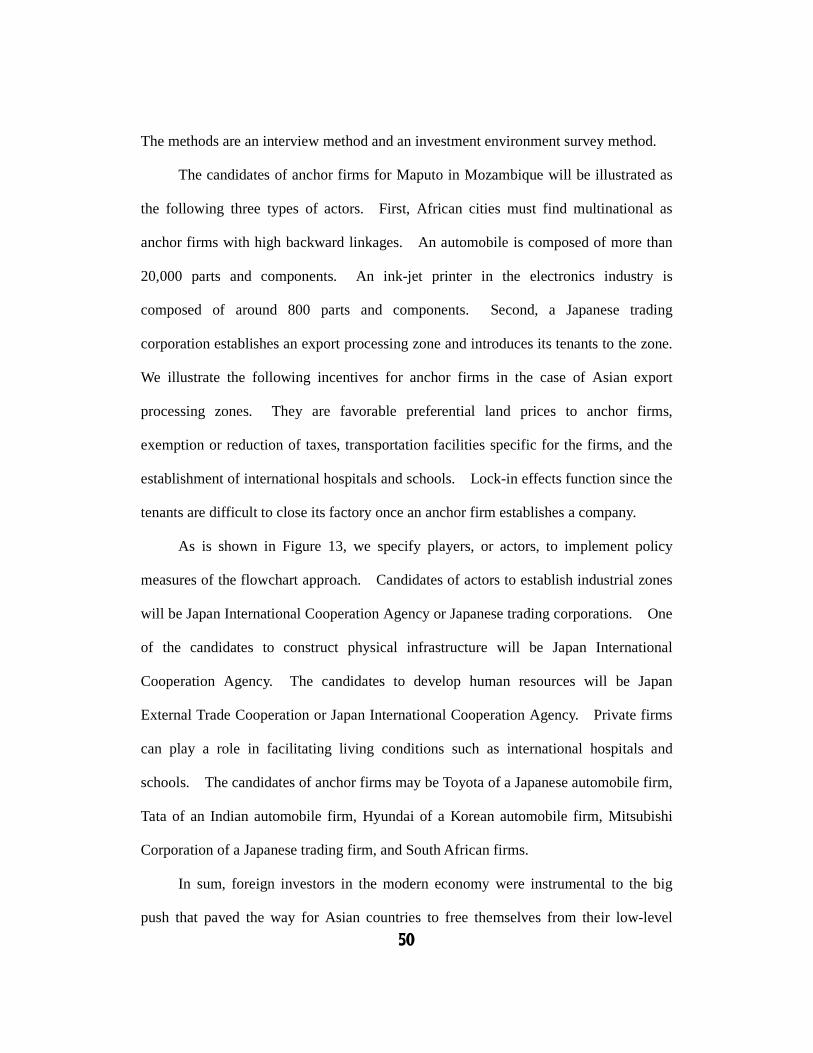
As is shown in Figure 13, we specify players, or actors, to implement policy
measures of the flowchart approach. Candidates of actors to establish industrial zones
will be Japan International Cooperation Agency or Japanese trading corporations. One
of the candidates to construct physical infrastructure will be Japan International
Cooperation Agency. The candidates to develop human resources will be Japan
External Trade Cooperation or Japan International Cooperation Agency. Private firms
can play a role in facilitating living conditions such as international hospitals and
schools. The candidates of anchor firms may be Toyota of a Japanese automobile firm,
Tata of an Indian automobile firm, Hyundai of a Korean automobile firm, Mitsubishi
Corporation of a Japanese trading firm, and South African firms.
In sum, foreign investors in the modern economy were instrumental to the big
push that paved the way for Asian countries to free themselves from their low-level

51
equilibrium trap after the 1980s. That is, the idea of industrial clusters was tapped to
make foreign investors agglomerate in industrial zones in the Asian economies.
Figure 13. Policy Recommendations: Find Actors
Flowchart Candidates of ActorsActorsActorsActors
Industrial zone
JICA, Trading corporations
Capacity building
Infrastructure
JICA, AfDB, World Bank
Human resource
JETRO, JICA
Living conditions
Trading corporations
Anchor firmsAnchor firmsAnchor firmsAnchor firms
Mitsubishi Corporation

52
Tata, Hyundai, Toyota
South African
firms
Source: Author.
REFERENCES
Department of Statistics (2004), Statistical Yearbook of Vietnam.
Domar, E.D. (1946), ‘Expansion and Employment’, Econometrica, Vol.14, April,
pp.137-47.
Harrod, R.F. (1936), The Trade Cycles, London: MacMillan.
Hershberg, E., K. Nabeshima, and S. Yusuf (2007), “Opening the Ivory Tower to
Business: University-Industry Linkages and the Development of Knowledge-Intensive
Clusters in Asian Cities, World Development, Vol. 35, No. 6, pp. 931-940.
Hirschman, A. O. (1958), The Strategy of Economic Development, New Haven: Yale
University Press.
Iammarino, S. and P. McCann (2006), “The Structure and Evolution of Industrial
Clusters: Transactions, Technology and Knowledge Spillovers,” Research Policy, Vol.
35, pp. 1018-1036.
Japan Bank for International Cooperation (2001), Survey on Promotion of Effectiveness
in Official Development Assistance to Vietnam (in Japanese).
Jorgenson, D. W. (1961), “The Development of a Dual Economy,” The Economic
Journal, 71, June, 309-34.
Kuchiki, A. (2007), “Agglomeration of Exporting Firms in Industrial Zones in Northern
Vietnam: Players and Institutions,” Chapter 5, Industrial Agglomeration and New
Technologies: a Global Perspective, M. Tsuji, E. Giovannetti, and M. Kagami eds.,
Cheltenham: Edward Elgar, pp.97-138.
Kuchiki, A. and M. Tsuji eds. (2008), The Flowchart Approach to Industrial Cluster
Policy, New York: Palgrave Macmillan. Kuchiki, A. (2009), “Patterns of the Flowchart Approach to Industrial Cluster Policy: its
Feedback Processes of Hanoi and Guangzhou”, A. Kuchiki and M. Tsuji eds., The
Formation of Industrial Clusters in Asia and Regional Integration, IDE-JETRO.
Leibenstein, H. (1957), Economic Backwardness and Economic Growth, New York:
John Wiley & Sons.
Lewis, W. A. (1954), “Economic Development with Unlimited Supplies of Labor,” The

53
Manchester School of Economics and Social Sciences, 22, May, 139-91.
Markusen, A. (1996), “Sticky Places in Slippery Space: A Typology of Industrial
Districts, “ Economic Geography, Vol. 72, pp. 293-313.
Nelson, R. R. (1956), “A Theory of the Low-level Equilibrium Trap in Underdeveloped
Economies,” The American Economic Review, 46(5), 894-908.
Nurkse, R. (1953), Problems of Capital Formation in Underdeveloped Countries,
Oxford: Basil Blackwell.
Ranis, G. and J. C. H. Fei (1961), “A Theory of Economic Development,” The American
Economic Review, 51(4), 533-65.
Romer, P.M. (1986), ‘Increasing Returns and Long-run Growth’, Journal of Political
Economy, Vol.95, No.5, 1002-1037.
Rosenstein-Rodan, P. N. (1943), “Problems of Industrialization of Eastern and
Southeastern Europe,” The Economic Journal, 53, 210/211, 202-11.
Rostow, W. W. (1960), The Stages of Economic Growth, Cambridge: Cambridge
University Press.
Solow, R.M. (1956), ‘A Contribution to the Theory of Economic Growth’, Quarterly
Journal of Economics, Vol. 70, February, pp. 65-94.
Tran, T. V., A. Kuchiki, F. Idei, and S. Sakata (2003), ‘On a Project of Traffic
Infrastructure in northern Vietnam,’ Impact Evaluation of Japan Bank for International
Cooperation.
Wong, P.K. (2009), “Industrial Cluster Development and Innovation in Singapore” in
From Agglomeration to Innovation, A. Kuchiki and M. Tsuji eds., New York: Palgrave
Macmillan, (Forthcoming).
Yokoyama, H. (1997), “Development Strategy,” in Chapter 10, eds. A. Kuchiki, H.
Nogami, and T. Yamagata, Development Economics, Tokyo: Yuhikaku.