Lesson 5: Graphs of Functions and Equations - EngageNY · Lesson 5: Graphs of Functions and...
17
NYS COMMON CORE MATHEMATICS CURRICULUM 8•5 Lesson 5 Lesson 5: Graphs of Functions and Equations Date: 11/19/14 59 © 2014 Common Core, Inc. Some rights reserved. commoncore.org This work is licensed under a Creative Commons Attribution-NonCommercial-ShareAlike 3.0 Unported License. Lesson 5: Graphs of Functions and Equations Student Outcomes Students know that the definition of a graph of a function is the set of ordered pairs consisting of an input and the corresponding output. Students understand why the graph of a function is identical to the graph of a certain equation. Classwork Exploratory Challenge/Exercises 1–3 (15 minutes) Students work independently or in pairs to complete Exercises 1–3. Exercises 1–3 1. The distance that Giselle can run is a function of the amount of time she spends running. Giselle runs miles in minutes. Assume she runs at a constant rate. a. Write an equation in two variables that represents her distance run, , as a function of the time, , she spends running. = = b. Use the equation you wrote in part (a) to determine how many miles Giselle can run in minutes. = () = Giselle can run miles in minutes. c. Use the equation you wrote in part (a) to determine how many miles Giselle can run in minutes. = () = Giselle can run miles in minutes. d. Use the equation you wrote in part (a) to determine how many miles Giselle can run in minutes. = () = Giselle can run mile in minutes.
Transcript of Lesson 5: Graphs of Functions and Equations - EngageNY · Lesson 5: Graphs of Functions and...
NYS COMMON CORE MATHEMATICS CURRICULUM 8•5 Lesson 5
Lesson 5: Graphs of Functions and Equations Date: 11/19/14
59
© 2014 Common Core, Inc. Some rights reserved. commoncore.org This work is licensed under a Creative Commons Attribution-NonCommercial-ShareAlike 3.0 Unported License.
Lesson 5: Graphs of Functions and Equations
Student Outcomes
Students know that the definition of a graph of a function is the set of ordered pairs consisting of an input and
the corresponding output.
Students understand why the graph of a function is identical to the graph of a certain equation.
Classwork
Exploratory Challenge/Exercises 1–3 (15 minutes)
Students work independently or in pairs to complete Exercises 1–3.
Exercises 1–3
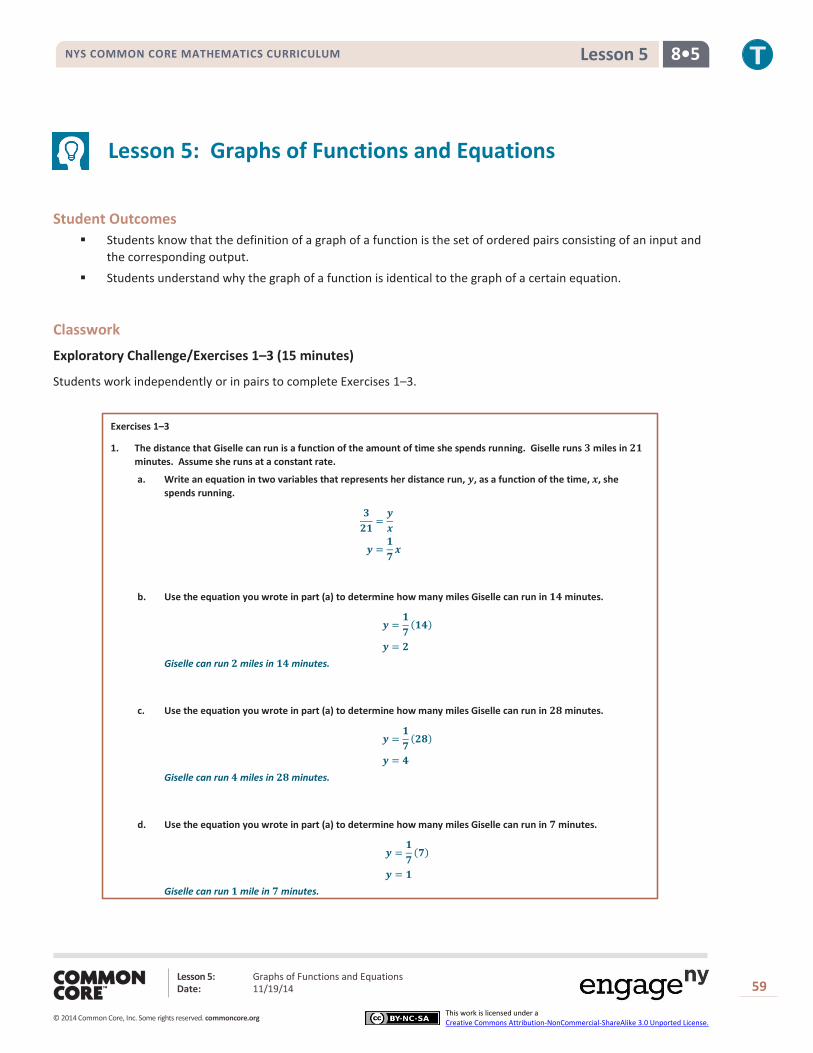
1. The distance that Giselle can run is a function of the amount of time she spends running. Giselle runs 𝟑 miles in 𝟐𝟏
minutes. Assume she runs at a constant rate.
a. Write an equation in two variables that represents her distance run, 𝒚, as a function of the time, 𝒙, she
spends running.
𝟑
𝟐𝟏=
𝒚
𝒙
𝒚 =𝟏
𝟕𝒙
b. Use the equation you wrote in part (a) to determine how many miles Giselle can run in 𝟏𝟒 minutes.
𝒚 =𝟏
𝟕(𝟏𝟒)
𝒚 = 𝟐
Giselle can run 𝟐 miles in 𝟏𝟒 minutes.
c. Use the equation you wrote in part (a) to determine how many miles Giselle can run in 𝟐𝟖 minutes.
𝒚 =𝟏
𝟕(𝟐𝟖)
𝒚 = 𝟒
Giselle can run 𝟒 miles in 𝟐𝟖 minutes.
d. Use the equation you wrote in part (a) to determine how many miles Giselle can run in 𝟕 minutes.
𝒚 =𝟏
𝟕(𝟕)
𝒚 = 𝟏
Giselle can run 𝟏 mile in 𝟕 minutes.
NYS COMMON CORE MATHEMATICS CURRICULUM 8•5 Lesson 5
Lesson 5: Graphs of Functions and Equations Date: 11/19/14
60
© 2014 Common Core, Inc. Some rights reserved. commoncore.org This work is licensed under a Creative Commons Attribution-NonCommercial-ShareAlike 3.0 Unported License.
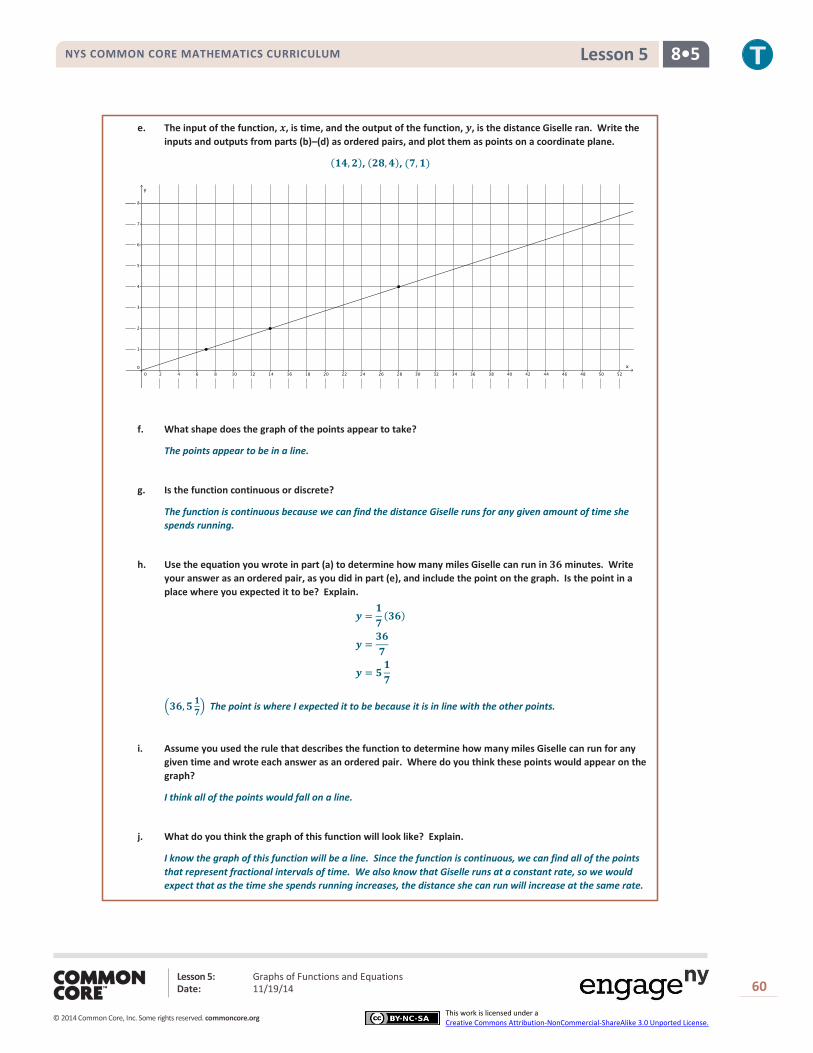
e. The input of the function, 𝒙, is time, and the output of the function, 𝒚, is the distance Giselle ran. Write the
inputs and outputs from parts (b)–(d) as ordered pairs, and plot them as points on a coordinate plane.
(𝟏𝟒, 𝟐), (𝟐𝟖, 𝟒), (𝟕, 𝟏)
f. What shape does the graph of the points appear to take?
The points appear to be in a line.
g. Is the function continuous or discrete?
The function is continuous because we can find the distance Giselle runs for any given amount of time she
spends running.
h. Use the equation you wrote in part (a) to determine how many miles Giselle can run in 𝟑𝟔 minutes. Write
your answer as an ordered pair, as you did in part (e), and include the point on the graph. Is the point in a
place where you expected it to be? Explain.
𝒚 =𝟏
𝟕(𝟑𝟔)
𝒚 =𝟑𝟔
𝟕
𝒚 = 𝟓𝟏
𝟕
(𝟑𝟔, 𝟓𝟏
𝟕) The point is where I expected it to be because it is in line with the other points.
i. Assume you used the rule that describes the function to determine how many miles Giselle can run for any
given time and wrote each answer as an ordered pair. Where do you think these points would appear on the
graph?
I think all of the points would fall on a line.
j. What do you think the graph of this function will look like? Explain.
I know the graph of this function will be a line. Since the function is continuous, we can find all of the points
that represent fractional intervals of time. We also know that Giselle runs at a constant rate, so we would
expect that as the time she spends running increases, the distance she can run will increase at the same rate.
NYS COMMON CORE MATHEMATICS CURRICULUM 8•5 Lesson 5
Lesson 5: Graphs of Functions and Equations Date: 11/19/14
61
© 2014 Common Core, Inc. Some rights reserved. commoncore.org This work is licensed under a Creative Commons Attribution-NonCommercial-ShareAlike 3.0 Unported License.
k. Connect the points you have graphed to make a line. Select a point on the graph that has integer
coordinates. Verify that this point has an output that the function would assign to the input.
Answers will vary. Sample student work:
The point (𝟒𝟐, 𝟔) is a point on the graph.
𝒚 =𝟏
𝟕𝒙
𝟔 =𝟏
𝟕(𝟒𝟐)
𝟔 = 𝟔
The function assigns the output of 𝟔 to the input of 𝟒𝟐.
l. Sketch the graph of the equation 𝒚 =𝟏𝟕
𝒙 using the same coordinate plane in part (e). What do you notice
about the graph of the function that describes Giselle’s constant rate of running and the graph of the
equation 𝒚 =𝟏𝟕
𝒙?
The graphs of the equation and the function coincide completely.
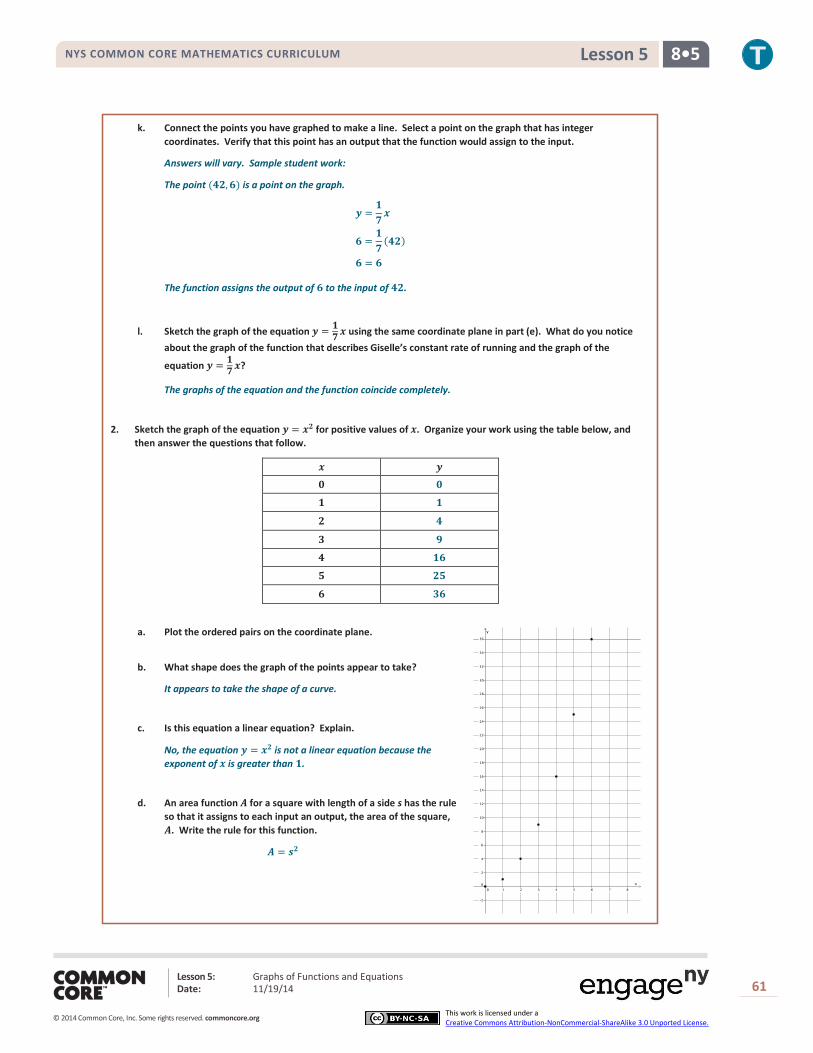
2. Sketch the graph of the equation 𝒚 = 𝒙𝟐 for positive values of 𝒙. Organize your work using the table below, and
then answer the questions that follow.
𝒙 𝒚
𝟎 𝟎
𝟏 𝟏
𝟐 𝟒
𝟑 𝟗
𝟒 𝟏𝟔
𝟓 𝟐𝟓
𝟔 𝟑𝟔
a. Plot the ordered pairs on the coordinate plane.
b. What shape does the graph of the points appear to take?
It appears to take the shape of a curve.
c. Is this equation a linear equation? Explain.
No, the equation 𝒚 = 𝒙𝟐 is not a linear equation because the
exponent of 𝒙 is greater than 𝟏.
d. An area function 𝑨 for a square with length of a side s has the rule
so that it assigns to each input an output, the area of the square,
𝑨. Write the rule for this function.
𝑨 = 𝒔𝟐
NYS COMMON CORE MATHEMATICS CURRICULUM 8•5 Lesson 5
Lesson 5: Graphs of Functions and Equations Date: 11/19/14
62
© 2014 Common Core, Inc. Some rights reserved. commoncore.org This work is licensed under a Creative Commons Attribution-NonCommercial-ShareAlike 3.0 Unported License.
e. What do you think the graph of this function will look like? Explain.
I think the graph of this function will look like the graph of the equation 𝒚 = 𝒙𝟐. The inputs and outputs
would match the solutions to the equation exactly. For the equation, the 𝒚 value is the square of the 𝒙 value.
For the function, the output is the square of the input.
f. Use the function you wrote in part (d) to determine the area of a square with side length 𝟐. 𝟓. Write the
input and output as an ordered pair. Does this point appear to belong to the graph of 𝒚 = 𝒙𝟐?
𝑨 = (𝟐. 𝟓)𝟐
𝑨 = 𝟔. 𝟐𝟓
(𝟐. 𝟓, 𝟔. 𝟐𝟓) The point looks like it would belong to the graph of 𝒚 = 𝒙𝟐; it looks like it would be on the curve
that the shape of the graph is taking.
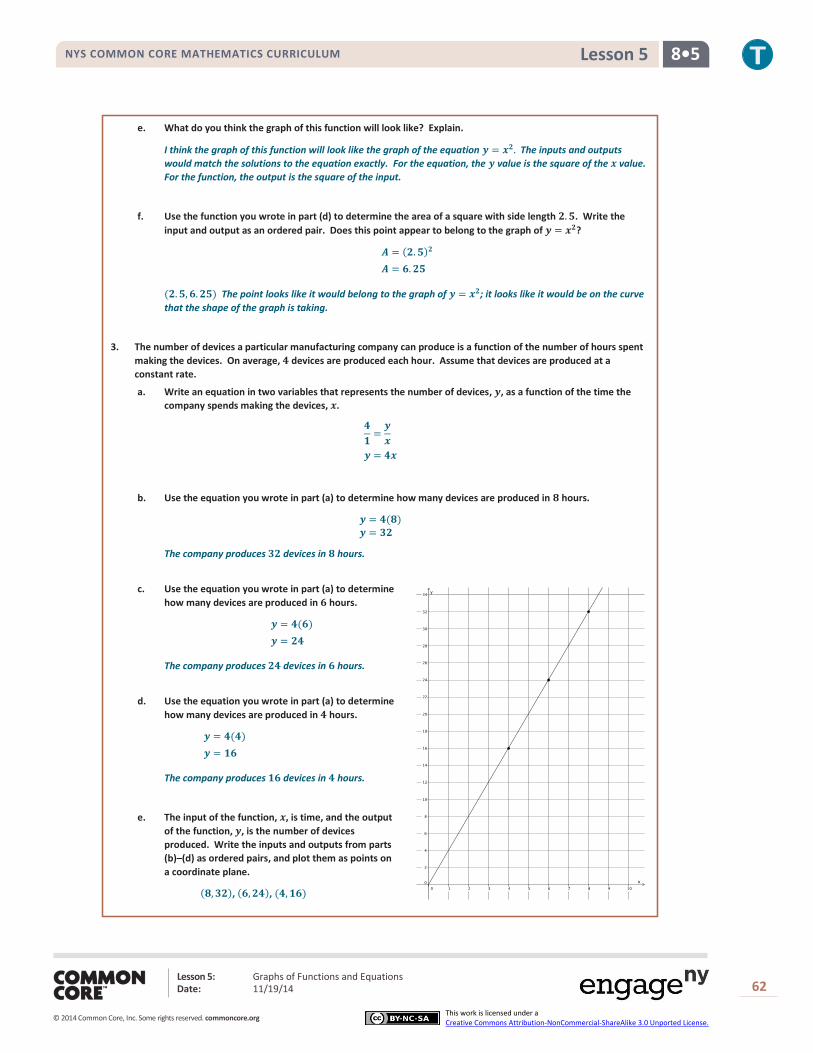
3. The number of devices a particular manufacturing company can produce is a function of the number of hours spent
making the devices. On average, 𝟒 devices are produced each hour. Assume that devices are produced at a
constant rate.
a. Write an equation in two variables that represents the number of devices, 𝒚, as a function of the time the
company spends making the devices, 𝒙.
𝟒
𝟏=
𝒚
𝒙
𝒚 = 𝟒𝒙
b. Use the equation you wrote in part (a) to determine how many devices are produced in 𝟖 hours.
𝒚 = 𝟒(𝟖) 𝒚 = 𝟑𝟐
The company produces 𝟑𝟐 devices in 𝟖 hours.
c. Use the equation you wrote in part (a) to determine
how many devices are produced in 𝟔 hours.
𝒚 = 𝟒(𝟔)
𝒚 = 𝟐𝟒
The company produces 𝟐𝟒 devices in 𝟔 hours.
d. Use the equation you wrote in part (a) to determine
how many devices are produced in 𝟒 hours.
𝒚 = 𝟒(𝟒)
𝒚 = 𝟏𝟔
The company produces 𝟏𝟔 devices in 𝟒 hours.
e. The input of the function, 𝒙, is time, and the output
of the function, 𝒚, is the number of devices
produced. Write the inputs and outputs from parts
(b)–(d) as ordered pairs, and plot them as points on
a coordinate plane.
(𝟖, 𝟑𝟐), (𝟔, 𝟐𝟒), (𝟒, 𝟏𝟔)
NYS COMMON CORE MATHEMATICS CURRICULUM 8•5 Lesson 5
Lesson 5: Graphs of Functions and Equations Date: 11/19/14
63
© 2014 Common Core, Inc. Some rights reserved. commoncore.org This work is licensed under a Creative Commons Attribution-NonCommercial-ShareAlike 3.0 Unported License.
f. What shape does the graph of the points appear to take?
The points appear to be in a line.
g. Is the function continuous or discrete?
The function is continuous because we can find the number of devices produced for any given time, including
fractions of an hour.
h. Use the equation you wrote in part (a) to determine how many devices are produced in 𝟏. 𝟓 hours. Write
your answer as an ordered pair, as you did in part (e), and include the point on the graph. Is the point in a
place where you expected it to be? Explain.
𝒚 = 𝟒(𝟏. 𝟓)
𝒚 = 𝟔
(𝟏. 𝟓, 𝟔) The point is where I expected it to be because it is in line with the other points.
i. Assume you used the rule that describes the function to determine how many devices are produced for any
given time and wrote each answer as an ordered pair. Where do you think these points would appear on the
graph?
I think all of the points would fall on a line.
j. What do you think the graph of this function will look like? Explain.
I think the graph of this function will be a line. Since the rate is continuous, we can find all of the points that
represent fractional intervals of time. We also know that devices are produced at a constant rate, so we
would expect that as the time spent producing devices increases, the number of devices produced would
increase at the same rate.
k. Connect the points you have graphed to make a line. Select a point on the graph that has integer
coordinates. Verify that this point has an output that the function would assign to the input.
Answers will vary. Sample student work:
The point (𝟓, 𝟐𝟎) is a point on the graph.
𝒚 = 𝟒𝒙
𝟐𝟎 = 𝟒(𝟓)
𝟐𝟎 = 𝟐𝟎
The function assigns the output of 𝟐𝟎 to the input of 𝟓.
l. Sketch the graph of the equation 𝒚 = 𝟒𝒙 using the same coordinate plane in part (e). What do you notice
about the graph of the function that describes the company’s constant rate of producing devices and the
graph of the equation 𝒚 = 𝟒𝒙?
The graphs of the equation and the function coincide completely.
NYS COMMON CORE MATHEMATICS CURRICULUM 8•5 Lesson 5
Lesson 5: Graphs of Functions and Equations Date: 11/19/14
64
© 2014 Common Core, Inc. Some rights reserved. commoncore.org This work is licensed under a Creative Commons Attribution-NonCommercial-ShareAlike 3.0 Unported License.
Discussion (10 minutes)
What was the rule that described the function in Exercise 1?
The rule was 𝑦 =1
7𝑥.
Given an input, how did you determine the output that the function would assign?
We used the rule. In place of 𝑥, we put the input. The number that was computed was the output.
When you wrote your inputs and corresponding outputs as ordered pairs, what you were doing can be
described generally by the ordered pair (𝑥,1
7𝑥).
Give students a moment to make sense of the ordered pair and verify that it matches their work in Exercise 1. Then
continue with the discussion.
When we first began graphing linear equations in two variables, we used a table and picked a value for 𝑥 and
then used that 𝑥 to compute the value of 𝑦. For an equation of the form 𝑦 =1
7𝑥, the ordered pairs that
represent solutions to the equation can be described generally by (𝑥,1
7𝑥).
How does the ordered pair from the function compare to the ordered pair of the equation?
The ordered pairs of the function and the equation are exactly the same.
What does that mean about the graph of a function compared to the graph of an equation?
It means the graph of a function will be the same as the graph of the equation.
Can we make similar conclusions about Exercise 2?
Give students time to verify that the conclusions about Exercise 2 are the same as the conclusions about Exercise 1.
Then continue with the discussion.
What ordered pair generally describes the inputs and corresponding outputs of Exercise 2?
(𝑥, 4𝑥)
What ordered pair generally describes the 𝑥 and 𝑦 values of the equation 𝑦 = 4𝑥?
(𝑥, 4𝑥)
What does that mean about the graph of the function and the graph of the equation?
It means that the graph of the function is the same as the graph of the equation.
For Exercise 3, you began by graphing the equation 𝑦 = 𝑥2 for positive values of 𝑥. What was the shape of the
graph?
It looked curved.
The graph had a curve in it because it was not the graph of a linear equation. All linear equations graph as
lines. That is what we learned in Module 4. Since this equation was not linear, we should expect it to graph as
something other than a line.
What did you notice about the ordered pairs of the equation 𝑦 = 𝑥2 and the inputs and corresponding outputs
for the function 𝐴 = 𝑠2?
The ordered pairs were exactly the same for the equation and the function.
What does that mean about the graphs of functions, even those that are not linear?
It means that the graph of a function will be identical to the graph of an equation.
MP.6
NYS COMMON CORE MATHEMATICS CURRICULUM 8•5 Lesson 5
Lesson 5: Graphs of Functions and Equations Date: 11/19/14
65
© 2014 Common Core, Inc. Some rights reserved. commoncore.org This work is licensed under a Creative Commons Attribution-NonCommercial-ShareAlike 3.0 Unported License.
Now we know that we can graph linear and nonlinear functions by writing their inputs and corresponding
outputs as ordered pairs. The graphs of functions will be the same as the graphs of the equations that
describe them.
Exploratory Challenge/Exercise 4 (7 minutes)
Students work in pairs to complete Exercise 4.
Exploratory Challenge/Exercise 4
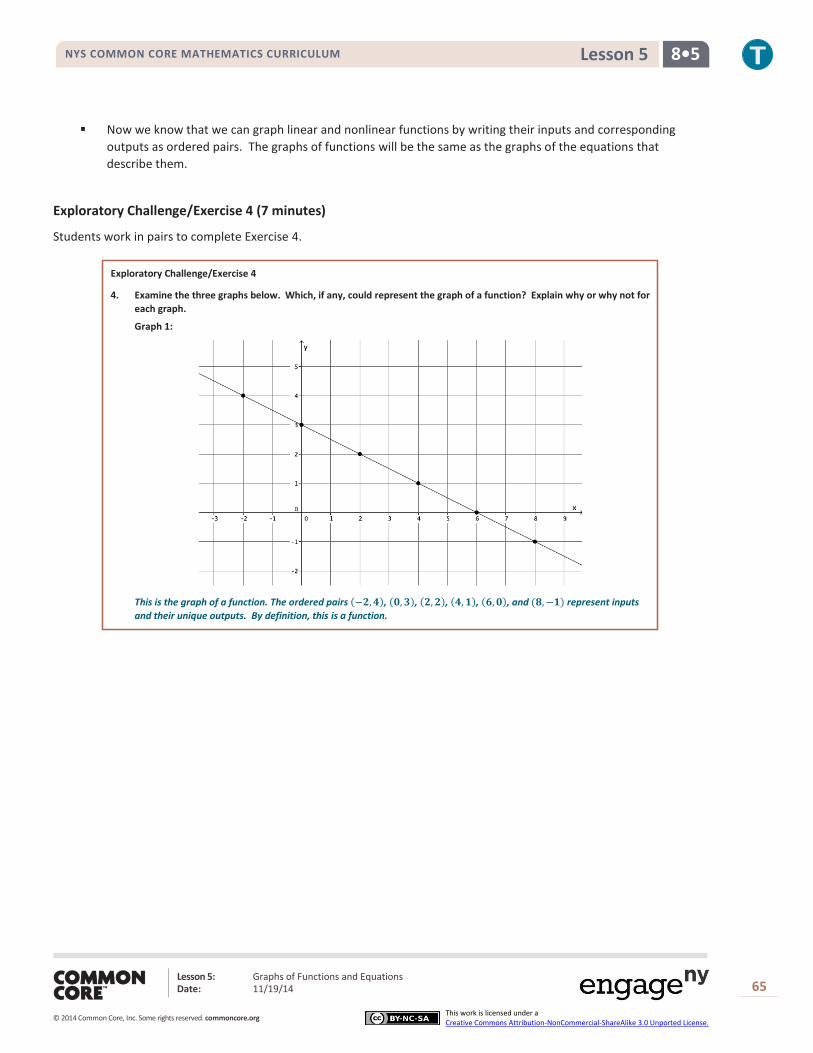
4. Examine the three graphs below. Which, if any, could represent the graph of a function? Explain why or why not for
each graph.
Graph 1:
This is the graph of a function. The ordered pairs (−𝟐, 𝟒), (𝟎, 𝟑), (𝟐, 𝟐), (𝟒, 𝟏), (𝟔, 𝟎), and (𝟖, −𝟏) represent inputs
and their unique outputs. By definition, this is a function.
NYS COMMON CORE MATHEMATICS CURRICULUM 8•5 Lesson 5
Lesson 5: Graphs of Functions and Equations Date: 11/19/14
66
© 2014 Common Core, Inc. Some rights reserved. commoncore.org This work is licensed under a Creative Commons Attribution-NonCommercial-ShareAlike 3.0 Unported License.
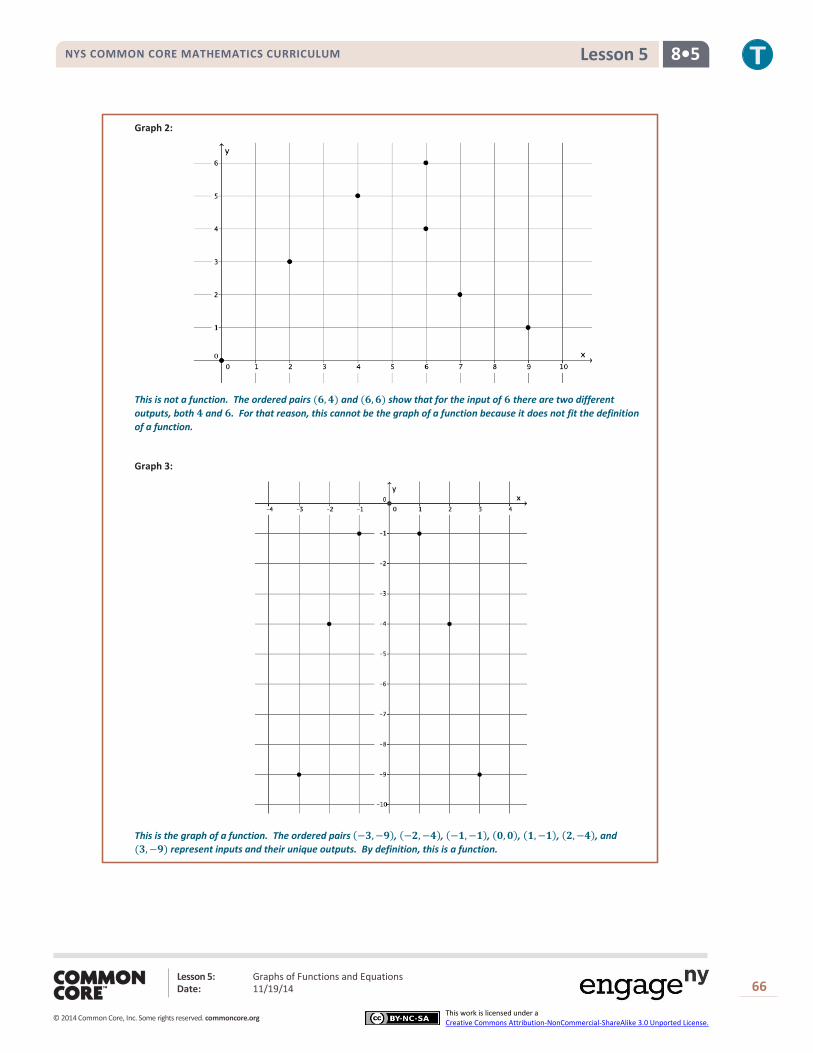
Graph 2:
This is not a function. The ordered pairs (𝟔, 𝟒) and (𝟔, 𝟔) show that for the input of 𝟔 there are two different
outputs, both 𝟒 and 𝟔. For that reason, this cannot be the graph of a function because it does not fit the definition
of a function.
Graph 3:
This is the graph of a function. The ordered pairs (−𝟑, −𝟗), (−𝟐, −𝟒), (−𝟏, −𝟏), (𝟎, 𝟎), (𝟏, −𝟏), (𝟐, −𝟒), and
(𝟑, −𝟗) represent inputs and their unique outputs. By definition, this is a function.
NYS COMMON CORE MATHEMATICS CURRICULUM 8•5 Lesson 5
Lesson 5: Graphs of Functions and Equations Date: 11/19/14
67
© 2014 Common Core, Inc. Some rights reserved. commoncore.org This work is licensed under a Creative Commons Attribution-NonCommercial-ShareAlike 3.0 Unported License.
Discussion (3 minutes)
We know that the graph of a function is the set of points with coordinates of an input and a corresponding
output. How did you use this fact to determine which graphs, if any, were functions?
By the definition of a function, we need each input to have only one output. On a graph, it means that
for each of the ordered pairs, the 𝑥 should have a unique 𝑦 value.
Assume the following set of ordered pairs is from a graph. Could these ordered pairs represent the graph of a
function? Explain.
(3, 5), (4, 7), (3, 9), (5, −2)
No, because the input of 3 has two different outputs. It does not fit the definition of a function.
Assume the following set of ordered pairs is from a graph. Could these ordered pairs represent the graph of a
function? Explain.
(−1, 6), (−3, 8), (5, 10), (7, 6)
Yes, because each input has a unique output. It satisfies the definition of a function.
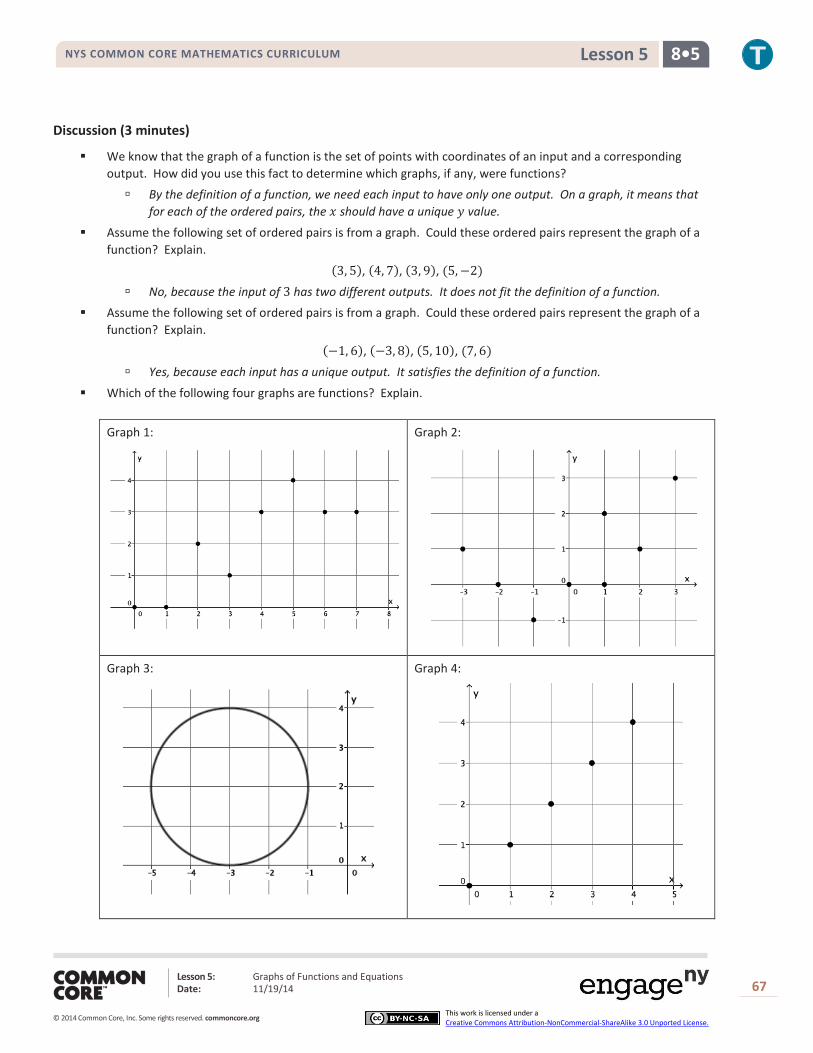
Which of the following four graphs are functions? Explain.
Graph 1:
Graph 2:
Graph 3:
Graph 4:
NYS COMMON CORE MATHEMATICS CURRICULUM 8•5 Lesson 5
Lesson 5: Graphs of Functions and Equations Date: 11/19/14
68
© 2014 Common Core, Inc. Some rights reserved. commoncore.org This work is licensed under a Creative Commons Attribution-NonCommercial-ShareAlike 3.0 Unported License.
Lesson Summary
The inputs and outputs of a function can be written as ordered pairs and graphed on a coordinate plane. The graph
of a function is the same as the rule (equation) that describes it. For example, if a function can be described by the
equation 𝒚 = 𝒎𝒙, then the ordered pairs of the graph are (𝒙,𝒎𝒙), and the graph of the function is the same as the
graph of the equation, 𝒚 = 𝒎𝒙.
One way to determine if a set of data is a function or not is by examining the inputs and outputs given by a table. If
the data is in the form of a graph, the process is the same. That is, examine each coordinate of 𝒙 and verify that it
has only one 𝒚 coordinate. If each input has exactly one output, then the graph is the graph of a function.
Graphs 1 and 4 are functions. Graphs 2 and 3 are not. Graphs 1 and 4 show that for each input of 𝑥,
there is a unique output of 𝑦. For Graph 2, the input of 𝑥 = 1 has two different outputs, 𝑦 = 0 and
𝑦 = 2, which means it cannot be a function. For Graph 3, it appears that each value of 𝑥 between −5
and −1, excluding −5 and −1, has two outputs, one on the lower half of the circle and one on the
upper half, which means it does not fit the definition of function.
Closing (5 minutes)
Summarize, or ask students to summarize, the main points from the lesson:
We know that we can graph a function by writing the inputs and corresponding outputs as ordered pairs.
We know that the graph of a function is the same as the graph of the rule (equation) that describes it.
We know that we can examine a graph to determine if it is the graph of a function, specifically to make sure
that each value of 𝑥 (inputs) has only one 𝑦 value (outputs).
Exit Ticket (5 minutes)
NYS COMMON CORE MATHEMATICS CURRICULUM 8•5 Lesson 5
Lesson 5: Graphs of Functions and Equations Date: 11/19/14
69
© 2014 Common Core, Inc. Some rights reserved. commoncore.org This work is licensed under a Creative Commons Attribution-NonCommercial-ShareAlike 3.0 Unported License.
Name Date
Lesson 5: Graphs of Functions and Equations
Exit Ticket
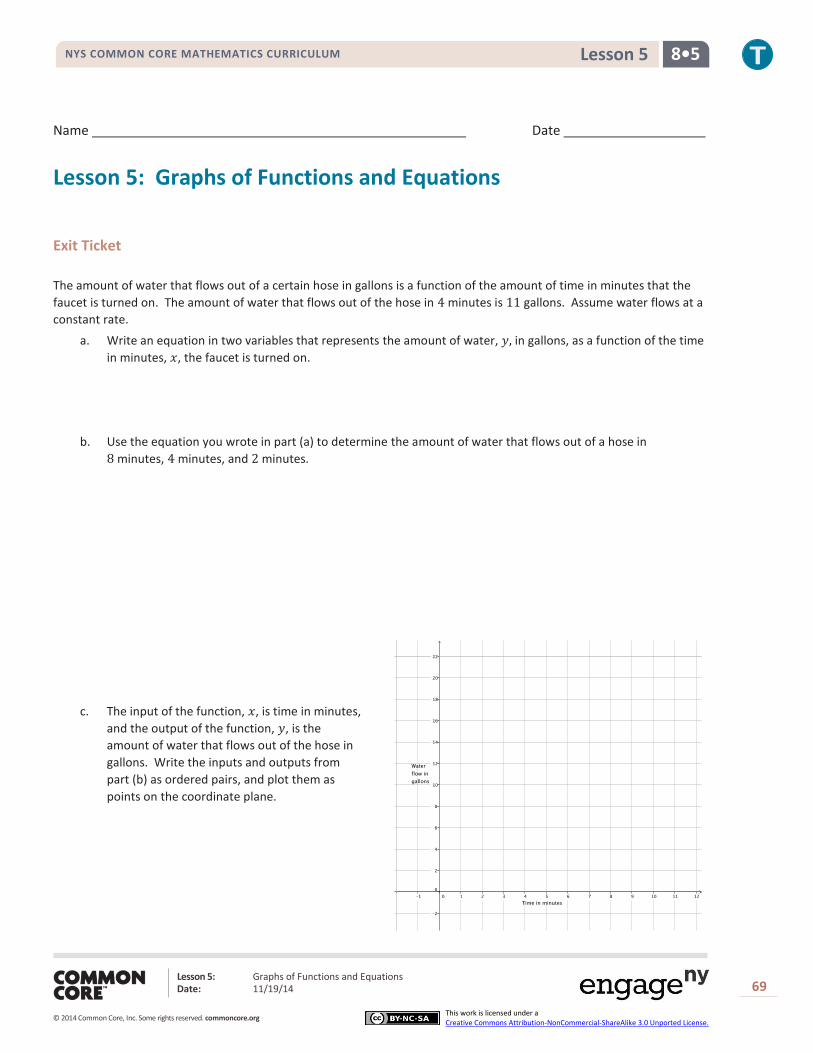
The amount of water that flows out of a certain hose in gallons is a function of the amount of time in minutes that the
faucet is turned on. The amount of water that flows out of the hose in 4 minutes is 11 gallons. Assume water flows at a
constant rate.
a. Write an equation in two variables that represents the amount of water, 𝑦, in gallons, as a function of the time
in minutes, 𝑥, the faucet is turned on.
b. Use the equation you wrote in part (a) to determine the amount of water that flows out of a hose in
8 minutes, 4 minutes, and 2 minutes.
c. The input of the function, 𝑥, is time in minutes,
and the output of the function, 𝑦, is the
amount of water that flows out of the hose in
gallons. Write the inputs and outputs from
part (b) as ordered pairs, and plot them as
points on the coordinate plane.
NYS COMMON CORE MATHEMATICS CURRICULUM 8•5 Lesson 5
Lesson 5: Graphs of Functions and Equations Date: 11/19/14
70
© 2014 Common Core, Inc. Some rights reserved. commoncore.org This work is licensed under a Creative Commons Attribution-NonCommercial-ShareAlike 3.0 Unported License.
Exit Ticket Sample Solutions
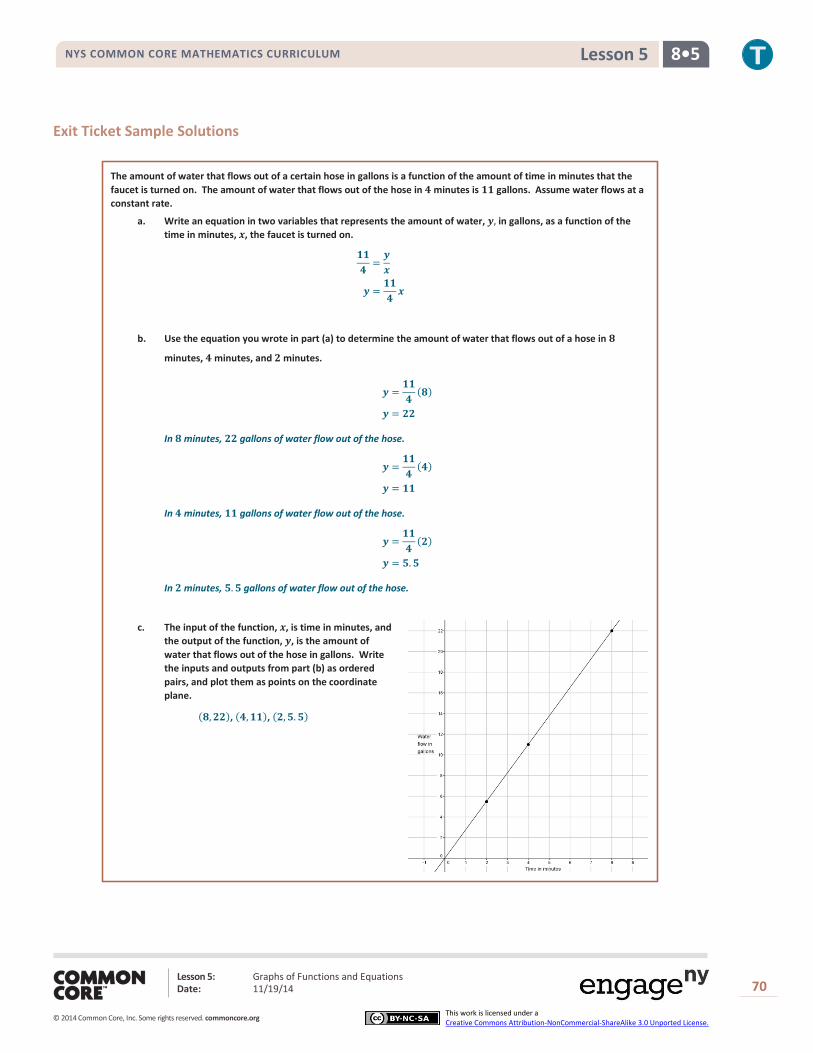
The amount of water that flows out of a certain hose in gallons is a function of the amount of time in minutes that the
faucet is turned on. The amount of water that flows out of the hose in 𝟒 minutes is 𝟏𝟏 gallons. Assume water flows at a
constant rate.
a. Write an equation in two variables that represents the amount of water, 𝒚, in gallons, as a function of the
time in minutes, 𝒙, the faucet is turned on.
𝟏𝟏
𝟒=
𝒚
𝒙
𝒚 =𝟏𝟏
𝟒𝒙
b. Use the equation you wrote in part (a) to determine the amount of water that flows out of a hose in 𝟖
minutes, 𝟒 minutes, and 𝟐 minutes.
𝒚 =𝟏𝟏
𝟒(𝟖)
𝒚 = 𝟐𝟐
In 𝟖 minutes, 𝟐𝟐 gallons of water flow out of the hose.
𝒚 =𝟏𝟏
𝟒(𝟒)
𝒚 = 𝟏𝟏
In 𝟒 minutes, 𝟏𝟏 gallons of water flow out of the hose.
𝒚 =𝟏𝟏
𝟒(𝟐)
𝒚 = 𝟓. 𝟓
In 𝟐 minutes, 𝟓. 𝟓 gallons of water flow out of the hose.
c. The input of the function, 𝒙, is time in minutes, and
the output of the function, 𝒚, is the amount of
water that flows out of the hose in gallons. Write
the inputs and outputs from part (b) as ordered
pairs, and plot them as points on the coordinate
plane.
(𝟖, 𝟐𝟐), (𝟒, 𝟏𝟏), (𝟐, 𝟓. 𝟓)
NYS COMMON CORE MATHEMATICS CURRICULUM 8•5 Lesson 5
Lesson 5: Graphs of Functions and Equations Date: 11/19/14
71
© 2014 Common Core, Inc. Some rights reserved. commoncore.org This work is licensed under a Creative Commons Attribution-NonCommercial-ShareAlike 3.0 Unported License.
Problem Set Sample Solutions
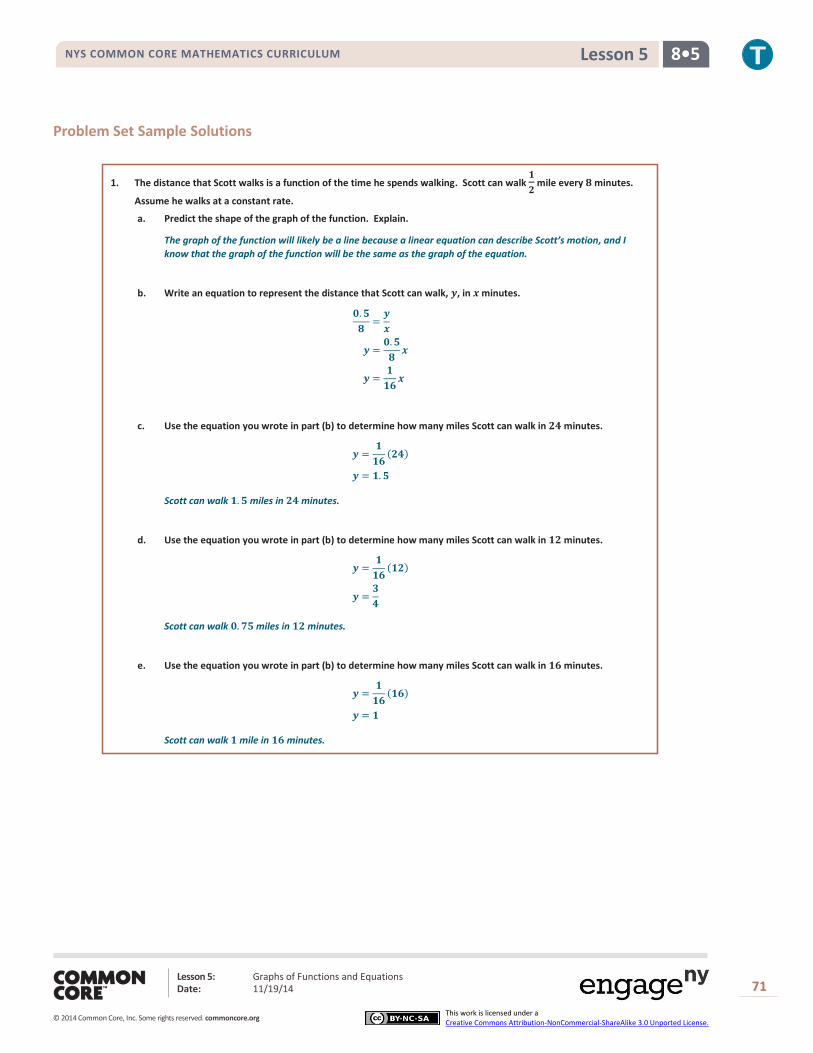
1. The distance that Scott walks is a function of the time he spends walking. Scott can walk 𝟏
𝟐 mile every 𝟖 minutes.
Assume he walks at a constant rate.
a. Predict the shape of the graph of the function. Explain.
The graph of the function will likely be a line because a linear equation can describe Scott’s motion, and I
know that the graph of the function will be the same as the graph of the equation.
b. Write an equation to represent the distance that Scott can walk, 𝒚, in 𝒙 minutes.
𝟎. 𝟓
𝟖=
𝒚
𝒙
𝒚 =𝟎. 𝟓
𝟖𝒙
𝒚 =𝟏
𝟏𝟔𝒙
c. Use the equation you wrote in part (b) to determine how many miles Scott can walk in 𝟐𝟒 minutes.
𝒚 =𝟏
𝟏𝟔(𝟐𝟒)
𝒚 = 𝟏. 𝟓
Scott can walk 𝟏. 𝟓 miles in 𝟐𝟒 minutes.
d. Use the equation you wrote in part (b) to determine how many miles Scott can walk in 𝟏𝟐 minutes.
𝒚 =𝟏
𝟏𝟔(𝟏𝟐)
𝒚 =𝟑
𝟒
Scott can walk 𝟎. 𝟕𝟓 miles in 𝟏𝟐 minutes.
e. Use the equation you wrote in part (b) to determine how many miles Scott can walk in 𝟏𝟔 minutes.
𝒚 =𝟏
𝟏𝟔(𝟏𝟔)
𝒚 = 𝟏
Scott can walk 𝟏 mile in 𝟏𝟔 minutes.
NYS COMMON CORE MATHEMATICS CURRICULUM 8•5 Lesson 5
Lesson 5: Graphs of Functions and Equations Date: 11/19/14
72
© 2014 Common Core, Inc. Some rights reserved. commoncore.org This work is licensed under a Creative Commons Attribution-NonCommercial-ShareAlike 3.0 Unported License.
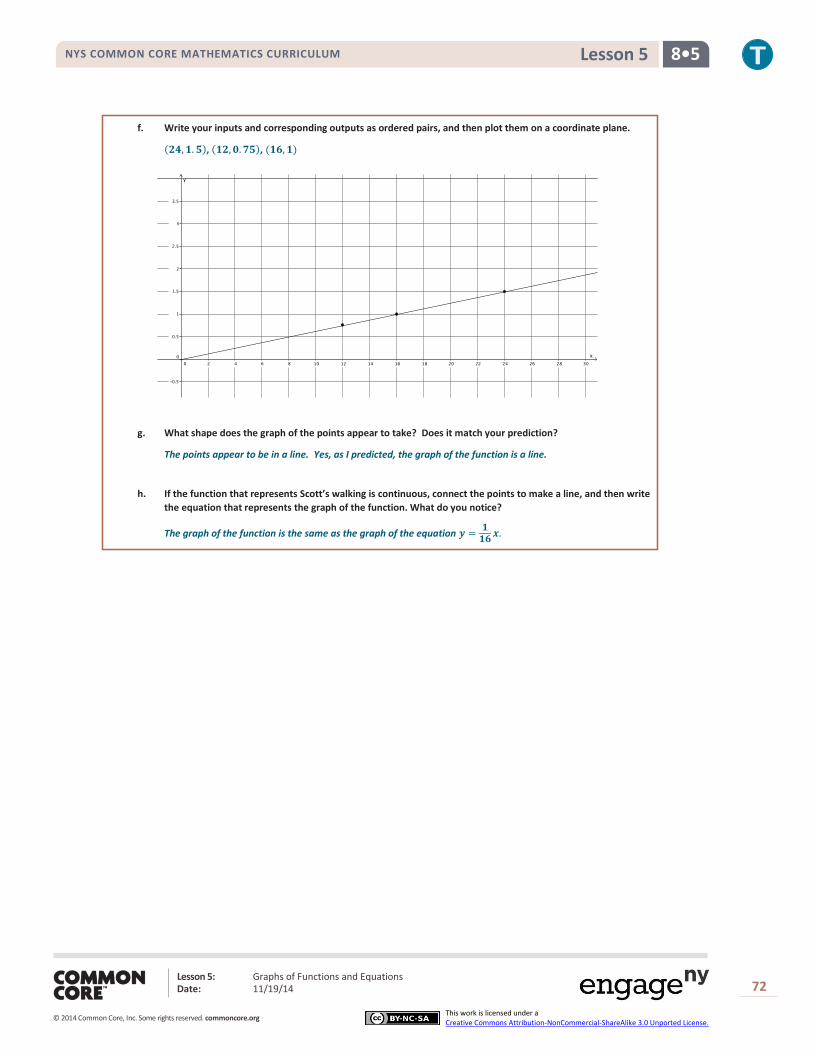
f. Write your inputs and corresponding outputs as ordered pairs, and then plot them on a coordinate plane.
(𝟐𝟒, 𝟏. 𝟓), (𝟏𝟐, 𝟎. 𝟕𝟓), (𝟏𝟔, 𝟏)
g. What shape does the graph of the points appear to take? Does it match your prediction?
The points appear to be in a line. Yes, as I predicted, the graph of the function is a line.
h. If the function that represents Scott’s walking is continuous, connect the points to make a line, and then write
the equation that represents the graph of the function. What do you notice?
The graph of the function is the same as the graph of the equation 𝒚 =𝟏
𝟏𝟔𝒙.
NYS COMMON CORE MATHEMATICS CURRICULUM 8•5 Lesson 5
Lesson 5: Graphs of Functions and Equations Date: 11/19/14
73
© 2014 Common Core, Inc. Some rights reserved. commoncore.org This work is licensed under a Creative Commons Attribution-NonCommercial-ShareAlike 3.0 Unported License.
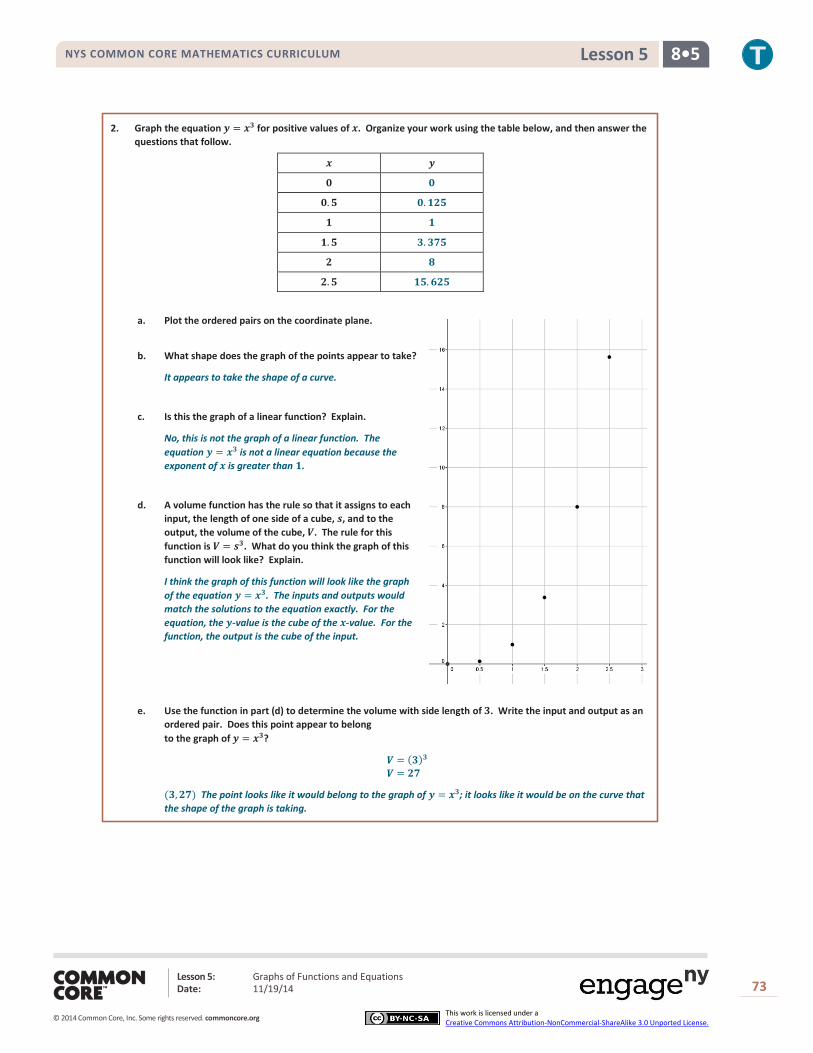
2. Graph the equation 𝒚 = 𝒙𝟑 for positive values of 𝒙. Organize your work using the table below, and then answer the
questions that follow.
𝒙 𝒚
𝟎 𝟎
𝟎. 𝟓 𝟎. 𝟏𝟐𝟓
𝟏 𝟏
𝟏. 𝟓 𝟑. 𝟑𝟕𝟓
𝟐 𝟖
𝟐. 𝟓 𝟏𝟓. 𝟔𝟐𝟓
a. Plot the ordered pairs on the coordinate plane.
b. What shape does the graph of the points appear to take?
It appears to take the shape of a curve.
c. Is this the graph of a linear function? Explain.
No, this is not the graph of a linear function. The
equation 𝒚 = 𝒙𝟑 is not a linear equation because the
exponent of 𝒙 is greater than 𝟏.
d. A volume function has the rule so that it assigns to each
input, the length of one side of a cube, 𝒔, and to the
output, the volume of the cube, 𝑽. The rule for this
function is 𝑽 = 𝒔𝟑. What do you think the graph of this
function will look like? Explain.
I think the graph of this function will look like the graph
of the equation 𝒚 = 𝒙𝟑. The inputs and outputs would
match the solutions to the equation exactly. For the
equation, the 𝒚-value is the cube of the 𝒙-value. For the
function, the output is the cube of the input.
e. Use the function in part (d) to determine the volume with side length of 𝟑. Write the input and output as an
ordered pair. Does this point appear to belong
to the graph of 𝒚 = 𝒙𝟑?
𝑽 = (𝟑)𝟑 𝑽 = 𝟐𝟕
(𝟑, 𝟐𝟕) The point looks like it would belong to the graph of 𝒚 = 𝒙𝟑; it looks like it would be on the curve that
the shape of the graph is taking.
NYS COMMON CORE MATHEMATICS CURRICULUM 8•5 Lesson 5
Lesson 5: Graphs of Functions and Equations Date: 11/19/14
74
© 2014 Common Core, Inc. Some rights reserved. commoncore.org This work is licensed under a Creative Commons Attribution-NonCommercial-ShareAlike 3.0 Unported License.
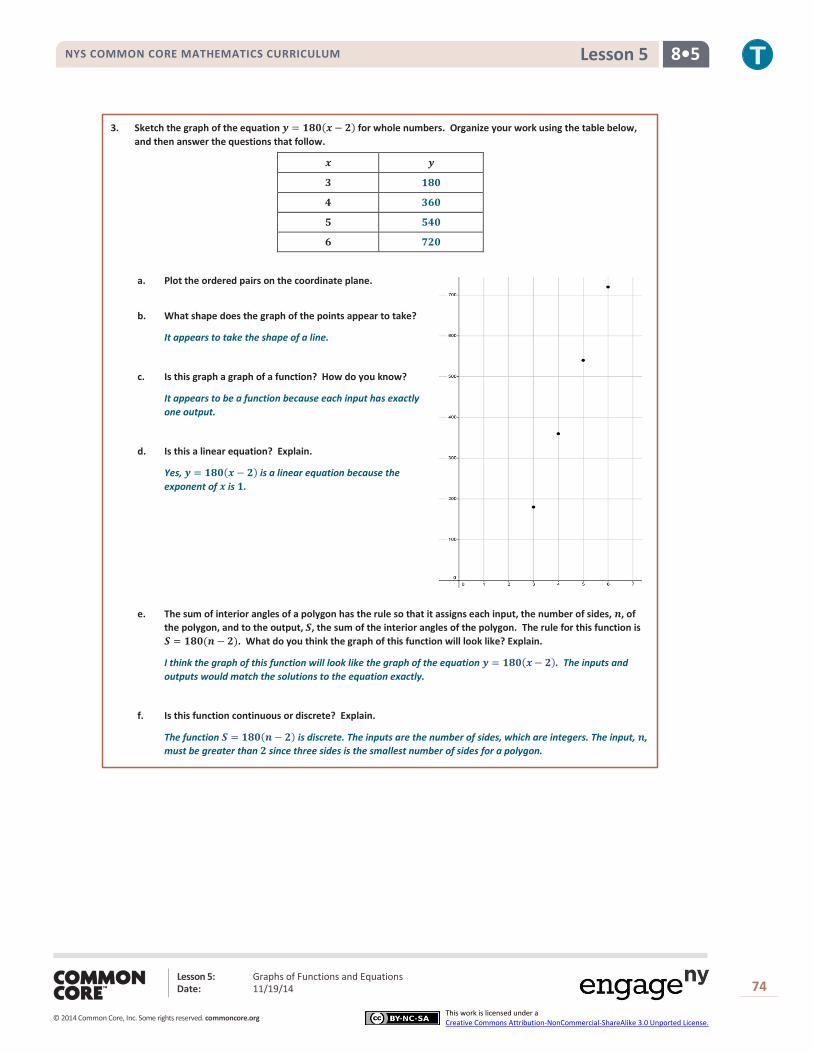
3. Sketch the graph of the equation 𝒚 = 𝟏𝟖𝟎(𝒙 − 𝟐) for whole numbers. Organize your work using the table below,
and then answer the questions that follow.
𝒙 𝒚
𝟑 𝟏𝟖𝟎
𝟒 𝟑𝟔𝟎
𝟓 𝟓𝟒𝟎
𝟔 𝟕𝟐𝟎
a. Plot the ordered pairs on the coordinate plane.
b. What shape does the graph of the points appear to take?
It appears to take the shape of a line.
c. Is this graph a graph of a function? How do you know?
It appears to be a function because each input has exactly
one output.
d. Is this a linear equation? Explain.
Yes, 𝒚 = 𝟏𝟖𝟎(𝒙 − 𝟐) is a linear equation because the
exponent of 𝒙 is 𝟏.
e. The sum of interior angles of a polygon has the rule so that it assigns each input, the number of sides, 𝒏, of
the polygon, and to the output, 𝑺, the sum of the interior angles of the polygon. The rule for this function is
𝑺 = 𝟏𝟖𝟎(𝒏 − 𝟐). What do you think the graph of this function will look like? Explain.
I think the graph of this function will look like the graph of the equation 𝒚 = 𝟏𝟖𝟎(𝒙 − 𝟐). The inputs and
outputs would match the solutions to the equation exactly.
f. Is this function continuous or discrete? Explain.
The function 𝑺 = 𝟏𝟖𝟎(𝒏 − 𝟐) is discrete. The inputs are the number of sides, which are integers. The input, 𝒏,
must be greater than 𝟐 since three sides is the smallest number of sides for a polygon.
NYS COMMON CORE MATHEMATICS CURRICULUM 8•5 Lesson 5
Lesson 5: Graphs of Functions and Equations Date: 11/19/14
75
© 2014 Common Core, Inc. Some rights reserved. commoncore.org This work is licensed under a Creative Commons Attribution-NonCommercial-ShareAlike 3.0 Unported License.
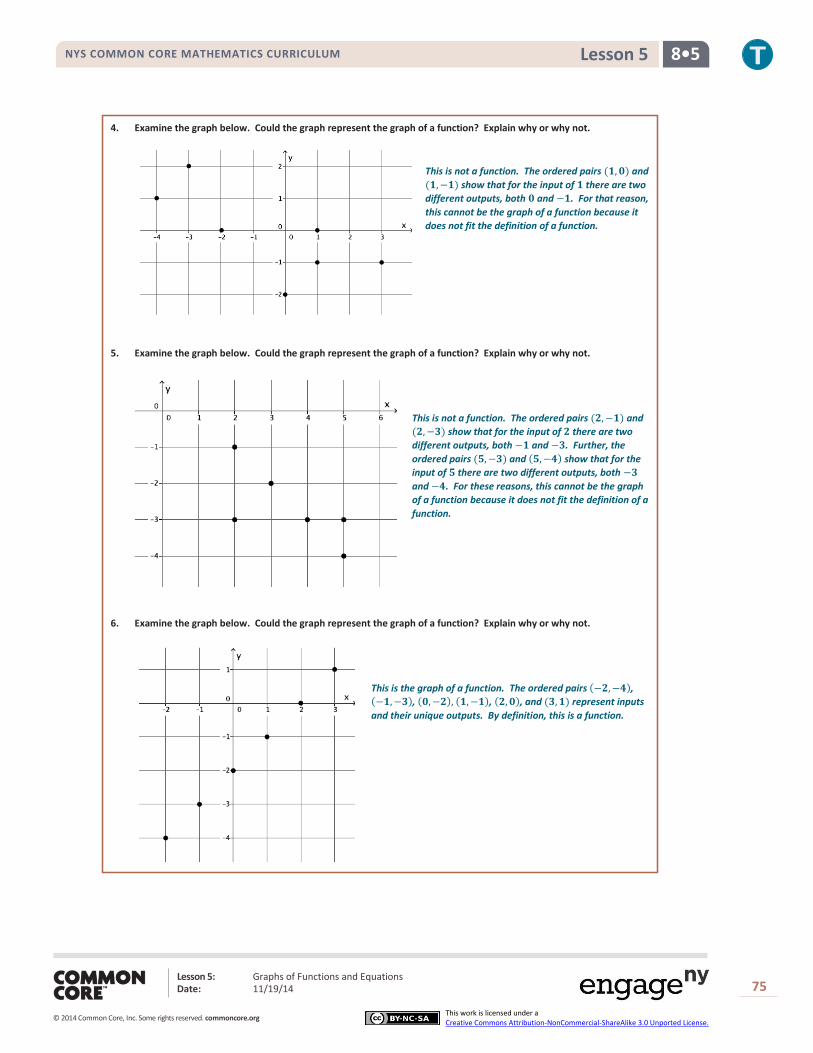
4. Examine the graph below. Could the graph represent the graph of a function? Explain why or why not.
This is not a function. The ordered pairs (𝟏, 𝟎) and
(𝟏, −𝟏) show that for the input of 𝟏 there are two
different outputs, both 𝟎 and −𝟏. For that reason,
this cannot be the graph of a function because it
does not fit the definition of a function.
5. Examine the graph below. Could the graph represent the graph of a function? Explain why or why not.
This is not a function. The ordered pairs (𝟐, −𝟏) and
(𝟐, −𝟑) show that for the input of 𝟐 there are two
different outputs, both −𝟏 and −𝟑. Further, the
ordered pairs (𝟓, −𝟑) and (𝟓, −𝟒) show that for the
input of 𝟓 there are two different outputs, both −𝟑
and −𝟒. For these reasons, this cannot be the graph
of a function because it does not fit the definition of a
function.
6. Examine the graph below. Could the graph represent the graph of a function? Explain why or why not.
This is the graph of a function. The ordered pairs (−𝟐, −𝟒), (−𝟏, −𝟑), (𝟎, −𝟐), (𝟏, −𝟏), (𝟐, 𝟎), and (𝟑, 𝟏) represent inputs
and their unique outputs. By definition, this is a function.