1.2 Graphs of Equations. Objective Sketch graphs of equations Find x and y intercepts of graphs of...
25
1.2 Graphs of Equations
-
Upload
roberta-briggs -
Category
Documents
-
view
235 -
download
3
Transcript of 1.2 Graphs of Equations. Objective Sketch graphs of equations Find x and y intercepts of graphs of...

1.2 Graphs of Equations

Objective
• Sketch graphs of equations
• Find x and y intercepts of graphs of equations
• Use symmetry to sketch graphs of equations
• Use graphs of equations in solving real-life problems.

The graph of an equation
• A relationship between two quantities can be expressed as an equation in two variables.
• The graph of an equation is the set of all points that are solutions of the equation.

Determining Solutions
• Determine whether (1, 3) and (-2, 4) are solutions of the equation 8 5y x 3 8(1) 5
yes this is a solution
4 = 8(-2) -5
no solution

Sketching the graph of an equation
• Example 2 Using the point-plotting method, sketch the graph of
3 2y x

• Using the point-plotting method, sketch the graph of
21y x
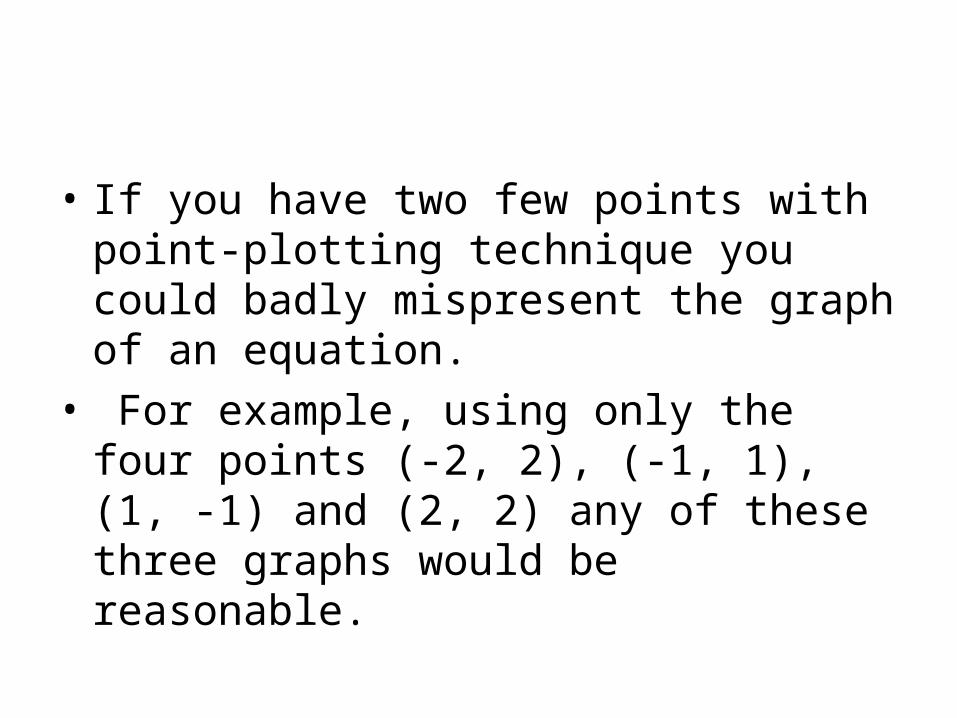
• If you have two few points with point-plotting technique you could badly mispresent the graph of an equation.
• For example, using only the four points (-2, 2), (-1, 1), (1, -1) and (2, 2) any of these three graphs would be reasonable.
Intercepts of a Graph
• Intercepts are points that have zero as either the x-coordinate or the y-coordinate.
• It is possible for the graph to have one or several intercepts.


Finding intercepts
• To find x-intercepts, let y be zero and solve the equation for x.
• To find y-intercepts, let x be zero and solve the equation for y.

Find the x and y intercepts
2 5y x x

Find the x and y intercepts
2 4y x

Symmetry
• X-axis symmetry

• Y-axis symmetry

• Origin symmetry

Graphical Tests for Symmetry
• 1. A graph is symmetric with respect to the x-axis if, whenever (x, y) is on the graph (x, -y) is also on the graph.
• 2. A graph is symmetric with respect to the y-axis, if, whenever (x, y) is on the graph (-x, y) is also on the graph.
• 3. A graph is symmetric with respect to the origin if, whenever (x, y) is on the graph (-x, -y) is also on the graph.

Algebraic Tests for Symmetry
• 1. The graph of an equation is symmetric with respect to the x-axis if replacing y with –y yields an equivalent equation.
• 2. The graph of an equation is symmetric with respect to the y-axis if replacing x with –x yields an equivalent equation.
• 3. The graph of an equation is symmetric with respect to the origin if replacing x with –x and y with -y yields an equivalent equation.
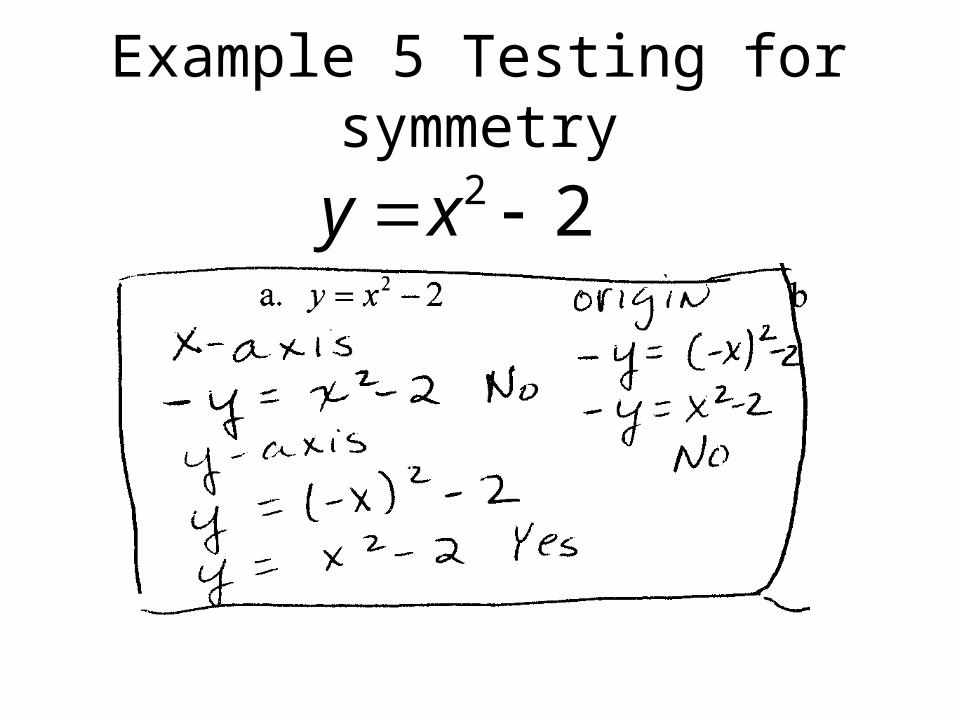
Example 5 Testing for symmetry
2 2y x

3 4y x x

2 1x y

Application
• The net profits P (in millions of dollars) for a company from 2000 through 2005 can be approximated by the mathematical model P = 48.3t + 100.04 where t is the calendar year, with t = 0 corresponding to 2000

• Construct a table of values that shows the net profits for each year.

• Use the table of values to sketch a graph of the model. Then use the graph to estimate graphically the net profit for the year 2012.

• Use the model to confirm algebraically the estimate you found in part (b)

• How do you identify intercepts and symmetry in order to sketch graphs of equations?
• Find intercepts by letting one variable be zero and solving for the other variable.
• Identify symmetry by choosing a point (x, y) on the graph and checking to see whether the points (x, -y), (-x, y) or (-x, -y) are also on the graph.