Lesson 3.7 - Constant Rate of Change
3
Lesson 3.7 – Constant Rate of Change A rate of change is a rate that describes how one quantity changes in relation to another. In a linear relationship (line), the rate of change between any two quantities is the same. A linear relationship has a constant rate of change. A computer programmer charges customers per line of code written. Fill in the blanks with the amount of change between consecutive numbers. Lines of Code 50 100 150 200 Cost ($) 1,000 2,000 3,000 4,000 Find the rate of change by finding the unit rate. Example 1: Use a Table Cars Washed Number Money ($) 5 40 10 80 15 120 20 160 Find the unit rate to determine the constant rate of change. ℎ ℎ = 40 5
Transcript of Lesson 3.7 - Constant Rate of Change

Lesson 3.7 – Constant Rate of Change A rate of change is a rate that describes how one quantity changes in relation to another. In a linear relationship (line), the rate of change between any two quantities is the same. A linear relationship has a constant rate of change. A computer programmer charges customers per line of code written. Fill in the blanks with the amount of change between consecutive numbers. Lines of Code 50 100 150 200 Cost ($) 1,000 2,000 3,000 4,000
Find the rate of change by finding the unit rate. Example 1: Use a Table
Cars Washed Number Money ($)
5 40 10 80 15 120 20 160
Find the unit rate to determine the constant rate of change.
𝑐ℎ𝑎𝑛𝑔𝑒𝑖𝑛𝑚𝑜𝑛𝑒𝑦𝑐ℎ𝑎𝑛𝑔𝑒𝑖𝑛𝑐𝑎𝑟𝑠 =
40𝑑𝑜𝑙𝑙𝑎𝑟𝑠5𝑐𝑎𝑟𝑠

Example 2: Analyze a Graph The graph represents the distance traveled while driving on a highway. Find the constant rate of change. To find the rate of change, pick any two points on the line, such as (0, 0) and (1, 60).
𝑐ℎ𝑎𝑛𝑔𝑒𝑖𝑛𝑚𝑖𝑙𝑒𝑠𝑐ℎ𝑎𝑛𝑔𝑒𝑖𝑛ℎ𝑜𝑢𝑟𝑠 =
(60 − 0)𝑚𝑖𝑙𝑒𝑠1 − 0 ℎ𝑜𝑢𝑟𝑠
Example 3: Explain Coordinate Points The point (0, 0) represents travelling zero miles in zero hours. The point (1, 60) represents travelling 60 miles in 1 hour. Notice that this is the constant rate of change.
Y Mae Cycles . Example 4: Tables vs. Graphs The table shows the hourly charge to rent a bicycle at Pura Vida Rentals, and the graph shows the hourly charge to rent a bicycle at “Y Mae” Cycles.
Pura Vida Rentals Time (hour) Cost ($) 2 24 3 36 4 48
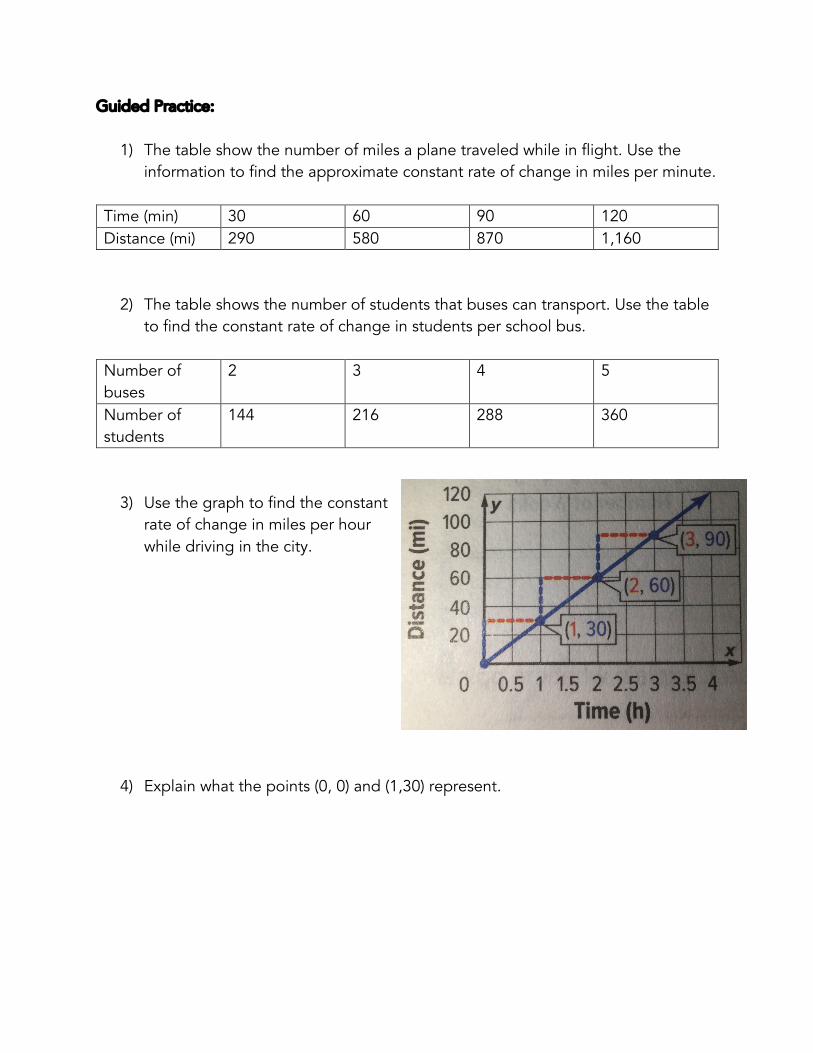
Guided Practice:
1) The table show the number of miles a plane traveled while in flight. Use the information to find the approximate constant rate of change in miles per minute.
Time (min) 30 60 90 120 Distance (mi) 290 580 870 1,160
2) The table shows the number of students that buses can transport. Use the table to find the constant rate of change in students per school bus.
Number of buses
2 3 4 5
Number of students
144 216 288 360
3) Use the graph to find the constant rate of change in miles per hour while driving in the city.
4) Explain what the points (0, 0) and (1,30) represent.