Lecture 15: 11.02.05 Phase changes and phase diagrams … · ... 11.02.05 Phase changes and phase...
14
3.012 Fundamentals of Materials Science Fall 2005 Lecture 15: 11.02.05 Phase changes and phase diagrams of single- component materials Figure removed for copyright reasons. Source: Abstract of Wang, Xiaofei, Sandro Scandolo, and Roberto Car. "Carbon Phase Diagram from Ab Initio Molecular Dynamics." Physical Review Letters 95 (2005): 185701. Today: LAST TIME ......................................................................................................................................................................................... 2 BEHAVIOR OF THE CHEMICAL POTENTIAL/MOLAR FREE ENERGY IN SINGLE-COMPONENT MATERIALS........................................ 4 The free energy at phase transitions ........................................................................................................................................... 4 PHASES AND PHASE DIAGRAMS SINGLE-COMPONENT MATERIALS .................................................................................................6 Phases of single-component materials ....................................................................................................................................... 6 Phase diagrams of single-component materials ........................................................................................................................ 6 The Gibbs Phase Rule.................................................................................................................................................................. 7 Constraints on the shape of phase boundaries (coexistence curves): The Clausius-Clapeyron equation............................. 9 Example single-component phase diagrams ............................................................................................................................10 Walking along lines of constant temperature or pressure in a single-component phase diagram ......................................12 ICE IX.............................................................................................................................................................................................13 REFERENCES ...................................................................................................................................................................................14 Reading: Engel and Reid Ch. 8.1-8.5 Supplementary Reading: - Lecture 15 – Single-component phase diagrams and phase transitions 1 of 14 11/2/05
Transcript of Lecture 15: 11.02.05 Phase changes and phase diagrams … · ... 11.02.05 Phase changes and phase...
3.012 Fundamentals of Materials Science Fall 2005
Lecture 15: 11.02.05 Phase changes and phase diagrams of single-component materials
Figure removed for copyright reasons.
Source: Abstract of Wang, Xiaofei, Sandro Scandolo, and Roberto Car. "Carbon Phase Diagram from Ab Initio Molecular Dynamics." Physical Review Letters 95 (2005): 185701.
Today:
LAST TIME .........................................................................................................................................................................................2�BEHAVIOR OF THE CHEMICAL POTENTIAL/MOLAR FREE ENERGY IN SINGLE-COMPONENT MATERIALS........................................4�
The free energy at phase transitions...........................................................................................................................................4�PHASES AND PHASE DIAGRAMS SINGLE-COMPONENT MATERIALS .................................................................................................6�
Phases of single-component materials .......................................................................................................................................6�Phase diagrams of single-component materials ........................................................................................................................6�The Gibbs Phase Rule..................................................................................................................................................................7�Constraints on the shape of phase boundaries (coexistence curves): The Clausius-Clapeyron equation.............................9�Example single-component phase diagrams ............................................................................................................................10�Walking along lines of constant temperature or pressure in a single-component phase diagram ......................................12�
ICE IX.............................................................................................................................................................................................13�REFERENCES ...................................................................................................................................................................................14�
Reading: Engel and Reid Ch. 8.1-8.5
Supplementary Reading: -
Lecture 15 – Single-component phase diagrams and phase transitions 1 of 14�11/2/05�

3.012 Fundamentals of Materials Science Fall 2005
Last time
• Stable equilibria have requirements set by the second law:
• …these lead to material property requirements:
Entro
py, S
, jou
les/
degr
ee .
mol
e
280�
240�
200�
160�
100�
80
60
40�
20�
0�200 600 1000 1400 1800
T, K
Figure by MIT OCW.
Lecture 15 – Single-component phase diagrams and phase transitions 2 of 14 11/2/05
O2 (g)
Au (I) Fe (I)
Al (I) Cu
Fe (α)
(I)Fe (�)
Au (s) Fe (�) Cu (s)
Fe (�) Al (s)
C(graphite)C(diamond)
3.012 Fundamentals of Materials Science Fall 2005
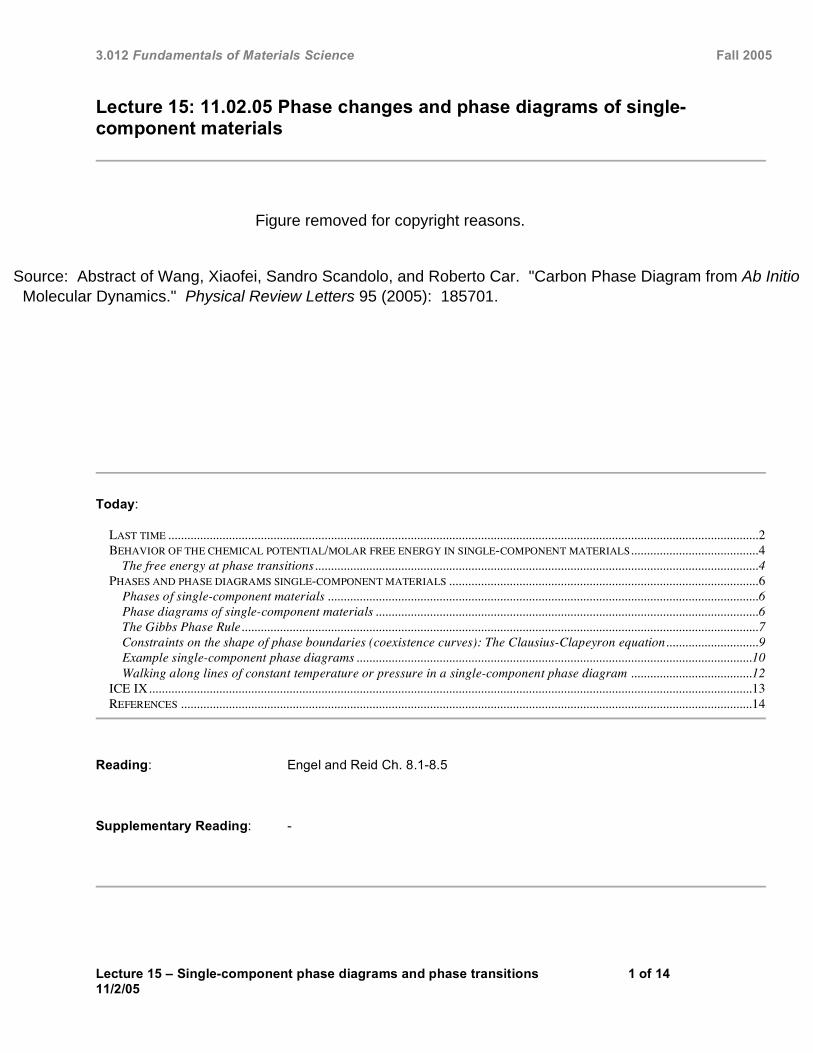
• …ergo, the shape of free energy curves is not arbitrary!
G
T
!
" 2G
"T 2
#
$ %
&
' ( P,N
> 0
G
T
!
" 2G
"T 2
#
$ %
&
' ( P,N
< 0
m << 0
m < 0
m ~ 0
Lecture 15 – Single-component phase diagrams and phase transitions 3 of 14�11/2/05�

3.012 Fundamentals of Materials Science� Fall 2005
Behavior of the chemical potential/molar free energy in single-component materials
The free energy at phase transitions
• —MAIN IDEA: Phases of a material are described by unique free energy functions each phase has its own free energy curve. The stable form of a material is that form with the lowest free energy at any given temperature, and crossing points in free energy curves define the location of phase transitions.
•� Earlier in the term, we examined the behavior of the heat capacity and enthalpy as heat was added to single-component materials near a phase transition. We are now ready to address what happens to the free energy at a phase transition? Let’s consider the case of a solid that is melting to become a liquid at constant pressure:
o� We can plot the free energy as a function of temperature for the liquid, and for the solid. The free energy curves of each phase are unique- even though both phases are composed of the same atoms in single-component systems, they have unique interactions in the solid and liquid states. Thus the free energy of the liquid has a different temperature dependence than the solid.
G
T
o What is going on with the Gibbs free energy at the melting point?
Lecture 15 – Single-component phase diagrams and phase transitions 4 of 14 11/2/05
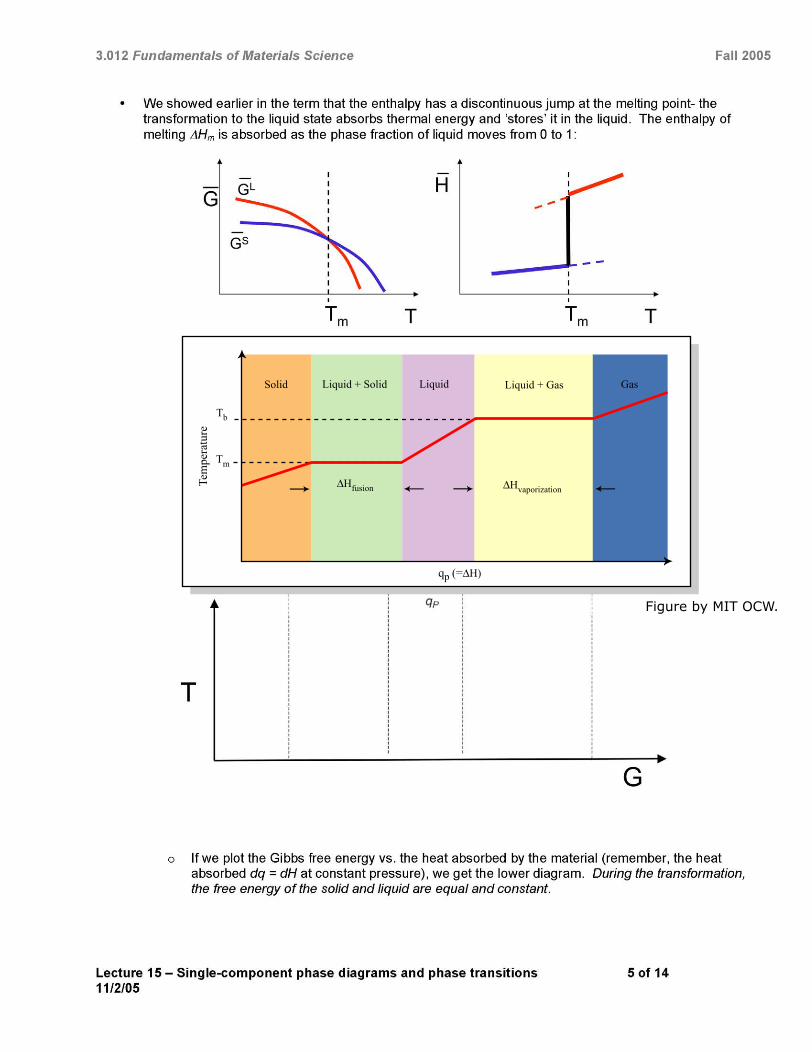
Solid Liquid + Solid Liquid Liquid + Gas Gas
�Hfusion
Tb
Tm
�Hvaporization
qp (=�H)
Tem
pera
ture
Figure by MIT OCW.
3.012 Fundamentals of Materials Science� Fall 2005
Phases and phase diagrams single-component materials
• - - - -V-MAIN IDEA: Single component phase diagrams map out in P T, P V, or P T space the identities of the stable equilibrium form or forms of a material as a function of the environmental conditions.
Phases of single-component materials
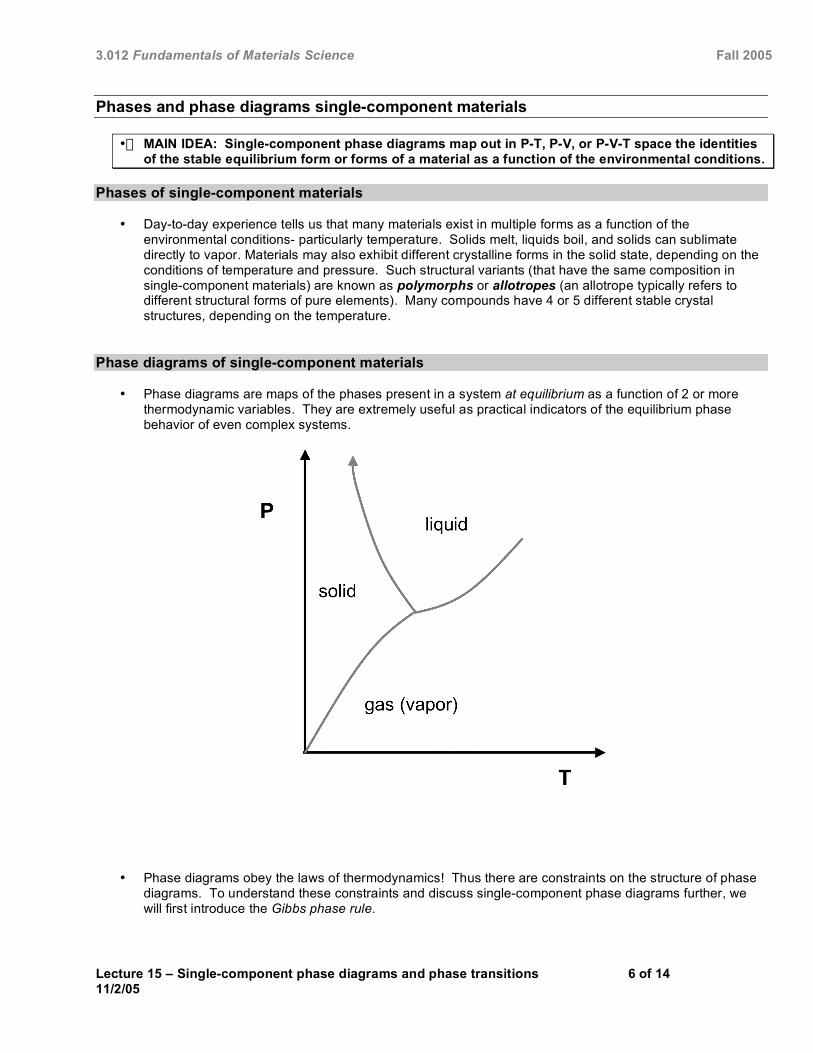
•� Day-to-day experience tells us that many materials exist in multiple forms as a function of the environmental conditions- particularly temperature. Solids melt, liquids boil, and solids can sublimate directly to vapor. Materials may also exhibit different crystalline forms in the solid state, depending on the conditions of temperature and pressure. Such structural variants (that have the same composition in single-component materials) are known as polymorphs or allotropes (an allotrope typically refers to different structural forms of pure elements). Many compounds have 4 or 5 different stable crystal structures, depending on the temperature.
Phase diagrams of single-component materials
•� Phase diagrams are maps of the phases present in a system at equilibrium as a function of 2 or more thermodynamic variables. They are extremely useful as practical indicators of the equilibrium phase behavior of even complex systems.
•� Phase diagrams obey the laws of thermodynamics! Thus there are constraints on the structure of phase diagrams. To understand these constraints and discuss single-component phase diagrams further, we will first introduce the Gibbs phase rule.
Lecture 15 – Single-component phase diagrams and phase transitions 6 of 14 11/2/05
3.012 Fundamentals of Materials Science� Fall 2005
The Gibbs Phase Rule
• MAIN IDEA: The Gibbs phase rule determines how many phases can be in equilibrium simultaneously, and whether those phases are stable along a field, line, or point in the phase diagram.
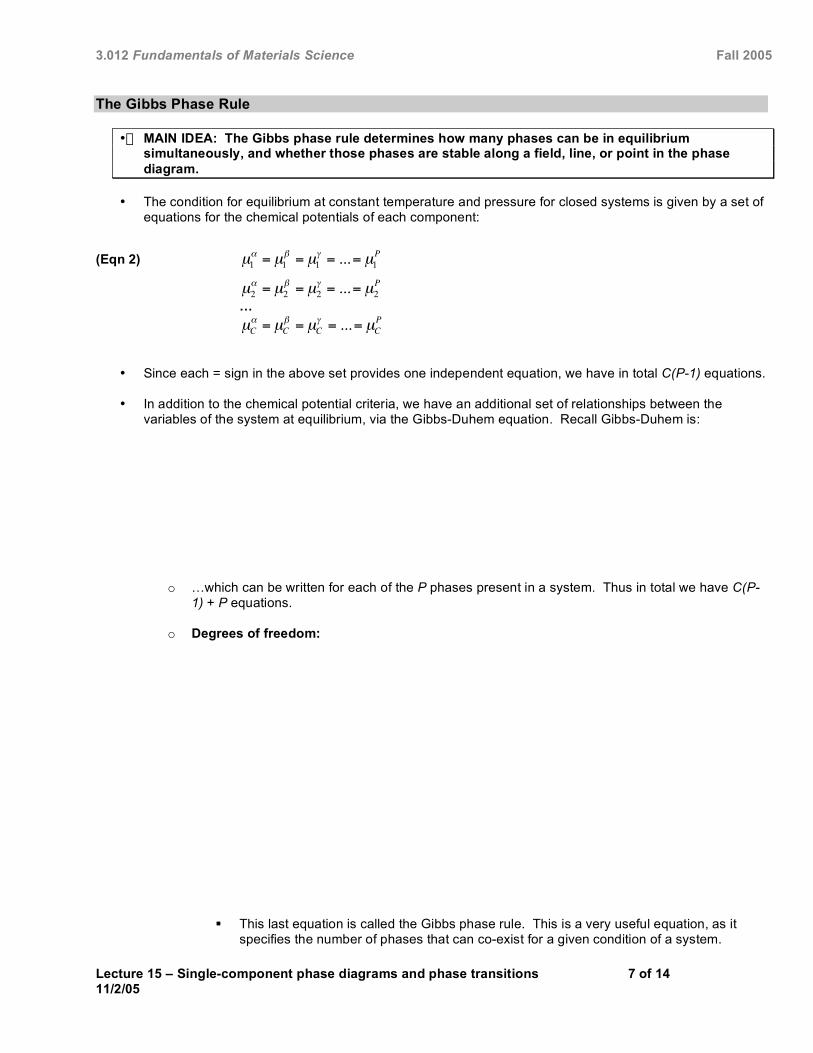
•� The condition for equilibrium at constant temperature and pressure for closed systems is given by a set of equations for the chemical potentials of each component:
(Eqn 2)
!
µ1
" = µ1
# = µ1
$ = ...= µ1
P
!
µ2
" = µ2
# = µ2
$ = ...= µ2
P
…
!
µC
" = µC
# = µC
$ = ...= µC
P
•� Since each = sign in the above set provides one independent equation, we have in total C(P-1) equations.
•� In addition to the chemical potential criteria, we have an additional set of relationships between the variables of the system at equilibrium, via the Gibbs-Duhem equation. Recall Gibbs-Duhem is:
o� …which can be written for each of the P phases present in a system. Thus in total we have C(P-1) + P equations.
o� Degrees of freedom:
This last equation is called the Gibbs phase rule. This is a very useful equation, as it specifies the number of phases that can co-exist for a given condition of a system.
Lecture 15 – Single-component phase diagrams and phase transitions 7 of 14 11/2/05
3.012 Fundamentals of Materials Science� Fall 2005
Application of the phase rule
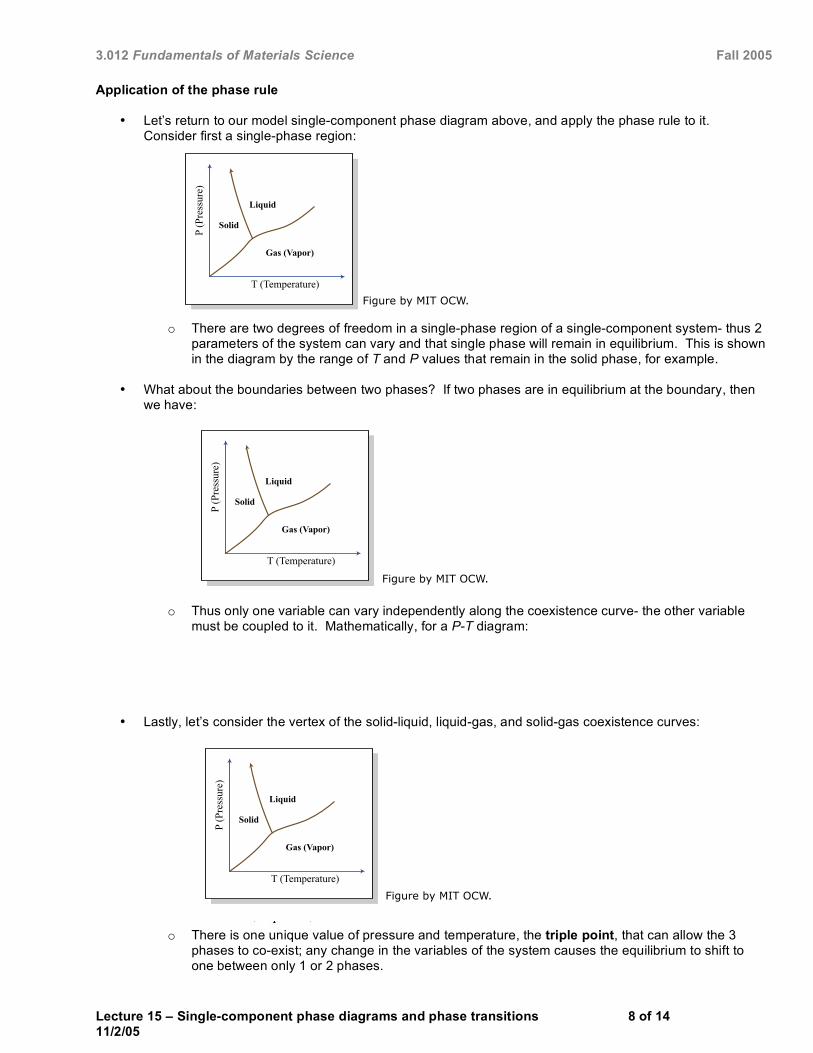
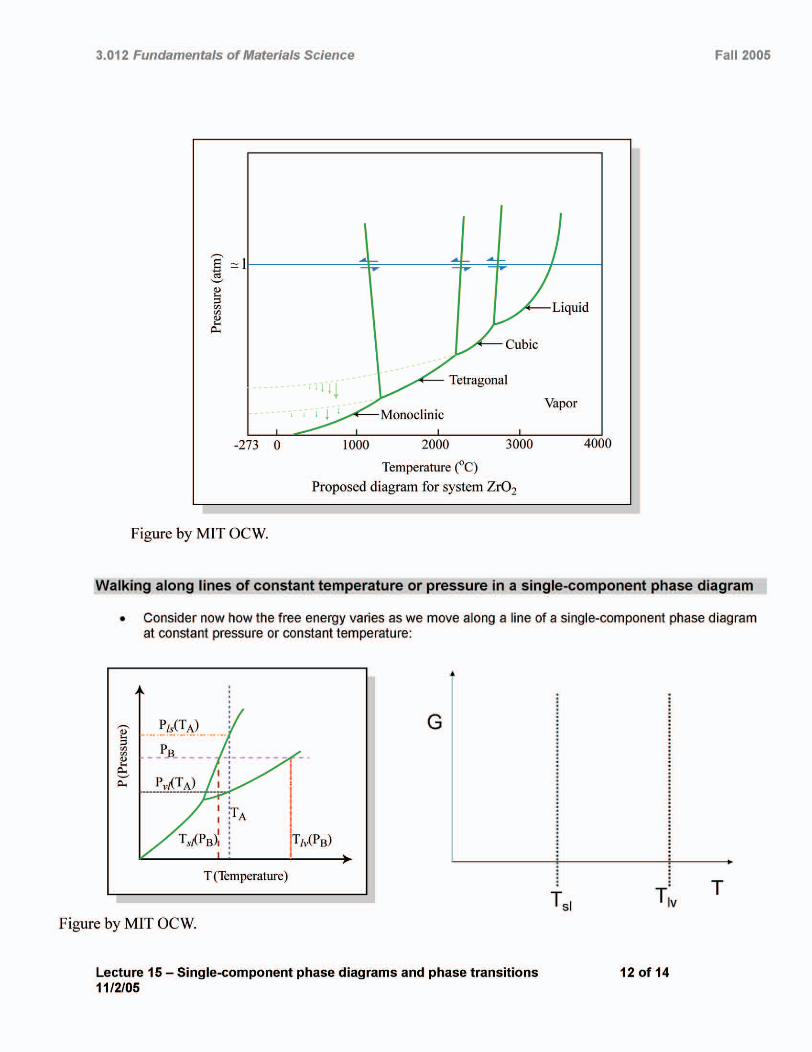
•� Let’s return to our model single-component phase diagram above, and apply the phase rule to it.�Consider first a single-phase region:�
Solid
Liquid
Gas (Vapor)
T (Temperature)
P (P
ress
ure)
�
Figure by MIT OCW.
o� There are two degrees of freedom in a single-phase region of a single-component system- thus 2 parameters of the system can vary and that single phase will remain in equilibrium. This is shown in the diagram by the range of T and P values that remain in the solid phase, for example.
•� What about the boundaries between two phases? If two phases are in equilibrium at the boundary, then we have:
Solid
Liquid
Gas (Vapor)
T (Temperature)
P (P
ress
ure)
�
Figure by MIT OCW.
o� Thus only one variable can vary independently along the coexistence curve- the other variable must be coupled to it. Mathematically, for a P-T diagram:
•� Lastly, let’s consider the vertex of the solid-liquid, liquid-gas, and solid-gas coexistence curves:
Solid
Liquid
Gas (Vapor)
T (Temperature)
P (P
ress
ure)
�
Figure by MIT OCW.
o� There is one unique value of pressure and temperature, the triple point, that can allow the 3 phases to co-exist; any change in the variables of the system causes the equilibrium to shift to one between only 1 or 2 phases.
Lecture 15 – Single-component phase diagrams and phase transitions 8 of 14 11/2/05
3.012 Fundamentals of Materials Science� Fall 2005
- nConstraints on the shape of phase boundaries (coexistence curves): The Clausius Clapeyroequation
•� Just as the relationship between thermodynamic variables dictates the shape of free energy curves, equilibrium relationships have something to say about the shape of coexistence curves on a phase diagram. An important relationship known as the Clausius-Clapeyron equation provides a link between the conditions for 2-phase equilibrium and the slope of the 2-phase line on the P vs. T diagram:
o� For 2 phases in equilibrium (let’s use the example of solid and liquid in equilibrium at the melting temperature):
!
µS = µL
To find a nearby condition of T and P where the two phases are still in equilibrium, we must have:(2)
Lecture 15 – Single-component phase diagrams and phase transitions 9 of 14 11/2/05

3.012 Fundamentals of Materials Science� Fall 2005
•� The Clausius-Clapeyron equation dictates the slope of the two-phase co-existence curve for single-component materials. We already know that the enthalpy change on melting is typically positive, therefore the sign of the change in volume on melting will usually dictate whether the slope of P vs. T is positive or negative.
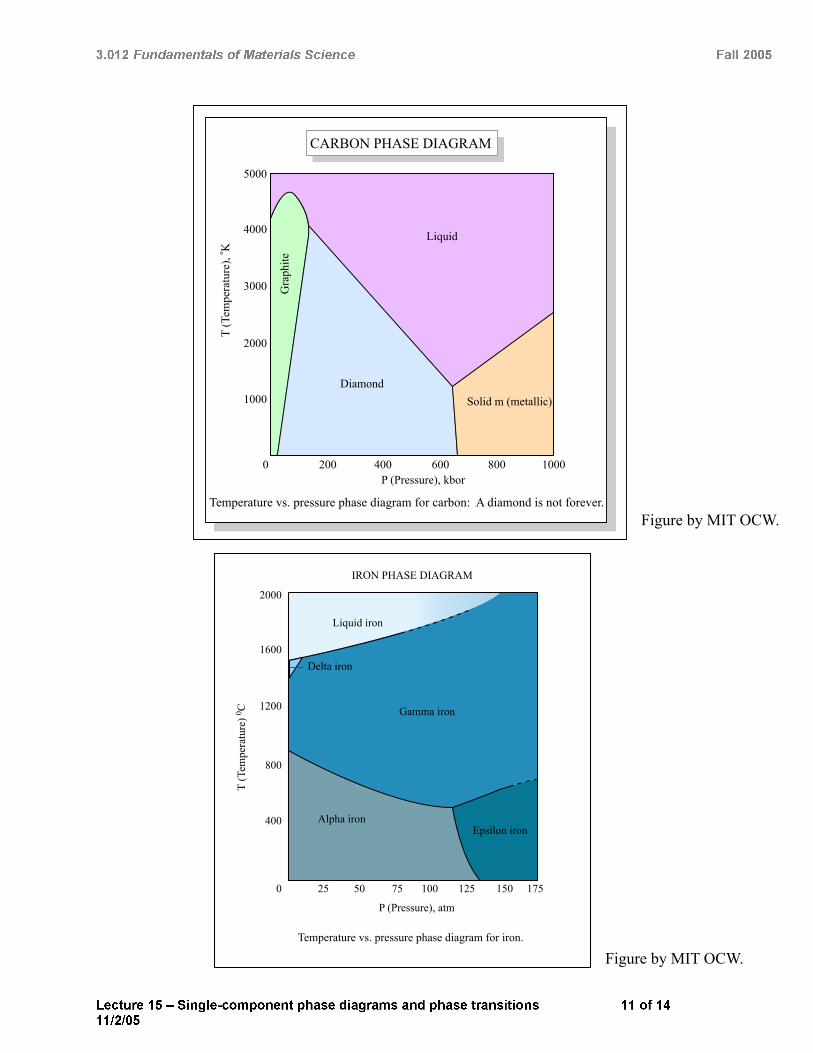
Example single-component phase diagrams
•� The phase diagram of water:
Source: http://www.lsbu.ac.uk/water/phase.html Courtesy of London South Bank University. Used with permission.
• Water transitions through increasingly dense crystal structures as pressure is increased:
Courtesy of London South Bank University. Used with permission. Lecture 15 – Single-component phase diagrams and phase transitions 10 of 14 11/2/05
0
( )
T (
), o K
P ( )
5000
4000
3000
2000
1000
200 400 600 800 1000
Diamond Solid m metallic
Liquid
Gra
phite
Tem
pera
ture
Pressure , kbor
CARBON PHASE DIAGRAM
Temperature vs. pressure phase diagram for carbon: A diamond is not forever. Figure by MIT OCW.
T (
) 0 C
0
P ( )
IRON PHASE DIAGRAM
Tem
pera
ture
2000
1600
1200
800
400
25 50 75 100 125 150 175
Pressure , atm
Liquid iron
Delta iron
Gamma iron
Alpha iron Epsilon iron
Temperature vs. pressure phase diagram for iron.
Figure by MIT OCW.

3.012 Fundamentals of Materials Science Fall 2005
ICE IX
Photographs removed for copyright reasons.
Lecture 15 – Single-component phase diagrams and phase transitions 13 of 14 11/2/05
3.012 Fundamentals of Materials Science� Fall 2005
References
1.� Gaskell, D. R. 1981. Introduction to Metallurgical Thermodynamics. Hemisphere, New York. 2.� Denbigh, K. 1997. The Principles of Chemical Equilibrium. Cambridge University Press, New York. 3.� Bergeron, C. G., and S. H. Risbud. 1984. Introduction to Phase Equilibria in Ceramics. American Ceramic
Society, Westerville, OH.
Lecture 15 – Single-component phase diagrams and phase transitions 14 of 14 11/2/05