Phase Changes & Phase Diagrams
33
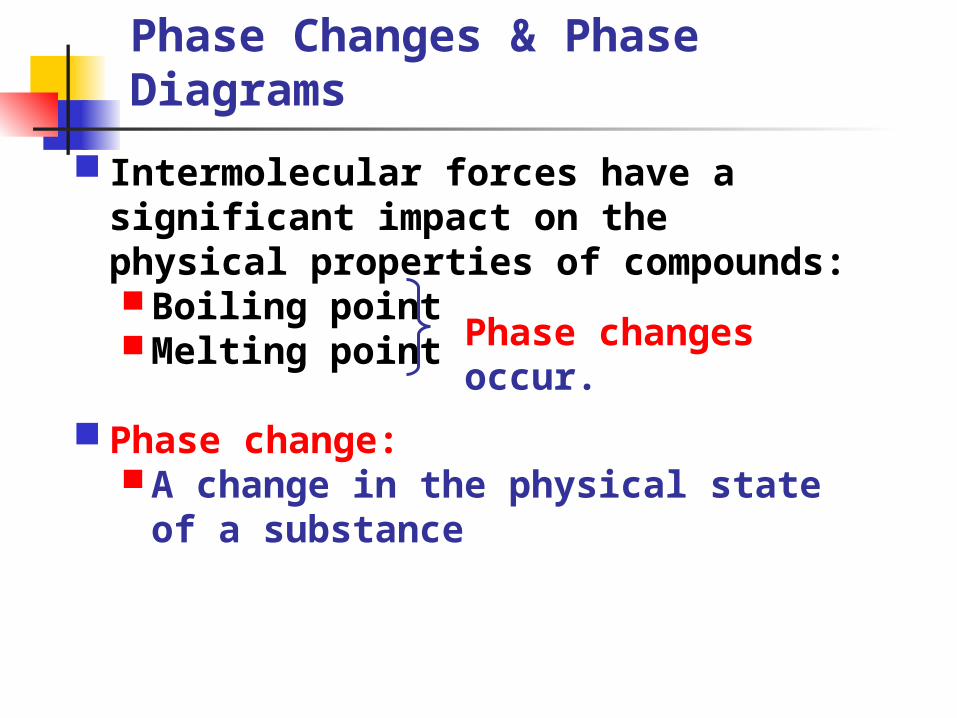
Phase Changes & Phase Diagrams Intermolecular forces have a significant impact on the physical properties of compounds: Boiling point Melting point Phase change: A change in the physical state of a substance Phase changes occur.
-
Upload
autumn-burke -
Category
Documents
-
view
112 -
download
0
description
Phase Changes & Phase Diagrams. Intermolecular forces have a significant impact on the physical properties of compounds: Boiling point Melting point Phase change: A change in the physical state of a substance. Phase changes occur. Phase Changes & Phase Diagrams. - PowerPoint PPT Presentation
Transcript of Phase Changes & Phase Diagrams
Phase Changes & Phase Diagrams
Intermolecular forces have a significant impact on the physical properties of compounds: Boiling point Melting point
Phase change: A change in the physical state of a
substance
Phase changes occur.
Phase Changes & Phase Diagrams
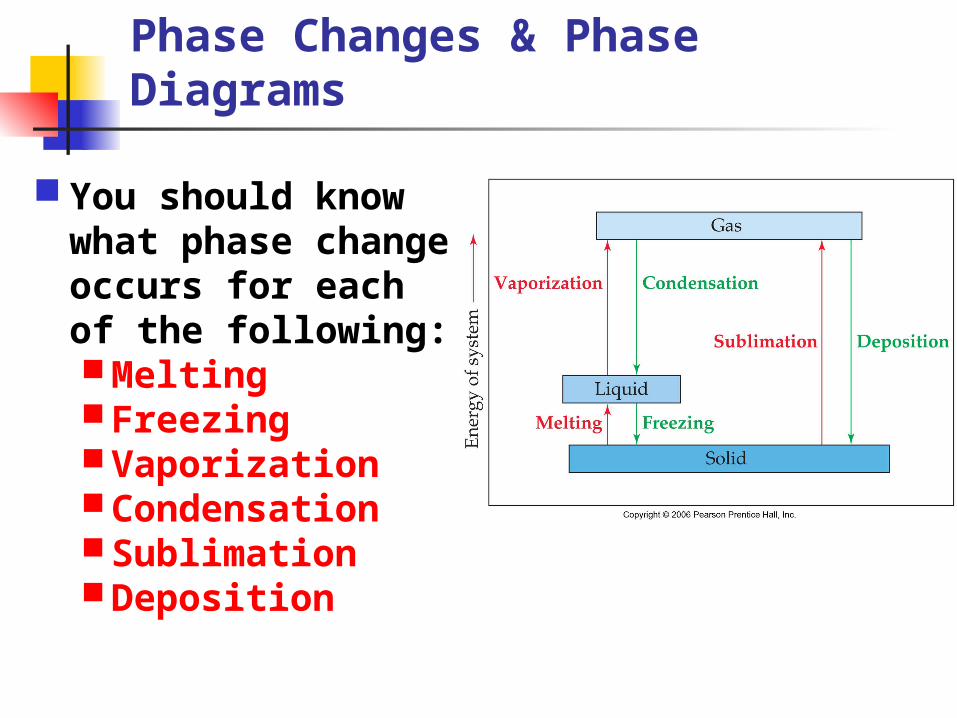
You should know what phase change occurs for each of the following: Melting Freezing Vaporization Condensation Sublimation Deposition
Phase Changes & Phase Diagrams
Melting: Solid Liquid
Freezing: Liquid Solid
Vaporization Liquid Gas
Condensation Gas Liquid
Phase Changes & Phase Diagrams
Sublimation Solid Gas
Deposition Gas Solid
Phase Changes & Phase Diagrams
Every phase change is accompanied by a change in the energy of the system. Heat of fusion (Hfus)
Enthalpy change required to change a solid at its melting point to a liquid at the same temperature
Heat of vaporization (Hvap)Enthalpy change required to change a
liquid at its boiling point to a gas at the same temperature
Phase Changes & Phase Diagrams
Heat of Sublimation (Hsub) Enthalpy change required to transform
a solid directly into the gas phase
During a phase change, the two phases exist in equilibrium. At the melting point, solid and liquid
phases are in equilibrium. At the boiling point, liquid and gas
phases are in equilibrium.

Phase Changes & Phase Diagrams
The heat added to the system at the melting and boiling points goes into pulling the molecules farther apart from each other.
The temperature of the substance does not rise during a phase change.
Phase Changes & Phase Diagrams
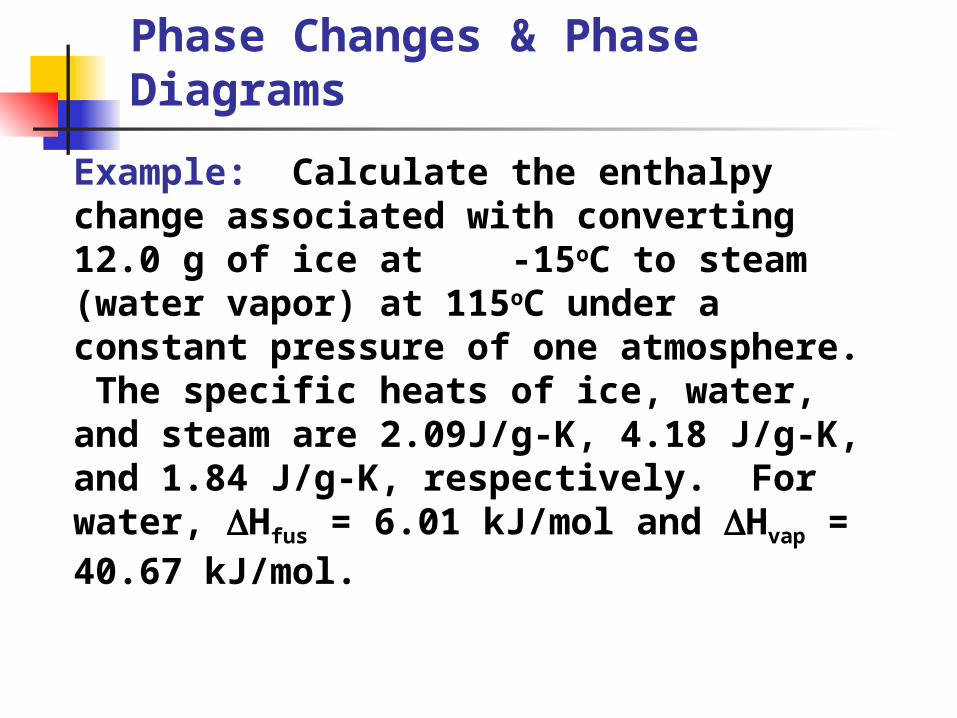
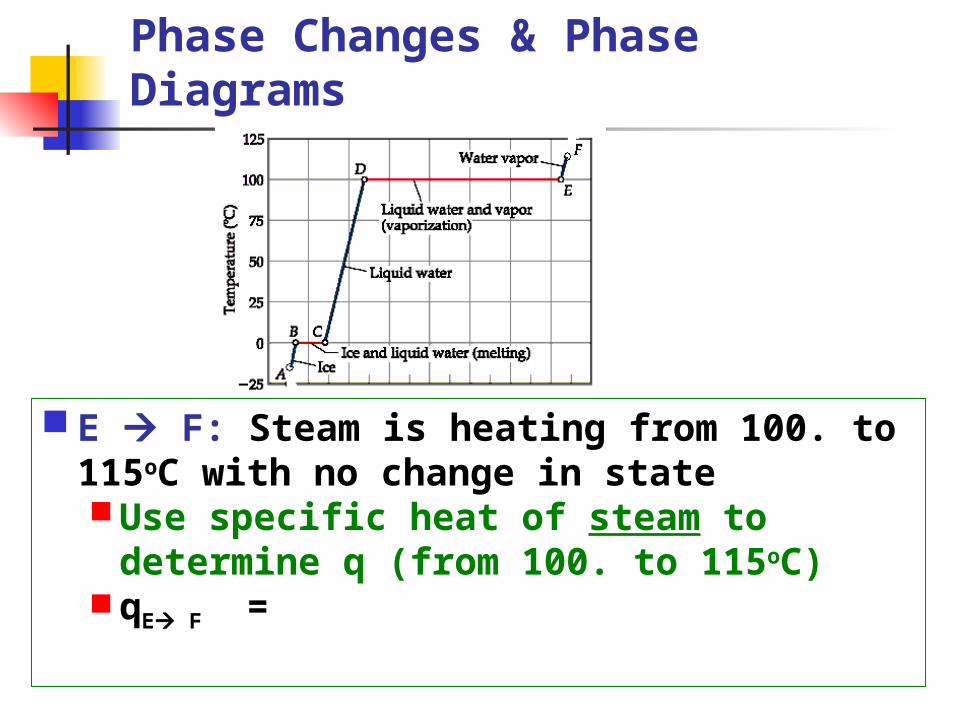
Example: Calculate the enthalpy change associated with converting 12.0 g of ice at -15oC to steam (water vapor) at 115oC under a constant pressure of one atmosphere. The specific heats of ice, water, and steam are 2.09J/g-K, 4.18 J/g-K, and 1.84 J/g-K, respectively. For water, Hfus = 6.01 kJ/mol and Hvap = 40.67 kJ/mol.

Phase Changes & Phase Diagrams
A B: Ice is heating from -15oC to 0.oC with no change in state Use specific heat of ice to determine q
(from -15 to 0.oC) qA B =
Phase Changes & Phase Diagrams
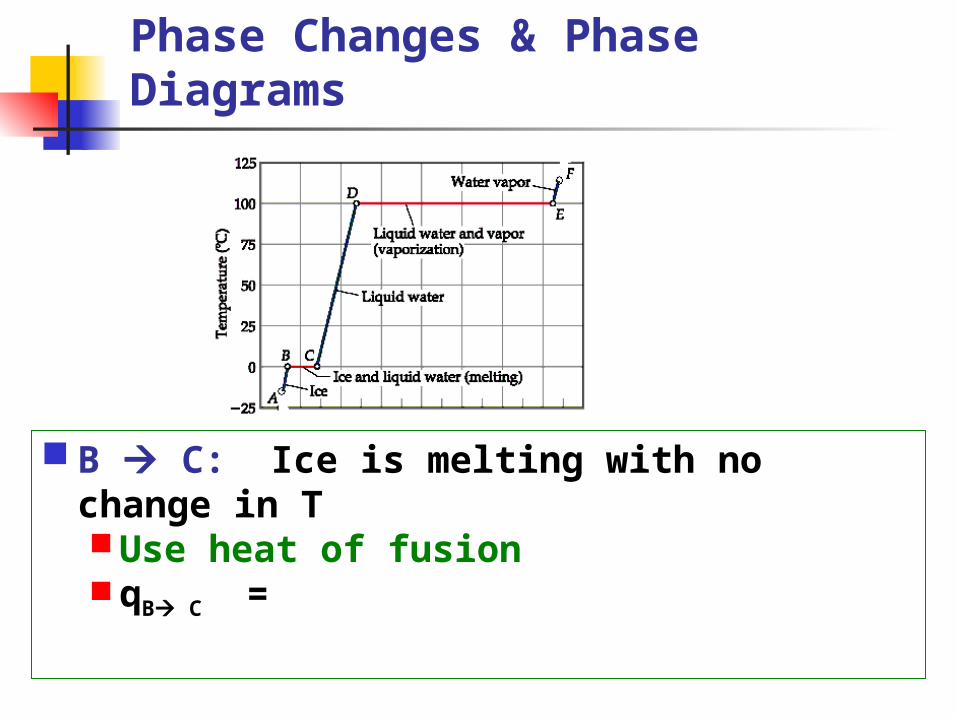
B C: Ice is melting with no change in T Use heat of fusion qB C =
Phase Changes & Phase Diagrams
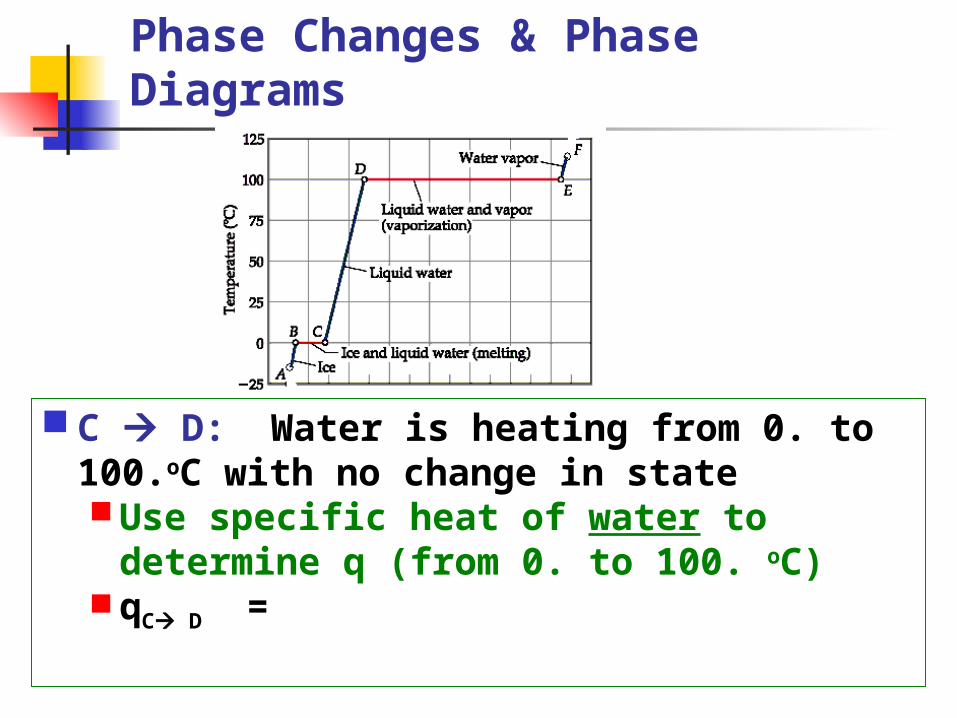
C D: Water is heating from 0. to 100.oC with no change in state Use specific heat of water to determine q
(from 0. to 100. oC) qC D =
Phase Changes & Phase Diagrams
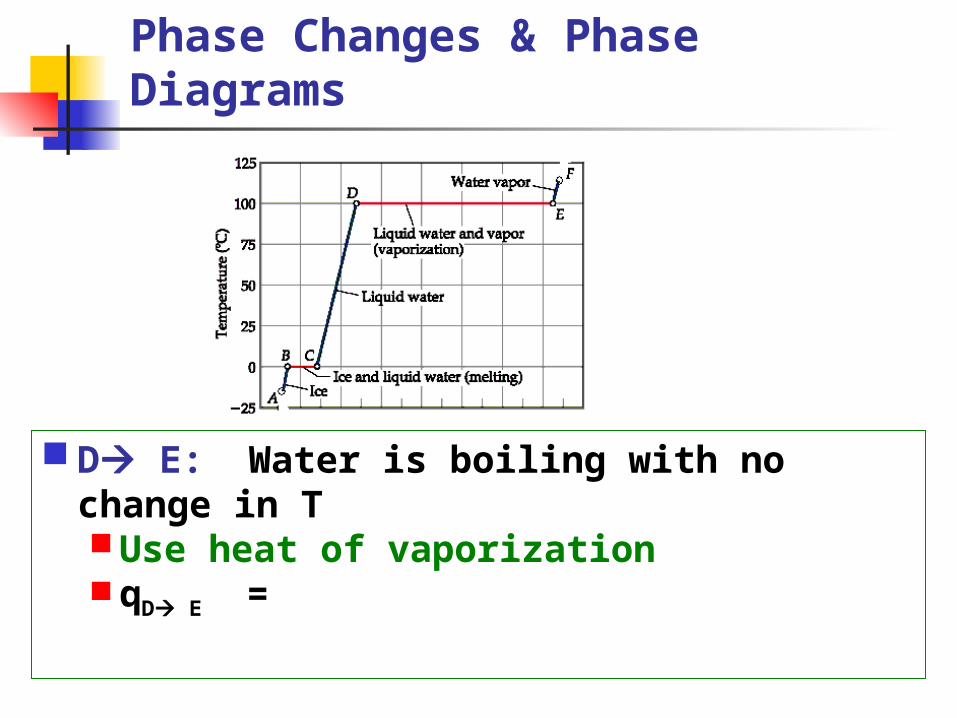
D E: Water is boiling with no change in T Use heat of vaporization qD E =
Phase Changes & Phase Diagrams
E F: Steam is heating from 100. to 115oC with no change in state Use specific heat of steam to determine q
(from 100. to 115oC) qE F =
Phase Changes & Phase Diagrams
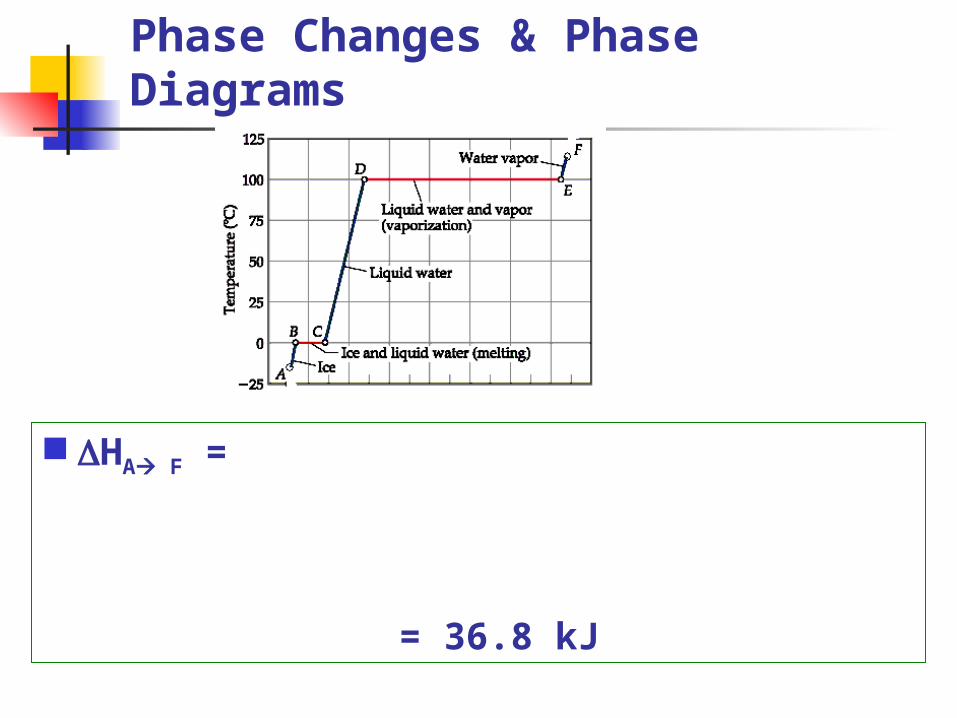
HA F =
= 36.8 kJ
Phase Changes & Phase Diagrams
What would you do differently if the problem asked to calculate the enthalpy change to convert 12.0 g of steam at 115oC to ice at -115oC?
You should be able to handle both types of problems.
Phase Changes and Phase Diagrams
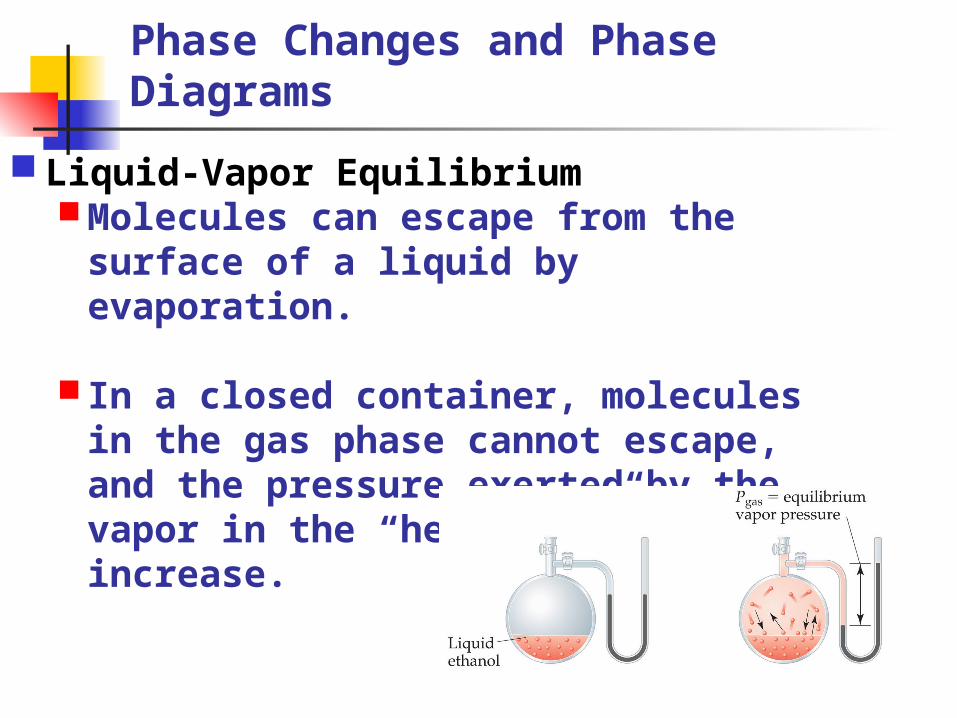
Liquid-Vapor Equilibrium Molecules can escape from the surface of a
liquid by evaporation.
In a closed container, molecules in the gas phase cannot escape, and the pressure exerted by the vapor in the “headspace” begins to increase.

Phase Changes and Phase Diagrams
Liquid-Vapor Equilibrium The liquid and vapor reach a state of dynamic
equilibrium:liquid molecules evaporate and vapor
molecules condense at the same rate.
The vapor pressure reaches a constant value.
Vapor pressure: pressure exerted by a vapor when the liquid and vapor states are in dynamic equilibrium.
Phase Changes and Phase Diagrams
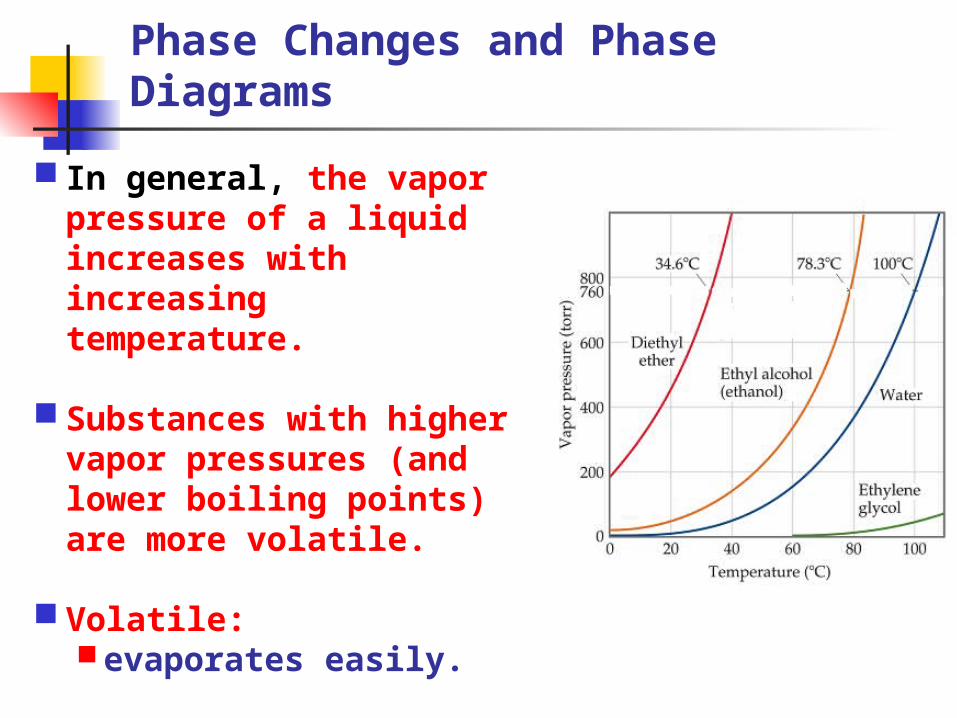
In general, the vapor pressure of a liquid increases with increasing temperature.
Substances with higher vapor pressures (and lower boiling points) are more volatile.
Volatile: evaporates easily.
Phase Changes and Phase Diagrams
Example: Which of the compounds on the previous slide is most volatile at room temperature: diethyl ether, ethyl alcohol, or water? Which one has the strongest intermolecular forces? (How do you know?) What types of intermolecular forces exist in each molecule.Most volatile:
Strongest intermolecular forces:
Type of forces:

Phase Changes and Phase Diagrams
Why does water boil at 94.5oC in Santa Fe, New Mexico whereas it boils at 100.0oC in OKC?

Phase Changes and Phase Diagrams
Boiling point: the temperature at which
the vapor pressure of a liquid equals atmospheric pressure.
Normal boiling point: the temperature at which
the vapor pressure of a liquid equals 760. torr or 1 atm
Phase Changes and Phase Diagrams
Example: Use the graph of vapor pressure as a function of temperature to predict the normal boiling point of diethyl ether and its approximate boiling point at 200 torr and at 1000 torr.
Normal BP =
BP @ 200 torr =
BP @ 1000 torr =
Phase Changes and Phase Diagrams
Example: Bromine has a normal boiling point of 332.0K while iodine has a normal boiling point of 457.6K. Which is more volatile at room temperature? Which one has the weakest intermolecular forces at RT?
Most volatile:
Weakest Intermolecular forces:
Phase Changes and Phase Diagrams
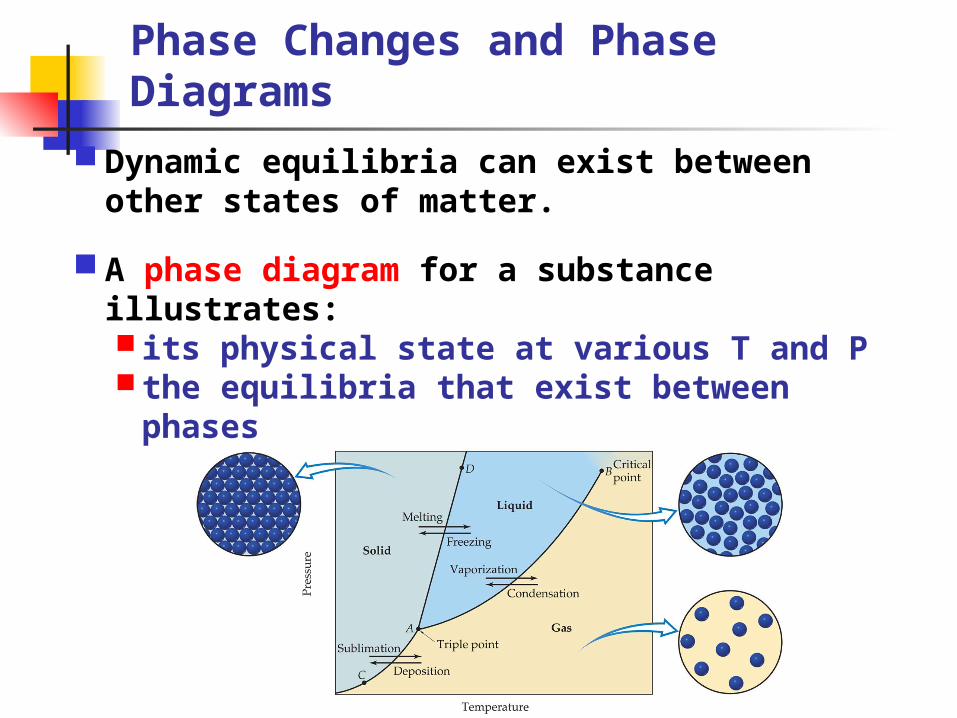
Dynamic equilibria can exist between other states of matter.
A phase diagram for a substance illustrates: its physical state at various T and P the equilibria that exist between phases
Phase Changes and Phase Diagrams
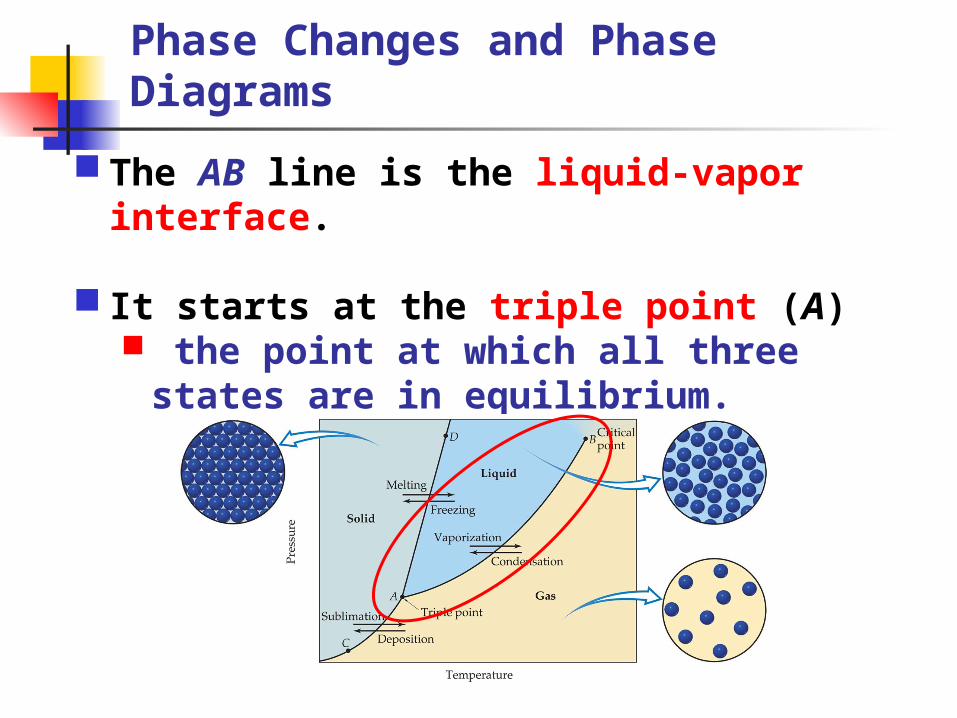
The AB line is the liquid-vapor interface.
It starts at the triple point (A) the point at which all three states are in
equilibrium.

Phase Changes and Phase Diagrams
It ends at the critical point (B); the temperature (critical temperature) and
pressure (critical pressure) above which the liquid and vapor are indistinguishable from each other
Phase Changes and Phase Diagrams
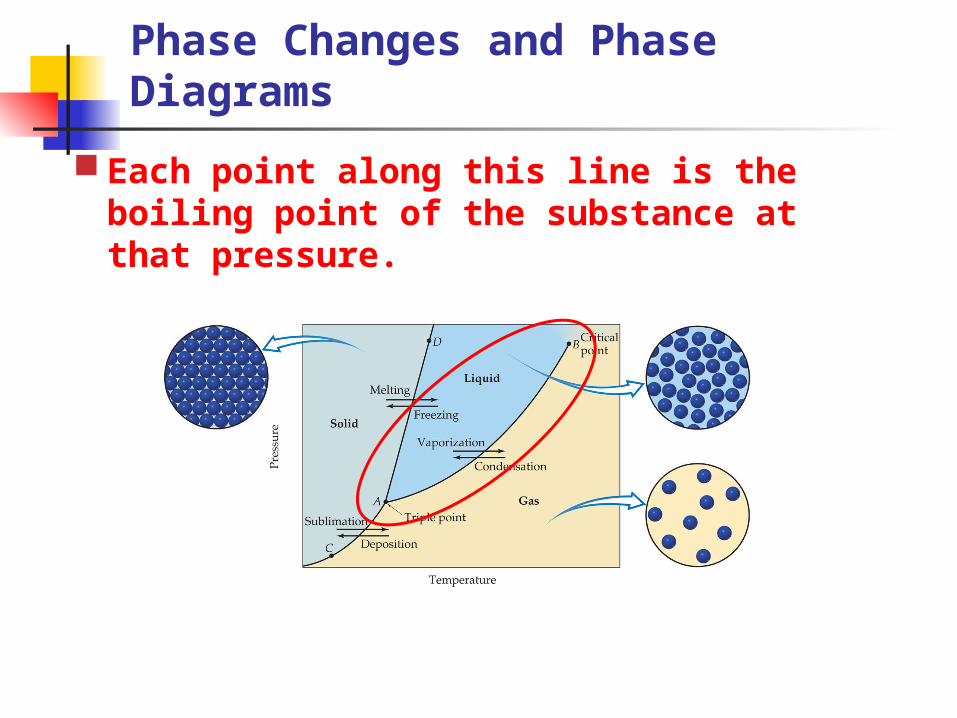
Each point along this line is the boiling point of the substance at that pressure.
Phase Changes and Phase Diagrams
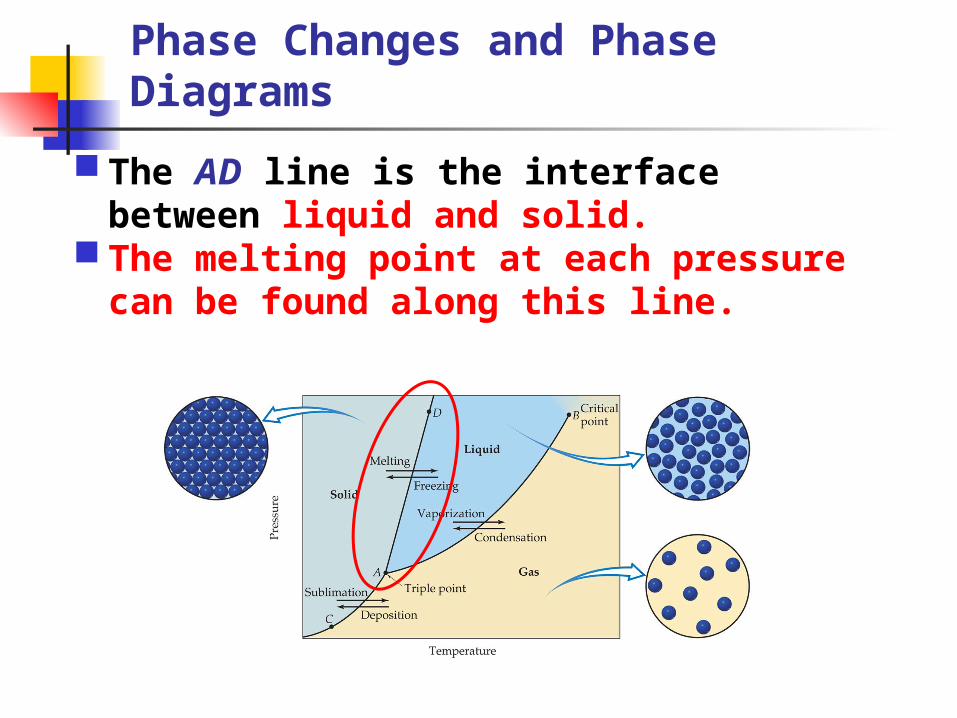
The AD line is the interface between liquid and solid.
The melting point at each pressure can be found along this line.
Phase Changes and Phase Diagrams
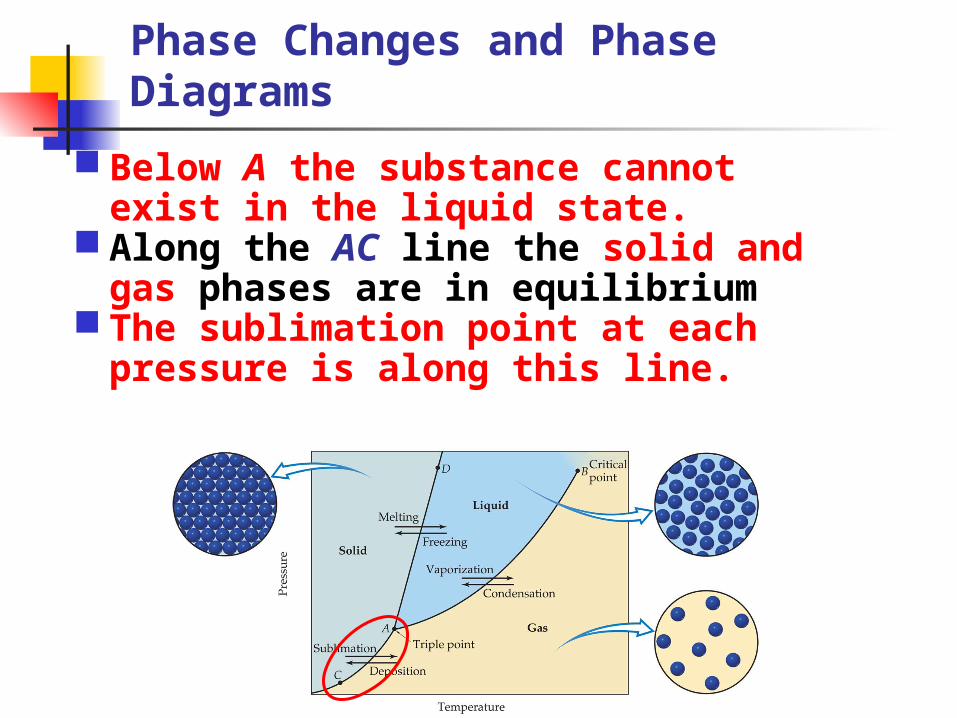
Below A the substance cannot exist in the liquid state.
Along the AC line the solid and gas phases are in equilibrium
The sublimation point at each pressure is along this line.
Phase Changes and Phase Diagrams
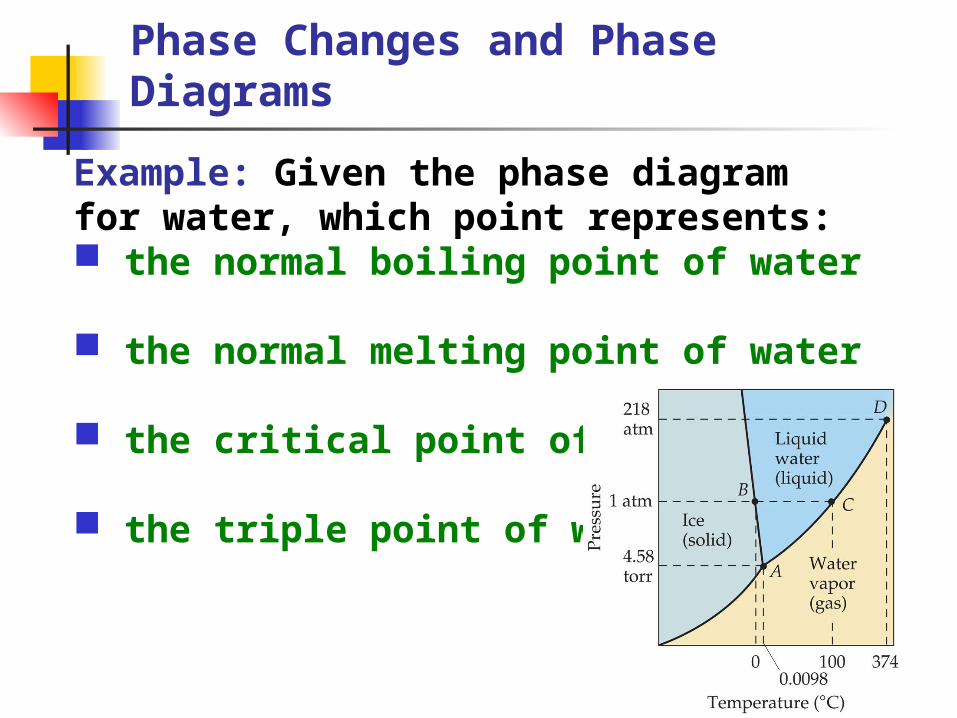
Example: Given the phase diagram for water, which point represents: the normal boiling point of water
the normal melting point of water
the critical point of water
the triple point of water

Phase Changes and Phase Diagrams
Example: Given the phase diagram for carbon dioxide, which line represents the equilibrium between: Solid and liquid?
Liquid and gas?
Solid and gas?

Phase Changes and Phase Diagrams
Example: Using this phase diagram for water, describe the changes in physical state that occur when water is maintained at 0oC while the pressure decreases from that at point 5 to that at point 1.
5:4:3:2:1:
Phase Changes and Phase Diagrams
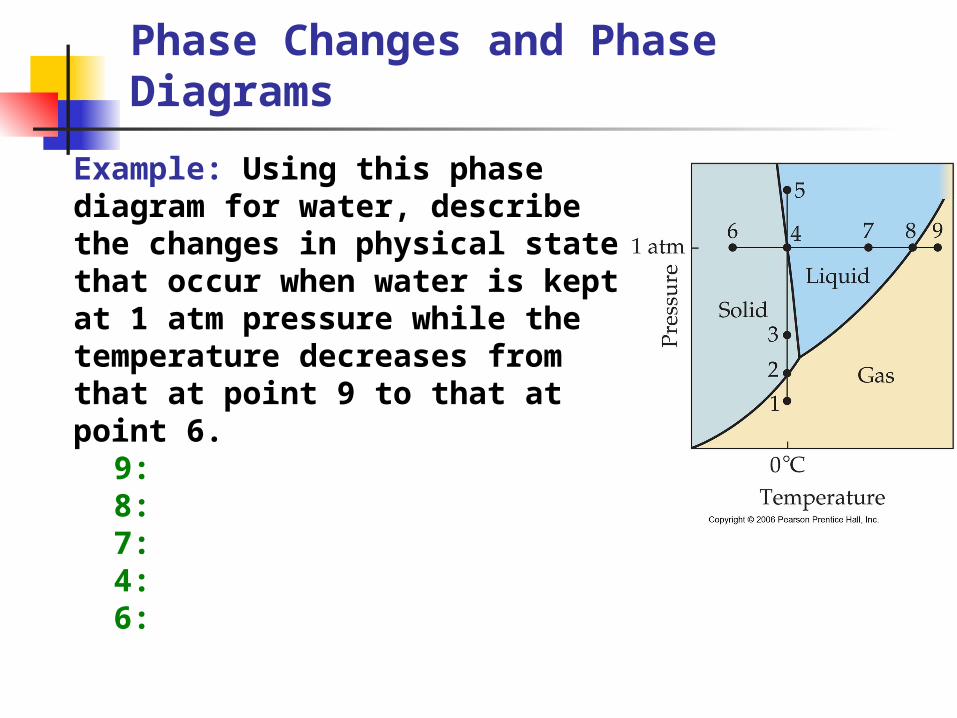
Example: Using this phase diagram for water, describe the changes in physical state that occur when water is kept at 1 atm pressure while the temperature decreases from that at point 9 to that at point 6.
9:8:7:4:6: