Lec-13 waves
23
Geotechnical Earthquake Engineering by Dr. Deepankar Choudhury Professor Department of Civil Engineering IIT Bombay, Powai, Mumbai 400 076, India. Email: [email protected] URL: http://www.civil.iitb.ac.in/~dc/ Lecture – 13
-
Upload
sri-raghavendra -
Category
Documents
-
view
11 -
download
1
description
waves
Transcript of Lec-13 waves
Geotechnical Earthquake
Engineering
by
Dr. Deepankar Choudhury
Professor
Department of Civil Engineering
IIT Bombay, Powai, Mumbai 400 076, India.
Email: [email protected]
URL: http://www.civil.iitb.ac.in/~dc/
Lecture – 13
IIT Bombay, DC 2
Module – 4
Strong Ground Motion
IIT Bombay, DC 3
Strong Ground Motion
Evaluation of the effects of earthquakes requires the
study of ground motion.
Engineering Seismology deals with vibrations related to
earthquakes, which are strong enough to cause damage
to people and environment.
The ground motions produced by earthquakes at any
particular point have 3 translational and 3 rotational
components.
In practice, generally translational components of
ground motion are measured and the rotational
components are ignored.
4
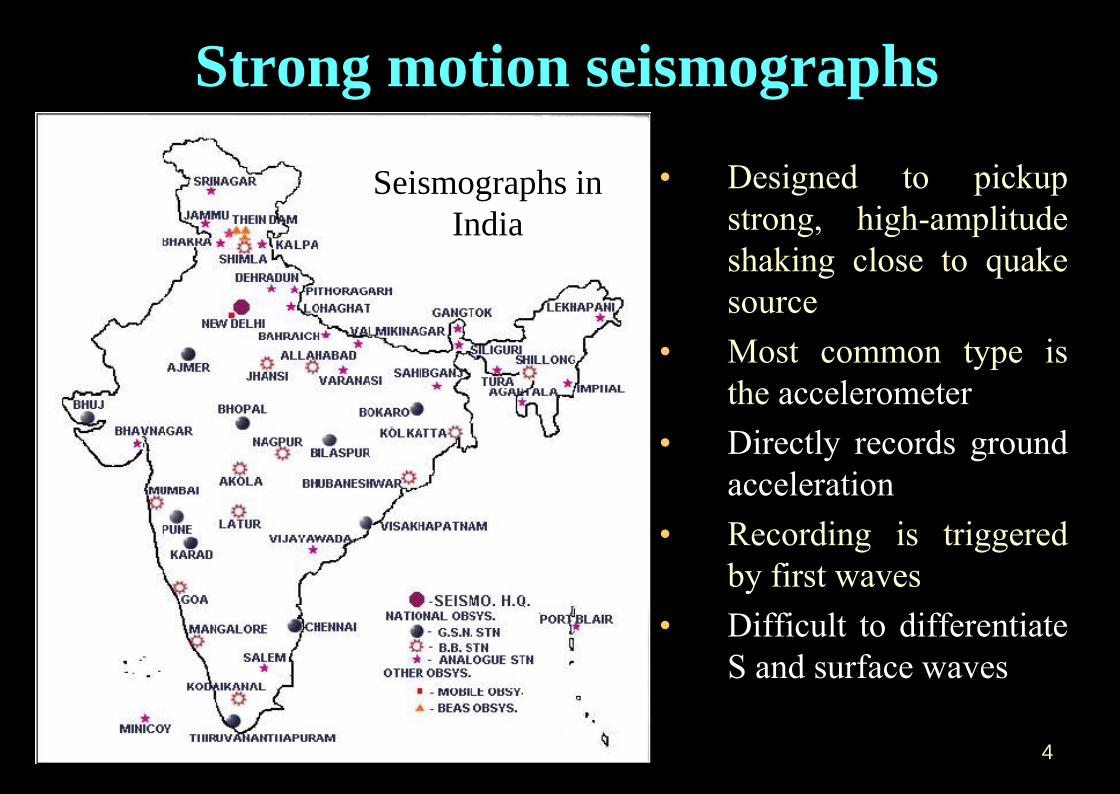
Strong motion seismographs
• Designed to pickup
strong, high-amplitude
shaking close to quake
source
• Most common type is
the accelerometer
• Directly records ground
acceleration
• Recording is triggered
by first waves
• Difficult to differentiate
S and surface waves
Seismographs in
India
IIT Bombay, DC 5
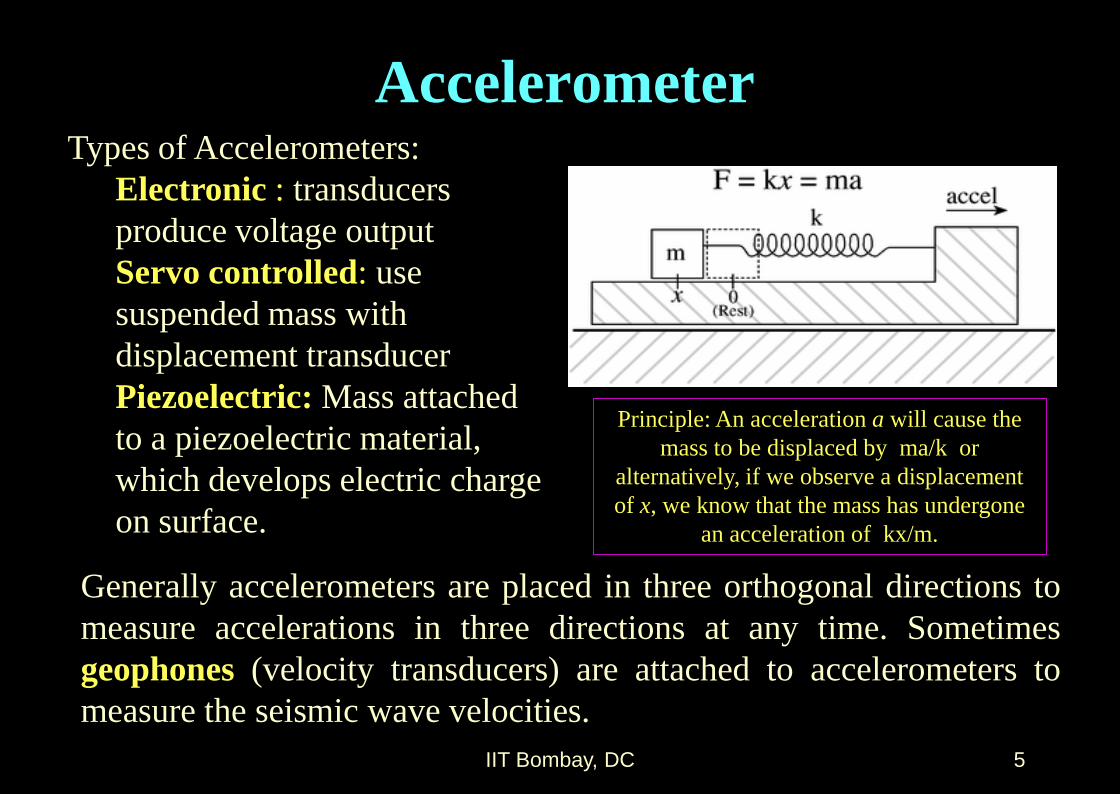
Accelerometer Types of Accelerometers:
Electronic : transducers
produce voltage output
Servo controlled: use
suspended mass with
displacement transducer
Piezoelectric: Mass attached
to a piezoelectric material,
which develops electric charge
on surface.
Generally accelerometers are placed in three orthogonal directions to
measure accelerations in three directions at any time. Sometimes
geophones (velocity transducers) are attached to accelerometers to
measure the seismic wave velocities.
Principle: An acceleration a will cause the
mass to be displaced by ma/k or
alternatively, if we observe a displacement
of x, we know that the mass has undergone
an acceleration of kx/m.
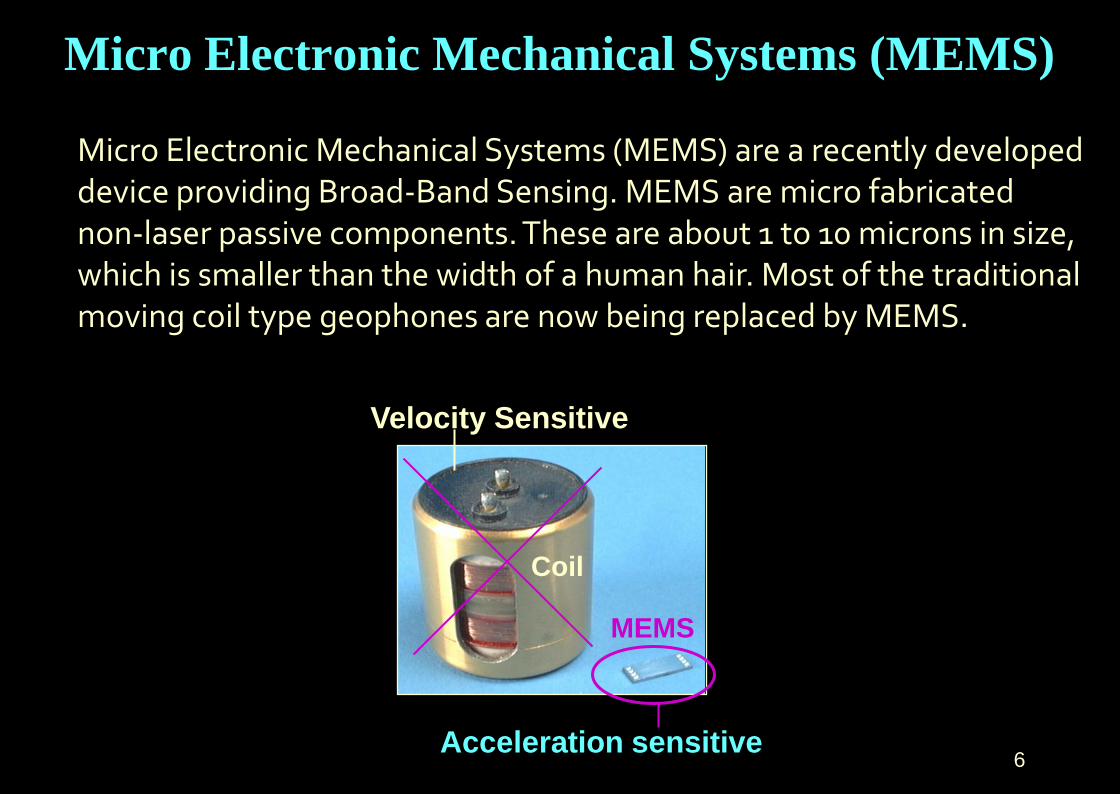
Micro Electronic Mechanical Systems (MEMS)
Micro Electronic Mechanical Systems (MEMS) are a recently developed device providing Broad-Band Sensing. MEMS are micro fabricated non-laser passive components. These are about 1 to 10 microns in size, which is smaller than the width of a human hair. Most of the traditional moving coil type geophones are now being replaced by MEMS.
Coil
Velocity Sensitive
MEMS
Acceleration sensitive 6
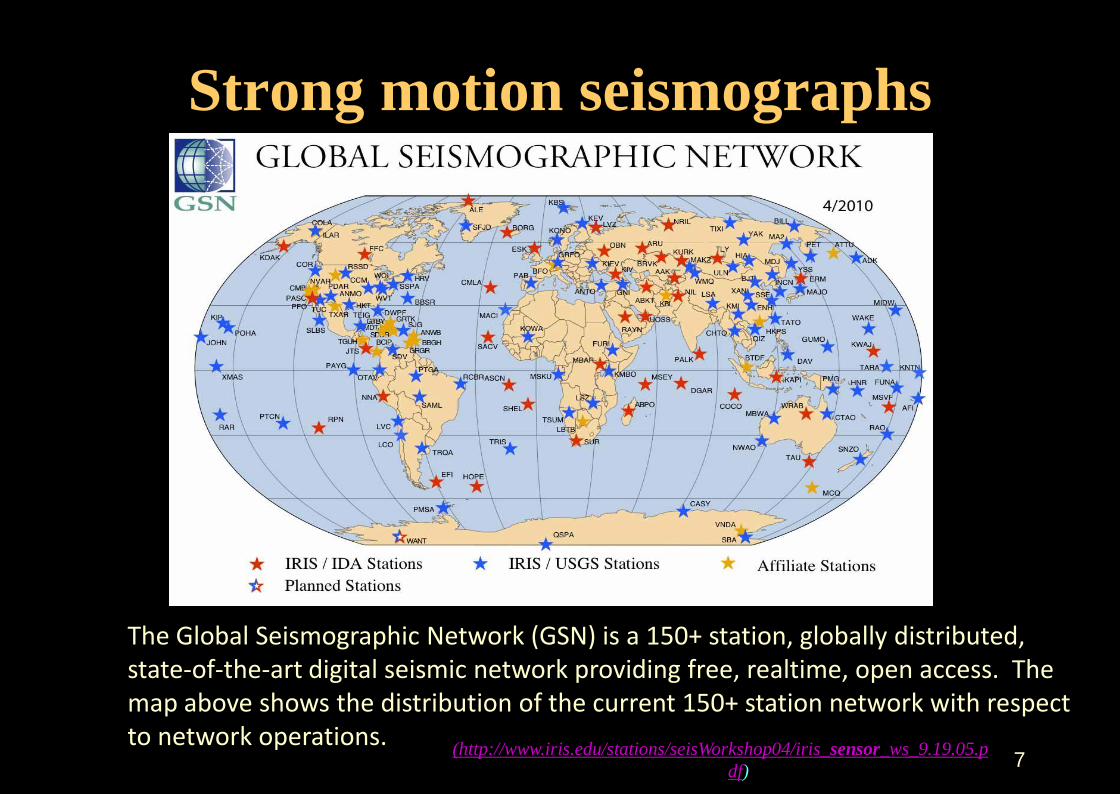
Strong motion seismographs
The Global Seismographic Network (GSN) is a 150+ station, globally distributed, state-of-the-art digital seismic network providing free, realtime, open access. The map above shows the distribution of the current 150+ station network with respect to network operations.
7 (http://www.iris.edu/stations/seisWorkshop04/iris_sensor_ws_9.19.05.p
df)
IIT Bombay, DC 8
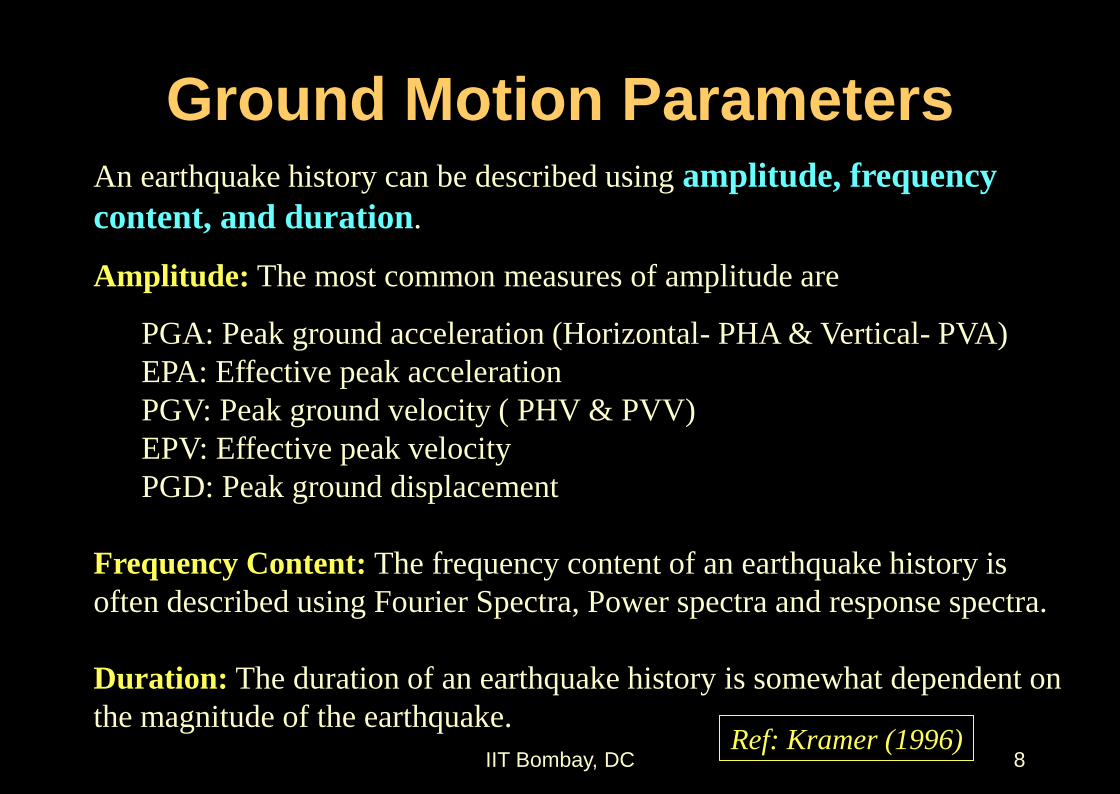
An earthquake history can be described using amplitude, frequency
content, and duration.
Amplitude: The most common measures of amplitude are
PGA: Peak ground acceleration (Horizontal- PHA & Vertical- PVA)
EPA: Effective peak acceleration
PGV: Peak ground velocity ( PHV & PVV)
EPV: Effective peak velocity
PGD: Peak ground displacement
Frequency Content: The frequency content of an earthquake history is
often described using Fourier Spectra, Power spectra and response spectra.
Duration: The duration of an earthquake history is somewhat dependent on
the magnitude of the earthquake.
Ground Motion Parameters
Ref: Kramer (1996)
IIT Bombay, DC 9
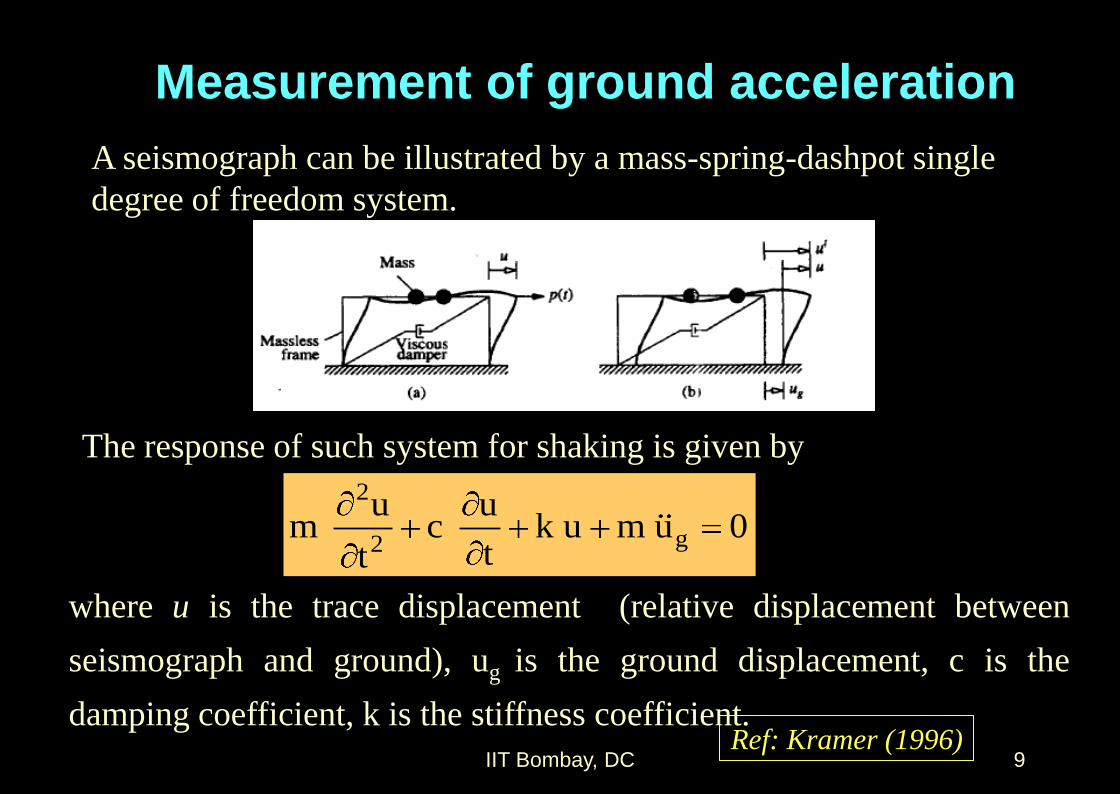
Measurement of ground acceleration
A seismograph can be illustrated by a mass-spring-dashpot single
degree of freedom system.
2
g2
u um c k u m u 0
tt
where u is the trace displacement (relative displacement between
seismograph and ground), ug is the ground displacement, c is the
damping coefficient, k is the stiffness coefficient.
The response of such system for shaking is given by
Ref: Kramer (1996)
IIT Bombay, DC 10
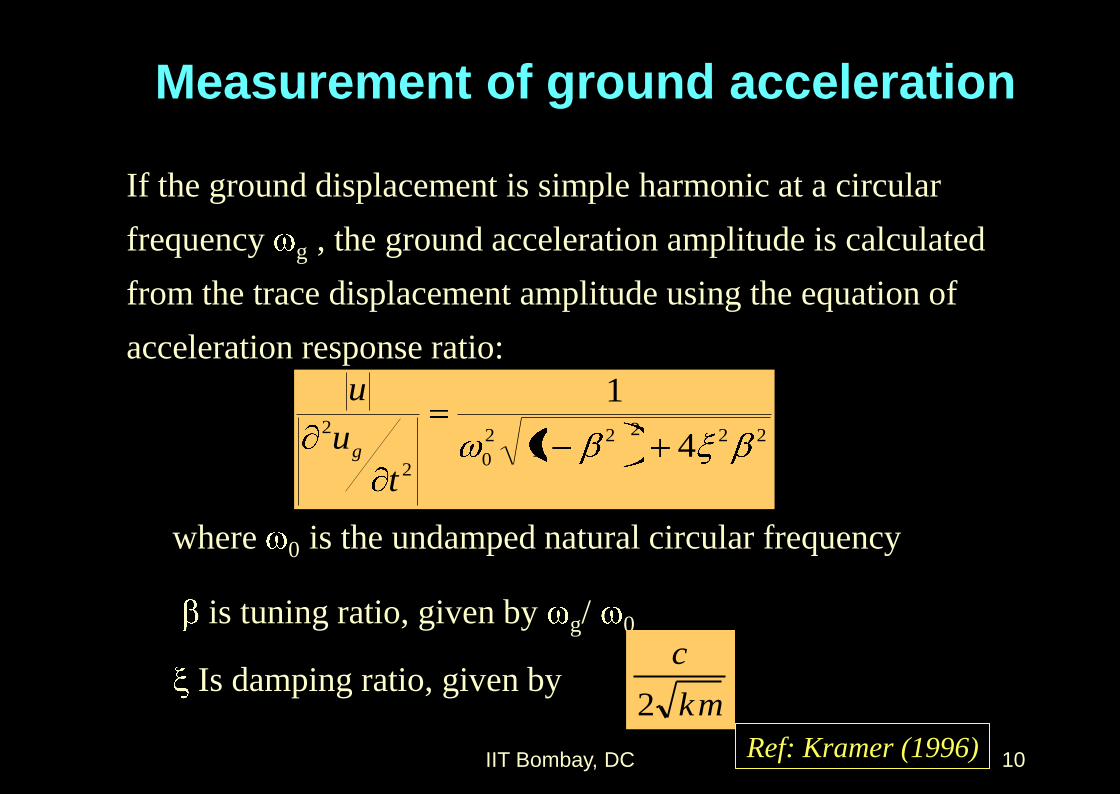
Measurement of ground acceleration
If the ground displacement is simple harmonic at a circular
frequency g , the ground acceleration amplitude is calculated
from the trace displacement amplitude using the equation of
acceleration response ratio:
22222
02
2
41
1
t
u
u
g
where 0 is the undamped natural circular frequency
is tuning ratio, given by g/ 0
Is damping ratio, given by km
c
2
Ref: Kramer (1996)
IIT Bombay, DC 11
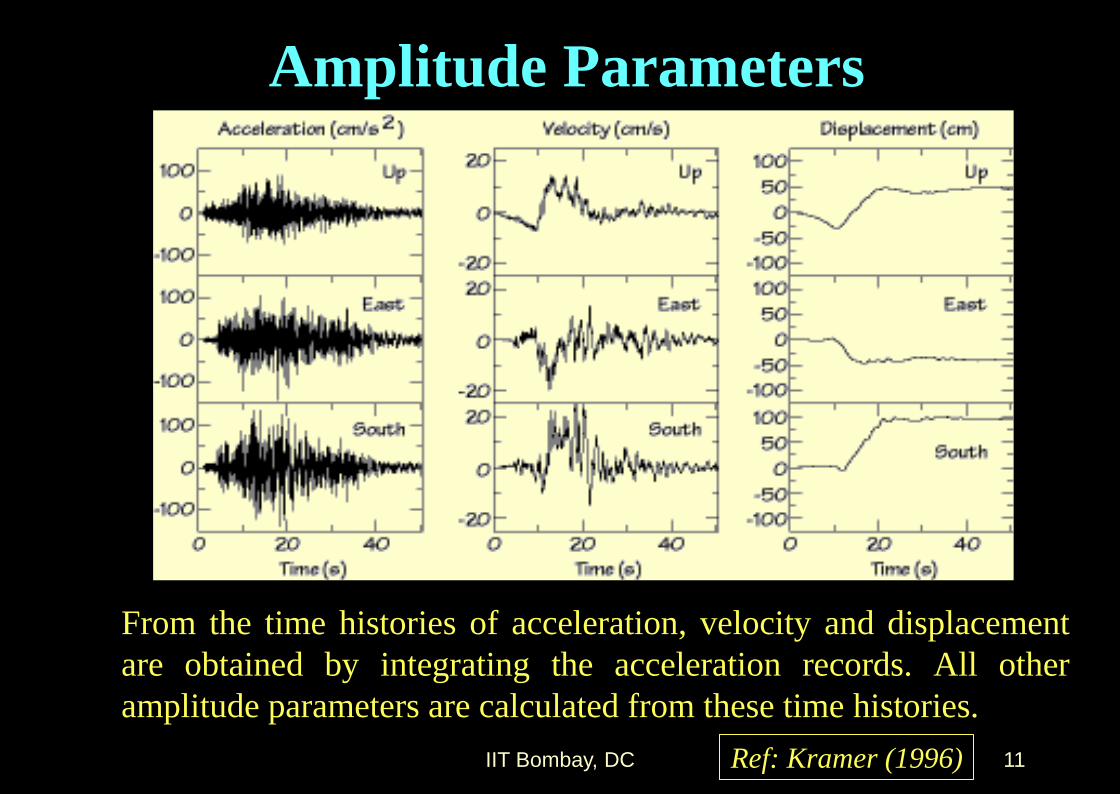
Amplitude Parameters
From the time histories of acceleration, velocity and displacement
are obtained by integrating the acceleration records. All other
amplitude parameters are calculated from these time histories.
Ref: Kramer (1996)
IIT Bombay, DC 12
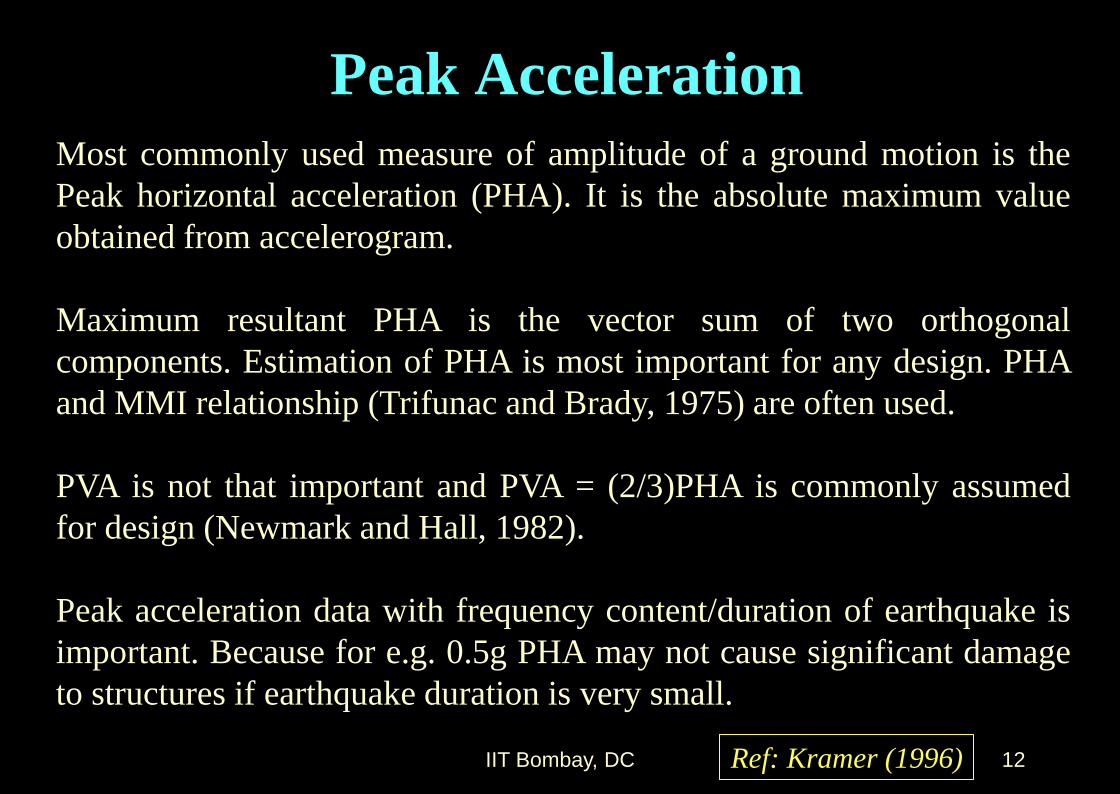
Peak Acceleration
Most commonly used measure of amplitude of a ground motion is the
Peak horizontal acceleration (PHA). It is the absolute maximum value
obtained from accelerogram.
Maximum resultant PHA is the vector sum of two orthogonal
components. Estimation of PHA is most important for any design. PHA
and MMI relationship (Trifunac and Brady, 1975) are often used.
PVA is not that important and PVA = (2/3)PHA is commonly assumed
for design (Newmark and Hall, 1982).
Peak acceleration data with frequency content/duration of earthquake is
important. Because for e.g. 0.5g PHA may not cause significant damage
to structures if earthquake duration is very small.
Ref: Kramer (1996)
IIT Bombay, DC 13
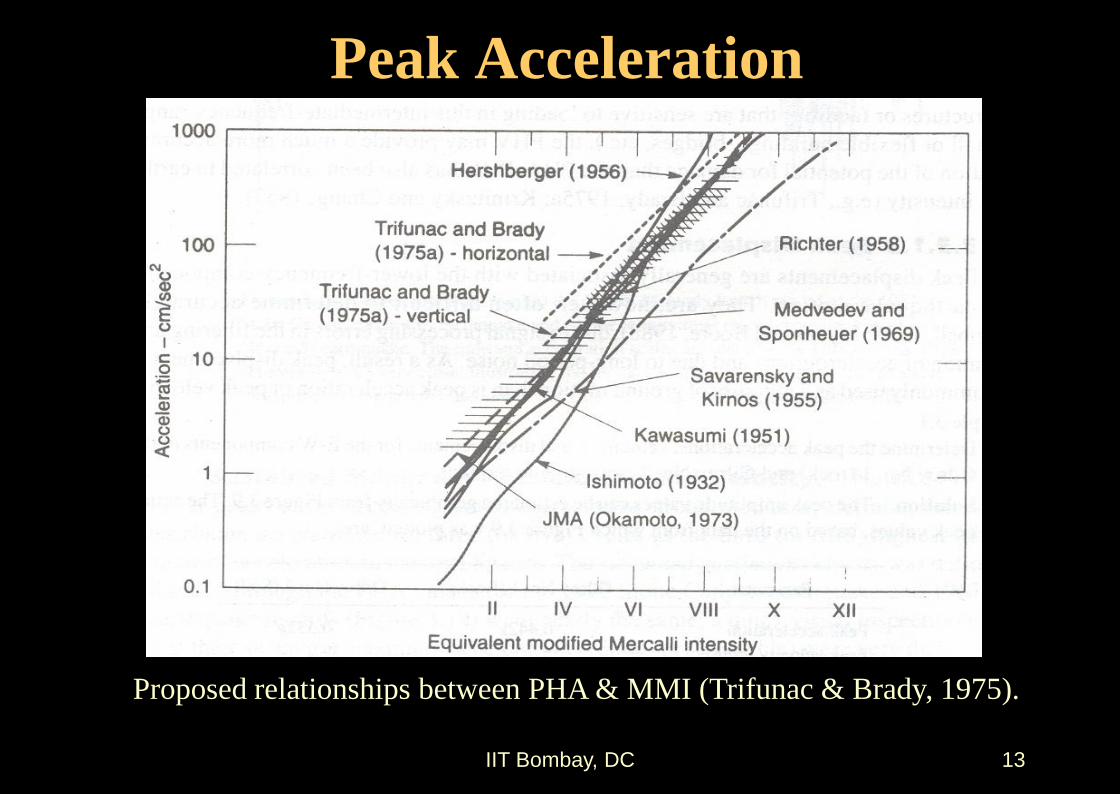
Peak Acceleration
Proposed relationships between PHA & MMI (Trifunac & Brady, 1975).
IIT Bombay, DC 14
Peak Velocity and Displacement
Peak horizontal velocity (PHV) is also used to characterize ground
motion. PHV is better than PHA for intermediate frequencies as velocity
is less sensitive to higher frequency.
For above reason, many times PHV may provide better indication for
damage than PHA. PHV and MMI relationship (Trifunac and Brady,
1975) are also used.
Peak displacements are associated with low frequency components of
earthquake motion. Hence signaling and filtering error of data is common
and hence not recommended for practical uses over PHA or PHV.
Ref: Kramer (1996)
IIT Bombay, DC 3
Other Amplitude Parameters Sustained Maximum Acceleration: The absolute values of
highest accelerations that sustained for 3 and 5 cycles in
acceleration time history are defined as 3-cycle sustained and 5-
cycle sustained accelerations respectively.
Effective Design Acceleration: The acceleration which is
effective in causing structural damage. This depends on size of
loaded area, weight, damping and stiffness properties of structure
and its location with respect to epicenter.
Kennedy (1980) proposed EDA as 25% higher than 3-cycle PHA
recorded in filtered time history.
Benjamin and Associates (1988) proposed EDA as the PHA after
filtering out accelerations above 8-9 Hz.
Ref: Kramer (1996)
IIT Bombay, DC 4
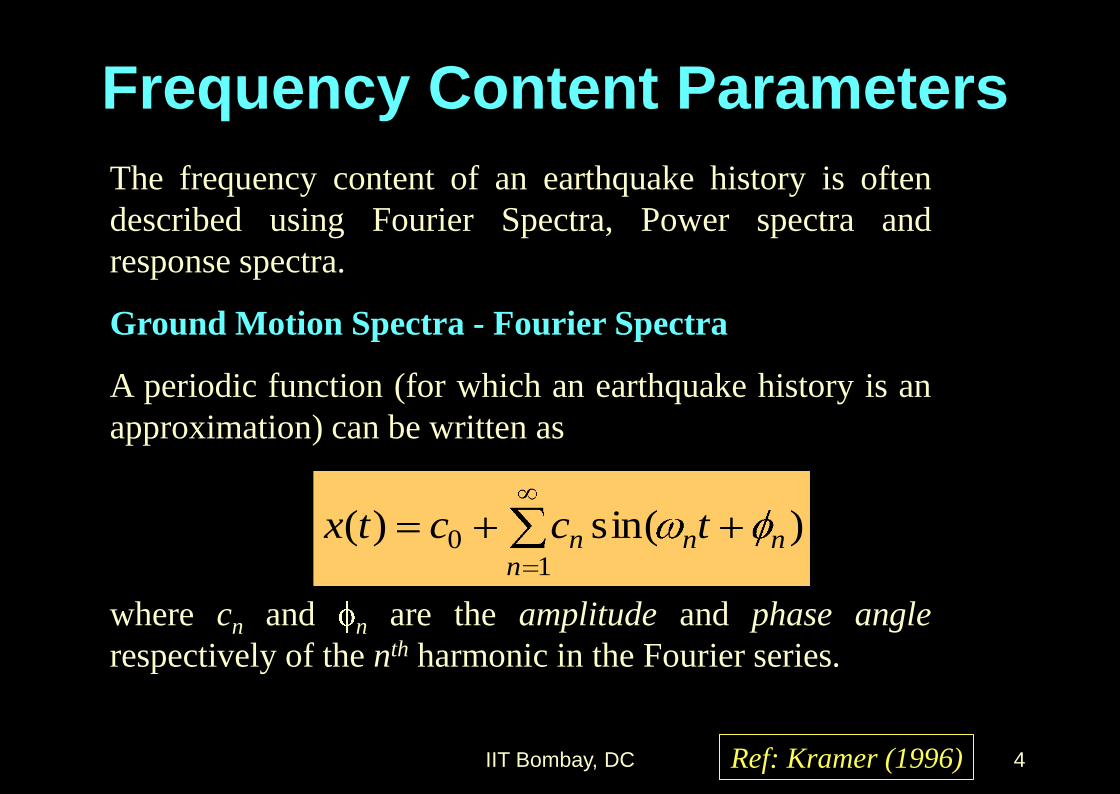
Frequency Content Parameters
The frequency content of an earthquake history is often
described using Fourier Spectra, Power spectra and
response spectra.
Ground Motion Spectra - Fourier Spectra
A periodic function (for which an earthquake history is an
approximation) can be written as
where cn and n are the amplitude and phase angle
respectively of the nth harmonic in the Fourier series.
)sin()(1
0 nnn
n tcctx
Ref: Kramer (1996)
IIT Bombay, DC 5
Frequency Content Parameters
The Fourier amplitude spectrum is a plot of cn versus n
Shows how the amplitude of the motion varies with
frequency.
Expresses the frequency content of a motion
The Fourier phase spectrum is a plot of n versus n
Phase angles control the times at which the peaks of
harmonic motion occur.
Fourier phase spectrum is influenced by the variation of
ground motion with time.
Ref: Kramer (1996)
IIT Bombay, DC 6
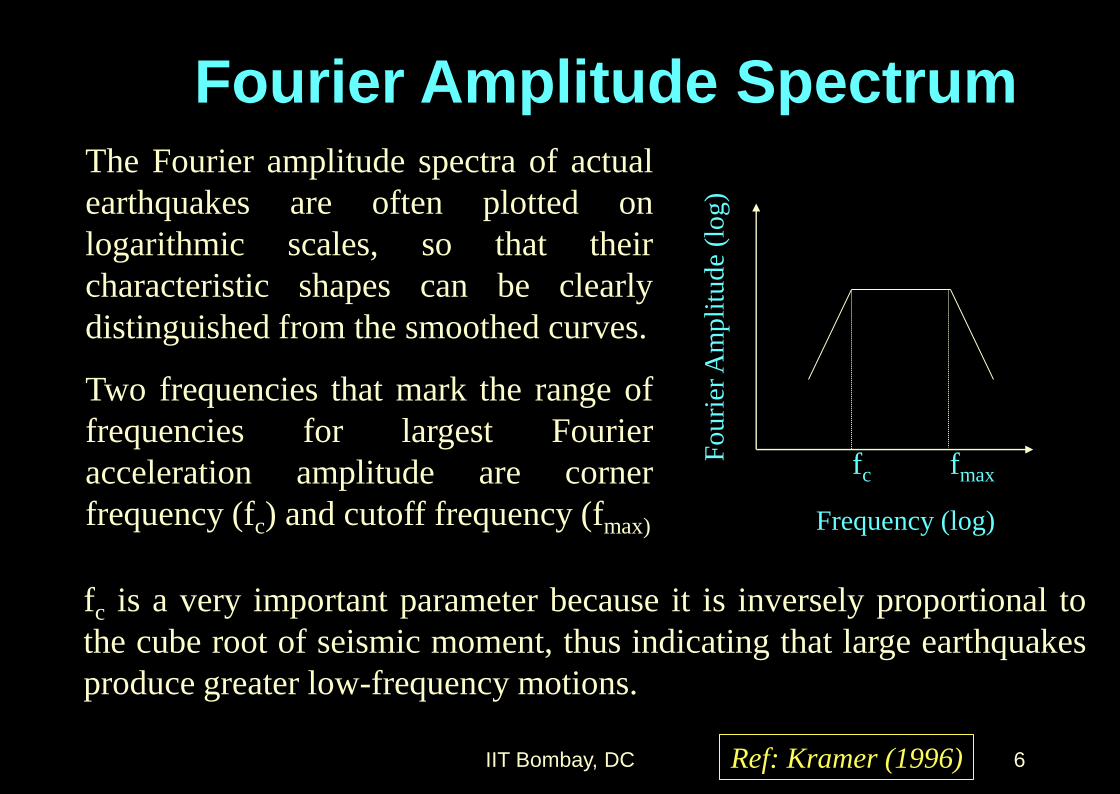
Fourier Amplitude Spectrum
fc fmax
Frequency (log)
Fou
rier
Am
pli
tud
e (l
og)
The Fourier amplitude spectra of actual
earthquakes are often plotted on
logarithmic scales, so that their
characteristic shapes can be clearly
distinguished from the smoothed curves.
Two frequencies that mark the range of
frequencies for largest Fourier
acceleration amplitude are corner
frequency (fc) and cutoff frequency (fmax)
fc is a very important parameter because it is inversely proportional to
the cube root of seismic moment, thus indicating that large earthquakes
produce greater low-frequency motions.
Ref: Kramer (1996)
IIT Bombay, DC 7
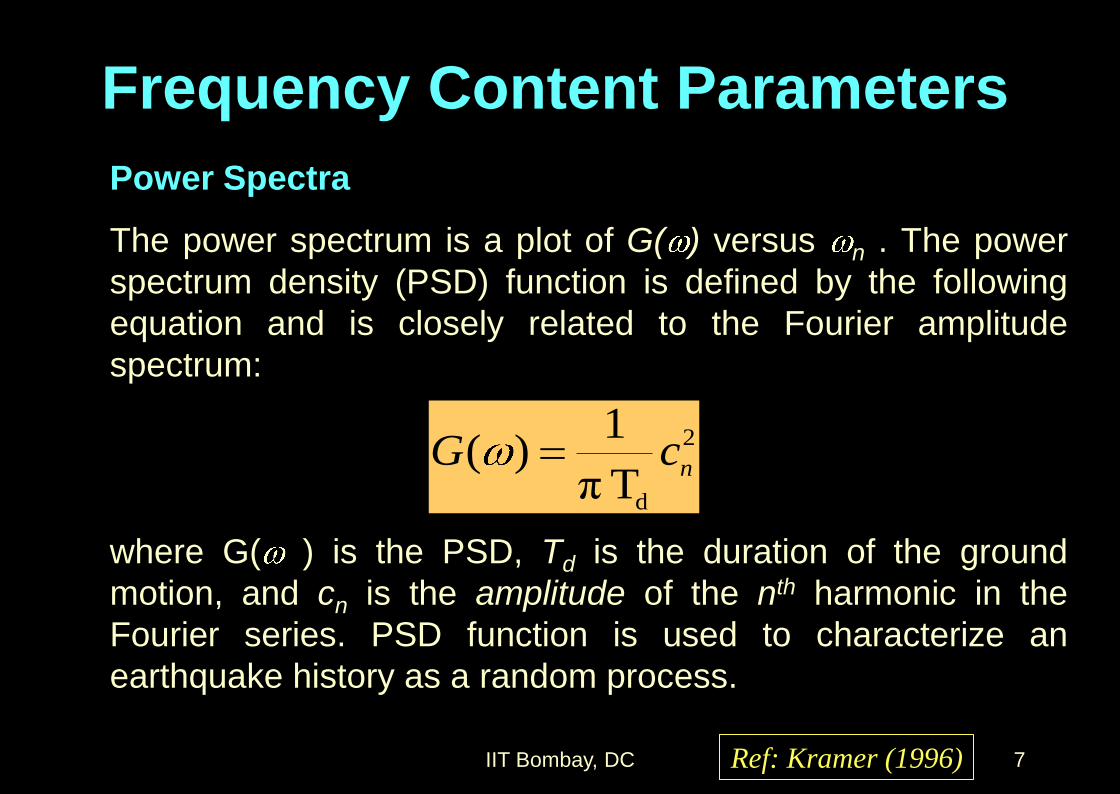
Frequency Content Parameters
Power Spectra
The power spectrum is a plot of G( ) versus n . The power
spectrum density (PSD) function is defined by the following
equation and is closely related to the Fourier amplitude
spectrum:
where G( ) is the PSD, Td is the duration of the ground
motion, and cn is the amplitude of the nth harmonic in the
Fourier series. PSD function is used to characterize an
earthquake history as a random process.
2
dT π
1)(
ncG
Ref: Kramer (1996)
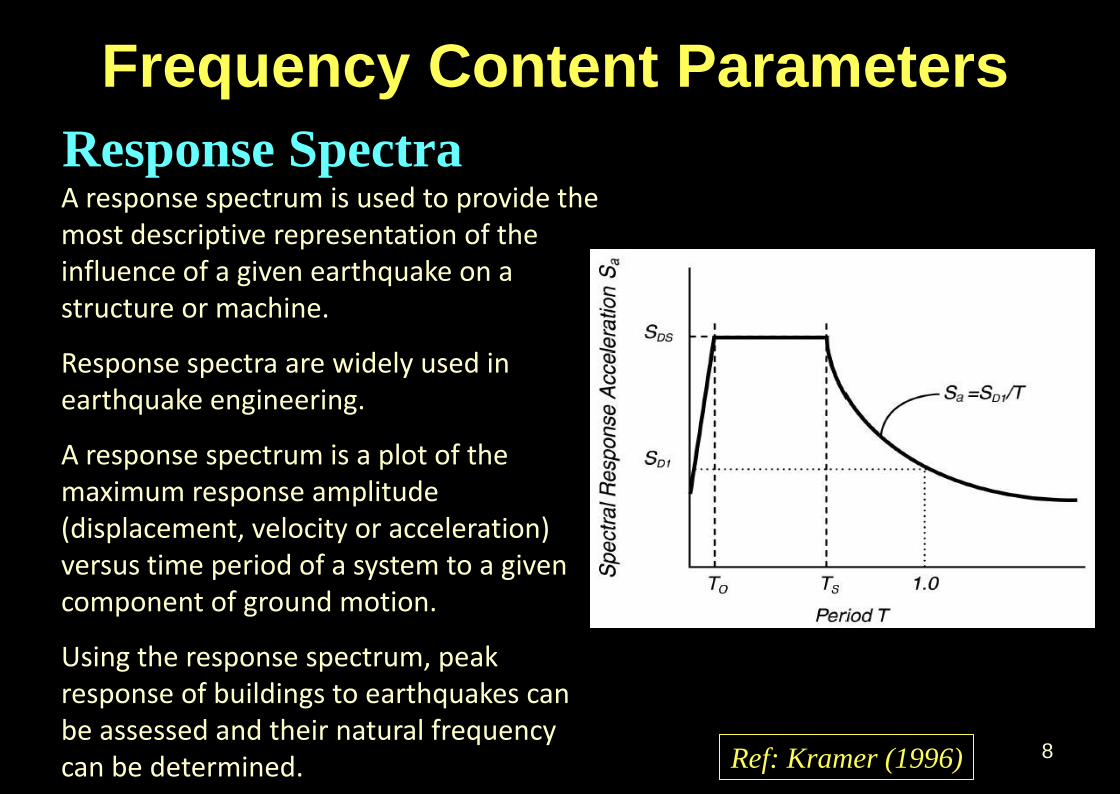
A response spectrum is used to provide the most descriptive representation of the influence of a given earthquake on a structure or machine.
Response spectra are widely used in earthquake engineering.
A response spectrum is a plot of the maximum response amplitude (displacement, velocity or acceleration) versus time period of a system to a given component of ground motion.
Using the response spectrum, peak response of buildings to earthquakes can be assessed and their natural frequency can be determined.
Response Spectra
8
Frequency Content Parameters
Ref: Kramer (1996)
IIT Bombay, DC 9
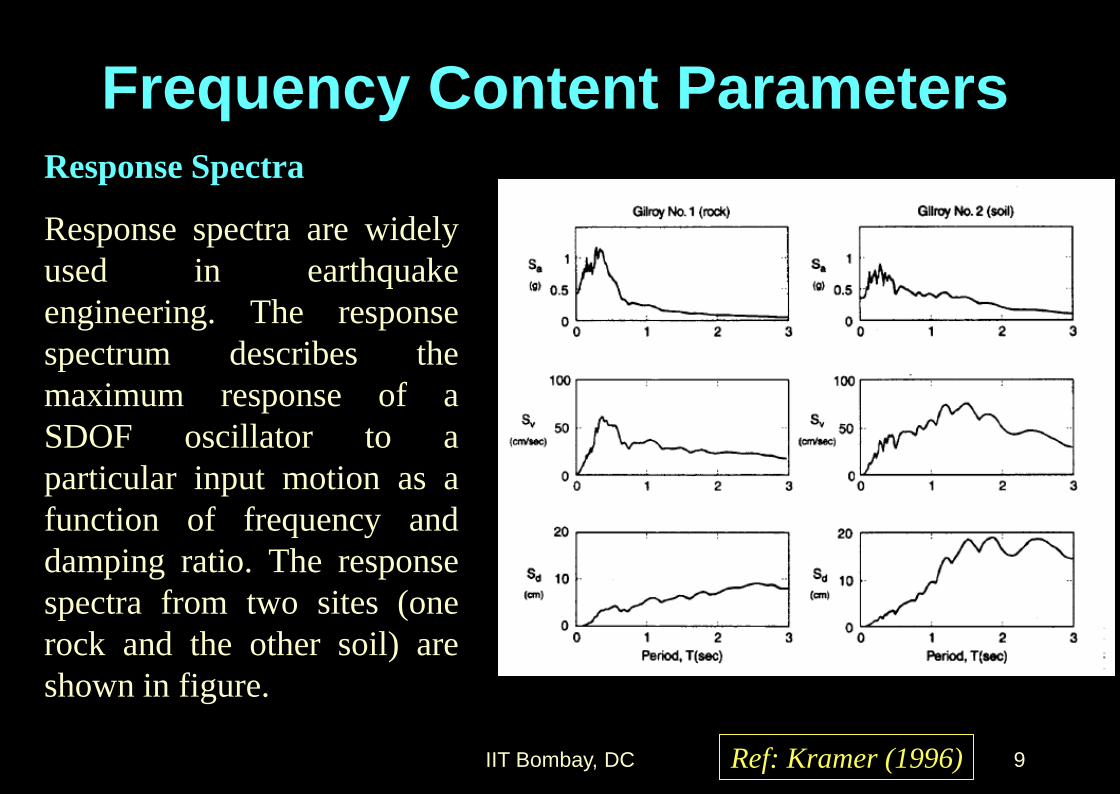
Response Spectra
Response spectra are widely
used in earthquake
engineering. The response
spectrum describes the
maximum response of a
SDOF oscillator to a
particular input motion as a
function of frequency and
damping ratio. The response
spectra from two sites (one
rock and the other soil) are
shown in figure.
Frequency Content Parameters
Ref: Kramer (1996)
IIT Bombay, DC 10
Duration of an earthquake is very important parameter that influences the
amount of damage due to earthquake. A strong motion of very high
amplitude of short duration may not cause as much damage to a structure
as a motion with moderate amplitude with long duration can cause. This
is because the ground motion with long duration causes more load
reversals, which is important in the degradation of stiffness of the
structures and in building up pore pressures in loose saturated soils.
Duration represents the time required for the release of accumulated
strain energy along a fault, thus increases with increase in magnitude of
earthquake.
Relative duration does not depend on the peak values. It is the time
interval between the points at which 5% and 95% of the total energy has
been recorded.
Duration
Ref: Kramer (1996)
IIT Bombay, DC 11
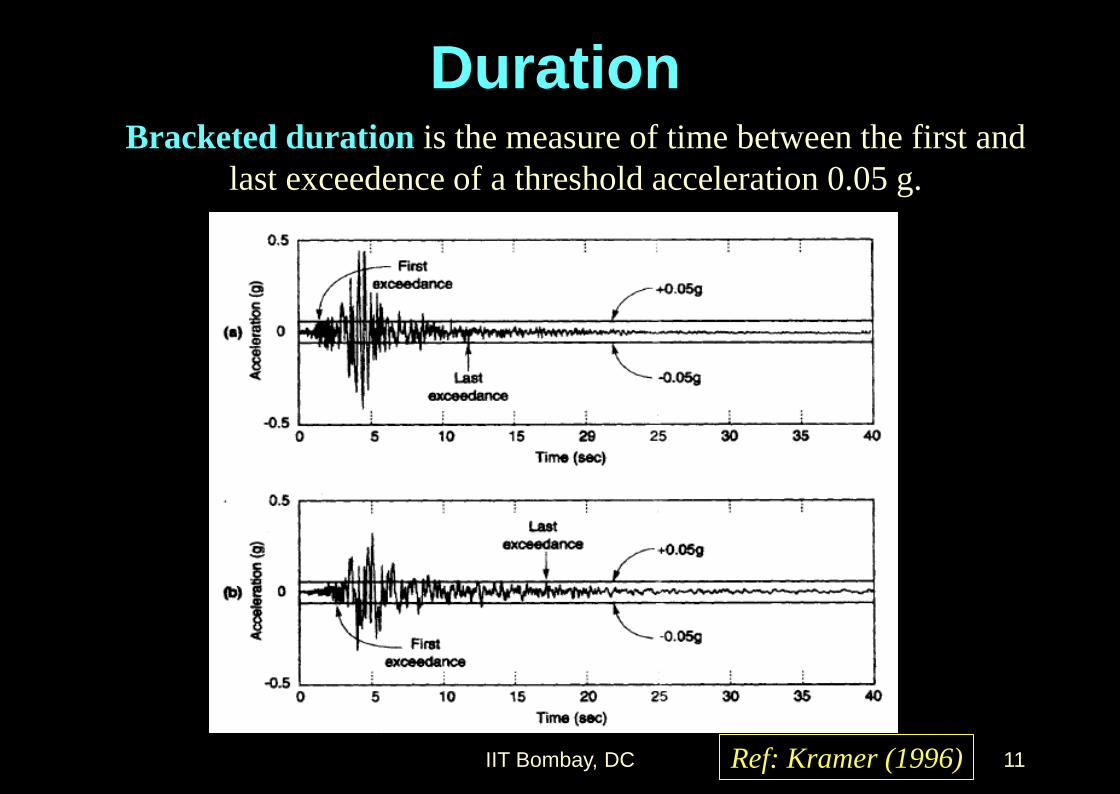
Bracketed duration is the measure of time between the first and
last exceedence of a threshold acceleration 0.05 g.
Duration
Ref: Kramer (1996)


![Lec 13 [inner classes]](https://static.fdocuments.net/doc/165x107/5561564bd8b42a8a7d8b5409/lec-13-inner-classes.jpg)