LEARNING ASSESSMENT COMMITTEE......................................... 1 . Committee...
64
Student Learning Assessment Committee ANNUAL REPORT 2012-2013 August 2013
Transcript of LEARNING ASSESSMENT COMMITTEE......................................... 1 . Committee...

Student Learning Assessment Committee
ANNUAL REPORT 2012-2013
August 2013


Student Learning Assessment Committee
ANNUAL REPORT 2012-2013
August 2013


2012-2013 Student Learning Assessment Committee Annual Report - i
TABLE OF CONTENTS
STUDENT LEARNING ASSESSMENT COMMITTEE ......................................... 1 Committee Composition............................................................................. 1 Committee Objectives ................................................................................ 1 Activities of the Committee ....................................................................... 2 Committee Self-Education ......................................................................... 3 Committee Goals ....................................................................................... 4
INSTITUTIONAL LEVEL ASSESSMENT ............................................................ 5
Computer Adaptive Placement Assessment and Support System (COMPASS) ....................................................... 5 Collegiate Assessment of Academic Proficiency (CAAP) ............... 6 ENG 299: Capstone Portfolio Course ............................................ 8 Writing Across the Curriculum (WAC) ........................................... 16
Institutional Surveys ................................................................................. 25 PROGRAM LEVEL ASSESSMENT .................................................................. 27
Degrees And Certificates Granted .......................................................... 27 Completion Rates of General Education Core Classes .......................... 29
STUDENT LEARNING ASSESSMENT PROGRAM REPORTS ....................... 33 ASSESSING PROGRAM ASSESSMENT ......................................................... 35
Measuring Program Objectives ................................................................ 37 Uses Multiple Measures: Program Objectives ......................................... 37 Measures General Education Competency ............................................. 39 Uses Multiple Measures for General Education Competency .......................................................................................... 42 Uses Both Internal and External Sources ................................................ 45 Has Complete Data Summary ................................................................. 47 Changes to Curriculum Based On Data (Closing the Loop)..................... 49 Student Learning Assessment Program Report Evaluation Rubric .......... 51
CLASSROOM LEVEL ASSESSMENT ............................................................. 57

2012-2013 Student Learning Assessment Committee Annual Report - ii
2011-2012 Student Learning Assessment Committee Annual Report - 1
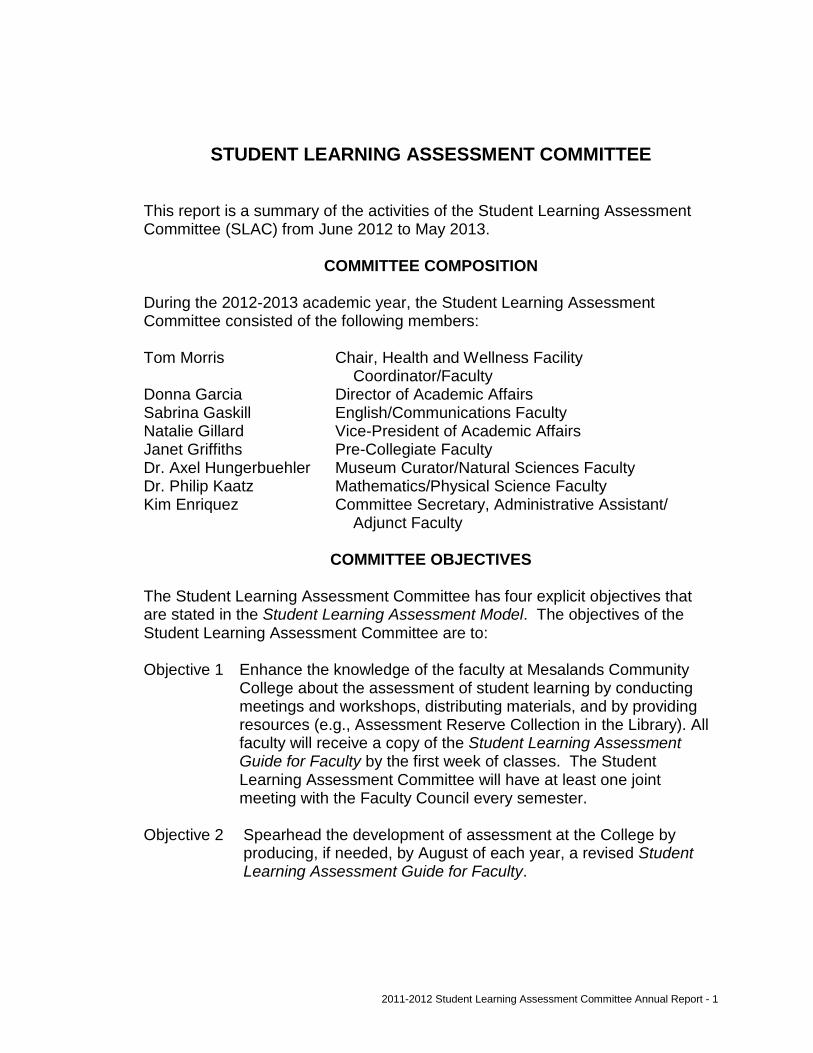
STUDENT LEARNING ASSESSMENT COMMITTEE This report is a summary of the activities of the Student Learning Assessment Committee (SLAC) from June 2012 to May 2013.
COMMITTEE COMPOSITION
During the 2012-2013 academic year, the Student Learning Assessment Committee consisted of the following members: Tom Morris Chair, Health and Wellness Facility
Coordinator/Faculty Donna Garcia Director of Academic Affairs Sabrina Gaskill English/Communications Faculty Natalie Gillard Vice-President of Academic Affairs Janet Griffiths Pre-Collegiate Faculty Dr. Axel Hungerbuehler Museum Curator/Natural Sciences Faculty Dr. Philip Kaatz Mathematics/Physical Science Faculty Kim Enriquez Committee Secretary, Administrative Assistant/ Adjunct Faculty
COMMITTEE OBJECTIVES
The Student Learning Assessment Committee has four explicit objectives that are stated in the Student Learning Assessment Model. The objectives of the Student Learning Assessment Committee are to: Objective 1 Enhance the knowledge of the faculty at Mesalands Community
College about the assessment of student learning by conducting meetings and workshops, distributing materials, and by providing resources (e.g., Assessment Reserve Collection in the Library). All faculty will receive a copy of the Student Learning Assessment Guide for Faculty by the first week of classes. The Student Learning Assessment Committee will have at least one joint meeting with the Faculty Council every semester.
Objective 2 Spearhead the development of assessment at the College by producing, if needed, by August of each year, a revised Student Learning Assessment Guide for Faculty.

2012-2013 Student Learning Assessment Committee Annual Report - 2
Objective 3 Facilitate and implement the development of feedback loops and information dissemination about assessment at the College by:
a. producing an Annual Report by October of each year b. providing all faculty with copies of the Student Learning
Assessment Guide for Faculty each academic year c. having at least one joint meeting with the Faculty Council
every fall and spring semester d. providing all adjunct and new faculty with assessment-
related training and an assessment mentor e. presenting information on assessment at every new student
orientation and during each section of ACS 100 Student College Success class, including delivery of the brochure Student Guide to Learning Assessment
f. conducting a semi-annual Assessment Day to be held every fall and spring semesters. The semi-annual Assessment Day is a joint meeting between the Committee and all full-time faculty used to discuss, update, and refine the assessment practices at the College
Objective 4 Oversee the implementation of the Student Learning Assessment
Model and Student Learning Assessment Guide for Faculty so that faculty and staff will provide all the documents and reports specified in the Model and Guide within one week of the stated deadline.
STUDENT LEARNING ASSESSMENT COMMITTEE ACTIVITIES 2012-2013
The Student Learning Assessment Committee completed its participation in the Higher Learning Commission’s Academy for Assessment of Student Learning with the submission and presentation of its Results Forum Impact Report. The Impact Report was submitted to the HLC on September 7, 2012, and presented at the Academy for the Assessment of Student Learning Results Forum on November 7-9, 2012. Mesalands Community College was also asked to present its Impact Report as part of a showcase of completed academy projects on November 8, 2012. The Results Forum Impact Report summarized the assessment-related activities that were implemented by the College based upon its four-year participation in the Academy for Assessment of Student Learning from 2008 through 2012. The Action Portfolio (also referred to as the Student Learning Plan) generated by the College’s participation in the Academy was entitled “Beyond the Basics: Reinventing Assessment at Mesalands Community College.” This Student Learning Plan addressed and built upon the findings of the 2004 Higher Learning Commission’s on-site visit for reaccreditation, with emphasis on addressing student learning assessment at all three levels – course, program and institution.

2012-2013 Student Learning Assessment Committee Annual Report - 3
The following assessment-related changes at the institutional-level, program-level, and course-level, were instituted during the 2012-2013 academic year: 1. Full implementation of the Student Learning Assessment Guide for Faculty as
a means to establish sustainability for the continued assessment activities established in the Action Portfolio.
2. Preliminary conversations with Student Affairs regarding the development of an action plan to establish a plandostudyadjust cycle of assessing the quality and quantity of student services as it relates to its affect on student learning.
3. Preliminary conversations with the Director of Educational Services Center regarding the development of an action plan to establish a plandostudyadjust cycle of assessment for the ABE/GED programs.
4. Established a “closed” Drop Box for securely viewing ENG 299 student oral presentations.
COMMITTEE SELF-EDUCATION The Student Learning Assessment Committee continued its ongoing self-education process during the fall 2012 and spring 2013 semesters.
• Ms. Griffiths, Dr. Hungerbuehler, and Mr. Morris participated in and presented the Results Forum Impact Report at the Academy for the Assessment of Student Learning Results Forum on November 7-9, 2012, in Saint Charles, Illinois.
• Numerous committee members attended the New Mexico Higher Education Assessment and Retention Conference on February 28 – March 1, 2013.
• Ms. Gaskill, Ms. Gillard and Mr. Morris also attended the Higher Learning Commissions Annual Conference in Chicago, Illinois, on April 5 – 9, 2013.

2012-2013 Student Learning Assessment Committee Annual Report - 4
STUDENT LEARNING ASSESSMENT COMMITTEE GOALS 2013–2014
Student learning assessment is a living, breathing process that will mature and change as the College identifies the most effective and efficient methods of understanding, confirming and improving student learning. The 2013-2014 goals and objectives associated with this process are specific, measureable, attainable and relevant.
Priorities Goals Objectives Responsible Individual(s)
Establish a data-driven culture utilizing the plan-do-study-adjust cycle of assessment to facilitate continual improvement in all aspects of learning
Use the plan-do-study-adjust cycle of assessment to improve learning in pre-collegiate programming and Student Affairs.
1. Develop an action plan to establish a plandostudyadjust cycle of assessment in Student Affairs.
2. Develop an action plan
to establish a plando studyadjust cycle of assessment in the Educational Services Center for the ABE/GED programs.
3. Investigate ways to collect data
from graduating students, alumni, and employers in order to assess how successful the College is at placing well-prepared graduates into the workforce and using this information to improve student learning.
Note: Numerous objectives are identified throughout this Student Learning Assessment Committee’s Annual Report via the PDSA Annual Cycle Opportunities for Improvement sections. There are far too many opportunities for improvement identified to list them in this document. Please refer to the specific sections of the Annual Report for objectives and time frames for accomplishment.
Student Learning Assessment Committee, Vice President of Student Affairs, Student Affairs staff.
Student Learning Assessment Committee, Pre-Collegiate lead faculty, Director of Educational Services Center and full-time and adjunct faculty. Vice Presidents of Academic Affairs and Student Affairs, Student Learning Assessment Committee, program directors/lead faculty and employers.

2012-2013 Student Learning Assessment Committee Annual Report - 5
INSTITUTIONAL LEVEL ASSESSMENT Direct assessment measures of student learning at the institutional level include, but are not limited to the following: COMPASS, CAAP, capstone portfolio course (ENG 299), embedded assessments, and general education competency assessments based on the General Education Competency Reporting Schedule. Indirect measures of student learning include a number of student surveys. The following sections describe and summarize the results of these assessments. Computer Adaptive Placement Assessment and Support System (COMPASS) The COMPASS test is a comprehensive software and operational support package developed by ACT to help post-secondary institutions place students into appropriate entry-level courses and to diagnose specific areas of strengths and weaknesses. COMPASS software administers, scores, and reports the results of adaptive placement and diagnostic tests in the areas of mathematics, reading, and writing skills. The following tables show the number of students who completed each of the COMPASS sub-tests, their averages, and standard deviation for each sub-test completed in preparation for the 2012-2013academic year.
COMPASS SCORE SUMMARY 2012-2013 ACADEMIC YEAR
Pre- Algebra Algebra College Algebra Trigonometry Reading Writing Summer 2012
N 23 67 2 2 58 58 M 39.3 34.2 52.5 39 78.7 58.8
SD 12.5 14.7 2.1 7.1 15.7 27.5 Fall 2012
N 85 160 3 2 190 167 M 37 27.8 47.3 54 72.2 55.3
SD 13.4 13.0 23.7 14.1 16.3 30.8 Spring 2013
N 73 146 10 4 128 132 M 42.0 31.1 46.1 43.7 75.8 54.1
SD 16.2 16.1 19.6 21.4 17.0 31.6 N=number of students tested; M=mean (average score); SD=standard deviation
2012-2013 Student Learning Assessment Committee Annual Report - 6
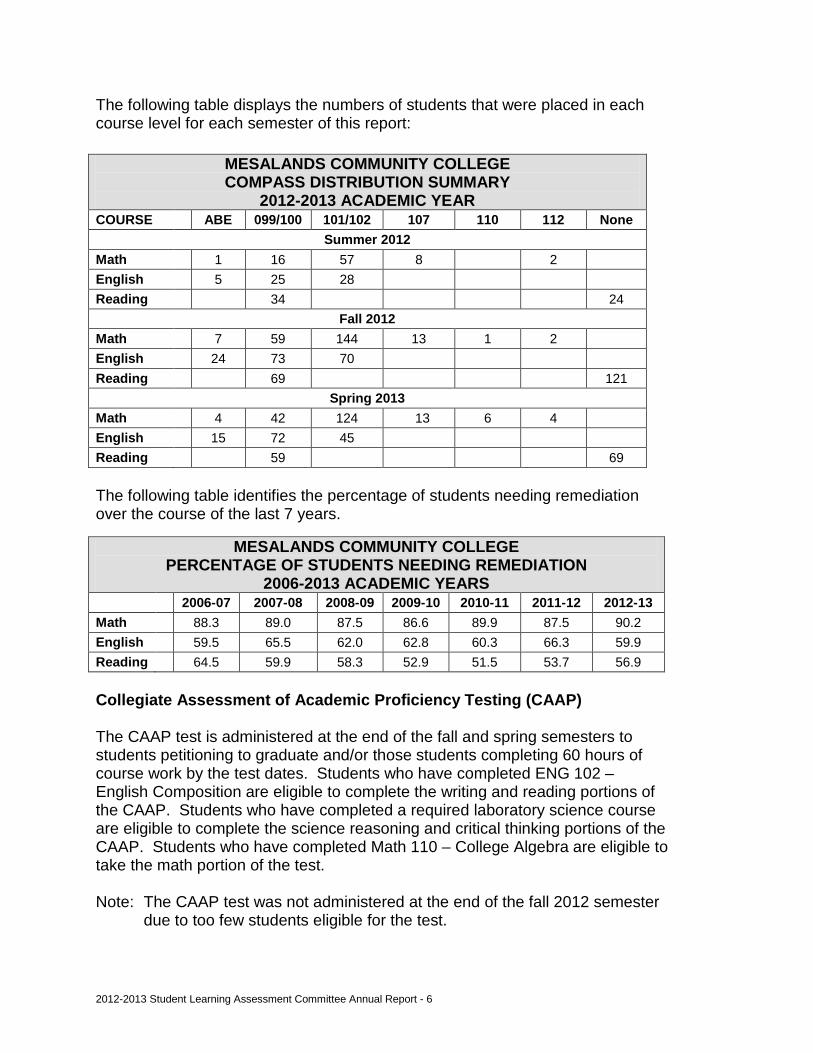
The following table displays the numbers of students that were placed in each course level for each semester of this report:
The following table identifies the percentage of students needing remediation over the course of the last 7 years.
Collegiate Assessment of Academic Proficiency Testing (CAAP) The CAAP test is administered at the end of the fall and spring semesters to students petitioning to graduate and/or those students completing 60 hours of course work by the test dates. Students who have completed ENG 102 – English Composition are eligible to complete the writing and reading portions of the CAAP. Students who have completed a required laboratory science course are eligible to complete the science reasoning and critical thinking portions of the CAAP. Students who have completed Math 110 – College Algebra are eligible to take the math portion of the test. Note: The CAAP test was not administered at the end of the fall 2012 semester
due to too few students eligible for the test.
MESALANDS COMMUNITY COLLEGE COMPASS DISTRIBUTION SUMMARY
2012-2013 ACADEMIC YEAR COURSE ABE 099/100 101/102 107 110 112 None
Summer 2012 Math 1 16 57 8 2 English 5 25 28 Reading 34 24
Fall 2012 Math 7 59 144 13 1 2 English 24 73 70 Reading 69 121
Spring 2013 Math 4 42 124 13 6 4 English 15 72 45 Reading 59 69
MESALANDS COMMUNITY COLLEGE PERCENTAGE OF STUDENTS NEEDING REMEDIATION
2006-2013 ACADEMIC YEARS 2006-07 2007-08 2008-09 2009-10 2010-11 2011-12 2012-13 Math 88.3 89.0 87.5 86.6 89.9 87.5 90.2 English 59.5 65.5 62.0 62.8 60.3 66.3 59.9 Reading 64.5 59.9 58.3 52.9 51.5 53.7 56.9

2012-2013 Student Learning Assessment Committee Annual Report - 7
Students who score above the 50th percentile nationally in any subject are awarded certificates of achievement from ACT. The following tables summarize these achievement results:
MESALANDS COMMUNITY COLLEGE CAAP CERTIFICATE AWARDS BY SUBJECT
SPRING 2013 SEMESTER Writing Math Reading Critical
Thinking Science
Number of Certificates
Awarded 9 9 10 14 5
Number of Students
Participating 25 25 26 26 26
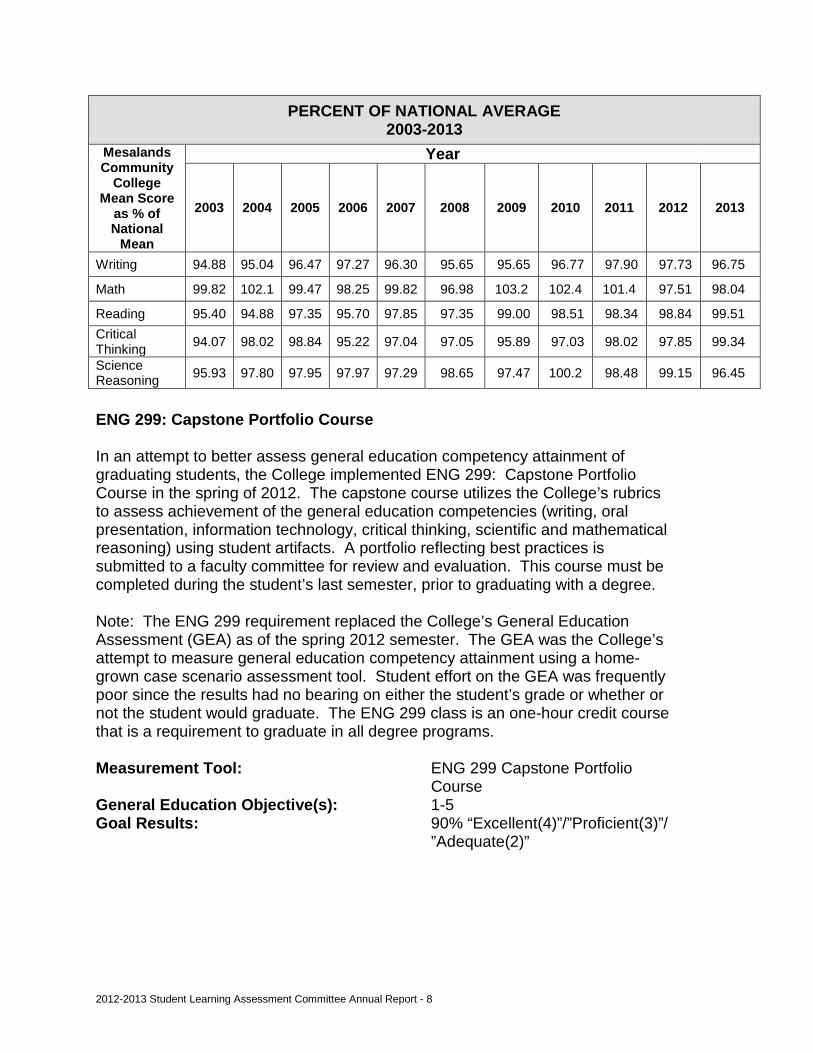
The CAAP result averages for each subject area compared to the corresponding national average are given in the following table:
The following table displays the comparative results of the CAAP Test for the years 2003 through 2013.
MESALANDS COMMUNITY COLLEGE NUMBER OF STUDENTS RECEIVING CAAP CERTIFICATE
AWARDS BY NUMBER OF SUB-TESTS SPRING 2013 SEMESTER
Number of Students
Participating
Total Sub-tests
Number of Certificates
Awarded
Five Sub-tests
Four Sub-tests
Three Sub-tests
Two Sub-tests
One Sub-test
26 128 48 0 6 3 3 9
MESALANDS COMMUNITY COLLEGE CAAP AVERAGES BY SUBJECT AREA
SPRING 2013 SEMESTER Subject Writing Math Reading Critical
Thinking Science
Reasoning MCC Avg. 59.5 55.0 59.8 60.2 57.1
National Avg. 61.5 56.1 60.1 60.6 59.2
2012-2013 Student Learning Assessment Committee Annual Report - 8
PERCENT OF NATIONAL AVERAGE 2003-2013
Mesalands Community
College Mean Score
as % of National
Mean
Year
2003 2004 2005 2006 2007 2008 2009 2010 2011 2012 2013
Writing 94.88 95.04 96.47 97.27 96.30 95.65 95.65 96.77 97.90 97.73 96.75
Math 99.82 102.1 99.47 98.25 99.82 96.98 103.2 102.4 101.4 97.51 98.04
Reading 95.40 94.88 97.35 95.70 97.85 97.35 99.00 98.51 98.34 98.84 99.51 Critical Thinking 94.07 98.02 98.84 95.22 97.04 97.05 95.89 97.03 98.02 97.85 99.34
Science Reasoning 95.93 97.80 97.95 97.97 97.29 98.65 97.47 100.2 98.48 99.15 96.45
ENG 299: Capstone Portfolio Course In an attempt to better assess general education competency attainment of graduating students, the College implemented ENG 299: Capstone Portfolio Course in the spring of 2012. The capstone course utilizes the College’s rubrics to assess achievement of the general education competencies (writing, oral presentation, information technology, critical thinking, scientific and mathematical reasoning) using student artifacts. A portfolio reflecting best practices is submitted to a faculty committee for review and evaluation. This course must be completed during the student’s last semester, prior to graduating with a degree. Note: The ENG 299 requirement replaced the College’s General Education Assessment (GEA) as of the spring 2012 semester. The GEA was the College’s attempt to measure general education competency attainment using a home-grown case scenario assessment tool. Student effort on the GEA was frequently poor since the results had no bearing on either the student’s grade or whether or not the student would graduate. The ENG 299 class is an one-hour credit course that is a requirement to graduate in all degree programs. Measurement Tool: ENG 299 Capstone Portfolio
Course General Education Objective(s): 1-5 Goal Results: 90% “Excellent(4)”/”Proficient(3)”/
”Adequate(2)”

2012-2013 Student Learning Assessment Committee Annual Report - 9
General Education Competency: Writing Year Excellent
(4) Proficient
(3) Adequate
(2) Inadequate
(1) 2012-2013 • 1.1.1 4 11 6 • 1.1.2 4 11 6 • 1.1.3 4 11 6 • 1.2.1 4 11 6 • 1.2.2 4 11 6 • 1.2.3 4 11 6 • 1.3.1 4 9 4 4 • 1.3.2 3 11 3 3 • 1.4.1 3 11 4 2 • 1.4.2 3 14 4
Year Excellent (4)
Proficient (3)
Adequate (2)
Inadequate (1)
2011-2012 • 1.1.1 2 3 • 1.1.2 2 3 • 1.1.3 2 3 • 1.2.1 2 3 • 1.2.2 2 3 • 1.2.3 2 3 • 1.3.1 2 2 1 • 1.3.2 2 2 1 • 1.4.1 2 3 • 1.4.2 4 1
General Education Competency: Writing Provides a clear, concise thesis statement 1.1.1 Statement is clear and concise 1.1.2 Statement is well-reasoned 1.1.3 Statement leads to plentiful additional discussion Provides supporting paragraphs which relate to the thesis 1.2.1 Supporting paragraphs are well-reasoned 1.2.2 Supporting paragraphs clearly relate to the thesis 1.2.3 Supporting paragraphs are cohesive and logically developed Correctly incorporates outside sources 1.3.1 Provides relevant outside sources 1.3.2 Cites outside sources correctly Uses appropriate grammar, syntax, punctuation, and spelling 1.4.1 Writing is error free in all categories (sentence structure, punctuation, spelling and grammar) 1.4.2 Sentence structure and vocabulary are well-developed and varied

2012-2013 Student Learning Assessment Committee Annual Report - 10
General Education Competency: Oral Presentation
Year Excellent (4)
Proficient (3)
Adequate (2)
Inadequate (1)
2012-2013 • 2.1.1 3 6 2 2 • 2.1.2 1 7 4 2 • 2.1.3 1 7 4 2 • 2.2.1 2 7 3 2 • 2.2.2 2 7 3 2 • 2.2.3 2 7 3 2 • 2.3.1 1 5 6 2 • 2.3.2 1 6 5 2 • 2.3.3 1 7 4 2 • 2.4.1 1 8 2 3 • 2.4.2 2 9 1 2 • 2.4.3 2 8 1 1 • 2.5.1 1 4 5 4 • 2.5.2 1 6 3 4 • 2.5.3 1 1 2
Year Excellent (4)
Proficient (3)
Adequate (2)
Inadequate (1)
2011-2012 • 2.1.1 1 2 • 2.1.2 2 1 • 2.1.3 2 1 • 2.2.1 1 2 • 2.2.2 1 2 • 2.2.3 1 1 1 • 2.3.1 1 2 • 2.3.2 1 1 1 • 2.3.3 1 1 1 • 2.4.1 1 1 1 • 2.4.2 1 2 • 2.4.3 2 1 • 2.5.1 1 2 • 2.5.2 1 2 • 2.5.3 1
General Education Competency: Oral Presentation Provides a well-organized speech with appropriate introduction and conclusion 2.1.1 Very well-organized 2.1.2 Attention grabbing introduction 2.1.3 Convincing conclusion Provides main points that are well-documented, compelling, supported with facts, developed clearly and concisely, and focused on the topic 2.2.1 All main points are well-documented and supported by numerous, compelling facts

2012-2013 Student Learning Assessment Committee Annual Report - 11
2.2.1 Clearly and concisely presented 2.2.3 Remains focused on topic throughout entire presentation Uses appropriate gestures, movements and eye contact 2.3.1 Excellent gestures and eye contact 2.3.2 Conversational presentation 2.3.3 Utilize note cards appropriately Speaks clearly and understandably using standard, edited English with correct mechanics (pronunciation, sentence structure and grammar) relative to audience 2.4.1 Excellent mechanics throughout 2.4.2 Very appropriate presentation relative to audience 2.4.3 Tone is respectful and civil Provides appropriate handouts and/or visual aids 2.5.1 Provides entire audience with useful, presentation quality handouts 2.5.2 Handouts/audiovisual aids contain appropriate amount of information 2.5.3 Grammatically correct material General Education Competency: Information Technology
Year Pass (4)
Fail (1)
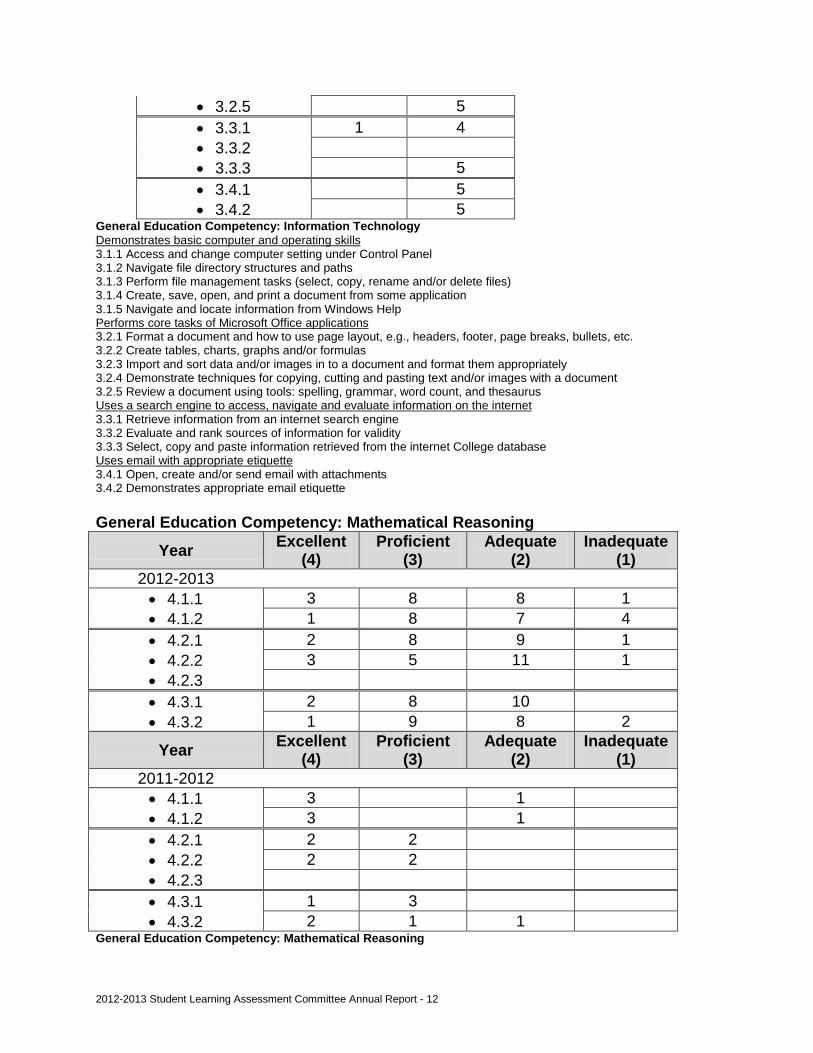
2012-2013 • 3.1.1 20 1 • 3.1.2 20 1 • 3.1.3 20 1 • 3.1.4 20 1 • 3.1.5 20 1 • 3.2.1 19 2 • 3.2.2 16 4 • 3.2.3 19 2 • 3.2.4 20 1 • 3.2.5 16 5 • 3.3.1 18 3 • 3.3.2 18 3 • 3.3.3 18 3 • 3.4.1 18 3 • 3.4.2 18 3
Year Pass (4)
Fail (1)
2011-2012 • 3.1.1 • 3.1.2 • 3.1.3 • 3.1.4 5 • 3.1.5 • 3.2.1 2 3 • 3.2.2 5 • 3.2.3 4 1 • 3.2.4 3 2
2012-2013 Student Learning Assessment Committee Annual Report - 12
General Education Competency: Information Technology Demonstrates basic computer and operating skills 3.1.1 Access and change computer setting under Control Panel 3.1.2 Navigate file directory structures and paths 3.1.3 Perform file management tasks (select, copy, rename and/or delete files) 3.1.4 Create, save, open, and print a document from some application 3.1.5 Navigate and locate information from Windows Help Performs core tasks of Microsoft Office applications 3.2.1 Format a document and how to use page layout, e.g., headers, footer, page breaks, bullets, etc. 3.2.2 Create tables, charts, graphs and/or formulas 3.2.3 Import and sort data and/or images in to a document and format them appropriately 3.2.4 Demonstrate techniques for copying, cutting and pasting text and/or images with a document 3.2.5 Review a document using tools: spelling, grammar, word count, and thesaurus Uses a search engine to access, navigate and evaluate information on the internet 3.3.1 Retrieve information from an internet search engine 3.3.2 Evaluate and rank sources of information for validity 3.3.3 Select, copy and paste information retrieved from the internet College database Uses email with appropriate etiquette 3.4.1 Open, create and/or send email with attachments 3.4.2 Demonstrates appropriate email etiquette General Education Competency: Mathematical Reasoning
Year Excellent (4)
Proficient (3)
Adequate (2)
Inadequate (1)
2012-2013 • 4.1.1 3 8 8 1 • 4.1.2 1 8 7 4 • 4.2.1 2 8 9 1 • 4.2.2 3 5 11 1 • 4.2.3 • 4.3.1 2 8 10 • 4.3.2 1 9 8 2
Year Excellent (4)
Proficient (3)
Adequate (2)
Inadequate (1)
2011-2012 • 4.1.1 3 1 • 4.1.2 3 1 • 4.2.1 2 2 • 4.2.2 2 2 • 4.2.3 • 4.3.1 1 3 • 4.3.2 2 1 1
General Education Competency: Mathematical Reasoning
• 3.2.5 5 • 3.3.1 1 4 • 3.3.2 • 3.3.3 5 • 3.4.1 5 • 3.4.2 5

2012-2013 Student Learning Assessment Committee Annual Report - 13
Constructs and/or analyzes numerical or graphical representations of data 4.1.1 A correct solution using an appropriate strategy is given 4.1.2 Descriptions of the results are complete and coherent Simplifies, evaluates, and/or solves various equations and/or formulas 4.2.1 Demonstrates complete understanding of the problems with correct solutions 4.2.2 Answers are interpreted correctly, with appropriate labels 4.2.3 Correctly identifies units and performs conversions Formulates and communicates mathematical explanations 4.3.1 Gives a complete response with clear explanations 4.3.2 Communicates effectively to the intended audience; demonstrates complete understanding of the mathematical ideas and processes General Education Competency: Scientific Reasoning
Year Excellent (4)
Proficient (3)
Adequate (2)
Inadequate (1)
2012-2013 • 5.1.1 1 4 5 10 • 5.1.2 2 3 4 11 • 5.2.1 2 4 2 12 • 5.3.1 2 6 12 • 5.4.1 1 5 5 9 • 5.5.1 1 4 4 11 • 5.5.2 1 5 3 11
Year Excellent (4)
Proficient (3)
Adequate (2)
Inadequate (1)
2011-2012 • 5.1.1 1 2 • 5.1.2 1 2 • 5.2.1 2 1 • 5.3.1 2 1 • 5.4.1 1 2 • 5.5.1 1 2 • 5.5.2 1 2
General Education Competency: Scientific Reasoning Problem is recognized and investigative question is formulated 5.1.1 Problem is recognized and explained in detail 5.1.2 Investigative question is clearly formulated Reasonable, testable hypothesis is presented 5.2.1 Hypothesis is reasonable, clearly stated, and fully explains question Prediction is formulated as logical consequence of the hypothesis 5.3.1 Prediction is logical and fully explained Data/observations to test hypothesis are gathered or compiled 5.4.1 High quality date and /or high quantity of suitable data gathered and presented professionally (list or table) Formulation of a conclusion 5.5.1 Conclusion is logical and well formulated 5.5.2 Conclusion explains in detail the degree of correctness of the hypothesis and identifies further avenues of testing, or formulates new hypothesis
2012-2013 Student Learning Assessment Committee Annual Report - 14
PDSA CYCLE 2011-2012 ANALYSIS OPPORTUNITIES FOR IMPROVEMENT
Problem Area Students did not use or familiarize themselves with the rubrics prior to identifying and completing the artifacts. It is critical that students review the rubrics since they are scoring tools that identify specific expectations for the assignments. Rubrics divide the tasks into its component parts and provide a detailed description of what constitutes an acceptable or unacceptable level of performance for each of those parts. Using the rubrics in this manner will ensure that students are aware of how their exemplars are being assessed and allows them the ability to make changes to those artifacts so as to better demonstrate that they meet the learning objectives of the class. Goal Assist student in understanding and using the rubrics in order to ensure that their artifacts meet all the assessment criteria. Action Plan 1. Ask all faculty to explain what a rubric is and how it can be used to ensure
that classroom assignments meet the stated criteria. This activity should be performed in all College courses as well as by the ENG 299 faculty to reinforce the importance and benefit of rubrics. Constant reinforcement is critical throughout the students’ academic experience at the College.
2. Present students enrolled in ENG 299 examples of artifacts that meet all the general education competency “excellent” criteria.
Results 1. All faculty were instructed to distribute and review the Writing Rubric as part of the Writing Across the Curriculum assignment. This request is identified in the Student Learning Assessment Guide for Faculty which was given to faculty, wherever or however they taught for the College. This requirement was also discussed at the orientation sessions held at the beginning of the spring 2013 semester for adjunct faculty. A total of 47 adjunct faculty attended the orientation sessions held at the following locations: • Tucumcari, January 25, 2013; 31 attendees • Clayton High School, February 13, 2013; 5 attendees • Northern New Mexico Detention Center, February 13, 2013; 5 attendees • Moriarty High School, February 19, 2013; 6 attendees 2. Math, science, English, and information technology faculty each presented examples of exemplars that would meet the general education competency “excellent” criteria for the mathematical reasoning, scientific reasoning, writing,
2012-2013 Student Learning Assessment Committee Annual Report - 15
oral presentation, and information technology rubrics during separate presentations to the spring ENG 299 class. The quality of the artifacts did improve somewhat except for the scientific reasoning exemplars. Problem Area Students had difficulty uploading their complete oral presentations onto Moodle. It was later discovered that Moodle will only support clips of less than 2 minutes which does not allow for sufficient time for students to demonstrate the oral communication competency. Goal Identify alternative methods that would allow students to upload much longer oral presentation clips to ensure the student adequate time to demonstrate attainment of the competency. Action Plan 1. Investigate utilizing Facebook or YouTube for uploads. 2. Determine how this may relate to FERPA.
a. Identify whether or not we can “close” these clips to the public. Results The majority of the files created by students for the ENG 299 class were uploaded to the Moodle course site. Video files, however, for the oral presentations were generally too large for Moodle. To facilitate collection of the video files, students were sent a link to join a private, shared folder on Dropbox which offers a minimum of 2 GB data storage space. Faculty could then view the video files for evaluation from the shared Dropbox account. If any of the video files could not be viewed in Windows Media Player, they were further uploaded to a private YouTube account which performed the appropriate video conversion to a universal viewing format. Problem Area The students enrolled in courses at the prisons may have difficulty collecting and saving artifacts due to a number of foreseen and unforeseen constraints. Goal Identify what impediments the students enrolled in prison courses may encounter in terms of collection and storage of artifacts as well as other problems they may encounter with the requirements of the ENG 299 course in general.

2012-2013 Student Learning Assessment Committee Annual Report - 16
Action Plan 1) Convene meetings with all stakeholders to identify possible hurdles faced by
students enrolled in the prisons in terms of successful completion of ENG 299.
2) Discuss possible solutions to those identified hurdles. 3) Identifying specific faculty who will require artifact assignments (lab science
faculty will require scientific reasoning and critical thinking assignment). This will allow students the ability to immediately submit their work as an artifact.
Results Although preliminary discussions did take place within SLAC regarding the difficulty of implementing ENG 299 at the correctional sites, specific solutions were not discussed nor were corrective actions implemented. Writing Across the Curriculum (WAC) The Writing Across the Curriculum movement (which first appeared on college campuses in the 1970’s and 1980’s) “is largely a reaction against traditional writing instruction that associates good writing primarily with grammatical accuracy and correctness, and thus isolates writing instruction within English departments, the home of grammar experts. The problem with traditional writing instruction is that it leads to a view of writing as a set of isolated skills unconnected to” the students’ major and discipline. Learning to write in a discipline is intimately connected to learning to think within that discipline. This will improve both the students’ writing abilities as well as their understanding of their major field of study. Mesalands Community College instituted the Writing Across the Curriculum initiative during the 2009-2010 academic cycle by requiring all faculty to assess writing skills wherever or however they taught for the College every semester. Below are the assessment results. The major goal of collecting this data is three-fold. First, the College is attempting to identify whether or not its degree graduates are accomplishing the general education competency of writing. Second, the College is attempting to identify whether there is any added value to completing ENG 102. Third, results from this assessment can be used to identify specific areas of weakness with the goal of using this information to improve future (teaching and learning of) writing.

2012-2013 Student Learning Assessment Committee Annual Report - 17
MESALANDS COMMUNITY COLLEGE WRITING ACROSS THE CURRICULUM
STUDENTS WITHOUT A PREVIOUS ENG 102 CLASS SPRING 2012 SEMESTER
Criteria Excellent (4)
Proficient (3)
Adequate (2)
Inadequate (1) Total Average
1.1.1 75 (45.2 %) 53 (31.9 %) 31 (18.7 %) 7 (4.2 %) 166 3.18 1.1.2 69 (42.9 %) 52 (32.3 %) 28 (17.4 %) 12 (7.5 %) 161 3.11 1.1.3 70 (42.9 %) 52 (31.9 %) 33 (20.2 %) 8 (4.9 %) 163 3.13 1.2.1 74 (44.8 %) 50 (30.3 %) 34 (20.6 %) 7 (4.2 %) 165 3.16 1.2.2 72 (44.4 %) 52 (32.1 %) 31 (19.1 %) 7 (4.3 %) 162 3.17 1.2.3 71 (44.9 %) 49 (31 %) 32 (20.3 %) 6 (3.8 %) 158 3.17 1.3.1 44 (36.1 %) 40 (32.8 %) 23 (18.9 %) 15 (12.3 %) 122 2.93 1.3.2 41 (35.3 %) 42 (36.2 %) 20 (17.2 %) 13 (11.2 %) 116 2.96 1.4.1 40 (24.5 %) 63 (38.7 %) 26 (16 %) 34 (20.9 %) 163 2.67 1.4.2 47 (29.6 %) 57 (35.8 %) 25 (15.7 %) 30 (18.9 %) 159 2.76
MESALANDS COMMUNITY COLLEGE WRITING ACROSS THE CURRICULUM
STUDENTS WITHOUT A PREVIOUS ENG 102 CLASS FALL 2012 SEMESTER
Criteria Excellent (4)
Proficient (3)
Adequate (2)
Inadequate (1) Total Average
1.1.1 70 (27.7%) 91 (36.0 %) 68 (26.9 %) 24 (9.5 %) 253 2.81 1.1.2 70 (27.7 %) 93 (36.4 %) 63 (24.9 %) 28 (11.0 %) 253 2.80 1.1.3 68 (27.8 %) 85 (34.7 %) 65 (26.5 %) 27 (11.0 %) 245 2.79 1.2.1 65 (26.5 %) 94 (38.4 %) 60 (24.5 %) 26 (10.6 %) 245 2.80 1.2.2 81 (33.6 %) 70 (29.0 %) 62 (25.7 %) 28 (11.6 %) 241 2.85 1.2.3 62 (25.8 %) 81 (33.8 %) 65 (27.1 %) 32 (13.3 %) 240 2.72 1.3.1 45 (24.9 %) 38 (21.0 %) 49 (27.1 %) 49 (27.1 %) 181 2.43 1.3.2 38 (26.0 %) 35 (24.0%) 41 (28.1 %) 32 (21.9 %) 146 2.54 1.4.1 43 (16.6 %) 99 (38.2 %) 83 (32.0 %) 34 (13.1 %) 259 2.58 1.4.2 55 (23.7 %) 84 (36.2 %) 62 (26.7 %) 31 (13.4 %) 232 2.70
MESALANDS COMMUNITY COLLEGE WRITING ACROSS THE CURRICULUM
STUDENTS WITHOUT A PREVIOUS ENG 102 CLASS SPRING 2013 SEMESTER
Criteria Excellent (4)
Proficient (3)
Adequate (2)
Inadequate (1) Total Average
1.1.1 69 (27.2 %) 72 (28.3 %) 82 (32.3 %) 31 (12.2 %) 254 2.70 1.1.2 70 (28.0 %) 79 (31.6 %) 74 (29.6 %) 27 (10.8 %) 250 2.77 1.1.3 69 (27.6 %) 74 (29.6 %) 79 (31.6 %) 28 (11.2 %) 250 2.74 1.2.1 67 (26.6 %) 73 (29.0 %) 88 (34.9 %) 24 (9.5 %) 252 2.73 1.2.2 72 (28.8 %) 73 (29.2 %) 81 (32.4 %) 24 (9.6 %) 250 2.77 1.2.3 69 (27.3 %) 76 (30.0 %) 84 (33.2 %) 24 (9.5 %) 253 2.75 1.3.1 53 (34.4 %) 42 (27.3 %) 42 (27.3 %) 17 (11.0 %) 154 2.85 1.3.2 50 (32.5 %) 46 (29.9 %) 37 (24.0 %) 21 (13.6 %) 154 2.81
2012-2013 Student Learning Assessment Committee Annual Report - 18
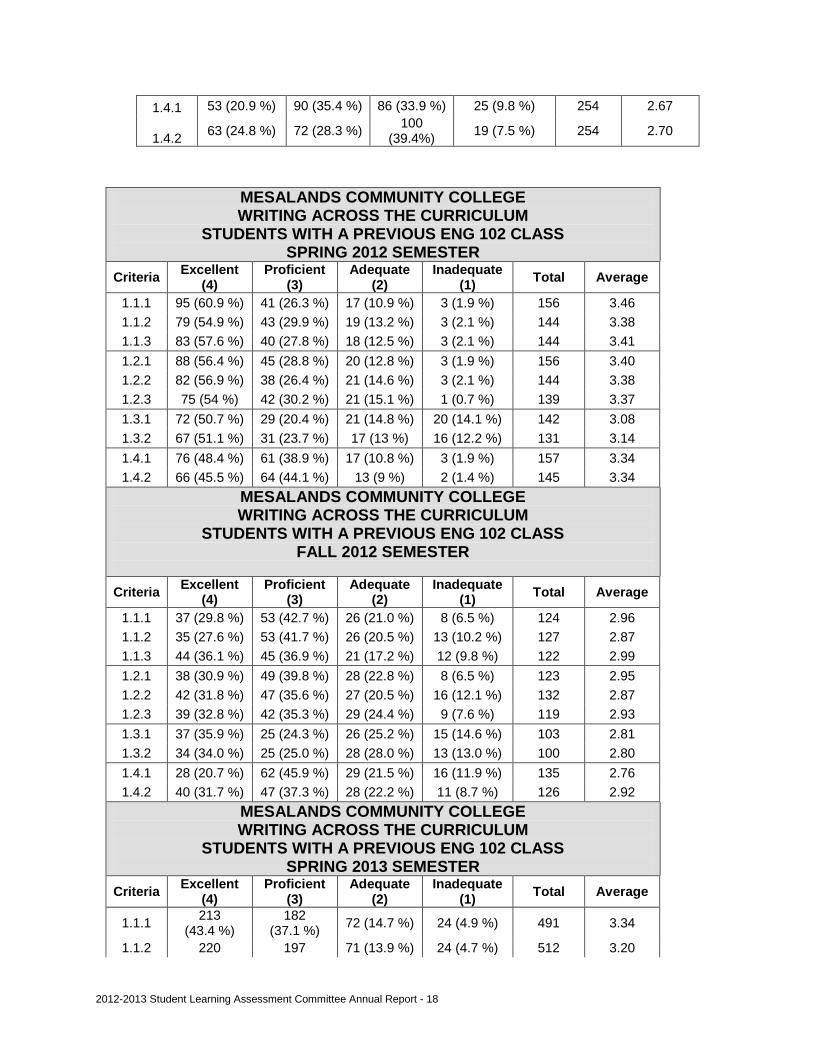
MESALANDS COMMUNITY COLLEGE WRITING ACROSS THE CURRICULUM
STUDENTS WITH A PREVIOUS ENG 102 CLASS SPRING 2012 SEMESTER
Criteria Excellent (4)
Proficient (3)
Adequate (2)
Inadequate (1) Total Average
1.1.1 95 (60.9 %) 41 (26.3 %) 17 (10.9 %) 3 (1.9 %) 156 3.46 1.1.2 79 (54.9 %) 43 (29.9 %) 19 (13.2 %) 3 (2.1 %) 144 3.38 1.1.3 83 (57.6 %) 40 (27.8 %) 18 (12.5 %) 3 (2.1 %) 144 3.41 1.2.1 88 (56.4 %) 45 (28.8 %) 20 (12.8 %) 3 (1.9 %) 156 3.40 1.2.2 82 (56.9 %) 38 (26.4 %) 21 (14.6 %) 3 (2.1 %) 144 3.38 1.2.3 75 (54 %) 42 (30.2 %) 21 (15.1 %) 1 (0.7 %) 139 3.37 1.3.1 72 (50.7 %) 29 (20.4 %) 21 (14.8 %) 20 (14.1 %) 142 3.08 1.3.2 67 (51.1 %) 31 (23.7 %) 17 (13 %) 16 (12.2 %) 131 3.14 1.4.1 76 (48.4 %) 61 (38.9 %) 17 (10.8 %) 3 (1.9 %) 157 3.34 1.4.2 66 (45.5 %) 64 (44.1 %) 13 (9 %) 2 (1.4 %) 145 3.34
MESALANDS COMMUNITY COLLEGE WRITING ACROSS THE CURRICULUM
STUDENTS WITH A PREVIOUS ENG 102 CLASS FALL 2012 SEMESTER
Criteria Excellent (4)
Proficient (3)
Adequate (2)
Inadequate (1) Total Average
1.1.1 37 (29.8 %) 53 (42.7 %) 26 (21.0 %) 8 (6.5 %) 124 2.96 1.1.2 35 (27.6 %) 53 (41.7 %) 26 (20.5 %) 13 (10.2 %) 127 2.87 1.1.3 44 (36.1 %) 45 (36.9 %) 21 (17.2 %) 12 (9.8 %) 122 2.99 1.2.1 38 (30.9 %) 49 (39.8 %) 28 (22.8 %) 8 (6.5 %) 123 2.95 1.2.2 42 (31.8 %) 47 (35.6 %) 27 (20.5 %) 16 (12.1 %) 132 2.87 1.2.3 39 (32.8 %) 42 (35.3 %) 29 (24.4 %) 9 (7.6 %) 119 2.93 1.3.1 37 (35.9 %) 25 (24.3 %) 26 (25.2 %) 15 (14.6 %) 103 2.81 1.3.2 34 (34.0 %) 25 (25.0 %) 28 (28.0 %) 13 (13.0 %) 100 2.80 1.4.1 28 (20.7 %) 62 (45.9 %) 29 (21.5 %) 16 (11.9 %) 135 2.76 1.4.2 40 (31.7 %) 47 (37.3 %) 28 (22.2 %) 11 (8.7 %) 126 2.92
MESALANDS COMMUNITY COLLEGE WRITING ACROSS THE CURRICULUM
STUDENTS WITH A PREVIOUS ENG 102 CLASS SPRING 2013 SEMESTER
Criteria Excellent (4)
Proficient (3)
Adequate (2)
Inadequate (1) Total Average
1.1.1 213 (43.4 %)
182 (37.1 %) 72 (14.7 %) 24 (4.9 %) 491 3.34
1.1.2 220 197 71 (13.9 %) 24 (4.7 %) 512 3.20
1.4.1 53 (20.9 %) 90 (35.4 %) 86 (33.9 %) 25 (9.8 %) 254 2.67
1.4.2 63 (24.8 %) 72 (28.3 %) 100 (39.4%) 19 (7.5 %) 254 2.70

2012-2013 Student Learning Assessment Committee Annual Report - 19
(43.0 %) (38.5 %)
1.1.3 202 (40.0 %)
202 (40.0 %) 75 (14.9 %) 26 (5.1 %) 505 3.15
1.2.1 147 (30.2 %)
220 (45.2 %) 92 (18.9 %) 28 (5.7 %) 487 3.00
1.2.2 182 (37.3 %)
206 (42.2 %) 76 (15.6 %) 24 (4.9 %) 488 3.12
1.2.3 172 (35.5 %)
211 (43.6 %) 73 (15.1 %) 28 (5.8 %) 484 3.09
1.3.1 160 (41.2 %)
123 (31.7 %) 60 (15.5 %) 45 (11.6 %) 388 3.03
1.3.2 157 (40.4 %)
131 (33.8 %) 65 (16.8 %) 35 (9.0 %) 388 3.06
1.4.1 122 (25.0 %)
204 (41.8 %)
131 (26.8 %) 31 (6.4 %) 488 2.85
1.4.2 150 (30.6 %)
203 (41.4 %)
110 (22.4 %) 27 (5.5 %) 490 2.97
1. Provides a clear, concise thesis statement. 1.1.1 Statement is clear and concise 1.1.2 Statement is well-reasoned 1.1.3 Statement leads to plentiful additional discussion
2. Provides supporting paragraphs which relate to the thesis. 1.2.1 Supporting paragraph are well-reasoned 1.2.2 Supporting paragraphs clearly relate to the thesis 1.2.3 Supporting paragraphs are cohesive and logically developed
3. Correctly incorporates outside sources. 1.3.1 Provides relevant outside sources 1.3.2 Cites outside sources correctly
4. Uses appropriate grammar, syntax, punctuation, and spelling. 1.4.1 Writing is error free in all categories (structure, punctuation, spelling and grammar). 1.4.2 Sentence structure and vocabulary are well-developed and varied.
Summary: The College will continue to collect future WAC data in order to identify trends and gaps. Embedded Assessments: ENG 104 The goal of the embedded assessment is to determine whether or not the quality and quantity of learning in ENG 104: English Composition and Research is the same between different education sites (dual enrollment versus main campus). An identical multiple choice exam was given during the same week at the end of the spring 2012 semester at four different dual enrollment sites (n=68) and one main campus site (n=10).

2012-2013 Student Learning Assessment Committee Annual Report - 20
MESALANDS COMMUNITY COLLEGE ENG 104: ENGLISH COMPOSITION ASSESSMENT
SPRING 2012 SEMESTER English Communication
Objectives: Students should perform the
following activities to meet the objectives:
Percent meeting the objective
Dual Main 1. Students will analyze and
evaluate oral and written communication in terms of situation, audience, purpose, aesthetics, and diverse points of view.
Understand, appreciate, and critically evaluate a variety of written and spoken messages in order to make informed decisions. 78% 97%
2. Students will express a primary purpose in a compelling statement and order supporting points logically and convincingly.
Organize their thinking to express their viewpoints clearly, concisely, and effectively. 79% 100%
3. Students will use effective rhetorical strategies to persuade, inform, and engage.
Select and use the best means to deliver a particular message to a particular audience. Rhetorical strategies include but are not limited to modes (such as narration, description, and persuasion), genres (essays, web pages, reports, proposals), media and technology (PowerPoint, electronic writing), and graphics (charts, diagrams, formats).
93% 95%
4.Students will employ writing and/or speaking processes such as planning, collaborating, organizing, composing, revising, and editing to create presentations using correct diction, syntax, grammar, and mechanics.
Use standard processes for generating documents or oral presentations independently and in groups. 94% 97%
5. Students will integrate research correctly and ethically from credible sources to support the primary purpose of a communication.
Gather legitimate information to support ideas without plagiarizing, misinforming or distorting. 81% 92%
6. Students will engage in reasoned civic discourse while recognizing the distinctions among opinions, facts, and inferences.
Negotiate civilly with others to accomplish goals and to function as responsible citizens. 72% 100%

2012-2013 Student Learning Assessment Committee Annual Report - 21
PDSA CYCLE 2011-2012 ANALYSIS OPPORTUNITIES FOR IMPROVEMENT
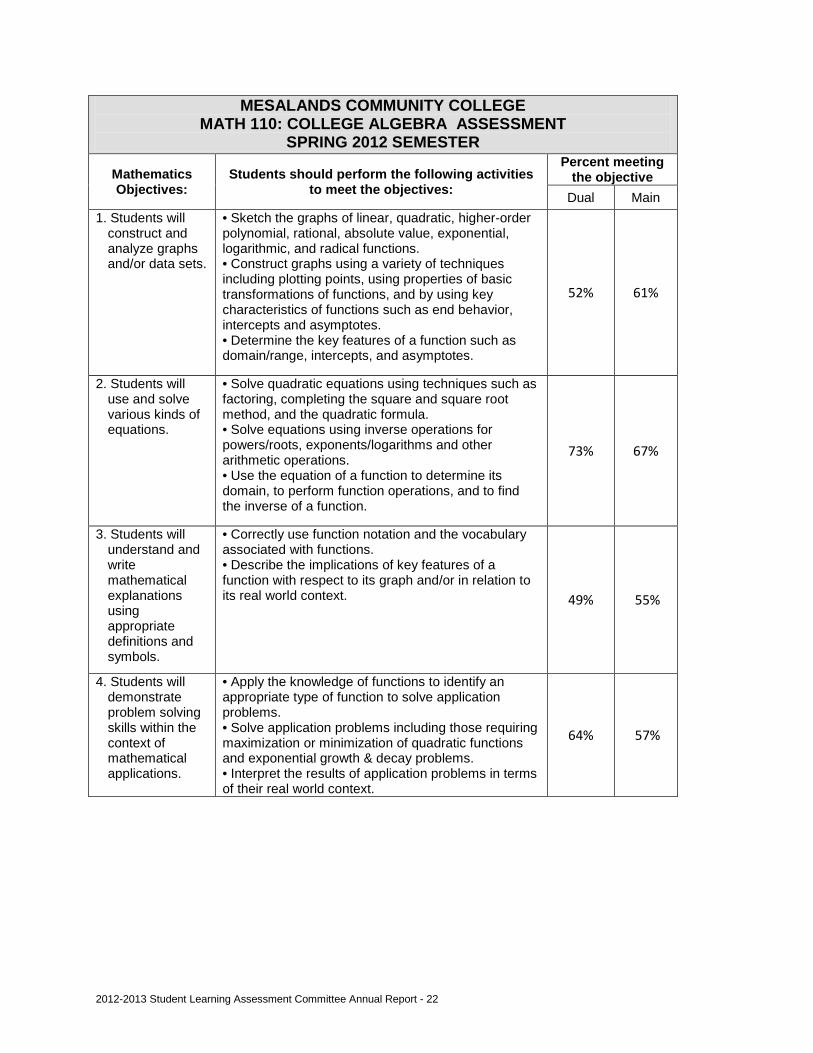
Problem Area It is highly questionable whether or not a multiple choice exam is a valid measure of whether or not students are accomplishing the New Mexico Higher Education Department (NMHED) Core Competencies Communication. It is also questionable whether or not a multiple choice test is an accurate guage to determine if the quality and quantity of learning in ENG 104: English Composition and Research is the same between different education sites (dual enrollment versus main campus). Goal Construct a process that will accurately assess student attainment of the Core Competency based on some type of written assignment such as a critical or argumentative term paper. Action Plan The English lead faculty will be charged with constructing a more appropriate tool to assess attainment of the New Mexico Higher Education Department Core Communication Competency. Results The English lead faculty member charged with constructing a more appropriate assessment tool did not complete the activity. Embedded Assessments: MATH 110 The goal of the embedded assessment is to determine whether or not the quality and quantity of learning in MATH 110: College Algebra is the same between different education sites (dual enrollment versus main campus). An identical exam was given during the same week at the end of the spring 2012 semester at one dual enrollment site (n=11) and one main campus site (n=21).
2012-2013 Student Learning Assessment Committee Annual Report - 22
MESALANDS COMMUNITY COLLEGE MATH 110: COLLEGE ALGEBRA ASSESSMENT
SPRING 2012 SEMESTER
Mathematics Objectives:
Students should perform the following activities to meet the objectives:
Percent meeting the objective
Dual Main 1. Students will
construct and analyze graphs and/or data sets.
• Sketch the graphs of linear, quadratic, higher-order polynomial, rational, absolute value, exponential, logarithmic, and radical functions. • Construct graphs using a variety of techniques including plotting points, using properties of basic transformations of functions, and by using key characteristics of functions such as end behavior, intercepts and asymptotes. • Determine the key features of a function such as domain/range, intercepts, and asymptotes.
52% 61%
2. Students will use and solve various kinds of equations.
• Solve quadratic equations using techniques such as factoring, completing the square and square root method, and the quadratic formula. • Solve equations using inverse operations for powers/roots, exponents/logarithms and other arithmetic operations. • Use the equation of a function to determine its domain, to perform function operations, and to find the inverse of a function.
73% 67%
3. Students will understand and write mathematical explanations using appropriate definitions and symbols.
• Correctly use function notation and the vocabulary associated with functions. • Describe the implications of key features of a function with respect to its graph and/or in relation to its real world context. 49% 55%
4. Students will demonstrate problem solving skills within the context of mathematical applications.
• Apply the knowledge of functions to identify an appropriate type of function to solve application problems. • Solve application problems including those requiring maximization or minimization of quadratic functions and exponential growth & decay problems. • Interpret the results of application problems in terms of their real world context.
64% 57%

2012-2013 Student Learning Assessment Committee Annual Report - 23
PDSA CYCLE 2011-2012 ANALYSIS OPPORTUNITIES FOR IMPROVEMENT
Problem Area The present assessment tool for Math 110 is not compatible with the Moodle platform utilized by the College distance education courses. Goal Convert the present math assessment tool to the Moodle platform. Action Plan The math lead faculty will be charged with investigating how the present embedded math assessment tool can be used on the Moodle platform. Results After a preliminary investigation, the math lead faculty and Director of Distance Education concluded that the Moodle platform is not able to support the current assessment tool. Further investigation into this matter will be addressed during the 2013-14 academic cycle. Effectiveness of Pre-Collegiate Course Work
Academic Cycle 2012-2013 Number C or better % C or better Students Completing ENG 102 193 168 87% Completed pre-collegiate ENG in past year
19 12 63%
No pre-collegiate ENG in past year 174 156 90% Students Completing MATH 107 248 215 87% Completed pre-collegiate MATH in past year
35 22 63%
No pre-collegiate MATH in past year 213 193 91% Academic Cycle 2011-2012 Number C or better % C or better
Students Completing ENG 102 219 188 86% Completed pre-collegiate ENG in past year 19 12 63%
No pre-collegiate ENG in past year 200 176 88% Students Completing MATH 107 135 79 59% Completed pre-collegiate MATH in past year 33 18 55%
No pre-collegiate MATH in past year 102 61 60%

2012-2013 Student Learning Assessment Committee Annual Report - 24
PDSA CYCLE 2011-2012 ANALYSIS OPPORTUNITIES FOR IMPROVEMENT
Problem Area This data represents the College’s first attempt to evaluate the effectiveness of pre-collegiate course work in preparing students for future success in general education collegiate courses. Goal The Pre-collegiate Faculty and the Educational Services Center, which is responsible for administration of pre-collegiate, ABE, and GED course work, will begin establishing a plandostudyadjust cycle of assessment with the goal of improving its services with the ultimate goal of preparing students enrolled in the pre-collegiate classes for future success in their regular college courses. Action Plan Begin discussions with Director of Educational Services Center to establish the “plan” portion of the cycle of assessment. Results Initial discussions were held between the Chair of the Student Learning Assessment Committee and the new Director of Educational Services Center during the fall 2012 semester regarding the need to establish a plan-do-study-adjust cycle of assessment. No formal “plan” was developed.
PDSA CYCLE 2012-2013 ANALYSIS OPPORTUNITIES FOR IMPROVEMENT
Problem Area The College will continue to collect data to evaluate the effectiveness of pre-collegiate course work in preparing students for future success in general education collegiate courses in order to identify gaps and trends. Goal The Pre-collegiate Faculty and the Educational Services Center, which is responsible for administration of pre-collegiate course work, will begin establishing a plandostudyadjust cycle of assessment with the goal of improving its services with the ultimate goal of preparing students enrolled in the pre-collegiate classes for future success in their regular college courses.

2012-2013 Student Learning Assessment Committee Annual Report - 25
Action Plan Begin discussions with Director of Educational Services Center to establish the “plan” portion of the cycle of assessment. Results To be discussed in the 2013-2014 report.
INSTITUTIONAL SURVEYS Mesalands Community College has, in the past, utilized a regular cycle of surveys (Student Opinion Survey, Withdrawing/Non-Returning Student Survey, Alumni Survey and others) which provided indirect measures of student learning, as well as some attitudinal data useful for assessment. However, because of significant changes involving personnel responsible for the administration, collection and data reduction of these surveys, no results have been reported over the course of the last several years.

2012-2013 Student Learning Assessment Committee Annual Report - 26
2012-2013 Student Learning Assessment Committee Annual Report - 27
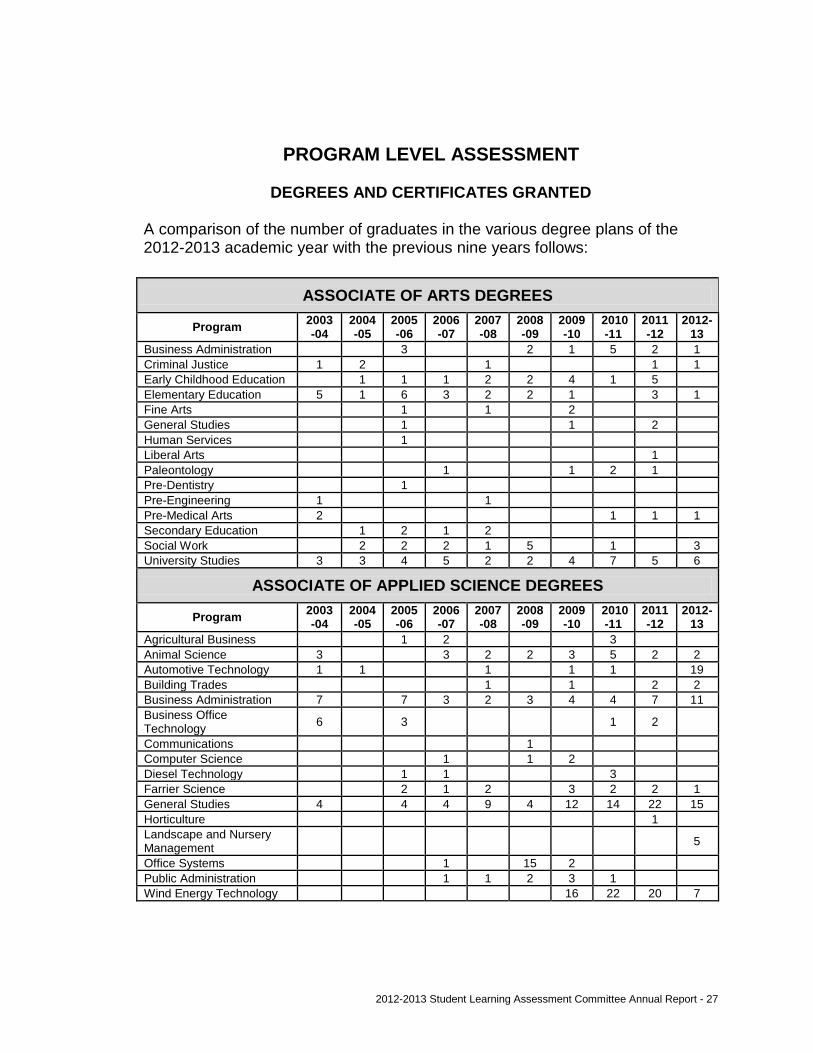
PROGRAM LEVEL ASSESSMENT
DEGREES AND CERTIFICATES GRANTED A comparison of the number of graduates in the various degree plans of the 2012-2013 academic year with the previous nine years follows:
ASSOCIATE OF ARTS DEGREES
Program 2003-04
2004-05
2005-06
2006-07
2007-08
2008 -09
2009-10
2010 -11
2011 -12
2012-13
Business Administration 3 2 1 5 2 1 Criminal Justice 1 2 1 1 1 Early Childhood Education 1 1 1 2 2 4 1 5 Elementary Education 5 1 6 3 2 2 1 3 1 Fine Arts 1 1 2 General Studies 1 1 2 Human Services 1 Liberal Arts 1 Paleontology 1 1 2 1 Pre-Dentistry 1 Pre-Engineering 1 1 Pre-Medical Arts 2 1 1 1 Secondary Education 1 2 1 2 Social Work 2 2 2 1 5 1 3 University Studies 3 3 4 5 2 2 4 7 5 6
ASSOCIATE OF APPLIED SCIENCE DEGREES
Program 2003 -04
2004 -05
2005 -06
2006 -07
2007-08
2008 -09
2009 -10
2010 -11
2011 -12
2012-13
Agricultural Business 1 2 3 Animal Science 3 3 2 2 3 5 2 2 Automotive Technology 1 1 1 1 1 19 Building Trades 1 1 2 2 Business Administration 7 7 3 2 3 4 4 7 11 Business Office Technology 6 3 1 2
Communications 1 Computer Science 1 1 2 Diesel Technology 1 1 3 Farrier Science 2 1 2 3 2 2 1 General Studies 4 4 4 9 4 12 14 22 15 Horticulture 1 Landscape and Nursery Management 5
Office Systems 1 15 2 Public Administration 1 1 2 3 1 Wind Energy Technology 16 22 20 7

2012-2013 Student Learning Assessment Committee Annual Report - 28
OCCUPATIONAL CERTIFICATES
Program 2003-04
2004-05
2005-06
2006-07
2007-08
2008-09
2009 -10
2010 - 11
2011 - 12
2012-13
Gnathology for the Horse Owner 6 1 4
Artistic Silversmithing 2 Automotive Technology 1 Advanced Automotive Technician 2
Basic Auto Technician 1 Basic Woodworking 2 Building Trades 1 2 2 Business Administration 1 Commercial Truck Driving 13 21 16 29 48 Computer/ Information Systems 8 18 29
Computer Maintenance 19 Corrections Officer 14 21 Diesel Technology 1
Farrier Science 3 1 1 6 3 3 7 3 3 Fine Arts 3 3 1 General Studies 1 Horticulture 1 Liberal Arts 3 1 Metal Arts
1 1 2
Nail Technology 3 1 2 PC Specialist 48 Pre-Nursing 2 7 2 2 6 5 Professional and Technical Writing 2
Publishing Specialist 14 Wind Energy Technology 17 23 47 19 Wind Energy Technology Occupational 29
Total Degrees and Certificates 52 34 70 60 108 70 93 132 144 240

2012-2013 Student Learning Assessment Committee Annual Report - 29
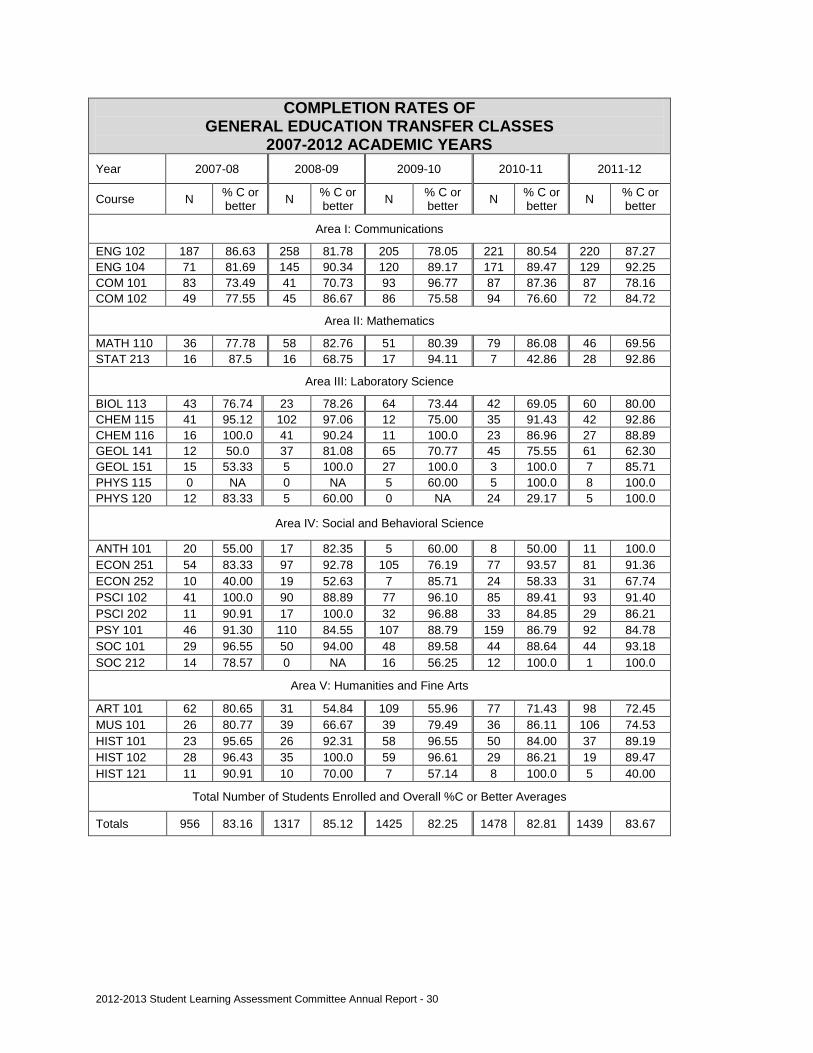
COMPLETION RATES OF GENERAL EDUCATION CORE CLASSES The data below also includes dual enrollment of high school students taking classes through the College.
COMPLETION RATES OF GENERAL EDUCATION TRANSFER CLASSES
2007-2012 ACADEMIC YEARS Year 2012-13
Course N % C or better N % C or
better N % C or better N % C or
better N % C or better
Area I: Communications
ENG 102 193 87.05 ENG 104 142 92.25 COM 101 76 67.11 COM 102 82 92.68
Area II: Mathematics
MATH 110 50 80.00 STAT 213 8 75.00
Area III: Laboratory Science
BIOL 113 45 86.67 CHEM 113 10 60.00 CHEM 115 18 55.56 CHEM 116 0 GEOL 141 30 80.00 GEOL 151 5 80.00 PHYS 115 5 60.00 PHYS 120 23 78.26
Area IV: Social and Behavioral Science
ANTH 101 10 80.00 ECON 251 91 94.79 ECON 252 10 100.0 PSCI 102 89 96.63 PSCI 202 29 79.31 PSY 101 57 87.72 SOC 101 52 86.54 SOC 212 0
Area V: Humanities and Fine Arts
ART 101 73 68.49 MUS 101 46 86.96 HIST 101 34 79.41 HIST 102 28 96.43 HIST 121 10 60.00
Total Number of Students Enrolled and Overall %C or Better Averages
Totals 1221 85.09
2012-2013 Student Learning Assessment Committee Annual Report - 30
COMPLETION RATES OF GENERAL EDUCATION TRANSFER CLASSES
2007-2012 ACADEMIC YEARS Year 2007-08 2008-09 2009-10 2010-11 2011-12
Course N % C or better N % C or
better N % C or better N % C or
better N % C or better
Area I: Communications
ENG 102 187 86.63 258 81.78 205 78.05 221 80.54 220 87.27 ENG 104 71 81.69 145 90.34 120 89.17 171 89.47 129 92.25 COM 101 83 73.49 41 70.73 93 96.77 87 87.36 87 78.16 COM 102 49 77.55 45 86.67 86 75.58 94 76.60 72 84.72
Area II: Mathematics
MATH 110 36 77.78 58 82.76 51 80.39 79 86.08 46 69.56 STAT 213 16 87.5 16 68.75 17 94.11 7 42.86 28 92.86
Area III: Laboratory Science
BIOL 113 43 76.74 23 78.26 64 73.44 42 69.05 60 80.00 CHEM 115 41 95.12 102 97.06 12 75.00 35 91.43 42 92.86 CHEM 116 16 100.0 41 90.24 11 100.0 23 86.96 27 88.89 GEOL 141 12 50.0 37 81.08 65 70.77 45 75.55 61 62.30 GEOL 151 15 53.33 5 100.0 27 100.0 3 100.0 7 85.71 PHYS 115 0 NA 0 NA 5 60.00 5 100.0 8 100.0 PHYS 120 12 83.33 5 60.00 0 NA 24 29.17 5 100.0
Area IV: Social and Behavioral Science
ANTH 101 20 55.00 17 82.35 5 60.00 8 50.00 11 100.0 ECON 251 54 83.33 97 92.78 105 76.19 77 93.57 81 91.36 ECON 252 10 40.00 19 52.63 7 85.71 24 58.33 31 67.74 PSCI 102 41 100.0 90 88.89 77 96.10 85 89.41 93 91.40 PSCI 202 11 90.91 17 100.0 32 96.88 33 84.85 29 86.21 PSY 101 46 91.30 110 84.55 107 88.79 159 86.79 92 84.78 SOC 101 29 96.55 50 94.00 48 89.58 44 88.64 44 93.18 SOC 212 14 78.57 0 NA 16 56.25 12 100.0 1 100.0
Area V: Humanities and Fine Arts
ART 101 62 80.65 31 54.84 109 55.96 77 71.43 98 72.45 MUS 101 26 80.77 39 66.67 39 79.49 36 86.11 106 74.53 HIST 101 23 95.65 26 92.31 58 96.55 50 84.00 37 89.19 HIST 102 28 96.43 35 100.0 59 96.61 29 86.21 19 89.47 HIST 121 11 90.91 10 70.00 7 57.14 8 100.0 5 40.00
Total Number of Students Enrolled and Overall %C or Better Averages
Totals 956 83.16 1317 85.12 1425 82.25 1478 82.81 1439 83.67

2012-2013 Student Learning Assessment Committee Annual Report - 31
PSDA CYCLE 2011-2012 ANALYSIS OPPORTUNITIES FOR IMPROVEMENT
Problem Area It is important for the College to identify courses with high failure and/or drop-out rates. Up to this point in time, these trends have not been considered. Goal
Identify courses with high failure and/or drop-out rates. Action SLAC will establish a process of identifying courses with high failure and/or drop-out rates.
Results No attempt was made by the Student Learning Assessment Committee to establish a process to identify courses with high failure/dropout rates. A preliminary discussion was held between the Chair of the Student Learning Committee and the new Retention Specialist regarding the importance of evaluating this data and establish possible plans to improve student success in these courses.
PDSA CYCLE 2012-2013 ANALYSIS
OPPORTUNITIES FOR IMPROVEMENT Problem Area The College does not utilize the plan-do-study-adjust cycle to assess efforts for improving student retention, persistence and graduation. Goal The College is considering applying for the Higher Learning Commission’s Academy for Student Persistence and Completion in order to establish and implement a comprehensive plan to assess and improve retention, persistence and completion efforts. Action Plan Apply for the Higher Learning Commission’s Academy for Student Persistence and Completion in order to establish and implement a comprehensive plan to assess and improve retention, persistence and completion efforts. If this is not

2012-2013 Student Learning Assessment Committee Annual Report - 32
feasible, the College should consider participating in the New Mexico Higher Education Assessment Association’s (NMHEAA) summer 2014 retreat by sending a team of 4 or more participants to develop a plan-do-study-adjust cycle of assessment to improve student retention, persistence and graduation. Results To be discussed in the 2013-2014 report.

2012-2013 Student Learning Assessment Committee Annual Report - 33
STUDENT LEARNING ASSESSMENT PROGRAM REPORTS
The purpose of program level assessment is to document how well students are accomplishing the program specific objectives and general education competencies. The program objectives and general education competencies are Mesalands’ contract with all stakeholders and reflect those competencies that students will possess and demonstrate upon graduation. These program objectives and general education competencies reflect those knowledge, skills and professional dispositions valued by workplace employers and other interested parties and represent the most deeply held values of the College, thereby driving much of what occurs at Mesalands. Degree programs are required to assess both general education competency and program objective outcomes. Certificate programs are required to measure program objective outcomes only. The Student Learning Assessment Program Reports collectively document the College’s attempt to more succinctly and comprehensively identify and measure outcomes attainment and to use this information to improve learning. The individual program reports are published in a separate document entitled Student Learning Assessment Program Reports 2012-2013 and are available on the College website.
2012-2013 Student Learning Assessment Committee Annual Report - 34
2012-2013 Student Learning Assessment Committee Annual Report - 35
ASSESSING PROGRAM ASSESSMENT 2012-2013
Assessment can be defined as the process of determining the quality and quantity of student learning in order to make improvements (Bordon and Zak, 2001). It is critical that faculty members at Mesalands Community College meaningfully capture and document what they are teaching, what students are learning and how this information ultimately improves the teaching-learning relationship. To that end, Mesalands Community College encourages faculty to take “ownership” of their respective programs and courses in terms of whether or not students are learning what faculty say they are learning as identified in the course objectives, program objectives and general education competencies. Effective assessment of student learning is a matter of commitment, not a matter of compliance. Mesalands Community College is dedicated to establishing a culture of assessment embedded in every aspect of the educational process. In order to improve the plandostudyadjust cycle of program assessment at the College, the Student Learning Assessment Committee (SLAC) assesses program assessment on an annual basis. The goals of assessing the assessment are twofold. First, this report will give feedback to the faculty as to how they are doing in terms of assessment with the goal of helping them to continually improve the teaching-learning relationship both inside and outside the classroom. Second, this report will help the College identify how it is doing in terms of its own assessment efforts with the goal of attentively reshaping and meaningfully improving the continual process of student learning and assessment. This report focuses on how well programs are assessing both program objectives and general education competencies. Degree and certificate programs are required to complete an annual report documenting their annual assessment activities. Lead faculty and program directors are encouraged to modify their reports so as to better meet the individual needs and characteristics of their programs and make the report more meaningful to all stakeholders. These reports are then reviewed by the Chair of the Student Learning Assessment Committee who uses the Student Learning Assessment Program Report Evaluation Rubric to evaluate each program report. Results of this evaluation are shared with the College during the August Assessment Day. Generally speaking, SLAC would like to see a migration of programs from the left hand columns of the following rubrics to the right hand columns indicating more comprehensive and meaningful assessment efforts. It is SLAC’s goal to facilitate this migration.

2012-2013 Student Learning Assessment Committee Annual Report - 36

2012-2013 Student Learning Assessment Committee Annual Report - 37
MEASURES PROGRAM OBJECTIVES*
1 No program objectives
measured
2 Some program objectives
measured (<50%)
3 Most program objectives
measured (<100%)
4 Measures all program
objectives Farrier Science (4) Social Work (4)
Natural Sciences (4) Animal Science (S) Business Administration (S) Business Office Technology (S) Early Childhood (S) Fine Arts (1) Professional Writing (S) Wind Energy Technology (3)
USES MULTIPLE MEASURES: PROGRAM OBJECTIVES*
1
No measures 2
One (1) measure 3
Two (2) measures 4
Three (3(triangulation)) or more measures
Farrier Science (2) Social Work (4)
Business Administration (S) Business Office Technology (S) Wind Energy Technology (3)
Animal Science (S) Early Childhood (S) Natural Sciences (2)
Fine Arts (S) Professional Writing (S)
2012-2013 Student Learning Assessment Committee Annual Report - 38

2012-2013 Student Learning Assessment Committee Annual Report - 39
MEASURES GENERAL EDUCATION COMPETENCIES * Communication-Writing (Writing Across the Curriculum)
1 No General Education
Competency: Communication-Writing
measured
2
3
4 General Education
Competency: Communication-Writing
measured Business Administration (4) Business Office Technology (4) University Studies (4)
AAS General Studies (1) Animal Science (S) Early Childhood (S) Farrier Science (S) Fine Arts (S) Natural Sciences (1) Pre-Nursing (S) Professional Writing (S) Social Work (S) University Studies (S) Wind Energy Technology (S)
Communication-Oral Presentation
1 No General Education
Competency: Communication-Oral
Presentation measured
2
3
4 General Education
Competency: Communication-Oral
Presentation measured
Business Administration (S) Business Office Technology (4) Farrier Science (4) Fine Arts (S) Natural Sciences (S) Social Work (S) University Studies (4) Wind Energy Technology (S)
AAS General Studies (S) Animal Science (S) Early Childhood (S) Pre-Nursing (S)
2012-2013 Student Learning Assessment Committee Annual Report - 40
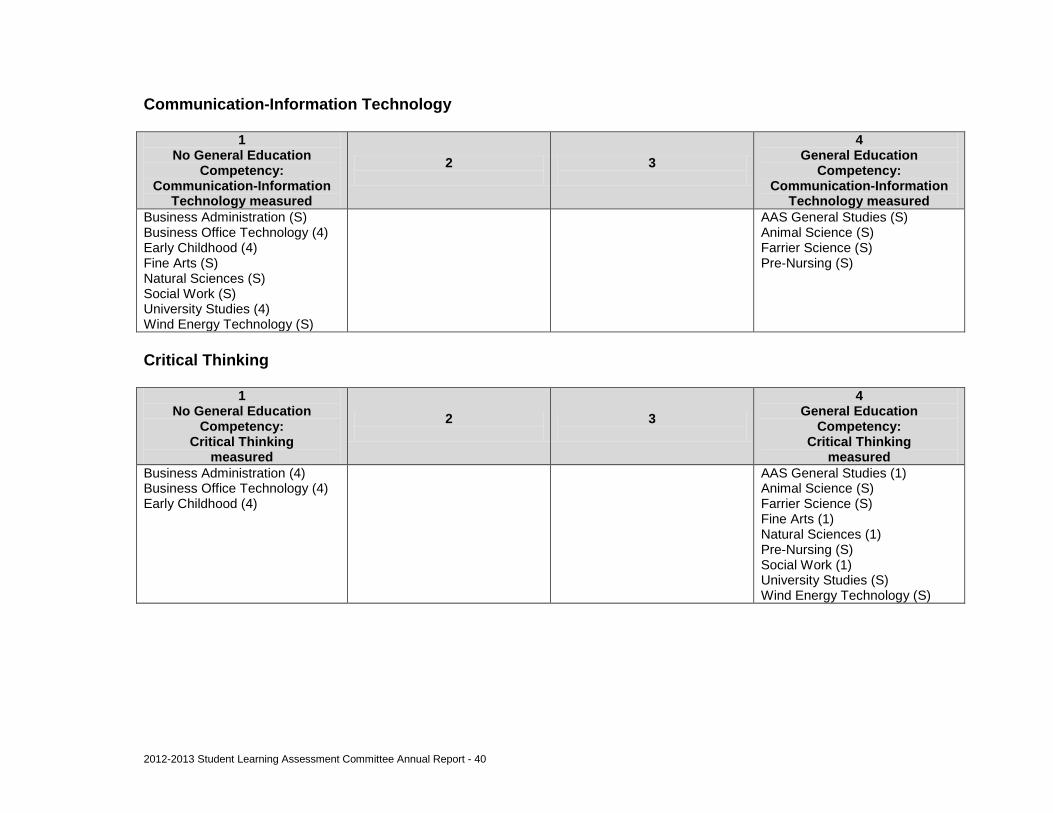
Communication-Information Technology
1 No General Education
Competency: Communication-Information
Technology measured
2
3
4 General Education
Competency: Communication-Information
Technology measured Business Administration (S) Business Office Technology (4) Early Childhood (4) Fine Arts (S) Natural Sciences (S) Social Work (S) University Studies (4) Wind Energy Technology (S)
AAS General Studies (S) Animal Science (S) Farrier Science (S) Pre-Nursing (S)
Critical Thinking
1 No General Education
Competency: Critical Thinking
measured
2
3
4 General Education
Competency: Critical Thinking
measured Business Administration (4) Business Office Technology (4) Early Childhood (4)
AAS General Studies (1) Animal Science (S) Farrier Science (S) Fine Arts (1) Natural Sciences (1) Pre-Nursing (S) Social Work (1) University Studies (S) Wind Energy Technology (S)
2012-2013 Student Learning Assessment Committee Annual Report - 41
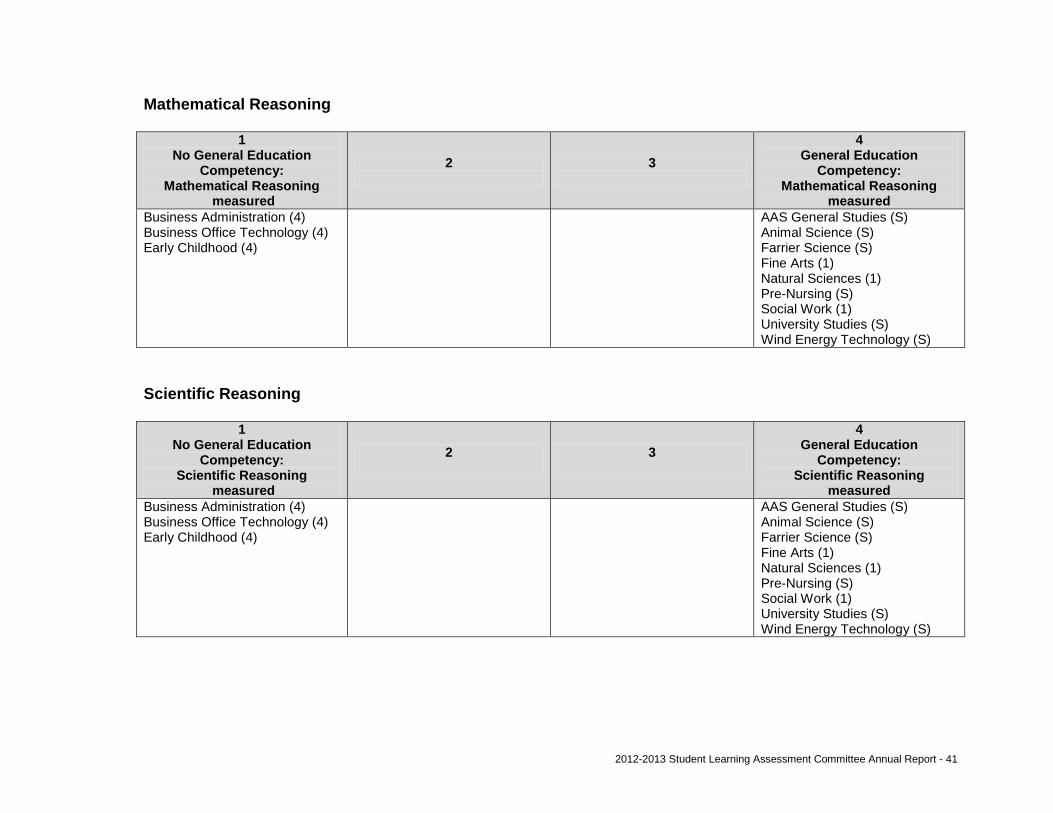
Mathematical Reasoning
1 No General Education
Competency: Mathematical Reasoning
measured
2
3
4 General Education
Competency: Mathematical Reasoning
measured Business Administration (4) Business Office Technology (4) Early Childhood (4)
AAS General Studies (S) Animal Science (S) Farrier Science (S) Fine Arts (1) Natural Sciences (1) Pre-Nursing (S) Social Work (1) University Studies (S) Wind Energy Technology (S)
Scientific Reasoning
1 No General Education
Competency: Scientific Reasoning
measured
2
3
4 General Education
Competency: Scientific Reasoning
measured Business Administration (4) Business Office Technology (4) Early Childhood (4)
AAS General Studies (S) Animal Science (S) Farrier Science (S) Fine Arts (1) Natural Sciences (1) Pre-Nursing (S) Social Work (1) University Studies (S) Wind Energy Technology (S)
2012-2013 Student Learning Assessment Committee Annual Report - 42
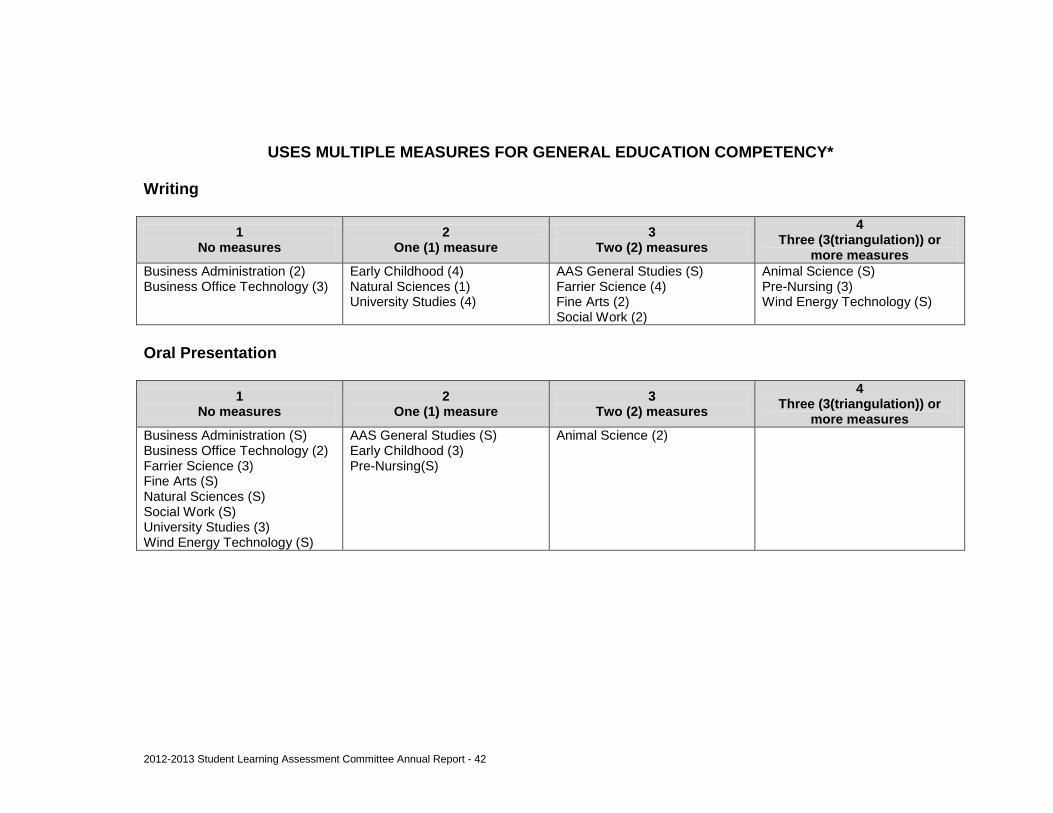
USES MULTIPLE MEASURES FOR GENERAL EDUCATION COMPETENCY*
Writing
1 No measures
2 One (1) measure
3 Two (2) measures
4 Three (3(triangulation)) or
more measures Business Administration (2) Business Office Technology (3)
Early Childhood (4) Natural Sciences (1) University Studies (4)
AAS General Studies (S) Farrier Science (4) Fine Arts (2) Social Work (2)
Animal Science (S) Pre-Nursing (3) Wind Energy Technology (S)
Oral Presentation
1 No measures
2 One (1) measure
3 Two (2) measures
4 Three (3(triangulation)) or
more measures Business Administration (S) Business Office Technology (2) Farrier Science (3) Fine Arts (S) Natural Sciences (S) Social Work (S) University Studies (3) Wind Energy Technology (S)
AAS General Studies (S) Early Childhood (3) Pre-Nursing(S)
Animal Science (2)
2012-2013 Student Learning Assessment Committee Annual Report - 43
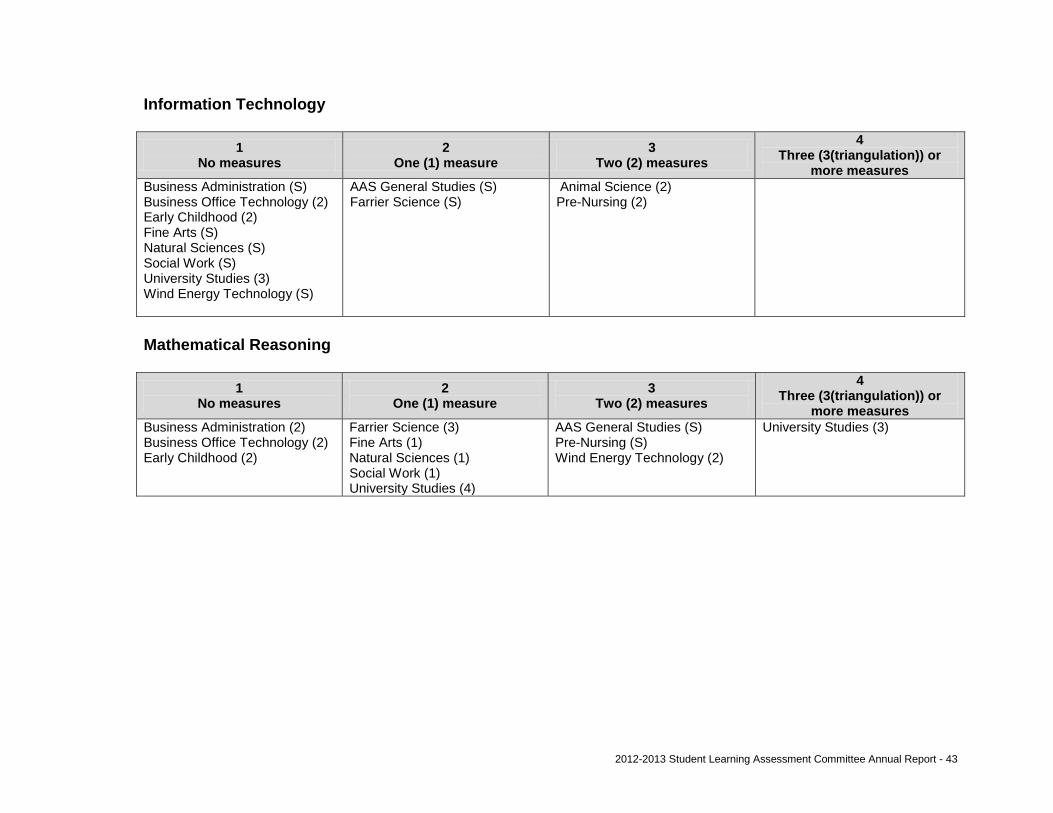
Information Technology
1 No measures
2 One (1) measure
3 Two (2) measures
4 Three (3(triangulation)) or
more measures Business Administration (S) Business Office Technology (2) Early Childhood (2) Fine Arts (S) Natural Sciences (S) Social Work (S) University Studies (3) Wind Energy Technology (S)
AAS General Studies (S) Farrier Science (S)
Animal Science (2) Pre-Nursing (2)
Mathematical Reasoning
1 No measures
2 One (1) measure
3 Two (2) measures
4 Three (3(triangulation)) or
more measures Business Administration (2) Business Office Technology (2) Early Childhood (2)
Farrier Science (3) Fine Arts (1) Natural Sciences (1) Social Work (1) University Studies (4)
AAS General Studies (S) Pre-Nursing (S) Wind Energy Technology (2)
University Studies (3)

2012-2013 Student Learning Assessment Committee Annual Report - 44
Scientific Reasoning
1 No measures
2 One (1) measure
3 Two (2) measures
4 Three (3(triangulation)) or
more measures Business Administration (2) Business Office Technology (3) Early Childhood (2)
Farrier Science (3) Fine Arts (1) Natural Sciences (1) Social Work (1) University Studies (4)
AAS General Studies (S) Animal Science (2) Pre-Nursing (S) Wind Energy Technology (2)
Critical Thinking
1 No measures
2 One (1) measure
3 Two (2) measures
4 Three (3(triangulation)) or
more measures Business Administration (2) Business Office Technology (3) Early Childhood (2)
AAS General Studies (S) Farrier Science (4) Fine Arts (1) Natural Sciences (1) Social Work (1) University Studies (4)
Pre-Nursing (S) Wind Energy Technology (2)
Animal Science (S)
2012-2013 Student Learning Assessment Committee Annual Report - 45
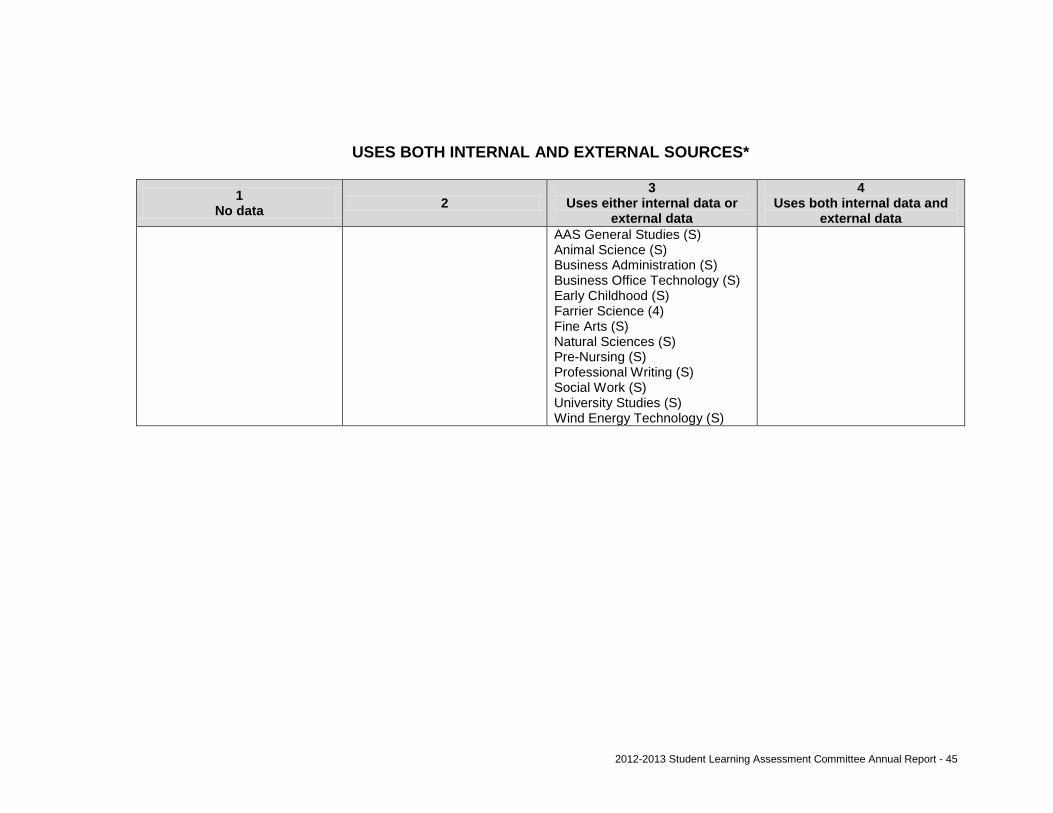
USES BOTH INTERNAL AND EXTERNAL SOURCES*
1 No data 2
3 Uses either internal data or
external data
4 Uses both internal data and
external data
AAS General Studies (S) Animal Science (S) Business Administration (S) Business Office Technology (S) Early Childhood (S) Farrier Science (4) Fine Arts (S) Natural Sciences (S) Pre-Nursing (S) Professional Writing (S) Social Work (S) University Studies (S) Wind Energy Technology (S)

2012-2013 Student Learning Assessment Committee Annual Report - 46

2012-2013 Student Learning Assessment Committee Annual Report - 47
HAS COMPLETE DATA SUMMARY*
1 No data summary
2 Minimal summary explaining
little data
3 Partial summary explaining
some data
4 Full data summary explaining who, what, where, when, how,
why and to what extent
Animal Science (S) Business Office Technology (S) Fine Arts (S) Professional Writing (S) Social Work (S) University Studies (S)
AAS General Studies (S) Early Childhood (S) Pre-Nursing (2)
Business Administration (2) Farrier Science (3) Natural Sciences (3) Wind Energy Technology (S)

2012-2013 Student Learning Assessment Committee Annual Report - 48

2012-2013 Student Learning Assessment Committee Annual Report - 49
CHANGES TO CURRICULUM BASED ON DATA (CLOSES THE LOOP)*
1 No changes made
2 Changes made without data/changes based on
anecdotal data
3 Changes made based on
empirical data
4 Changes made based on
empirical data with follow-up plans to measure
effectiveness
AAS General Studies (1) Animal Science (1) Business Office Technology (S) Early Childhood (3) Fine Arts (S) Social Work (3) University Studies (S)
Pre-Nursing (2) Professional Writing (2)
Business Administration (S) Farrier Science (3) Natural Sciences (S) Wind Energy Technology (3)
*The number in parenthesis following the program title represents that column under which that specific program appeared last year. An “S” meaning “same” indicates that the program did not change columns from last year while an “N” indicates that the program is “new” to the chart and did not appear on it last year. As indicated earlier, SLAC would like to see a migration of programs from the left hand columns of the rubric to the right hand columns indicating more comprehensive and meaningful assessment efforts.

2012-2013 Student Learning Assessment Committee Annual Report - 50

2012-2013 Student Learning Assessment Committee Annual Report - 51
STUDENT LEARNING ASSESSMENT PROGRAM REPORT EVALUATION RUBRIC MESALANDS COMMUNITY COLLEGE
Evaluation Criteria 1 2 3 4
Measures Program Objectives
No program objectives measured.
Some program objectives measured. (<50%)
Most program objectives measured. (<100%) All program objectives measured.
Uses Multiple Measures: Program Objectives No measures. One measure. Two measures. Three (triangulation) or more measures.
Measures General Education Competencies** Not measured Measured
Uses Multiple Measures- General Education Competencies
No measures. One measure. Two measures. Three (triangulation) or more measures.
Uses Both Internal and External Sources No data. Uses either internal data or
external data. Uses both internal data and external data.
Has Complete Data Summary No data summary. Minimal summary explaining
little data. Partial summary explaining some data.
Full data summary explaining who, what, where, when, how, why and to what extent.
Changes to Curriculum Based on Data (Closes the Loop)
No changes made. Changes made without data/changes based on anecdotal data.
Changes made based on empirical data.
Changes made based on empirical data with follow-up plans to measure effectiveness.
**Assessment of the General Education Competencies is based on the General Education Competency Reporting Schedule.

2010-2011 Student Learning Assessment Committee Annual Report - 52
2010-2011 Student Learning Assessment Committee Annual Report - 53
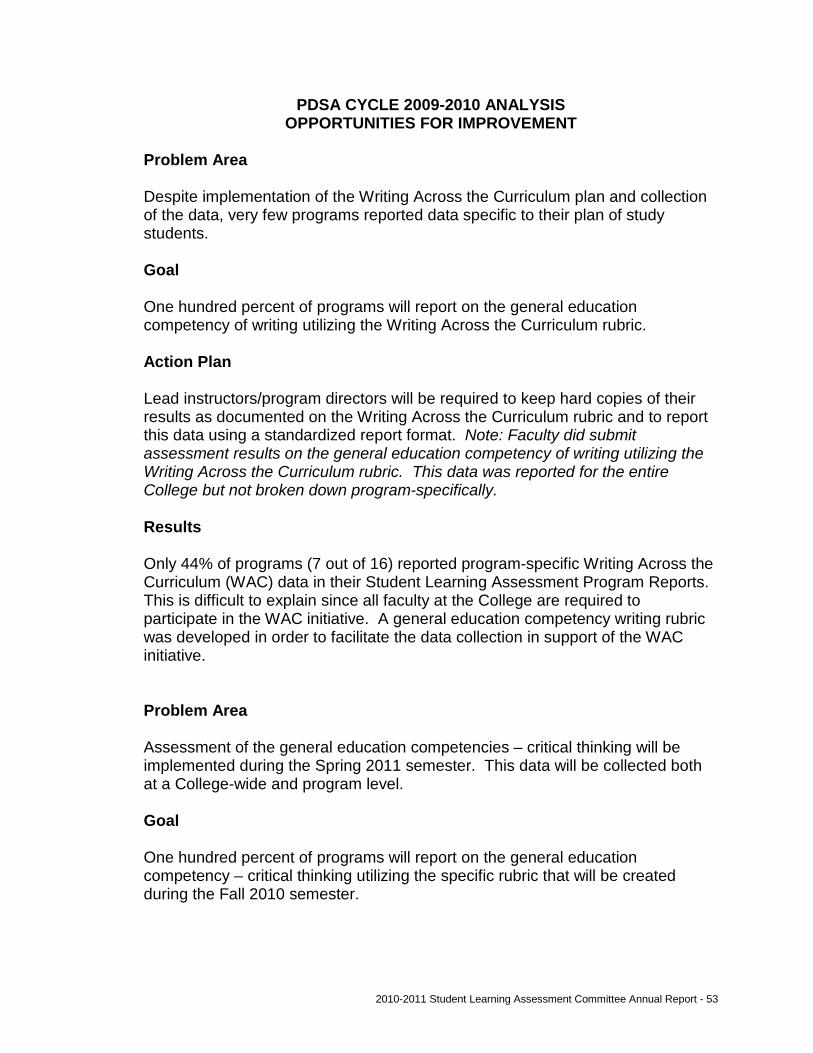
PDSA CYCLE 2009-2010 ANALYSIS OPPORTUNITIES FOR IMPROVEMENT
Problem Area Despite implementation of the Writing Across the Curriculum plan and collection of the data, very few programs reported data specific to their plan of study students. Goal One hundred percent of programs will report on the general education competency of writing utilizing the Writing Across the Curriculum rubric. Action Plan Lead instructors/program directors will be required to keep hard copies of their results as documented on the Writing Across the Curriculum rubric and to report this data using a standardized report format. Note: Faculty did submit assessment results on the general education competency of writing utilizing the Writing Across the Curriculum rubric. This data was reported for the entire College but not broken down program-specifically. Results Only 44% of programs (7 out of 16) reported program-specific Writing Across the Curriculum (WAC) data in their Student Learning Assessment Program Reports. This is difficult to explain since all faculty at the College are required to participate in the WAC initiative. A general education competency writing rubric was developed in order to facilitate the data collection in support of the WAC initiative.
Problem Area Assessment of the general education competencies – critical thinking will be implemented during the Spring 2011 semester. This data will be collected both at a College-wide and program level. Goal One hundred percent of programs will report on the general education competency – critical thinking utilizing the specific rubric that will be created during the Fall 2010 semester.

2010-2011 Student Learning Assessment Committee Annual Report - 54
Action Plan The Student Learning Assessment Committee will be responsible for creating the rubric as well as “rolling out” this plan to all full-time and adjunct faculty. Results Only 12% of programs (2 of 16) reported program-specific data on critical thinking competency attainment. After this goal was established, the SLAC decided to allow all faculty to assess either the general education competencies of critical thinking or oral presentation. Thirty-one percent (5 of 16) of programs reported oral presentation competency attainment. Having said that, only 44% of programs (7 of 16) reported program specific data on either critical thinking or oral presentation competency attainment in their Student Learning Assessment Reports.
PDSA CYCLE 2011-2012 ANALYSIS OPPORTUNITIES FOR IMPROVEMENT
Problem Area Three years ago with the initiation of the updated Student Learning Assessment Program Reports, lead faculty and program directors were given a report format to assist in the generation of the individual program reports. This suggested report format was in response to faculty requests for directions on what they “needed to do.” Goal Facilitate faculty to take more ownership of their program reports by encouraging them to modify, revise and rework them to more adequately reflect the unique characteristics and needs of the program with the ultimate goal of improving learning. Action Plan Discuss in detail the above mentioned goal at the spring 2013 Assessment Day. Results On Friday, January 18, 2013, a significant amount of time was spent during the Faculty Council meeting discussing the collective quality of the Student Learning Assessment Program Reports. General and specific suggestions were made to lead faculty and program directors on how to revise and rework the Reports to
2010-2011 Student Learning Assessment Committee Annual Report - 55
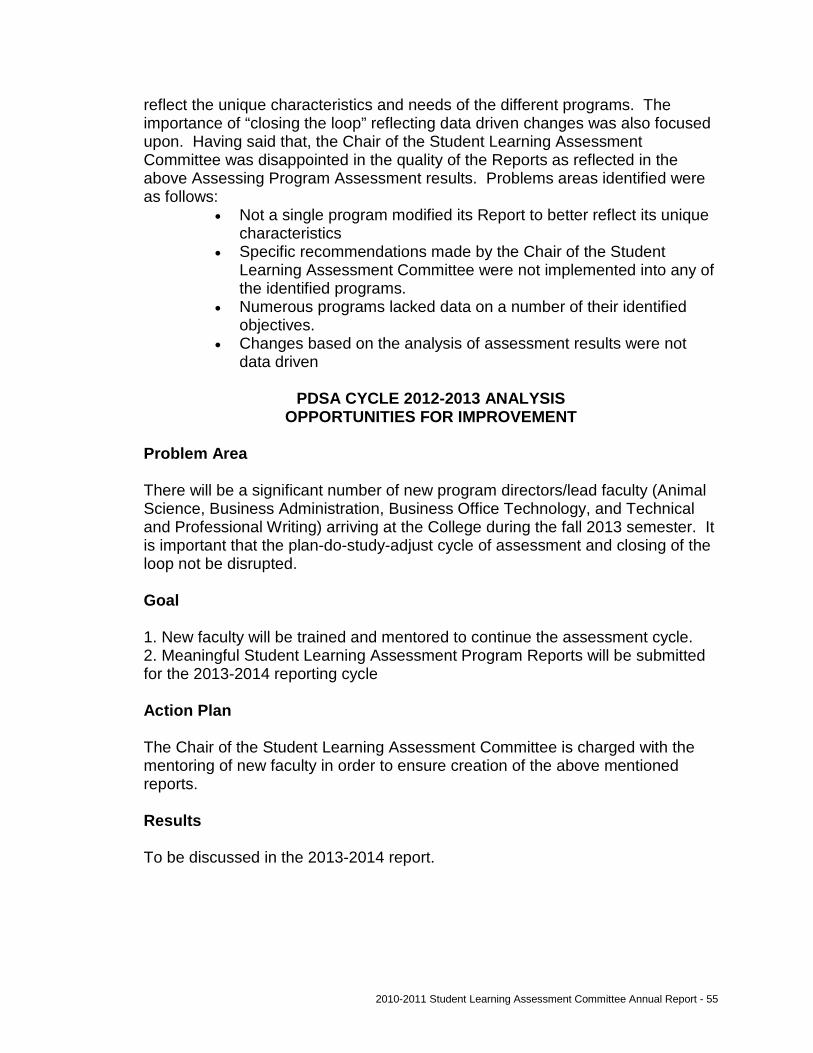
reflect the unique characteristics and needs of the different programs. The importance of “closing the loop” reflecting data driven changes was also focused upon. Having said that, the Chair of the Student Learning Assessment Committee was disappointed in the quality of the Reports as reflected in the above Assessing Program Assessment results. Problems areas identified were as follows:
• Not a single program modified its Report to better reflect its unique characteristics
• Specific recommendations made by the Chair of the Student Learning Assessment Committee were not implemented into any of the identified programs.
• Numerous programs lacked data on a number of their identified objectives.
• Changes based on the analysis of assessment results were not data driven
PDSA CYCLE 2012-2013 ANALYSIS
OPPORTUNITIES FOR IMPROVEMENT Problem Area There will be a significant number of new program directors/lead faculty (Animal Science, Business Administration, Business Office Technology, and Technical and Professional Writing) arriving at the College during the fall 2013 semester. It is important that the plan-do-study-adjust cycle of assessment and closing of the loop not be disrupted. Goal 1. New faculty will be trained and mentored to continue the assessment cycle. 2. Meaningful Student Learning Assessment Program Reports will be submitted for the 2013-2014 reporting cycle Action Plan The Chair of the Student Learning Assessment Committee is charged with the mentoring of new faculty in order to ensure creation of the above mentioned reports. Results To be discussed in the 2013-2014 report.

2010-2011 Student Learning Assessment Committee Annual Report - 56

2010-2011 Student Learning Assessment Committee Annual Report - 57
CLASSROOM LEVEL ASSESSMENT The goal of faculty assessment of student learning at the individual course level is to identify what has and has not worked at increasing learning in the classroom and how this information can be used in present and future classes to improve the teaching-learning relationship between faculty and students. Historically, Mesalands Community College required all faculty to complete a Faculty Outcomes Assessment Form. This form was the College’s attempt to collect quantitative data regarding the students’ performance on the courses’ identified learning outcomes, i.e., course objectives. The Faculty Outcomes Assessment Form was not well received by faculty. Faculty indicated that the form was too time consuming to fill out while the information they were required to supply did not lead to improved student learning. Based on this feedback, the SLAC redesigned the form to make it more user friendly, as well as provide more useful information that could be used to improve student learning, regardless of who was teaching the course in question. The new MCC Faculty Outcomes Assessment Narrative Form asks three questions: 1) Comment on any strategies you used in the course that improved student
learning. 2) Comment on anything that was not successful in meeting your learning
objectives. 3) What changes to this course would you recommend for yourself or another
instructor to improve student learning the next time this course is offered? Faculty complete the MCC Faculty Outcomes Assessment Narrative Form for each class they teach at the end of the fall, spring and summer semesters. Electronic as well a hard copies of completed forms are kept on file and made available to all College faculty teaching that specific course. The availability of these forms is identified in the Student Learning Assessment Guide for Faculty. Faculty are encouraged to review the information on these Forms with the goal of assisting them at improving student learning.

XXX0813