
Lean production: Value stream analysis & application of SMED on ...
173
Lean production: Value stream analysis & application of SMED on pre-assembly machine Final degree project by Sarah Ayumi Johnsson
Transcript of Lean production: Value stream analysis & application of SMED on ...

Lean production: Value stream analysis & application of SMED on pre-assembly machine
Final degree project by Sarah Ayumi Johnsson
Final degree project, Sarah Ayumi Johnsson
Lean production: Value stream analysis & application of SMED on pre-assembly machine
I
Lean production: Value stream analysis and implementation of SMED on pre-assembly machine Final degree project 4G1187 (30 ECTS) By: Sarah Ayumi Johnsson The Royal Institute of Technology (KTH) School of Industrial Technology and Management (IIP) Master’s program: Production Engineering and Management (TPEMM) Supervisor, KTH: Roland Langhé Examiner, KTH: Mihai Nicolescu Company: ZF Ansa Lemförder S.L., Burgos, Spain Supervisor, ZF Ansa Lemförder: Julio Guerrero Keywords: Lean production, Toyota Production System, Single Minute Exchange of Dies (SMED), 5S
Final degree project, Sarah Ayumi Johnsson
Lean production: Value stream analysis & application of SMED on pre-assembly machine
II
Summary The market of the automotive industry is highly competitive and in order to regain and ensure lasting competitiveness, Lemförder group introduced the Lemförder Production System (LPS). ZF Ansa Lemförder as a part of the Lemförder group has been implementing LPS, which is a lean production system based on the Toyota Production System, since year 2006. This final degree project was a part of the company’s implementation of lean production. This report treats two main topics; value stream analysis of the company’s eight highest volume products as well as implementation of SMED (Single Minute Exchange of Dies) on a ball joint pre-assembly machine. The value stream analysis gave a general view of the state of the production process and by looking at the analysis 41 workshop and improvement proposals were created. The LPS group of the company ranked the proposals and by combining the results of the ranking with an economic study, the schedule of LPS workshops for 2008 could be set. The SMED implementation was done through a workshop with the objective of decreasing the changeover time by 50%. The workshop team activities were planned and coordinated by the student and several technical and organizational solutions were implemented during the workshop. The final result of the workshop was expected to be a 50% decrease of the changeover time and during the workshop a 39% decrease of the mechanical operations and adjustments was observed. At the time of finishing the project it was still too early to conclude the real impact of the workshop, but one month after the workshop, the average changeover time was 55 minutes which is below the objective. It remains to see if the long term average changeover time will continue to decrease or increase or if the results will be stable.

Final degree project, Sarah Ayumi Johnsson
Lean production: Value stream analysis & application of SMED on pre-assembly machine
III
Final degree project, Sarah Ayumi Johnsson
Lean production: Value stream analysis & application of SMED on pre-assembly machine
IV
Foreword This final degree project has been a challenging and fun experience because of: 1) initial difficulties to understand the language and 2) unforgettable and helpful colleagues at ZF Ansa Lemförder (Ansa). I almost didn’t speak Spanish when I first arrived at Ansa, but thanks to daily Spanish classes and lots of help from co-workers I actually managed to coordinate a workshop in Spanish! I would like to thank all people at Ansa for their help and support as well as praise them for their patience when I asked them many questions. An extra thank you to:
o Julio Guerrero (LPS coordinator/supervisor): for giving me the liberty to choose the topic of the project and for helping me to understand many things.
o Joaquín Melgar and Juan Manuel de Prado (engineers): for teaching me many things about the company and also for broadening my Spanish vocabulary.
o Yolanda Ruiz (HR): for advices about daily Spanish life which made it easier to get by after working hours.
o Jose Ignacio Martinez (HR): for giving me the opportunity to do my final degree project at Ansa.
During the project I received the Leonardo scholarship, and I couldn’t have done this without that economic help. So, thank you Åsa Andersson at the International office at KTH for the help with the grant. Also, thank you Roland Langhé (my KTH supervisor) for giving me advice during the whole project. Stockholm, Sweden, 2008-04-02 Sarah Johnsson

Final degree project, Sarah Ayumi Johnsson
Lean production: Value stream analysis & application of SMED on pre-assembly machine
V
Final degree project, Sarah Ayumi Johnsson
Lean production: Value stream analysis & application of SMED on pre-assembly machine
VI
Table of contents 1 INTRODUCTION .................................................................................................... 1
1.1 The final degree project .................................................................................... 1 1.1.1 Background............................................................................................... 1 1.1.2 Target group.............................................................................................. 1 1.1.3 Tasks ......................................................................................................... 1 1.1.4 Expected results and usage ....................................................................... 2 1.1.5 Goal........................................................................................................... 2 1.1.6 Scope......................................................................................................... 3
1.2 Methods and material........................................................................................ 3 1.2.1 Method ...................................................................................................... 3 1.2.2 Reliability and Validity............................................................................. 5 1.2.3 Material ..................................................................................................... 7 1.2.4 Software for data collection...................................................................... 7
1.3 Data collection and interviews.......................................................................... 8 1.3.1 Data collection .......................................................................................... 8 1.3.2 Interviews.................................................................................................. 8
2 DESCRIPTION OF THE COMPANY – ZF Ansa Lemförder................................. 9 2.1 Facts and history ............................................................................................... 9 2.2 Customers ....................................................................................................... 10 2.3 Products and sales ........................................................................................... 11 2.4 References and production processes ............................................................. 13 2.5 Organization.................................................................................................... 15
2.5.1 The ZF group .......................................................................................... 15 2.5.2 Ansa ........................................................................................................ 15 2.5.3 LPS - Lemförder Production System...................................................... 16 2.5.4 LPS Vision.............................................................................................. 16 2.5.5 LPS activities .......................................................................................... 18 2.5.6 LPS organization..................................................................................... 18 2.5.7 The Steering Committee ......................................................................... 19
3 THEORY ................................................................................................................ 20 3.1 Philosophy ...................................................................................................... 20
3.1.1 LPS, TPS & Lean Manufacturing........................................................... 20 3.1.2 TPS history ............................................................................................. 20 3.1.3 TPS – Toyota Production System........................................................... 22 3.1.4 LPS - Lemförder Production System...................................................... 26 3.1.5 The roof of LPS ...................................................................................... 27 3.1.6 The 4 pillars of LPS – Flow, Takt, Pull and Zero failure ....................... 28 3.1.7 The base of LPS...................................................................................... 29
3.2 LPS analysis tools ........................................................................................... 31 3.2.1 Value Stream Analysis / Value Stream Mapping ................................... 32 3.2.2 Spaghetti diagram ................................................................................... 34 3.2.3 Material Flow Diagram........................................................................... 35 3.2.4 Muda check (Waste check)..................................................................... 35 3.2.5 Finding the root cause by asking why 5 times........................................ 37
3.3 LPS Workshops .............................................................................................. 38 3.3.1 Savings Estimation for workshops ......................................................... 40 3.3.2 LPS workshop: SMED............................................................................ 42
Final degree project, Sarah Ayumi Johnsson
Lean production: Value stream analysis & application of SMED on pre-assembly machine
VII
3.3.3 LPS workshop: OEE............................................................................... 53 3.3.4 LPS workshop: PULL............................................................................. 56 3.3.5 LPS workshop: 5S – Sift, Set, Sweep, Standardize and Sustain ............ 62 3.3.6 LPS workshop: Self Control ................................................................... 66 3.3.7 Other LPS workshops ............................................................................. 67
4 PRE-STUDY - LPS practice workshop: SMED and 5S in BTB machine 928 ...... 68 4.1 Theme and objective ....................................................................................... 68 4.2 Method and schedule ...................................................................................... 68 4.3 The BTB production cell ................................................................................ 70
4.3.1 Initial state of machine 928..................................................................... 70 4.4 Before the workshop ....................................................................................... 72 4.5 Execution of the workshop ............................................................................. 72
4.5.1 Phase 1 and 2: Education and objectives ................................................ 72 4.5.2 Phase 3: Analysis .................................................................................... 73 4.5.3 Phase 4: Ideas and solutions ................................................................... 77 4.5.4 Phase 5: Solution implementation .......................................................... 78 4.5.5 Phase 6: Evaluation of results ................................................................. 80 4.5.6 Phase 7: Standardization......................................................................... 81 4.5.7 Phase 8: Communication of results ........................................................ 81
4.6 Lessons learned............................................................................................... 81 4.7 Results - follow up.......................................................................................... 82
5 ANALYSIS - Mapping of the 8 principal volume products................................... 83 5.1 Mapping - Value Stream Maps & Material flow diagrams ............................ 83 5.2 Analysis – Problems, solution proposals & LPS group meeting.................... 84
5.2.1 Savings estimations................................................................................. 86 5.3 Ranking of the workshop suggestion list ........................................................ 87
5.3.1 Subjective ranking by LPS group & savings estimation ........................ 87 5.3.2 Final selection/approval of LPS topics year 2008 - Steering committee 90
5.4 Analysis of supermarket, safety stock and batch sizes ................................... 90 5.4.1 Decide frequency .................................................................................... 91 5.4.2 Batch size ................................................................................................ 91 5.4.3 Safety stock............................................................................................. 93
6 IMPLEMENTATION - LPS workshop SMED & 5S ............................................ 94 6.1 Choice of topic................................................................................................ 94
6.1.1 First preliminary observation – Delta line machine 935......................... 94 6.1.2 Second preliminary observation – Delta line assembly machine 936 .... 96 6.1.3 Final topic – SMED and 5S on Pre-assembly machine 935 ................... 97
6.2 Planning and preparations............................................................................... 97 6.3 The workshops - SMED and 5S ..................................................................... 98
6.3.1 Schedule.................................................................................................. 98 6.3.2 Workshop teams ..................................................................................... 98 6.3.3 Method .................................................................................................... 99
6.4 The SMED workshop ................................................................................... 100 6.4.1 Phase 1 & 2 - Education and objectives ............................................... 100 6.4.2 Phase 3 - Changeover observation and analysis ................................... 102 6.4.3 Phase 4 & 5 - Problems, tasks and solutions ........................................ 104 6.4.4 Phase 6 - Result evaluation................................................................... 107 6.4.5 Phase 7 - Standardization...................................................................... 109 6.4.6 Phase 8 - Communicate results ............................................................. 110
Final degree project, Sarah Ayumi Johnsson
Lean production: Value stream analysis & application of SMED on pre-assembly machine
VIII
6.5 The 5S workshop .......................................................................................... 110 6.5.1 Education and objectives ...................................................................... 110 6.5.2 Sift and Set in order .............................................................................. 111 6.5.3 Shine and Standardize........................................................................... 111 6.5.4 Sustain................................................................................................... 112 6.5.5 Communicate results............................................................................. 112
6.6 Lessons learned during the SMED & 5S workshops.................................... 113 6.7 Results and follow up ................................................................................... 113 6.8 Workshop benefits ........................................................................................ 114
6.8.1 Economic benefits................................................................................. 114 6.8.2 Expenses ............................................................................................... 116 6.8.3 Comparison........................................................................................... 116
7 CONCLUSIONS AND RECOMMENDATIONS ............................................... 118 7.1 Conclusions of the final degree projects....................................................... 118 7.2 Conclusions and recommendations of the Analysis ..................................... 119 7.3 Results and recommendations of the Workshop........................................... 120 7.4 Integrating LPS ............................................................................................. 123
8 REFERENCES ..................................................................................................... 124 APPENDIX I: Schedule final degree project................................................................ 127 APPENDIX II: Value stream maps .............................................................................. 128 APPENDIX III: Material flow diagrams ...................................................................... 140 APPENDIX IV: Analysis ............................................................................................. 150 APPENDIX V: SMED and 5S workshop documents .................................................. 151
Schedule LPS............................................................................................................ 151 Workshop definition sheet SMED............................................................................ 152 Workshop definition sheet 5S................................................................................... 153 Workshop planning checklist.................................................................................... 154 Spaghetti diagram 1st observation ............................................................................ 155 Spaghetti diagram 2nd observation........................................................................... 156 LPS workshop report ................................................................................................ 157 Changeover times registered in SCADA, machine 935............................................ 158
APPENDIX VI: Web reference printouts..................................................................... 159 Validity ..................................................................................................................... 159 Reliability.................................................................................................................. 159 Batch ......................................................................................................................... 159 SCADA..................................................................................................................... 159 SAP ........................................................................................................................... 160 Lean Manufacturing.................................................................................................. 160 SMED ....................................................................................................................... 160 ZF web ...................................................................................................................... 161 Arkansas State University webpage.......................................................................... 161
Final degree project, Sarah Ayumi Johnsson
Lean production: Value stream analysis & application of SMED on pre-assembly machine
IX
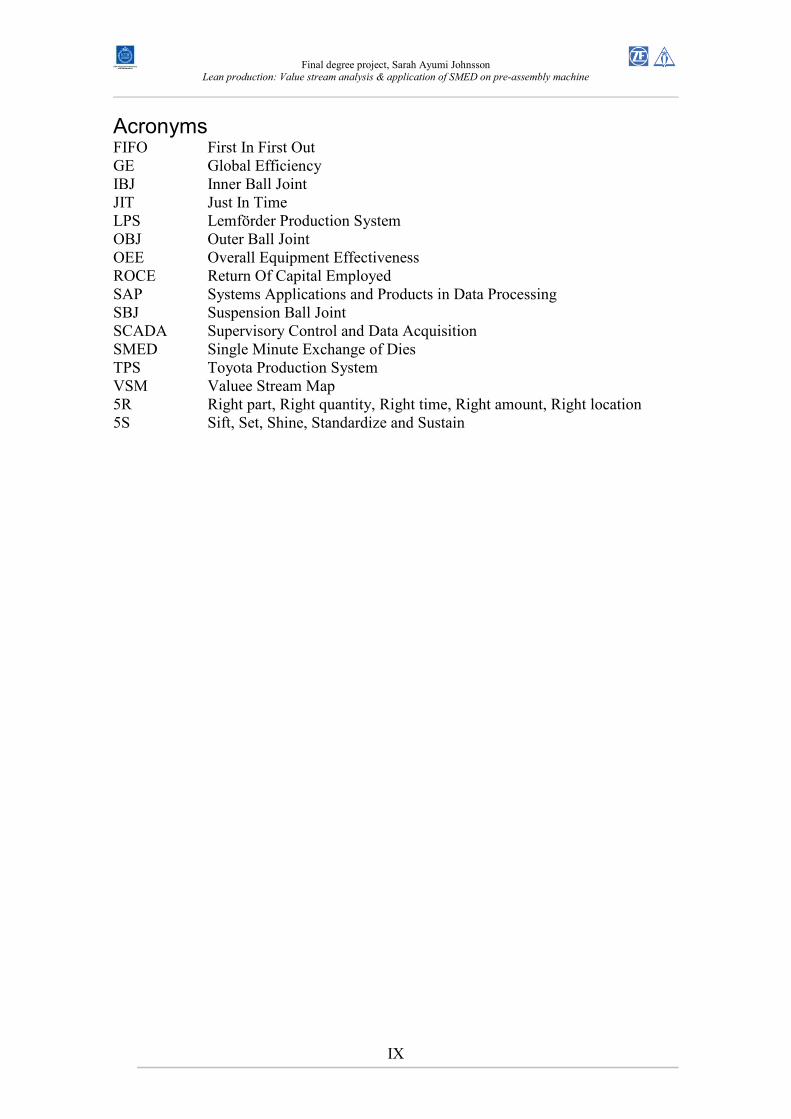
Acronyms FIFO First In First Out GE Global Efficiency IBJ Inner Ball Joint JIT Just In Time LPS Lemförder Production System OBJ Outer Ball Joint OEE Overall Equipment Effectiveness ROCE Return Of Capital Employed SAP Systems Applications and Products in Data Processing SBJ Suspension Ball Joint SCADA Supervisory Control and Data Acquisition SMED Single Minute Exchange of Dies TPS Toyota Production System VSM Valuee Stream Map 5R Right part, Right quantity, Right time, Right amount, Right location 5S Sift, Set, Shine, Standardize and Sustain
Final degree project, Sarah Ayumi Johnsson
Lean production: Value stream analysis & application of SMED on pre-assembly machine
1
1 INTRODUCTION
1.1 The final degree project
This final degree project considered the mapping and analysis of the eight products with the highest sales volume at ZF Ansa Lemförder. Each production line for those eight products was analyzed with the intention to find the main problems of the production processes. The possible methods and tools to solve those problems were listed, the problems were ranked, and thereafter one problem area to focus on, SMED, was chosen. Thereafter improvements were implemented through a workshop planned and coordinated by the student. In the beginning of the project, a mandatory pre-study was created with the intention to define the project and to be able to compare the initial tasks and goals with the end result. Additionally, at this point a schedule of the project activities was created. The pre-study contained most of the titles in this chapter, i.e.; background, target group, tasks, expected results and usage, goal, scope, methods and material, and data collection. But this introduction also contains other aspects of the project, such as reflections of reliability and validity.
1.1.1 Background
The company, ZF Ansa Lemförder, is implementing a production system called the Lemförder Production System (LPS) which is a system based on lean production. The implementation started in 2006 and their intention is to continuously apply the system in order to increase productivity and reduce costs. According to the company one of the main problems in their production process is the internal logistics system for heavy components. The stocks of the heavy components are high and the lead times are long. The LPS methods utilized at the company are hoped to solve those problems. (Guerrero, 2007)
1.1.2 Target group
The target group of any LPS activity is the customer. The customer can be either external or internal, and in this project the immediate customer was the internal customer, meaning that the operators and processes in the downstream production were the ones to benefit from the LPS improvements. The external customer is the target group for all LPS activities, since all LPS activities strive to; raise the quality at the lowest cost with the minimum amount of time. Since the degree project included an analysis for detecting problems and thereafter solved one of the encountered problems, it was impossible to define in advance what the consequences of this project would be for the target group.
1.1.3 Tasks
In the beginning of the project problems were defined together with some questions meant to help finding solutions to the problems. The actual tasks were not clearly defined in the chapter of the same name in the pre-study that, but they were defined in the schedule of the degree project, see appendix I.
Final degree project, Sarah Ayumi Johnsson
Lean production: Value stream analysis & application of SMED on pre-assembly machine
2
Problem: At the time of the final degree project, the stocks of heavy components next to the production lines were big, and the lead times for the products were long. The company engineers thought this was due to the internal delivery system of the components. The production department at ZF Ansa Lemförder was not certain of the magnitude of the above mentioned problem and wanted some measurable values showing the sizes of the stocks. They also wanted to get an overview of other problems affecting the production. Once the problems would be listed, they wanted to know which LPS tools could be used to solve them. Questions to be answered: • What does the current system look like for the 8 most sold products? • What are the main problems? • Is the internal delivery system the main problem?
� If answer is no: • Which LPS tools can be used to solve the problem? • Which LPS tools should be used in the workshop executed by the
student? � If answer is yes:
• What is the main problem? • Which LPS tools can be used to solve the problem? • Which LPS tools should be used in the workshop executed by the
student? • What will be the targets and objectives of the workshop? • How much would it cost to make the changes? • How much money can be saved if changes are made? • How can the changes be standardized in order to maintain the result? Desired conclusion: The desired conclusion of this final degree project was that one of the currently biggest production problems would be found and successfully eliminated by using the LPS philosophy and tools.
1.1.4 Expected results and usage
Expected result of the final degree project: • If internal deliveries of heavy components is the biggest problem
� Reduced stock and lead time, leading to released capital • If another problem is bigger, the expected result will be stated in the implementation
phase of the final degree project, see schedule in Appendix I. Use of the final results: • Ideas for future LPS activities • Knowledge and know-how for future LPS activities
1.1.5 Goal
The goal of the degree project was to find the main problems of the production of the 8 highest volume products, select the LPS tools which could solve those problems and
Final degree project, Sarah Ayumi Johnsson
Lean production: Value stream analysis & application of SMED on pre-assembly machine
3
thereafter successfully implement the most relevant solutions through an LPS workshop.
1.1.6 Scope
• The project only considered the following eight products in the column to the left below, which represent 61% of the total planned sales of the company. Furthermore, value stream analysis maps and flow diagrams were only created for the components in the right column below. � PQ35 SBJ Ball pin and housing � PQ24/PQ25 SBJ Ball pin � PUNTO SBJ Housing � A7 OBJ Housing � PQ35 IBJ Ball pin � C307 OBJ Ball pin and housing � B58 OBJ Ball pin � B58 IBJ Ball pin
• The student had to participate in one LPS workshop regarding Single Minute Change of Dies (SMED) in order to learn the company procedure of organizing a workshop
• The LPS group of ZF Ansa Lemförder, which consists of representatives from all departments, had to be involved in the selection of the topic/tools used in the workshop arranged by the student.
• Once the subject of the workshop had been selected, the steering committee of ZF Ansa Lemförder needed to approve the workshop.
1.2 Methods and material
1.2.1 Method
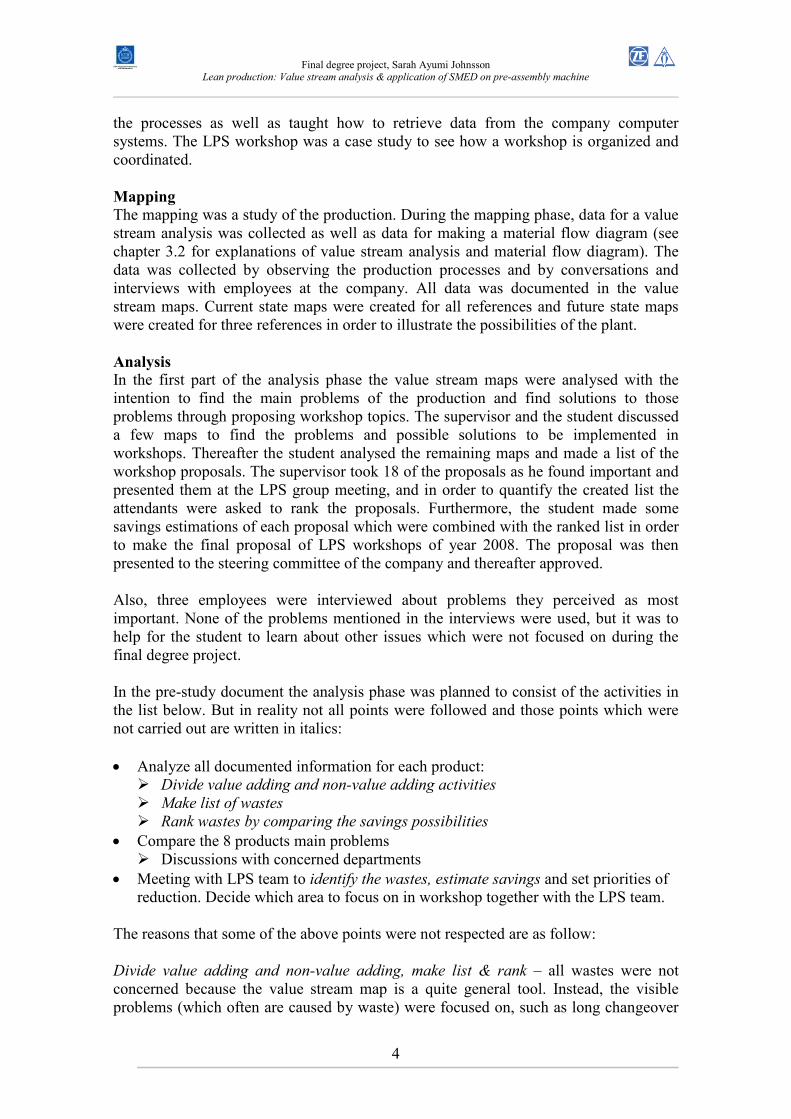
The final degree project work can be divided into 6 phases; Pre-studies, Mapping, Analysis, Solution, LPS workshop, Follow up and finishing the report. See Figure 1:
Figure 1: The phases of the final degree project
Each phase was planned to consist of the following major points which are the same as in the schedule in Appendix I. Most points were followed and those that were not followed are commented below: Pre-studies
Apart from writing the pre-study document, the pre-study phase consisted of three major parts; a literature study, learning about the company and participation in a LPS workshop. Literature about lean production was studied to understand it in general and further on deeper studies was made for the relevant sub areas. To learn more about the production a production engineer (Melgar, 2007) guided around the plant and explained
Pre-studies
Mapping Analysis
Final degree project phases, total 20 weeks
Solution LPS workshop
5 weeks ~2 weeks ~4 weeks ~4 weeks 2 weeks
Follow up and finish report
3 weeks
Final degree project, Sarah Ayumi Johnsson
Lean production: Value stream analysis & application of SMED on pre-assembly machine
4
the processes as well as taught how to retrieve data from the company computer systems. The LPS workshop was a case study to see how a workshop is organized and coordinated.
Mapping
The mapping was a study of the production. During the mapping phase, data for a value stream analysis was collected as well as data for making a material flow diagram (see chapter 3.2 for explanations of value stream analysis and material flow diagram). The data was collected by observing the production processes and by conversations and interviews with employees at the company. All data was documented in the value stream maps. Current state maps were created for all references and future state maps were created for three references in order to illustrate the possibilities of the plant. Analysis
In the first part of the analysis phase the value stream maps were analysed with the intention to find the main problems of the production and find solutions to those problems through proposing workshop topics. The supervisor and the student discussed a few maps to find the problems and possible solutions to be implemented in workshops. Thereafter the student analysed the remaining maps and made a list of the workshop proposals. The supervisor took 18 of the proposals as he found important and presented them at the LPS group meeting, and in order to quantify the created list the attendants were asked to rank the proposals. Furthermore, the student made some savings estimations of each proposal which were combined with the ranked list in order to make the final proposal of LPS workshops of year 2008. The proposal was then presented to the steering committee of the company and thereafter approved. Also, three employees were interviewed about problems they perceived as most important. None of the problems mentioned in the interviews were used, but it was to help for the student to learn about other issues which were not focused on during the final degree project. In the pre-study document the analysis phase was planned to consist of the activities in the list below. But in reality not all points were followed and those points which were not carried out are written in italics: • Analyze all documented information for each product:
� Divide value adding and non-value adding activities � Make list of wastes � Rank wastes by comparing the savings possibilities
• Compare the 8 products main problems � Discussions with concerned departments
• Meeting with LPS team to identify the wastes, estimate savings and set priorities of reduction. Decide which area to focus on in workshop together with the LPS team.
The reasons that some of the above points were not respected are as follow: Divide value adding and non-value adding, make list & rank – all wastes were not concerned because the value stream map is a quite general tool. Instead, the visible problems (which often are caused by waste) were focused on, such as long changeover
Final degree project, Sarah Ayumi Johnsson
Lean production: Value stream analysis & application of SMED on pre-assembly machine
5
time or low efficiency. A list of those problems was created and ranked and thereafter a suggestion of the workshop theme was made. Identify the wastes, estimate savings – The identification of wastes was not done in the analysis, and the estimation of the savings of the workshop suggestions was done after the meeting with the LPS group. Solution
During the solution phase the topic to focus on, i.e. the solution to a problem, in a LPS workshop was decided after discussions with the supervisor and the production department manager. The workshop targets were set, an agenda as well as a description of tools to be used. See chapter 6 for further explanation. In the pre-study it was said that future state value stream maps were to be created in the solution phase, but they were actually created in the mapping phase but never utilized. LPS workshop
The workshop was an implementation of the information acquired in the pre-study phase, with the goal to improve a process. All the pre-workshop tasks such as agreeing with the department manager about the topic and the planning were carried out in the solution phase. Follow up and finishing the report
After finishing the workshop a short report summarizing the workshop was written by the student and handed in to the company for publishing on the ZF intranet. There was not enough time to follow up the results of the workshop since only 13 days remained of the final degree project, and such a task requires at least a few months tracking of data to be able to make a conclusion of the effects. The final degree project report was written throughout the whole project and the last week was dedicated to adjusting the text. When the report was nearly done, the final presentation was prepared.
1.2.2 Reliability and Validity
This project contained elements of data collection, analysis, decision making and project management. Therefore, based on the nature of the project, the KTH supervisor advised that the validity and reliability of the work should be taken into consideration. Validity and reliability in observations
Validity is defined as followed in the Oxford dictionary; “The quality of being well-founded on fact, or established on sound principles, and thoroughly applicable to the
case or circumstances; soundness and strength (of argument, proof, authority, etc.).” (Oxford English Dictionary online, 2008) In other words a measurement with high validity should contain a low degree of systematic mistakes. To obtain high validity the measurement must be done with the right method. For example: to measure ones weight it would be wrong to use a measuring tape, while the right method would be to use a scale.
Final degree project, Sarah Ayumi Johnsson
Lean production: Value stream analysis & application of SMED on pre-assembly machine
6
The definition of reliability is “The extent to which a measurement made repeatedly in identical circumstances will yield concordant results.” (Oxford English Dictionary online, 2008) Expressed in another way, high reliability is the ability to repeat a measurement several times and retaining nearly the same result. The data collected during this degree project had two major sources; company database and actual measurements. The data from the databases such as SAP and SCADA are supposed to be valid and reliable when it comes to SAP, but when it comes to SCADA the reliability can be questioned, see further explanation in chapter 1.2.4. The measurements performed by the student were time measurements and distance measurements. The time measurements were of machine cycle times which were measured with a cronometer and all measurements were repeated at least 3 times, and 80% of all measurements the measured times were compared and confirmed with the machine specific data. Therefore the validity and reliability are supposed to be high. The distance measurements were made with a measuring tape. The measurements were rough but the final use of the measurement was only to see the decrease of distance (see chapter 3.2.2 about spaghetti diagram), so the validity is supposed to be precise enough for the purpose of the use. The organization as a mental construction
The chapter about the company organization on page 2.5.2 explains the LPS work as a function that is above the other functions of the company but the top management. But even though the LPS function is high in the hierarchy in theory there is still a risk that the decisions are taken elsewhere, since influence and power can be formal or informal. Also, informal groups of people in a company might affect decision in ways that are not obvious. In the case of this final degree project, each time a major decision such as the choice of which topic to focus for the workshop, either the supervisor or the company steering committee were involved. The fact that they were a part of the decisions is a company procedure that all decisions go through.
The researcher’s relation to the organization
As a researcher my subjective opinion about the relation to the organization is that the organization was not steering the work. Of course the company gave certain objectives and expected certain results, also the employees of the company helped and taught when necessary. But the above did not affect the collected data or the analysis of it or the manner of conducting the workshop, which were the main parts of the project. The person with the biggest influence on the work of the final degree project was the supervisor at ZF Ansa Lemförder, Julio Guerrero. He gave his ideas about the topic of the project during planning of the project, as well as gave advice for the work plan, in addition to discussing all major decisions before going any further with the work. Even though the supervisor had the chance to steer the work considerably more, he let the work be independent from him and did not interfere nor give his opinion unless he was asked to.
Final degree project, Sarah Ayumi Johnsson
Lean production: Value stream analysis & application of SMED on pre-assembly machine
7
1.2.3 Material
Since the beginning of the implementation of LPS at ZF Ansa Lemförder, much material for study purposes has been created by the Lemförder group, and a lot of that material is available on the company intranet and all employees have access to it. Much of the reference material for this report regarding LPS came from this resource, but also other literature regarding lean production has been studied. Most of the literature that has been utilized is available as e-books on the library website of the Royal Institute of Technology (http://www.lib.kth.se/main/e-boocker.asp). But also a few printed books have been studied, for example Lean Thinking by Womack, P., Spanish edition, and El sistema de produccion de Toyota by Monden, Y., but those books have not been referred to in this report. The final degree project was carried out in Spain and the topic of the project was not known until the arrival at the company, so the student was not able to prepare a literature study in Sweden before the start of the project. This is the reason to the limited amount of printed material that has been utilized.
1.2.4 Software for data collection
To obtain production data and inventory data two computer data systems were used, SCADA and SAP. The former is an acronym for Supervisory Control and Data Acquisition and is used to perform data collection at the supervisory level (Wikipedia, 2008). At ZF Ansa Lemförder all production activities registered in the system to make it possible to retain data regarding productivity, pieces produced per hour, reasons for idle time etc. from any machine, group of machines or operator in the plant. From SCADA it is also possible to retrieve a list of critical machines, i.e. a summary of the machines with the lowest productivity. There may be a problem with the registered data in SCADA which affect its validity, and it is the human factor. Two kinds of data are registered by the operators; operator activities and machine activities. Each time the operator starts to work, he registers his start of work at a computer station, and he also register the same activity for the specific machine he will be working at. In the case of activities such as reprocessing, machine breakdowns, machine changeover etc., the operator register those as well for both him and the machine. The problem is that different operators might define and thereby register their activities in dissimilar ways. For example, when registering changeover time, the moment of starting and finishing the changeover might be perceived different between two operators, so even if the changeover duration is the same for both operators, the registered time will differ. Furthermore, if there is a breakdown during the changeover, some operators register it as a breakdown, while others will not. This is mainly a problem of definition of changeover as well as a problem of information. Being aware of this, one needs to be cautious when using the data from SCADA and if there is any doubts compare the data with other data, and go speak with the operators to confirm the registered data. The second data system, SAP, is an abbreviation for Systemanalyse und
Programmentwicklung (Systems Applications and Products in Data Processing). SAP focus on Enterprise Resource Planning and it consist of several modules (Wikipedia,
Final degree project, Sarah Ayumi Johnsson
Lean production: Value stream analysis & application of SMED on pre-assembly machine
8
2008). In this project it was used for obtaining information about inventory levels. The data from the SAP system is supposed to be valid and reliable because all products and components arriving or leaving the company are scanned and registered.
1.3 Data collection and interviews
1.3.1 Data collection
Necessary data from production lines was collected, as well as data from the logistics department and production department. The data from the departments was either obtained in the company SAP system or in SCADA, for example specific data’s of the production, such as productivity, number of workers, exact work time etc., But also facts about processes and procedures were obtained from the logistics and production departments. The main way of obtaining data about the production lines was by visiting the line and seeing the actual process, counting inventory or stock, measuring time or interviewing the employees.
1.3.2 Interviews
Some interviews were planned to be carried out in the beginning of the project, which are as follows • Interview with Mr. Guerrero, J., Engineer and responsible of LPS at ZF Ansa
Lemförder, Burgos, Spain. � About the current state of production, the problems, the earlier improvement
projects and their effect, etc. • Interviews with personnel of the logistics, production and quality departments to
learn more about the process flow and possible problems • Interviews with operators at the concerned production lines The interviews with the operators were spontaneous and by the machine at the moment needed.
Final degree project, Sarah Ayumi Johnsson
Lean production: Value stream analysis & application of SMED on pre-assembly machine
9
2 DESCRIPTION OF THE COMPANY – ZF Ansa Lemförder
2.1 Facts and history
The ZF group is a leading worldwide automotive supplier for driveline and chassis technology. They have nearly 58 000 employees at 120 production companies in 25 countries. ZF is among the top fifteen companies on the ranking list of the largest automotive suppliers worldwide. (ZF webpage, 2008)
Figure 2: ZF Lemförder logotype
ZF Lemförder is the car chassis division of the ZF group. The logotype of the company is shown in Figure 2 above. ZF Ansa Lemförder is a member of ZF Lemförder and produces inner- outer- and suspension- ball joints which are supplied to several producers and suppliers in the automotive industry. ZF Ansa Lemförder is located in Burgos, Spain, see Figure 3. It was first established under the name Ansa in 1968. The ZF Lemförder group acquired 100% share of the company in 1998.
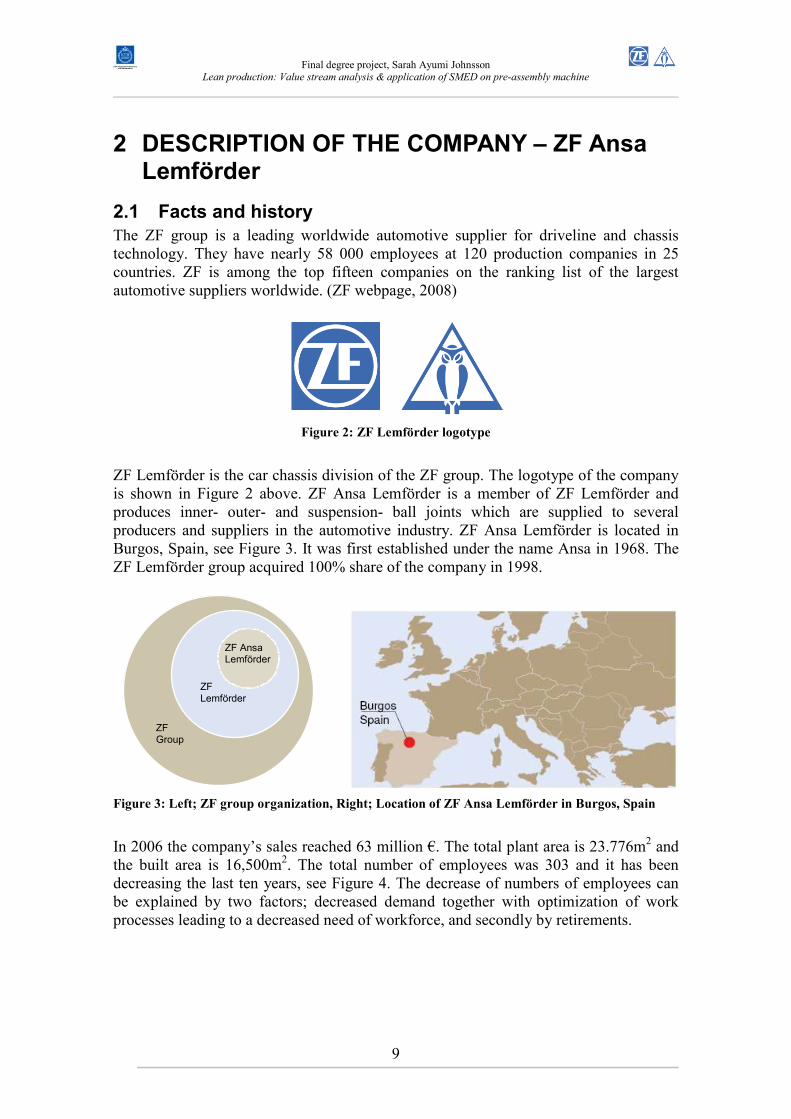
Figure 3: Left; ZF group organization, Right; Location of ZF Ansa Lemförder in Burgos, Spain
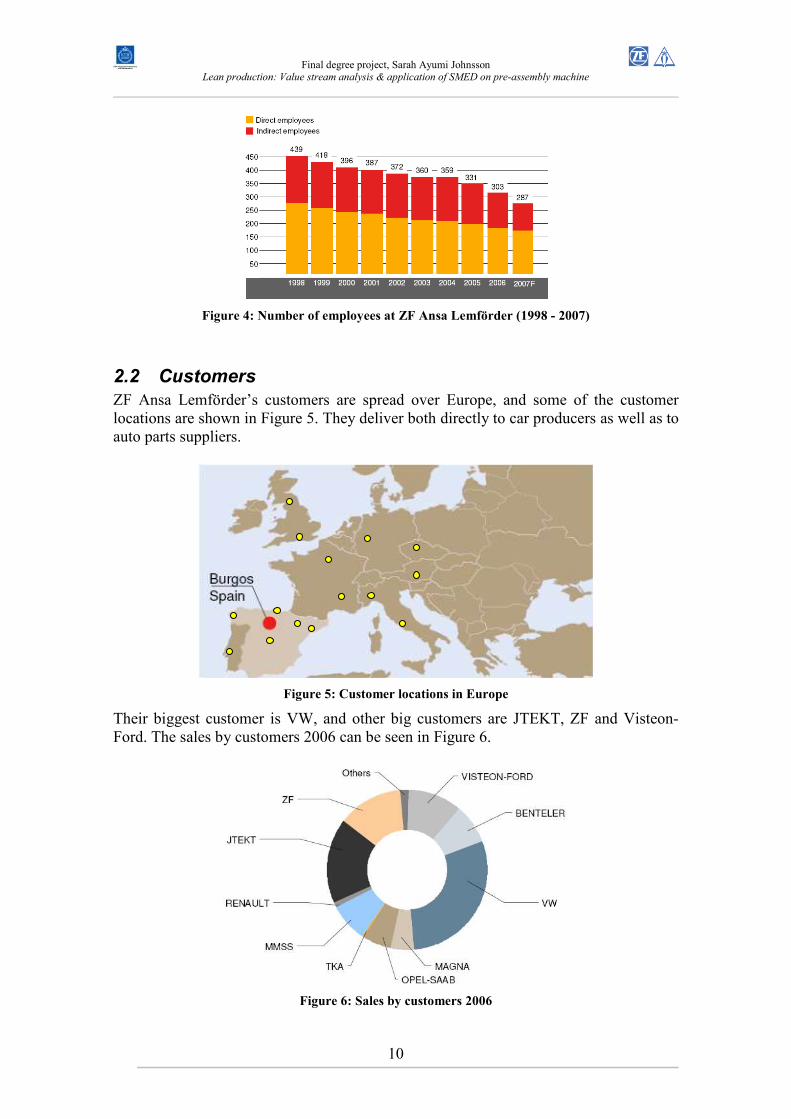
In 2006 the company’s sales reached 63 million €. The total plant area is 23.776m2 and the built area is 16,500m2. The total number of employees was 303 and it has been decreasing the last ten years, see Figure 4. The decrease of numbers of employees can be explained by two factors; decreased demand together with optimization of work processes leading to a decreased need of workforce, and secondly by retirements.
ZF Lemförder
ZF Group
ZF Ansa Lemförder
Final degree project, Sarah Ayumi Johnsson
Lean production: Value stream analysis & application of SMED on pre-assembly machine
10
Figure 4: Number of employees at ZF Ansa Lemförder (1998 - 2007)
2.2 Customers
ZF Ansa Lemförder’s customers are spread over Europe, and some of the customer locations are shown in Figure 5. They deliver both directly to car producers as well as to auto parts suppliers.
Figure 5: Customer locations in Europe
Their biggest customer is VW, and other big customers are JTEKT, ZF and Visteon-Ford. The sales by customers 2006 can be seen in Figure 6.
Figure 6: Sales by customers 2006
Final degree project, Sarah Ayumi Johnsson
Lean production: Value stream analysis & application of SMED on pre-assembly machine
11
2.3 Products and sales
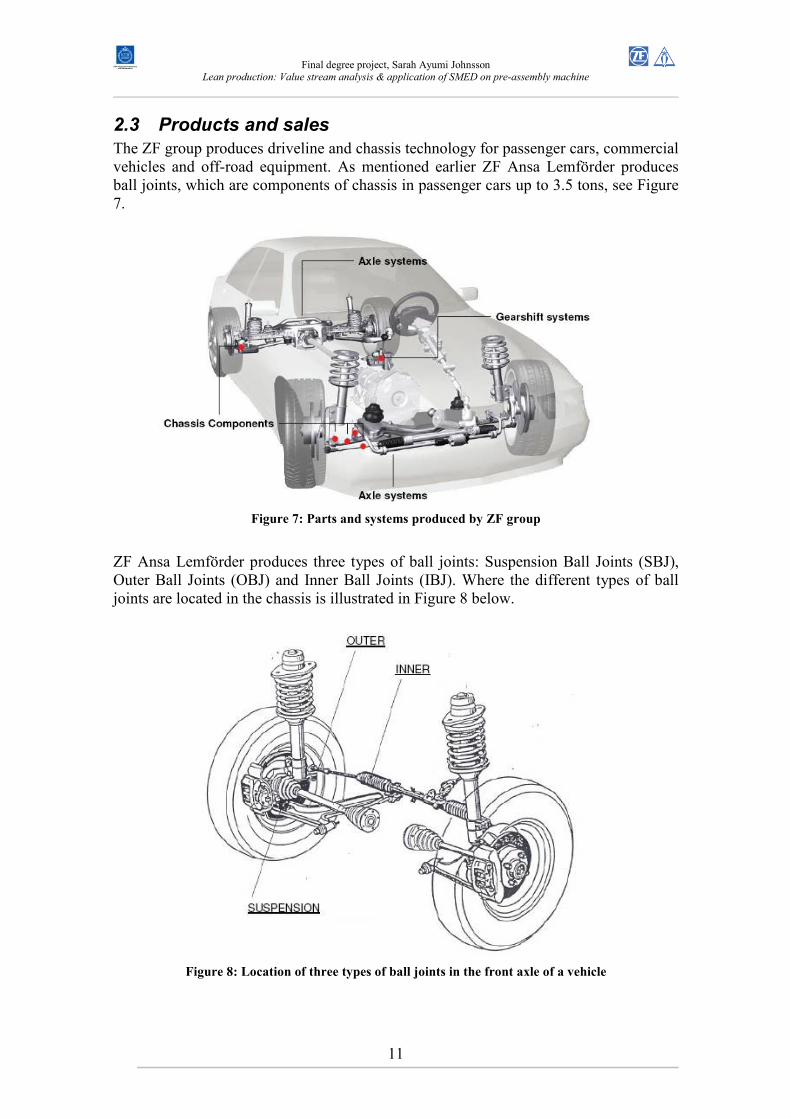
The ZF group produces driveline and chassis technology for passenger cars, commercial vehicles and off-road equipment. As mentioned earlier ZF Ansa Lemförder produces ball joints, which are components of chassis in passenger cars up to 3.5 tons, see Figure 7.
Figure 7: Parts and systems produced by ZF group
ZF Ansa Lemförder produces three types of ball joints: Suspension Ball Joints (SBJ), Outer Ball Joints (OBJ) and Inner Ball Joints (IBJ). Where the different types of ball joints are located in the chassis is illustrated in Figure 8 below.
Figure 8: Location of three types of ball joints in the front axle of a vehicle
Final degree project, Sarah Ayumi Johnsson
Lean production: Value stream analysis & application of SMED on pre-assembly machine
12
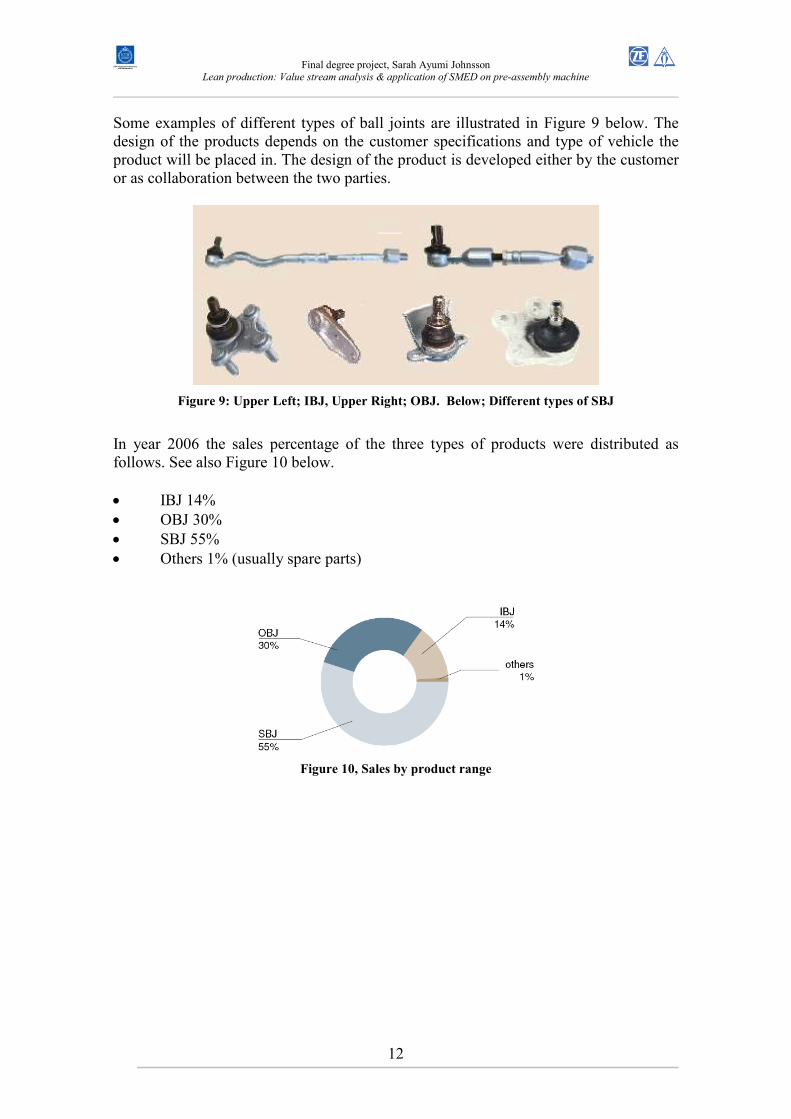
Some examples of different types of ball joints are illustrated in Figure 9 below. The design of the products depends on the customer specifications and type of vehicle the product will be placed in. The design of the product is developed either by the customer or as collaboration between the two parties.
Figure 9: Upper Left; IBJ, Upper Right; OBJ. Below; Different types of SBJ
In year 2006 the sales percentage of the three types of products were distributed as follows. See also Figure 10 below. • IBJ 14% • OBJ 30% • SBJ 55% • Others 1% (usually spare parts)
Figure 10, Sales by product range
Final degree project, Sarah Ayumi Johnsson
Lean production: Value stream analysis & application of SMED on pre-assembly machine
13
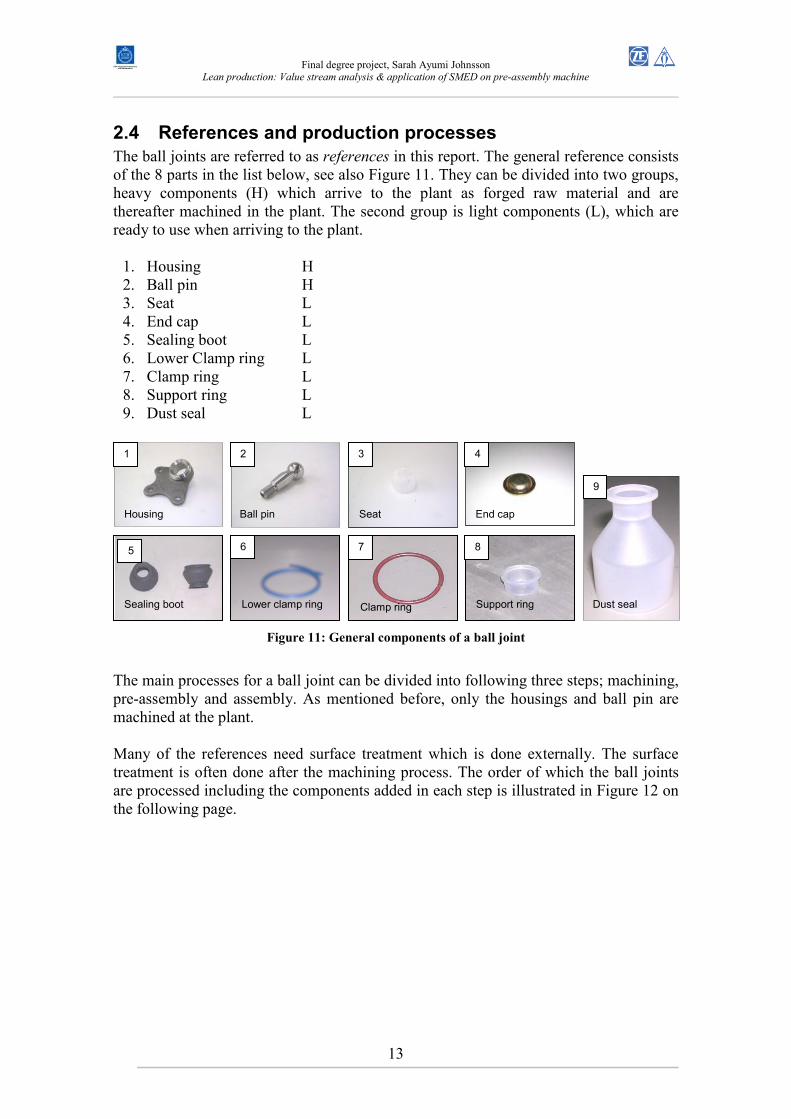
2.4 References and production processes
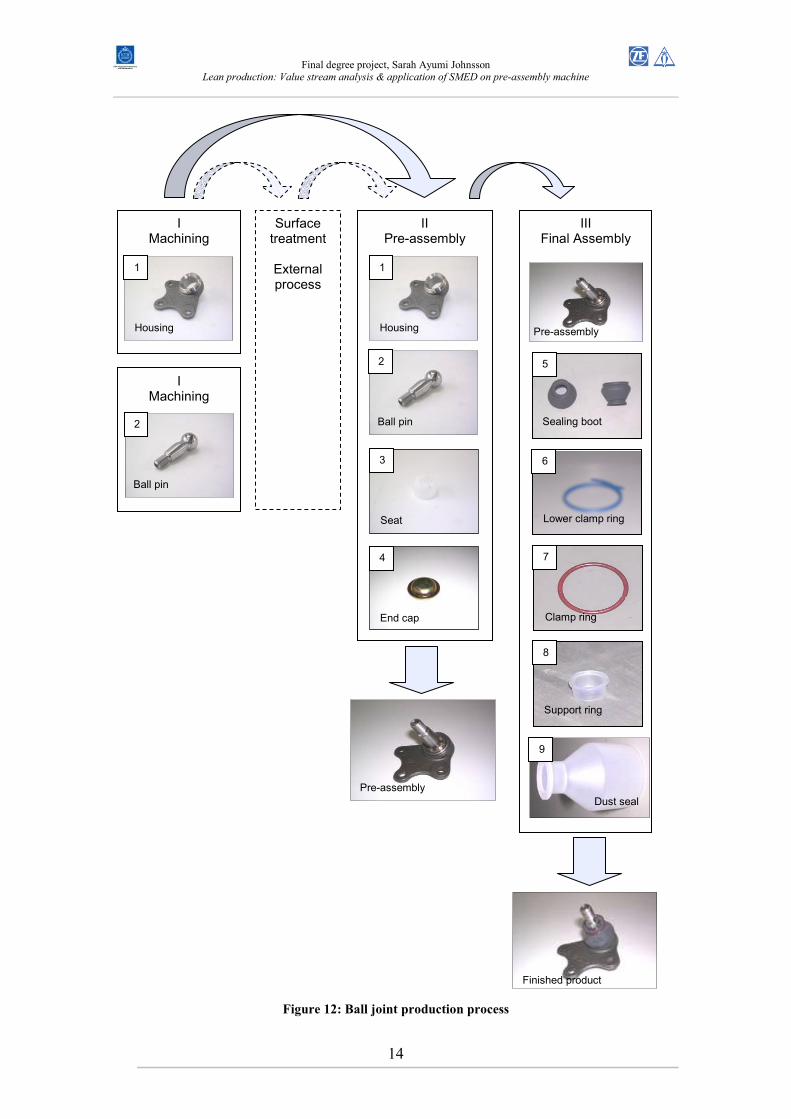
The ball joints are referred to as references in this report. The general reference consists of the 8 parts in the list below, see also Figure 11. They can be divided into two groups, heavy components (H) which arrive to the plant as forged raw material and are thereafter machined in the plant. The second group is light components (L), which are ready to use when arriving to the plant.
1. Housing H 2. Ball pin H 3. Seat L 4. End cap L 5. Sealing boot L 6. Lower Clamp ring L 7. Clamp ring L 8. Support ring L 9. Dust seal L
Figure 11: General components of a ball joint
The main processes for a ball joint can be divided into following three steps; machining, pre-assembly and assembly. As mentioned before, only the housings and ball pin are machined at the plant. Many of the references need surface treatment which is done externally. The surface treatment is often done after the machining process. The order of which the ball joints are processed including the components added in each step is illustrated in Figure 12 on the following page.
1 2 3 4
5 6 7 8
9
Housing Ball pin Seat End cap
Sealing boot Lower clamp ring Clamp ring Support ring Dust seal
Final degree project, Sarah Ayumi Johnsson
Lean production: Value stream analysis & application of SMED on pre-assembly machine
14
Figure 12: Ball joint production process
II Pre-assembly
I Machining
III Final Assembly
I Machining
Surface treatment
External process
1
Housing
2
Ball pin
1
Housing
2
Ball pin
3
Seat
4
End cap
5
Sealing boot
Pre-assembly
Pre-assembly
6
Lower clamp ring
7
Clamp ring
8
Support ring
9
Dust seal
Finished product
Final degree project, Sarah Ayumi Johnsson
Lean production: Value stream analysis & application of SMED on pre-assembly machine
15
2.5 Organization
2.5.1 The ZF group
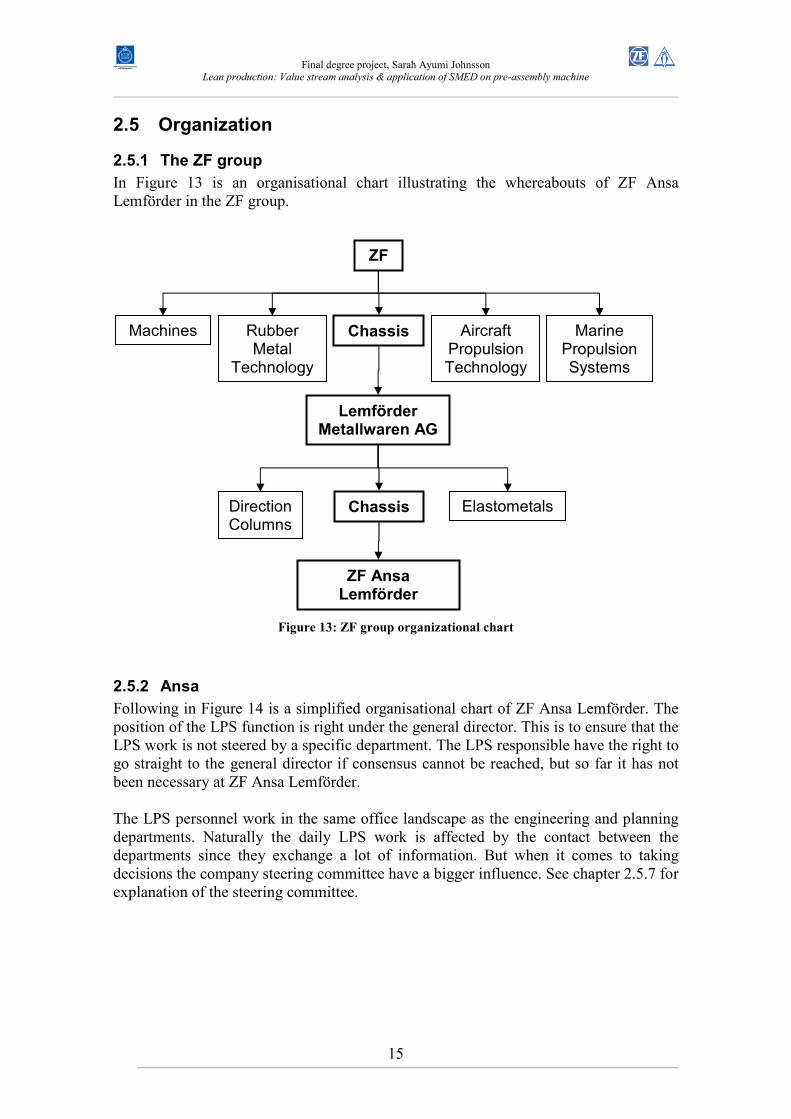
In Figure 13 is an organisational chart illustrating the whereabouts of ZF Ansa Lemförder in the ZF group.
Figure 13: ZF group organizational chart
2.5.2 Ansa
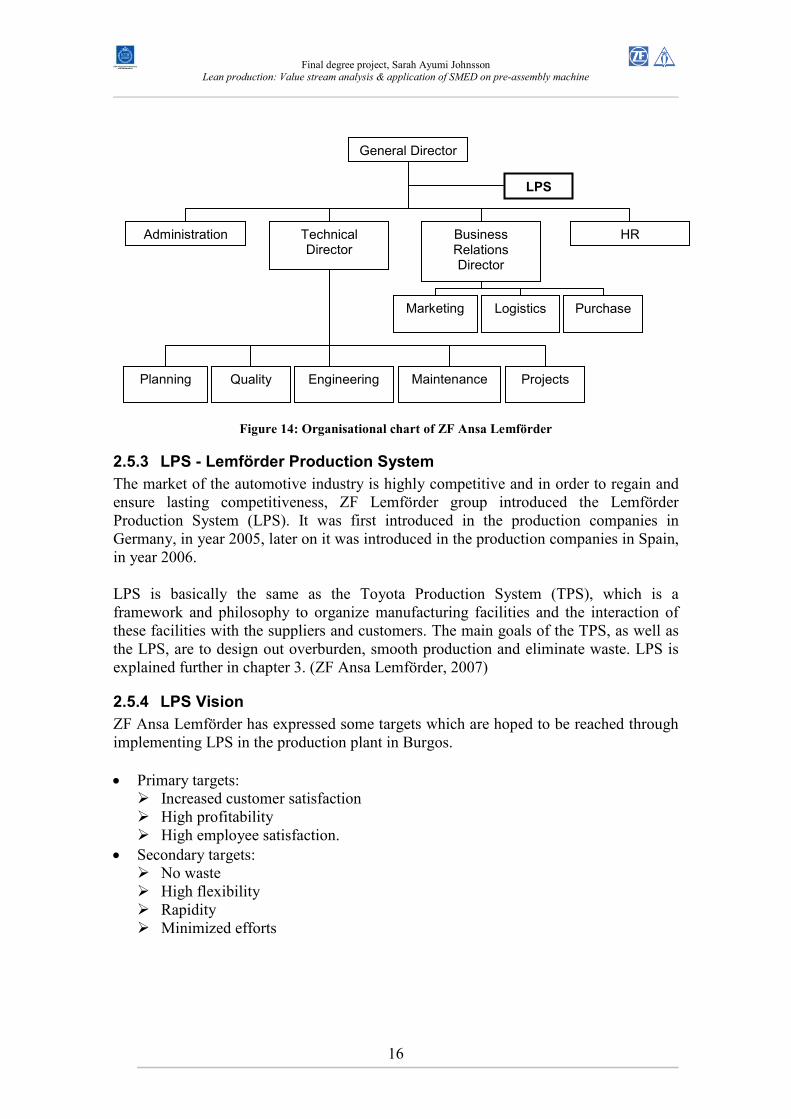
Following in Figure 14 is a simplified organisational chart of ZF Ansa Lemförder. The position of the LPS function is right under the general director. This is to ensure that the LPS work is not steered by a specific department. The LPS responsible have the right to go straight to the general director if consensus cannot be reached, but so far it has not been necessary at ZF Ansa Lemförder. The LPS personnel work in the same office landscape as the engineering and planning departments. Naturally the daily LPS work is affected by the contact between the departments since they exchange a lot of information. But when it comes to taking decisions the company steering committee have a bigger influence. See chapter 2.5.7 for explanation of the steering committee.
ZF
Aircraft Propulsion Technology
Marine Propulsion Systems
Machines Rubber Metal
Technology
Chassis
Lemförder Metallwaren AG
Direction Columns
Chassis Elastometals
ZF Ansa Lemförder
Final degree project, Sarah Ayumi Johnsson
Lean production: Value stream analysis & application of SMED on pre-assembly machine
16
Figure 14: Organisational chart of ZF Ansa Lemförder
2.5.3 LPS - Lemförder Production System
The market of the automotive industry is highly competitive and in order to regain and ensure lasting competitiveness, ZF Lemförder group introduced the Lemförder Production System (LPS). It was first introduced in the production companies in Germany, in year 2005, later on it was introduced in the production companies in Spain, in year 2006. LPS is basically the same as the Toyota Production System (TPS), which is a framework and philosophy to organize manufacturing facilities and the interaction of these facilities with the suppliers and customers. The main goals of the TPS, as well as the LPS, are to design out overburden, smooth production and eliminate waste. LPS is explained further in chapter 3. (ZF Ansa Lemförder, 2007)
2.5.4 LPS Vision
ZF Ansa Lemförder has expressed some targets which are hoped to be reached through implementing LPS in the production plant in Burgos. • Primary targets:
� Increased customer satisfaction � High profitability � High employee satisfaction.
• Secondary targets: � No waste � High flexibility � Rapidity � Minimized efforts
General Director
Administration Technical Director
Business Relations Director
HR
Marketing Logistics Purchase
Planning Quality Engineering Maintenance Projects
LPS
Final degree project, Sarah Ayumi Johnsson
Lean production: Value stream analysis & application of SMED on pre-assembly machine
17
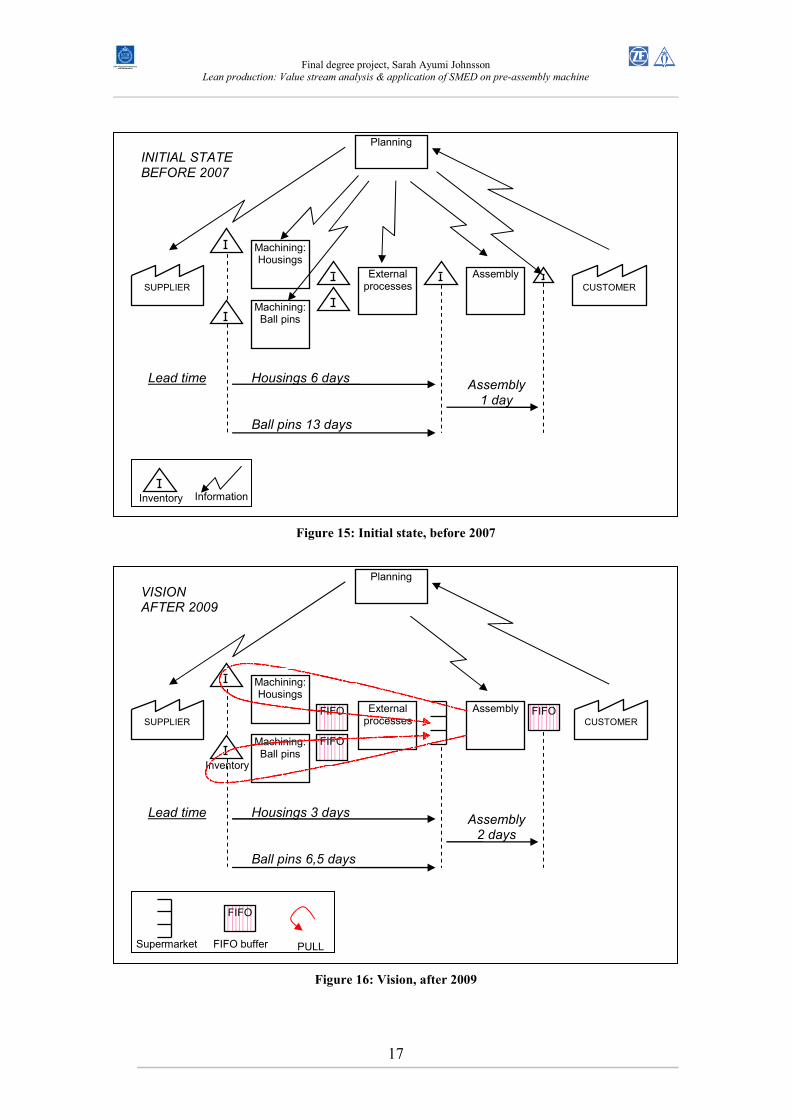
Figure 15: Initial state, before 2007
Figure 16: Vision, after 2009
SUPPLIER CUSTOMER
Machining: Housings
Machining: Ball pins
External processes
Assembly
Planning
Inventory
VISION AFTER 2009
Lead time Housings 3 days
Ball pins 6,5 days
Assembly 2 days
FIFO FIFO
FIFO
Supermarket
FIFO
FIFO buffer PULL
SUPPLIER CUSTOMER
Machining: Housings
Machining: Ball pins
External processes
Assembly
Planning
INITIAL STATE BEFORE 2007
Lead time Housings 6 days
Ball pins 13 days
Assembly 1 day
Inventory
Information
Final degree project, Sarah Ayumi Johnsson
Lean production: Value stream analysis & application of SMED on pre-assembly machine
18
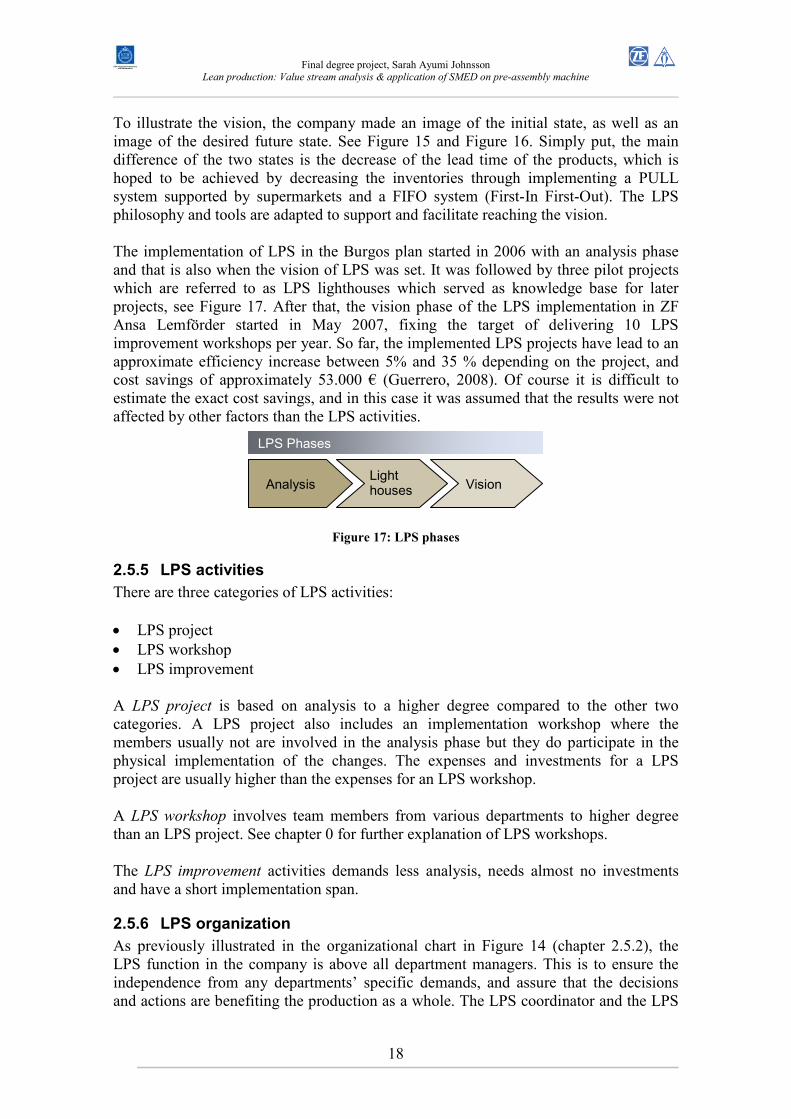
To illustrate the vision, the company made an image of the initial state, as well as an image of the desired future state. See Figure 15 and Figure 16. Simply put, the main difference of the two states is the decrease of the lead time of the products, which is hoped to be achieved by decreasing the inventories through implementing a PULL system supported by supermarkets and a FIFO system (First-In First-Out). The LPS philosophy and tools are adapted to support and facilitate reaching the vision. The implementation of LPS in the Burgos plan started in 2006 with an analysis phase and that is also when the vision of LPS was set. It was followed by three pilot projects which are referred to as LPS lighthouses which served as knowledge base for later projects, see Figure 17. After that, the vision phase of the LPS implementation in ZF Ansa Lemförder started in May 2007, fixing the target of delivering 10 LPS improvement workshops per year. So far, the implemented LPS projects have lead to an approximate efficiency increase between 5% and 35 % depending on the project, and cost savings of approximately 53.000 € (Guerrero, 2008). Of course it is difficult to estimate the exact cost savings, and in this case it was assumed that the results were not affected by other factors than the LPS activities.
Figure 17: LPS phases
2.5.5 LPS activities
There are three categories of LPS activities: • LPS project • LPS workshop • LPS improvement A LPS project is based on analysis to a higher degree compared to the other two categories. A LPS project also includes an implementation workshop where the members usually not are involved in the analysis phase but they do participate in the physical implementation of the changes. The expenses and investments for a LPS project are usually higher than the expenses for an LPS workshop. A LPS workshop involves team members from various departments to higher degree than an LPS project. See chapter 0 for further explanation of LPS workshops. The LPS improvement activities demands less analysis, needs almost no investments and have a short implementation span.
2.5.6 LPS organization
As previously illustrated in the organizational chart in Figure 14 (chapter 2.5.2), the LPS function in the company is above all department managers. This is to ensure the independence from any departments’ specific demands, and assure that the decisions and actions are benefiting the production as a whole. The LPS coordinator and the LPS
Analysis Light houses Vision
LPS Phases
Final degree project, Sarah Ayumi Johnsson
Lean production: Value stream analysis & application of SMED on pre-assembly machine
19
group has the right to go straight to the top manager if any dissonance occurs, but this has not yet been needed since the start of the LPS implementation. The LPS coordinator
At ZF Ansa Lemförder there is one person, the LPS coordinator, who works 100% with LPS. In 2007 and 2008 the LPS coordinator was Julio Guerrero. His responsibility is to plan and coordinate all LPS activities, and he also reports about the development to the Global LPS group in the Lemförder group.
The Global LPS group The global LPS group consist of the LPS coordinators from all Lemförder plants. The group meets regularly for education and exchange of ideas and experience. The LPS group (local)
The LPS group is a group of employees at ZF Ansa Lemförder who are involved in all major LPS activities. Their mission is: • Give suggestions of future LPS workshops • Consult the steering committee • Facilitate the development of LPS workshops • Work as a spokesperson of the LPS activities in respective department as well in all
of the plant They fulfil their tasks by participating in the monthly LPS meeting, where they propose and approve LPS workshops and where they are given information about the state of areas that have already been improved. They also participate in each LPS workshop presentation, where they give advice about decisions and improvements and also facilitate the work of the workshop team. The LPS group is an independent group in the company. To ensure that the group is transversal, it consists of members representing all departments and many of them have certain responsibilities and/or are specialists in their fields. Following is a list of the departments and positions of the members (January 2008). 1. Engineering Joaquín Melgar, process engineer 2. Production planning Idelfonso Gonzalez, in charge production planning 3. Quality Cesar Blanco, customer quality responsible 4. Logistics Fernando Diez, in charge external logistics operations 5. Maintenance Julio Turrientes, maintenance responsible 6. Purchase Carlos Sardon, purchase engineer 7. Human resources Yolanda Ruiz, human resources 8. Production direction Jose Ramon Izquierdo, technical director 9. Production Philippe Herremans, production responsible
2.5.7 The Steering Committee
The steering committee consists of the department managers of the company. They inform the top-manager about the status of the departments, and give advice if needed. (ZF Ansa Lemförder, 2007)
Final degree project, Sarah Ayumi Johnsson
Lean production: Value stream analysis & application of SMED on pre-assembly machine
20
3 THEORY The TPS philosophy is explained in the following chapter, followed by further explanations of the LPS theory.
3.1 Philosophy
3.1.1 LPS, TPS & Lean Manufacturing
As mentioned earlier, the Lemförder Production System (LPS) is basically the same philosophy as the Toyota Production System (TPS). The expression lean manufacturing, also called lean production, is a generic process management philosophy derived mostly from TPS but also from other sources such as six-sigma (Wikipedia, 2008). In this report the expression lean production or lean manufacturing refers to the TPS part of the philosophy and the six-sigma theories and methods are not considered.
3.1.2 TPS history
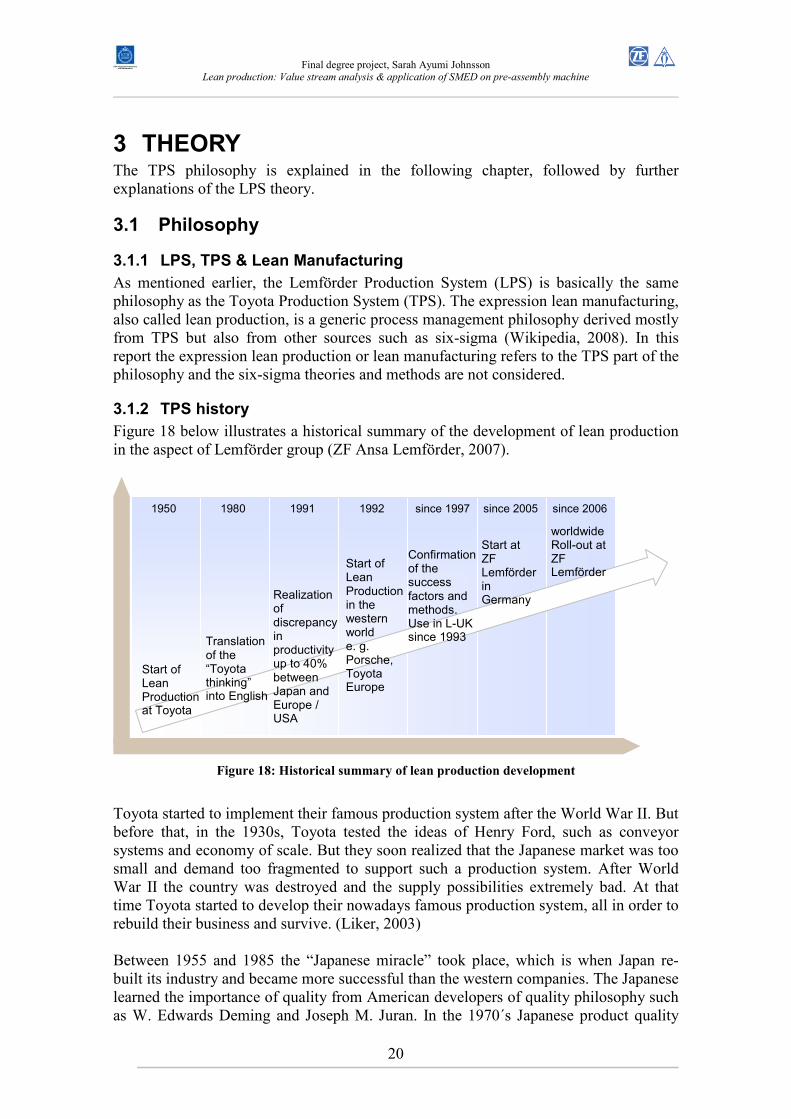
Figure 18 below illustrates a historical summary of the development of lean production in the aspect of Lemförder group (ZF Ansa Lemförder, 2007).
Figure 18: Historical summary of lean production development
Toyota started to implement their famous production system after the World War II. But before that, in the 1930s, Toyota tested the ideas of Henry Ford, such as conveyor systems and economy of scale. But they soon realized that the Japanese market was too small and demand too fragmented to support such a production system. After World War II the country was destroyed and the supply possibilities extremely bad. At that time Toyota started to develop their nowadays famous production system, all in order to rebuild their business and survive. (Liker, 2003) Between 1955 and 1985 the “Japanese miracle” took place, which is when Japan re-built its industry and became more successful than the western companies. The Japanese learned the importance of quality from American developers of quality philosophy such as W. Edwards Deming and Joseph M. Juran. In the 1970´s Japanese product quality
1950 1980 1991 1992 since 1997 since 2005 since 2006
Start of Lean Production at Toyota
worldwide Roll-out at ZF Lemförder
Translation of the “Toyota thinking” into English
Realization of discrepancy in productivity up to 40% between Japan and Europe / USA
Start of Lean Production in the western world e. g. Porsche, Toyota Europe
Confirmation of the success factors and methods. Use in L-UK since 1993
Start at ZF Lemförder in Germany
Final degree project, Sarah Ayumi Johnsson
Lean production: Value stream analysis & application of SMED on pre-assembly machine
21
was often superior to its western counterpart. But it was not until the 1980´s that the West started to learn from the Japanese success and they started to imitate some methodologies. In the 1990´s it was possible to see a difference in productivity up to 40% between Japan and the western world. (Bergman & Klefsjö, 2003) In the 1990´s Porsche started to implement lean production and after three years they had successfully implemented the philosophy and thereafter they started to teach the philosophy to other companies by creating a consulting agency. The Lemförder group hired the Porsche consultants in 2005 to help with the implementation of LPS at the German production companies, and in 2006 the LPS implementation started in the Lemförder production companies of all other countries. (ZF Ansa Lemförder, 2007) Kaizen
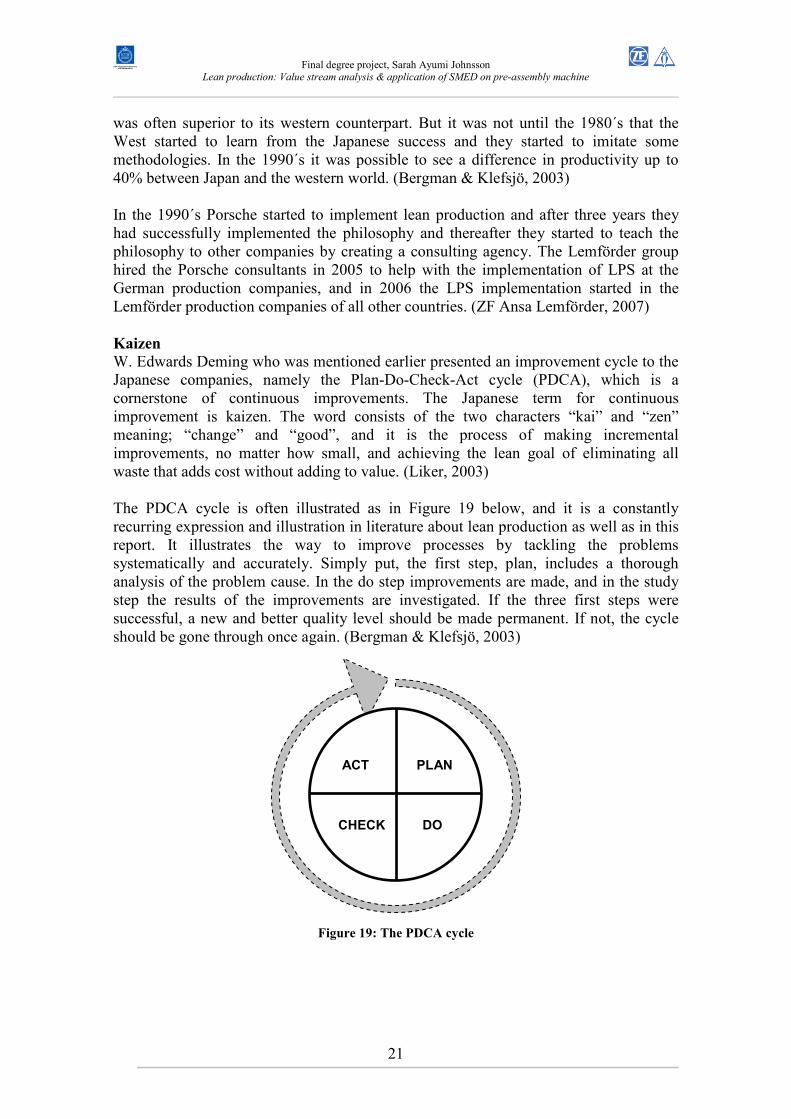
W. Edwards Deming who was mentioned earlier presented an improvement cycle to the Japanese companies, namely the Plan-Do-Check-Act cycle (PDCA), which is a cornerstone of continuous improvements. The Japanese term for continuous improvement is kaizen. The word consists of the two characters “kai” and “zen” meaning; “change” and “good”, and it is the process of making incremental improvements, no matter how small, and achieving the lean goal of eliminating all waste that adds cost without adding to value. (Liker, 2003) The PDCA cycle is often illustrated as in Figure 19 below, and it is a constantly recurring expression and illustration in literature about lean production as well as in this report. It illustrates the way to improve processes by tackling the problems systematically and accurately. Simply put, the first step, plan, includes a thorough analysis of the problem cause. In the do step improvements are made, and in the study step the results of the improvements are investigated. If the three first steps were successful, a new and better quality level should be made permanent. If not, the cycle should be gone through once again. (Bergman & Klefsjö, 2003)
Figure 19: The PDCA cycle
PLAN
DO
ACT
CHECK
Final degree project, Sarah Ayumi Johnsson
Lean production: Value stream analysis & application of SMED on pre-assembly machine
22
3.1.3 TPS – Toyota Production System
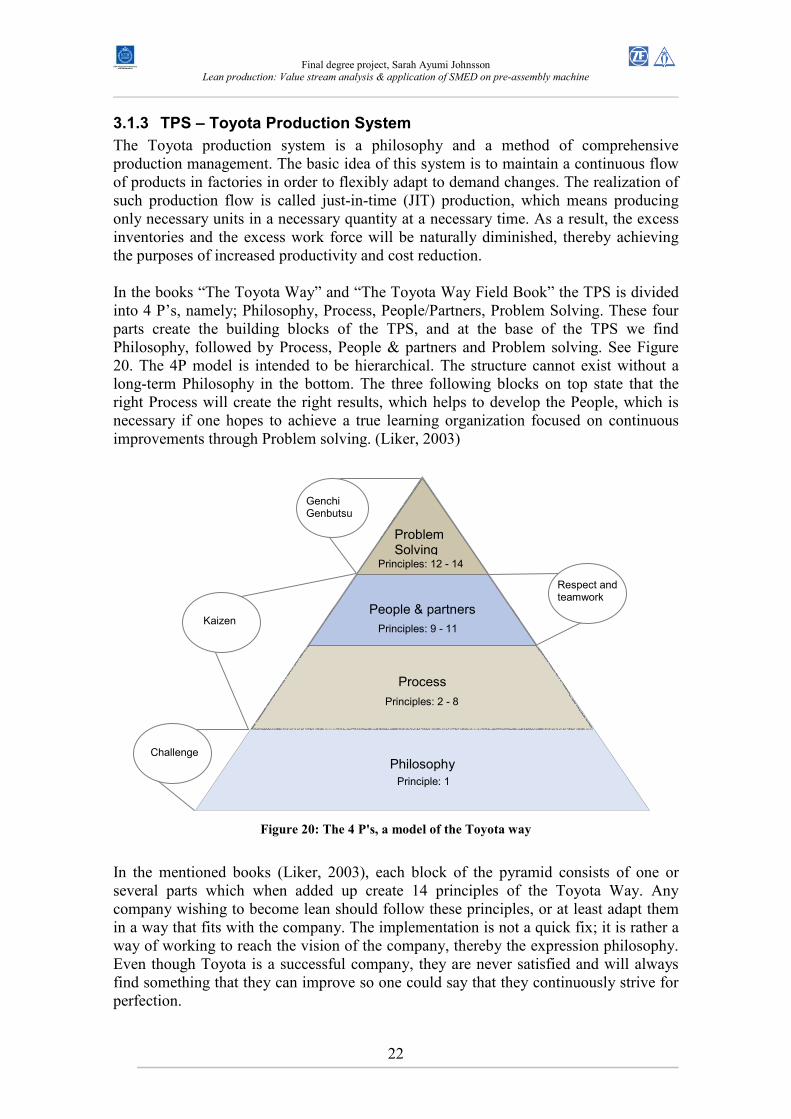
The Toyota production system is a philosophy and a method of comprehensive production management. The basic idea of this system is to maintain a continuous flow of products in factories in order to flexibly adapt to demand changes. The realization of such production flow is called just-in-time (JIT) production, which means producing only necessary units in a necessary quantity at a necessary time. As a result, the excess inventories and the excess work force will be naturally diminished, thereby achieving the purposes of increased productivity and cost reduction. In the books “The Toyota Way” and “The Toyota Way Field Book” the TPS is divided into 4 P’s, namely; Philosophy, Process, People/Partners, Problem Solving. These four parts create the building blocks of the TPS, and at the base of the TPS we find Philosophy, followed by Process, People & partners and Problem solving. See Figure 20. The 4P model is intended to be hierarchical. The structure cannot exist without a long-term Philosophy in the bottom. The three following blocks on top state that the right Process will create the right results, which helps to develop the People, which is necessary if one hopes to achieve a true learning organization focused on continuous improvements through Problem solving. (Liker, 2003)
Figure 20: The 4 P's, a model of the Toyota way
In the mentioned books (Liker, 2003), each block of the pyramid consists of one or several parts which when added up create 14 principles of the Toyota Way. Any company wishing to become lean should follow these principles, or at least adapt them in a way that fits with the company. The implementation is not a quick fix; it is rather a way of working to reach the vision of the company, thereby the expression philosophy. Even though Toyota is a successful company, they are never satisfied and will always find something that they can improve so one could say that they continuously strive for perfection.
Pople
Problem Solving
People & partners
Process
Philosophy
Principle: 1
Principles: 2 - 8
Principles: 9 - 11
Principles: 12 - 14
Kaizen
Genchi Genbutsu
Respect and teamwork
Challenge
Final degree project, Sarah Ayumi Johnsson
Lean production: Value stream analysis & application of SMED on pre-assembly machine
23
I. Long-term philosophy
Principle 1:
“Base your management decisions on a long-term philosophy, even at the expense of short term goals”
Toyota always starts with the goal of generating value for the customer, society, and the economy. This should be the starting point for every function in the company. The subtext is that the company, as well as its leaders, must take responsibility. This is the foundation for all other principles, and this is often the missing constituent in most companies trying to learn from Toyota. II. Process - The right process will produce the right result
Principle 2:
“Create continuous process flow to bring problems to the surface”
“Flow” means making parts move faster through a process by cutting down on idle time, i.e. the time that a part is waiting for someone to work on it. By linking processes and people together, the flow does not only make material and information move faster, but it also make problems surface right away, making it necessary to take action immediately as a problem appears. Flow is a key to a continuous improvement process and to developing people. Principle 3:
”Use ’pull’ systems to avoid overproduction”
Stocking inventory based on forecasted or even promised demand very often leads to chaos, firefighting, and running out of the products the customer wants. Toyota has found a better approach, modeled after the American supermarket system. They stock small amounts of parts and restock the supermarket frequently, based on what the customer takes away. At Toyota, the kanban-cards system is often employed in connection to the supermarket, but this does not mean that the kanban-cards are the underlying principle making the supermarket system work. The kanban-cards are solely a tool to make the system run smoother, and the kanban system itself is a waste which should be eliminated over time. Principle 4:
“Level out the workload (Heijunka)“
The only way to create flow is to have stability in the workload. If the demand rise and falls dramatically, the organisation will go into a reactive mode. Furthermore, waste will appear and standardization will be impossible. Toyota tries to find clever ways of levelling the workload to the degree possible, and external workforce is brought in to handle high demands. Principle 5:
“Build a culture of stopping to fix problems, to get quality right first time (Jidoka)”
When there is a problem, one should not keep going with the intention of fixing it later, instead the problem should be fixed right there and then. The production targets of the day might suffer, but the productivity in the long run will be improved.
Final degree project, Sarah Ayumi Johnsson
Lean production: Value stream analysis & application of SMED on pre-assembly machine
24
Principle 6:
“Standardized tasks are the foundation for continuous improvement and employee empowerment”
It is impossible to predict timing or output of a process if the process is not stable and repeatable. And the foundation for flow and pull is just that; a predictable and repeatable processes. By standardizing today’s best practices, one can capture the learning up to this point. Further on, when new best practices have been found, the standardization process can be repeated. Individuals can make great improvements for a process, but if the improvements are not standardized there is a risk of loosing the knowledge. The standardization helps to achieve kaizen, continuous improvements, and it makes sure that when an individual moves from his job the learning is not lost. Principle 7:
“Use visual control so no problems are hidden”
People are visual creatures. They need to be able to look at their work and easily see if anything is deviating from the standard. Also, people can have valuable discussions while looking at design charts, while going to a computer screen often turns the person’s attention from the workplace to the computer. That is why the TPS always encourage design systems to support people by visual aids, such as signs, labels, kanban-cards, etc.
Principle 8:
“Use only reliable, thoroughly tested technology that serves your people and processes”
Technology should support people doing their work, and not the other way around. Furthermore, the process should always be prioritized over technology. Toyota focuses much on stability, reliability and predictability so the company is very cautious about introducing untested technology. Of course this does not mean that new technology cannot be introduced, but it must be carefully investigated and proven in trials before a very quick and effective implementation can take place. III. People and Partners - Add value to your organization by developing your people and partners
Principle 9:
“Grow leaders who thoroughly understand the work, live the philosophy, and teach it to others”
Leaders at Toyota are not bought, they are grown, and they usually become a leader after 10 or 20 years in the company. This gives them a depth of knowledge that a bought manager cannot compete with. The Toyota managers do not only have good people skills, but they also truly understand the TPS and exemplify the philosophy in all decisions they make as well as teach the TPS to their employees. Principle 10:
“Develop exceptional people and teams who follow your company’s philosophy”
Toyota has a strong internal culture which makes the organization strong and prone to survive. The employees share values and beliefs that are well aligned, and Toyota is continually trying to reinforce the culture. The culture and understanding of TPS is a
Final degree project, Sarah Ayumi Johnsson
Lean production: Value stream analysis & application of SMED on pre-assembly machine
25
necessity of the success of the TPS, and that is what makes Toyota so successful. A simile to that is; one is not a good carpenter by having the best carpenter tools, one has to know how to handle the tools to be a skilled carpenter. Another important aspect is that a company trying to implement TPS must be aware of the importance of company culture and shared values. It is impossible to copy Toyotas culture, instead they must create their own. If they already have a strong culture, they need to remember it and integrate the TPS into their culture in order to succeed to become a lean company. Principle 11:
“Respect your extended network of partners by challenging them and helping them improve”
Toyota does not exploit their suppliers by threats of changing supplier in order to get the lowest price possible. Instead the suppliers are seen as partners and are thereby an extension of Toyota. The partners are challenged to do better all the time, and Toyota willingly helps the supplier to develop by sending over Toyota employees to help with the implementation of lean production. IV. Problem solving - Continuously solving root problems drive organizational learning
Principle 12:
“Go see for yourself to thoroughly understand the situation (genchi genbutsu)”
A problem can only be solved if you fully understand the situation, which means going to the source, observing and deeply analyzing what is going on. This is called genchi genbutsu in Japanese. At Toyota the problem should never be solved solely by theorizing, but one needs to have a deep understanding of the problem which is obtained by personal verification. Principle 13:
“Make decisions slowly by consensus, thoroughly considering all options, implement decisions rapidly”
At Toyota, decision making moves slowly and the implementation moves rapidly. The root cause of any investigated problem must be found. Thereafter the solution needs to be agreed upon by all concerned persons in the organization in order to bring out all possible solutions, and this process takes long time. Subsequently the solution can be speedily implemented. Principle 14:
“Become a learning organization through relentless reflection (hansei) and continuous improvement (kaizen)”
When processes are stable, continuous improvement can follow. This is also a part of the Deming “Plan, Do Check, Act” tool and is in the Toyota Production system referred to as kaizen. Once the process is stable you have the opportunity to continually learn and make things better. That is where hansei, or reflection, comes in. In order to make things better next time, after a project the members reflect on shortcomings and then develop counter measures so that they will not make the same mistake again.
Final degree project, Sarah Ayumi Johnsson
Lean production: Value stream analysis & application of SMED on pre-assembly machine
26
3.1.4 LPS - Lemförder Production System
Below in Figure 21 is a picture of the LPS house, which embodies all values and principles of the philosophy.
Figure 21: The LPS house
All but one of the Toyota Production System principles can be found in the LPS house, namely the first principle “Base your management decisions on a long-term philosophy, even at the expense of short term goals” chapter 3.1.2. This does not mean that ZF Ansa Lemförder has ignored this part, because the management is involved in the implementation of LPS and also, one of the main targets of LPS is increased customer satisfaction. A lot of time and resources have been invested in education and training of employees as well as in letting several employees leave their original work tasks in order to participate in LPS activities. Lemförder has summed up the LPS philosophy into ten basic rules, and these fundamentals have been handed out on printed pamphlets for employees to keep. See Table 1.
Table 1: LPS basic rules
1. ‘We did it always like this’ is not valid anymore. Be prepared to question your traditional way of thinking.
2. Think about solutions, not about problems. 3. Everybody is important. Participate actively. 4. Respect other’s opinions. 5. Every mistake is a chance. Learn from it and don’t look for the guilty one. 6. Follow the principle: Rather a 60% solution immediately than a 100% solution
never. 7. Ask ‘Why’ 5 times to find the real root cause of a problem. 8. Use the knowledge of 10 people rather than the special knowledge of one. 9. Correct mistakes immediately. 10. Don’t be satisfied with what you’ve reached. Ask always what still can be
improved.
J I T
Final degree project, Sarah Ayumi Johnsson
Lean production: Value stream analysis & application of SMED on pre-assembly machine
27
3.1.5 The roof of LPS
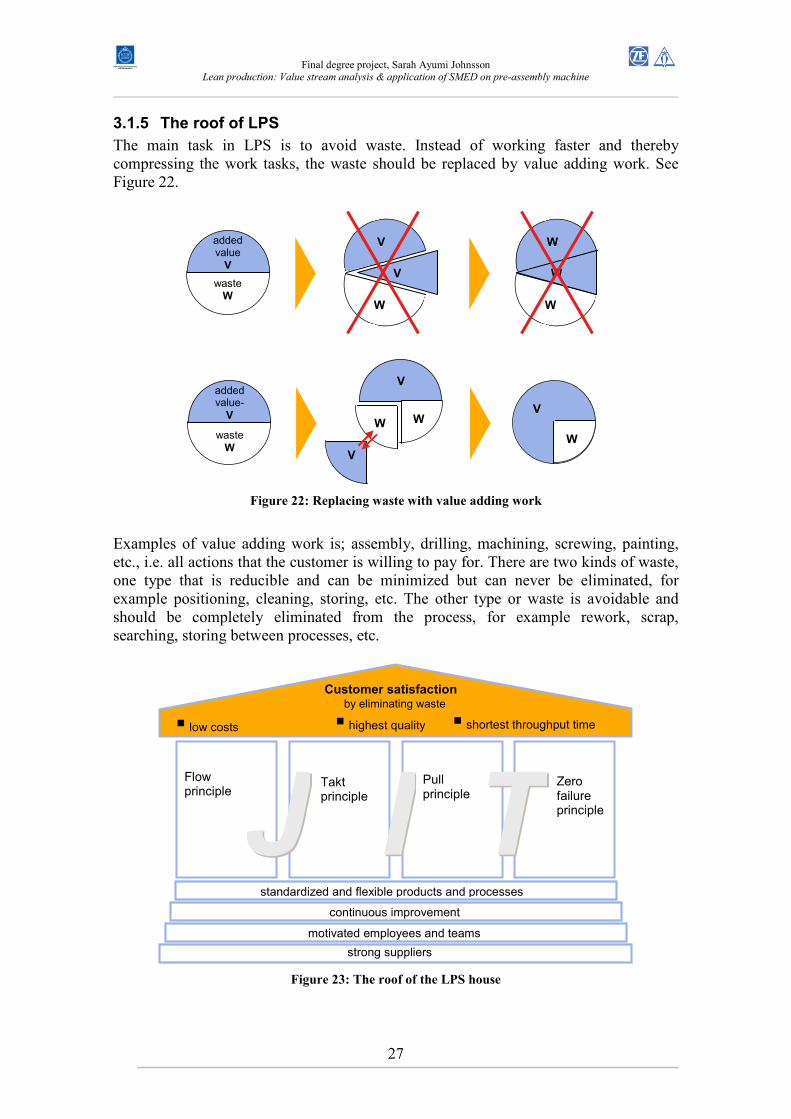
The main task in LPS is to avoid waste. Instead of working faster and thereby compressing the work tasks, the waste should be replaced by value adding work. See Figure 22.
Figure 22: Replacing waste with value adding work
Examples of value adding work is; assembly, drilling, machining, screwing, painting, etc., i.e. all actions that the customer is willing to pay for. There are two kinds of waste, one type that is reducible and can be minimized but can never be eliminated, for example positioning, cleaning, storing, etc. The other type or waste is avoidable and should be completely eliminated from the process, for example rework, scrap, searching, storing between processes, etc.
Figure 23: The roof of the LPS house
J J I I T T
motivated employees and teams
continuous improvement
standardized and flexible products and processes
strong suppliers
� highest quality � shortest throughput time
Customer satisfaction by eliminating waste
Takt principle
� low costs
Zero failure principle
Flow principle
Pull principle
added value
V
waste W
V
W
W
W
W V
added value-
V
waste
W
V
W W
V
W
V
Final degree project, Sarah Ayumi Johnsson
Lean production: Value stream analysis & application of SMED on pre-assembly machine
28
The LPS philosophy says that eliminating waste will increase customer satisfaction, since the elimination helps to reach the highest quality ate the lowest cost with the shortest throughput time, see Figure 23.
3.1.6 The 4 pillars of LPS – Flow, Takt, Pull and Zero failure
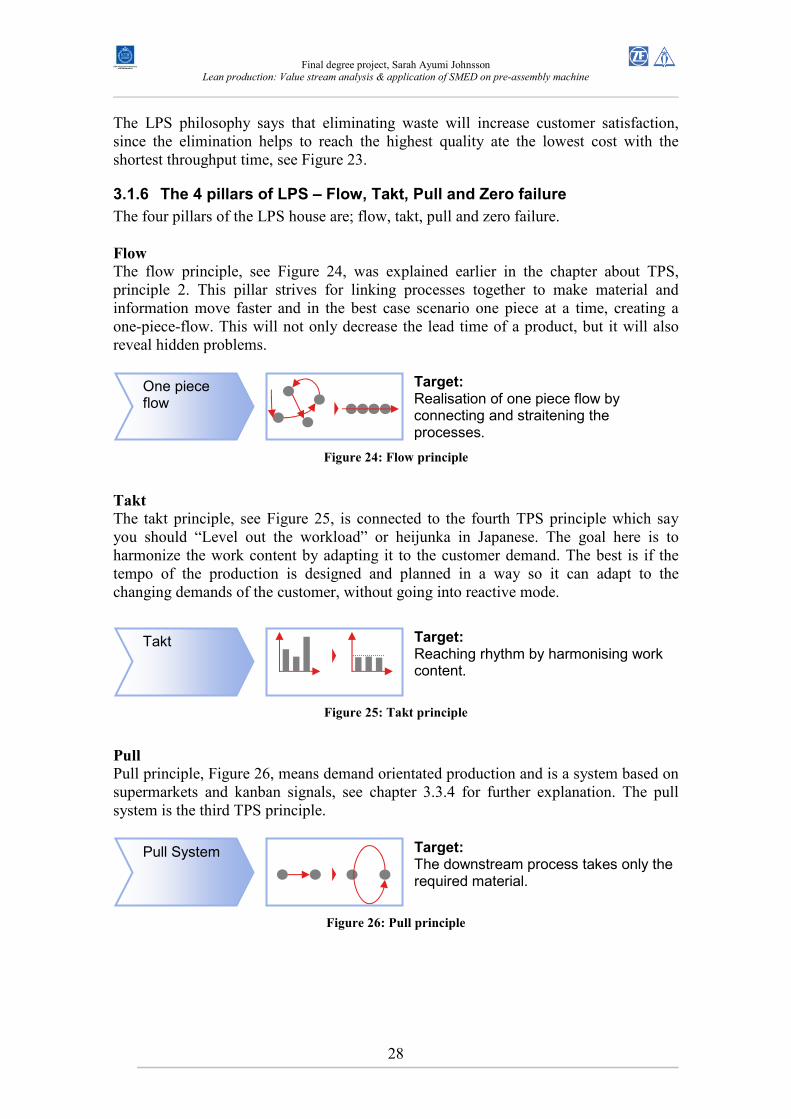
The four pillars of the LPS house are; flow, takt, pull and zero failure. Flow
The flow principle, see Figure 24, was explained earlier in the chapter about TPS, principle 2. This pillar strives for linking processes together to make material and information move faster and in the best case scenario one piece at a time, creating a one-piece-flow. This will not only decrease the lead time of a product, but it will also reveal hidden problems.
Figure 24: Flow principle
Takt
The takt principle, see Figure 25, is connected to the fourth TPS principle which say you should “Level out the workload” or heijunka in Japanese. The goal here is to harmonize the work content by adapting it to the customer demand. The best is if the tempo of the production is designed and planned in a way so it can adapt to the changing demands of the customer, without going into reactive mode.
Figure 25: Takt principle
Pull
Pull principle, Figure 26, means demand orientated production and is a system based on supermarkets and kanban signals, see chapter 3.3.4 for further explanation. The pull system is the third TPS principle.
Figure 26: Pull principle
Pull System Target: The downstream process takes only the required material.
Takt Target: Reaching rhythm by harmonising work content.
One piece flow
Target: Realisation of one piece flow by connecting and straitening the processes.
Final degree project, Sarah Ayumi Johnsson
Lean production: Value stream analysis & application of SMED on pre-assembly machine
29
Zero failure
The zero failure pillar of the LPS house, Figure 27, is based more or less on TPS principles 5, 6, 7 and 8. Standardization of a process will ensure lasting improvement. The standard should consist of four parts; prevention, detection, reporting and elimination, see explanations below in Figure 28.
Figure 27: Zero failure principle
Figure 28: LPS standardization elements
3.1.7 The base of LPS
A solid “basement” is the premise for “Just in Time” (JIT). See figure Figure 29. Having strong internal and external suppliers, the bottom part of the base, makes possible to achieve the 5R’s (Right part, Right quantity, Right time, Right amount, Right location). The second step or the base is motivated employees and teams. All employees must be integrated in the LPS work until the whole organization is penetrated. If the employees are frequently informed and are involved in the LPS work, it is more likely that they will be motivated. The third step, continuous improvement or kaizen, is another key factor for success. The improvements should be made with small steps with a short planning period, little or no investment and with intensive cooperation with operators. Also innovative improvements in large steps are necessary, which have longer planning periods, higher investments and lower operator involvement. See Figure 30. The fourth step of the base is standardization, which sustains lasting improvements. The standards can be applied in different manners, such as manuals, handbooks, rules, quality requirements, etc. The innovations, continuous improvements and standardization should work in conjunction, see Figure 31.
Zero failure strategy
Target: 100% good quality achieved by stable design and standardized processes
Defect prevention Do not let defects arise in the first place!
Defect detection Identify defects immediately!
Defect reporting Report defects immediately to the generating process!
Defect elimination Fix defects immediately and permanently!
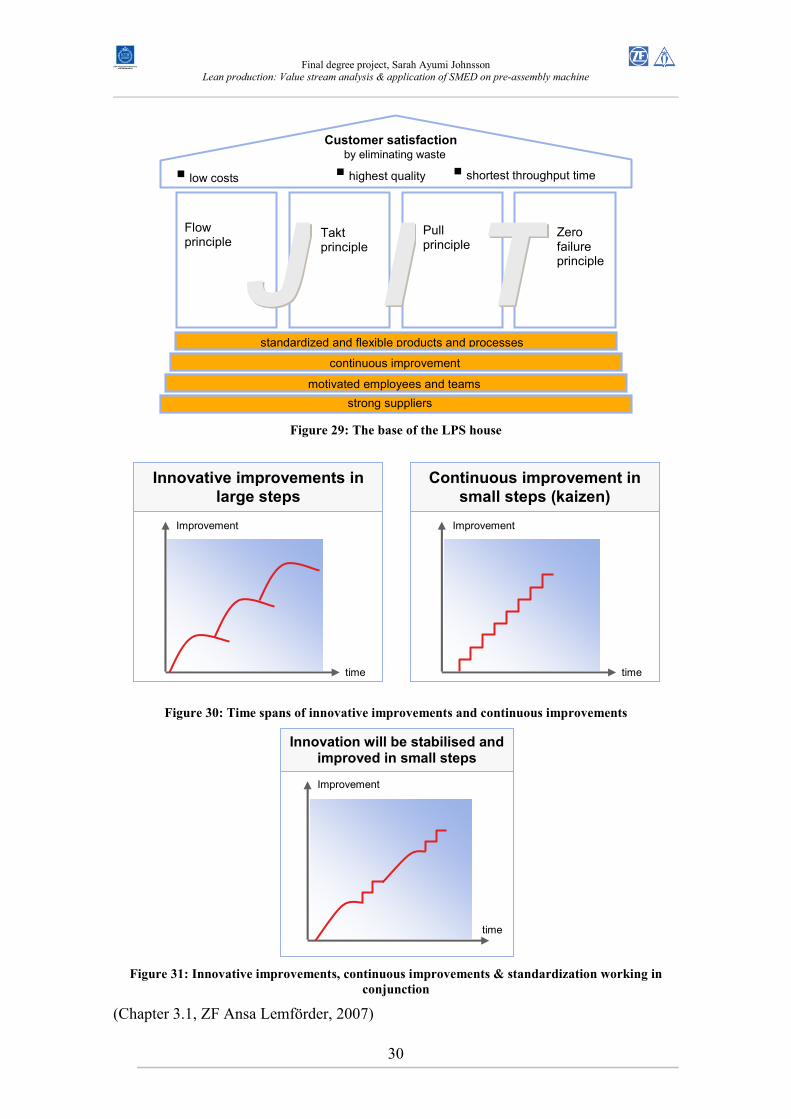
Final degree project, Sarah Ayumi Johnsson
Lean production: Value stream analysis & application of SMED on pre-assembly machine
30
Figure 29: The base of the LPS house
Figure 30: Time spans of innovative improvements and continuous improvements
Figure 31: Innovative improvements, continuous improvements & standardization working in
conjunction
(Chapter 3.1, ZF Ansa Lemförder, 2007)
J J I I T T
motivated employees and teams
continuous improvement
standardized and flexible products and processes
strong suppliers
� highest quality � shortest throughput time
Customer satisfaction by eliminating waste
Takt principle
� low costs
Zero failure principle
Flow principle
Pull principle
Continuous improvement in
small steps (kaizen)
Improvement
time
Innovative improvements in
large steps
Improvement
time
Innovation will be stabilised and improved in small steps
Improvement
time
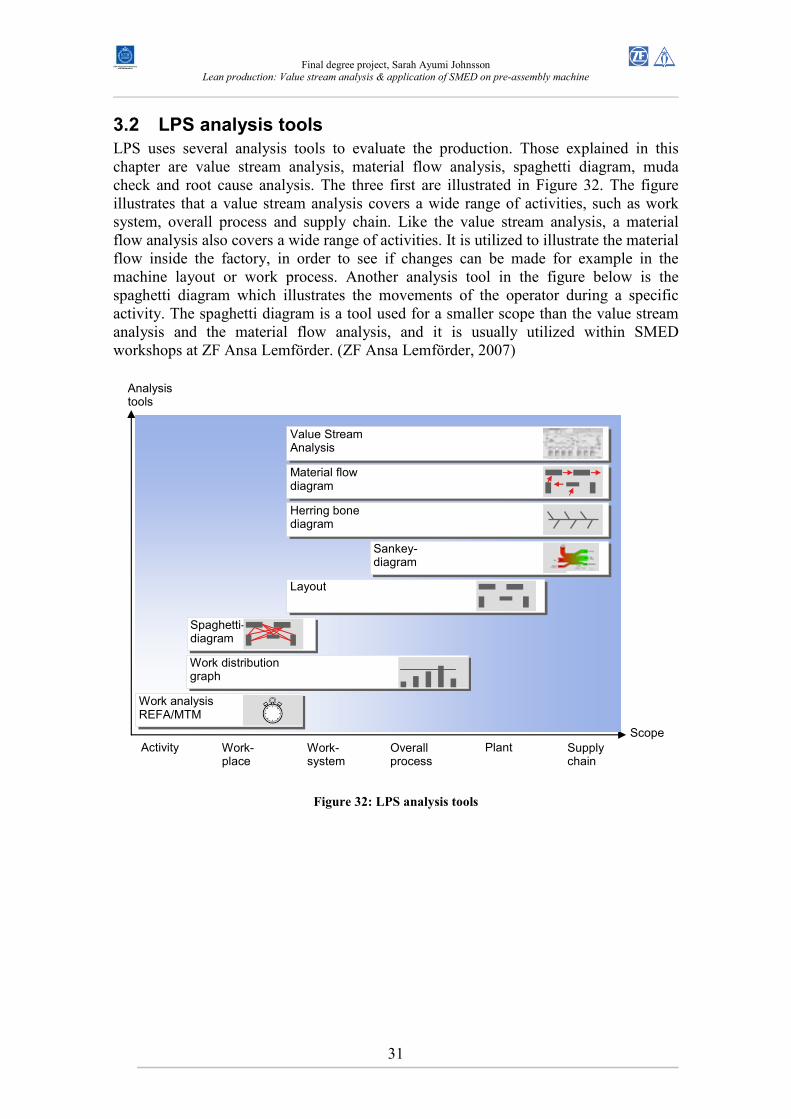
Final degree project, Sarah Ayumi Johnsson
Lean production: Value stream analysis & application of SMED on pre-assembly machine
31
3.2 LPS analysis tools
LPS uses several analysis tools to evaluate the production. Those explained in this chapter are value stream analysis, material flow analysis, spaghetti diagram, muda check and root cause analysis. The three first are illustrated in Figure 32. The figure illustrates that a value stream analysis covers a wide range of activities, such as work system, overall process and supply chain. Like the value stream analysis, a material flow analysis also covers a wide range of activities. It is utilized to illustrate the material flow inside the factory, in order to see if changes can be made for example in the machine layout or work process. Another analysis tool in the figure below is the spaghetti diagram which illustrates the movements of the operator during a specific activity. The spaghetti diagram is a tool used for a smaller scope than the value stream analysis and the material flow analysis, and it is usually utilized within SMED workshops at ZF Ansa Lemförder. (ZF Ansa Lemförder, 2007)
Figure 32: LPS analysis tools
Analysis tools
Scope
Activity Work- place
Work- system
Overall process
Plant Supply chain
Value Stream Analysis
Material flow diagram
Herring bone diagram
Sankey- diagram
Layout
Spaghetti- diagram
Work distribution graph
Work analysis REFA/MTM
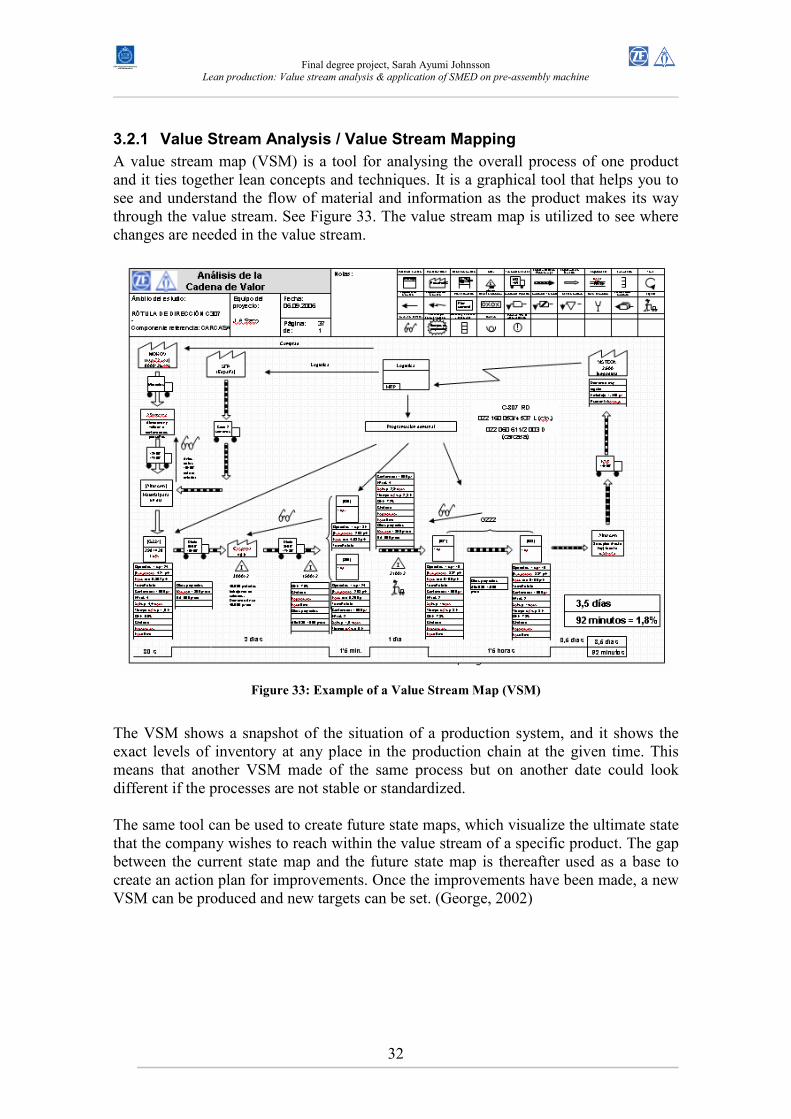
Final degree project, Sarah Ayumi Johnsson
Lean production: Value stream analysis & application of SMED on pre-assembly machine
32
3.2.1 Value Stream Analysis / Value Stream Mapping
A value stream map (VSM) is a tool for analysing the overall process of one product and it ties together lean concepts and techniques. It is a graphical tool that helps you to see and understand the flow of material and information as the product makes its way through the value stream. See Figure 33. The value stream map is utilized to see where changes are needed in the value stream.
Figure 33: Example of a Value Stream Map (VSM)
The VSM shows a snapshot of the situation of a production system, and it shows the exact levels of inventory at any place in the production chain at the given time. This means that another VSM made of the same process but on another date could look different if the processes are not stable or standardized. The same tool can be used to create future state maps, which visualize the ultimate state that the company wishes to reach within the value stream of a specific product. The gap between the current state map and the future state map is thereafter used as a base to create an action plan for improvements. Once the improvements have been made, a new VSM can be produced and new targets can be set. (George, 2002)
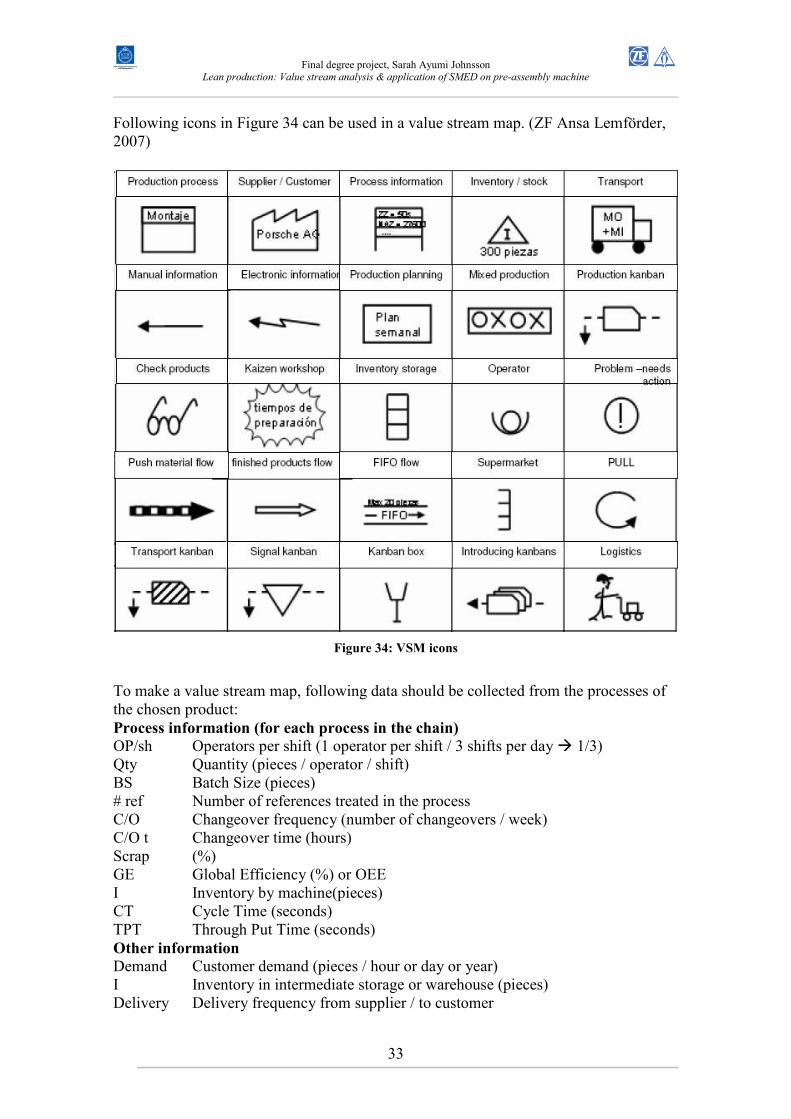
Final degree project, Sarah Ayumi Johnsson
Lean production: Value stream analysis & application of SMED on pre-assembly machine
33
Following icons in Figure 34 can be used in a value stream map. (ZF Ansa Lemförder, 2007)
Figure 34: VSM icons
To make a value stream map, following data should be collected from the processes of the chosen product: Process information (for each process in the chain)
OP/sh Operators per shift (1 operator per shift / 3 shifts per day � 1/3) Qty Quantity (pieces / operator / shift) BS Batch Size (pieces) # ref Number of references treated in the process C/O Changeover frequency (number of changeovers / week) C/O t Changeover time (hours) Scrap (%) GE Global Efficiency (%) or OEE I Inventory by machine(pieces) CT Cycle Time (seconds) TPT Through Put Time (seconds) Other information
Demand Customer demand (pieces / hour or day or year) I Inventory in intermediate storage or warehouse (pieces) Delivery Delivery frequency from supplier / to customer
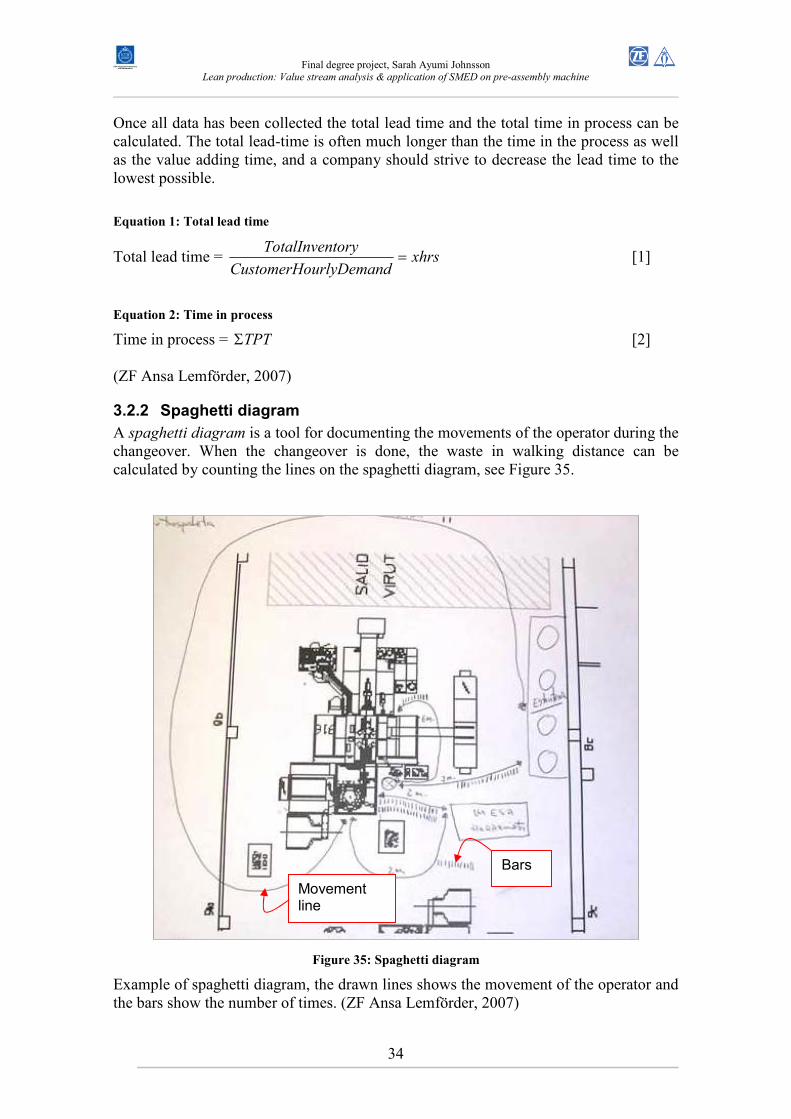
Final degree project, Sarah Ayumi Johnsson
Lean production: Value stream analysis & application of SMED on pre-assembly machine
34
Once all data has been collected the total lead time and the total time in process can be calculated. The total lead-time is often much longer than the time in the process as well as the value adding time, and a company should strive to decrease the lead time to the lowest possible.
Equation 1: Total lead time
Total lead time = xhrsurlyDemandCustomerHo
toryTotalInven= [1]
Equation 2: Time in process
Time in process = TPTΣ [2] (ZF Ansa Lemförder, 2007)
3.2.2 Spaghetti diagram
A spaghetti diagram is a tool for documenting the movements of the operator during the changeover. When the changeover is done, the waste in walking distance can be calculated by counting the lines on the spaghetti diagram, see Figure 35.
Figure 35: Spaghetti diagram
Example of spaghetti diagram, the drawn lines shows the movement of the operator and the bars show the number of times. (ZF Ansa Lemförder, 2007)
Movement line
Bars
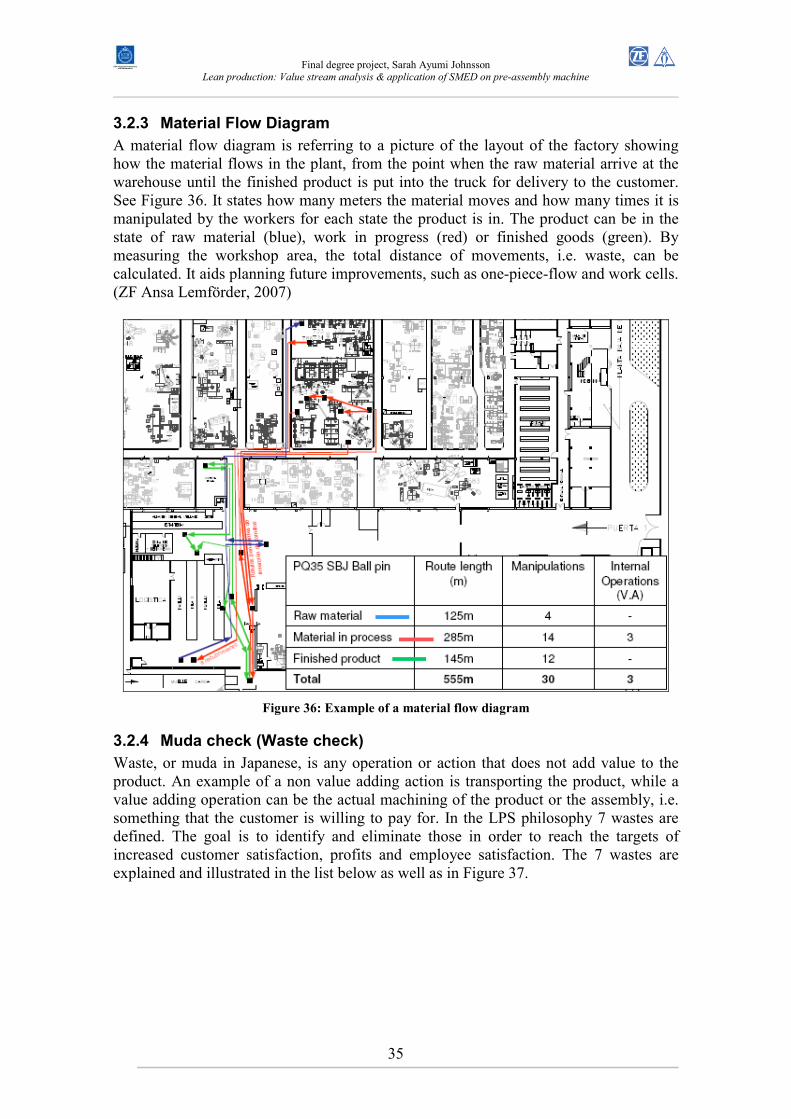
Final degree project, Sarah Ayumi Johnsson
Lean production: Value stream analysis & application of SMED on pre-assembly machine
35
3.2.3 Material Flow Diagram
A material flow diagram is referring to a picture of the layout of the factory showing how the material flows in the plant, from the point when the raw material arrive at the warehouse until the finished product is put into the truck for delivery to the customer. See Figure 36. It states how many meters the material moves and how many times it is manipulated by the workers for each state the product is in. The product can be in the state of raw material (blue), work in progress (red) or finished goods (green). By measuring the workshop area, the total distance of movements, i.e. waste, can be calculated. It aids planning future improvements, such as one-piece-flow and work cells. (ZF Ansa Lemförder, 2007)
Figure 36: Example of a material flow diagram
3.2.4 Muda check (Waste check)
Waste, or muda in Japanese, is any operation or action that does not add value to the product. An example of a non value adding action is transporting the product, while a value adding operation can be the actual machining of the product or the assembly, i.e. something that the customer is willing to pay for. In the LPS philosophy 7 wastes are defined. The goal is to identify and eliminate those in order to reach the targets of increased customer satisfaction, profits and employee satisfaction. The 7 wastes are explained and illustrated in the list below as well as in Figure 37.
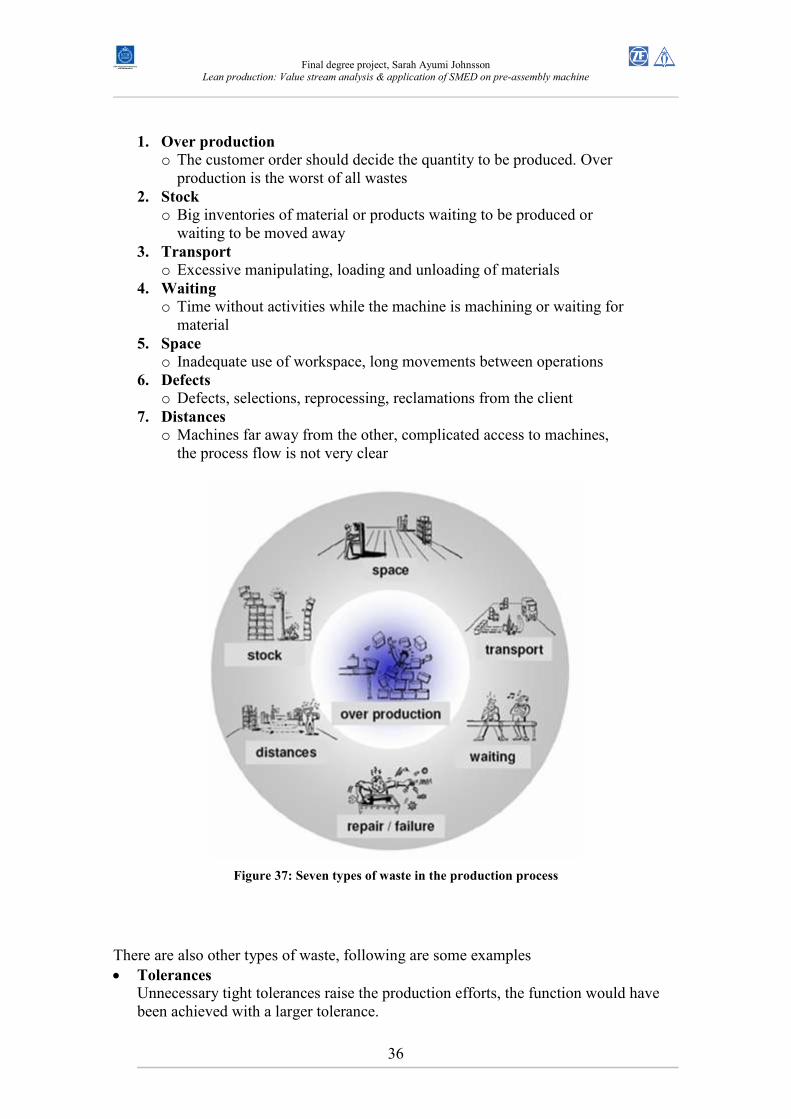
Final degree project, Sarah Ayumi Johnsson
Lean production: Value stream analysis & application of SMED on pre-assembly machine
36
1. Over production
o The customer order should decide the quantity to be produced. Over production is the worst of all wastes
2. Stock o Big inventories of material or products waiting to be produced or
waiting to be moved away 3. Transport
o Excessive manipulating, loading and unloading of materials 4. Waiting
o Time without activities while the machine is machining or waiting for material
5. Space o Inadequate use of workspace, long movements between operations
6. Defects o Defects, selections, reprocessing, reclamations from the client
7. Distances o Machines far away from the other, complicated access to machines,
the process flow is not very clear
Figure 37: Seven types of waste in the production process
There are also other types of waste, following are some examples • Tolerances
Unnecessary tight tolerances raise the production efforts, the function would have been achieved with a larger tolerance.
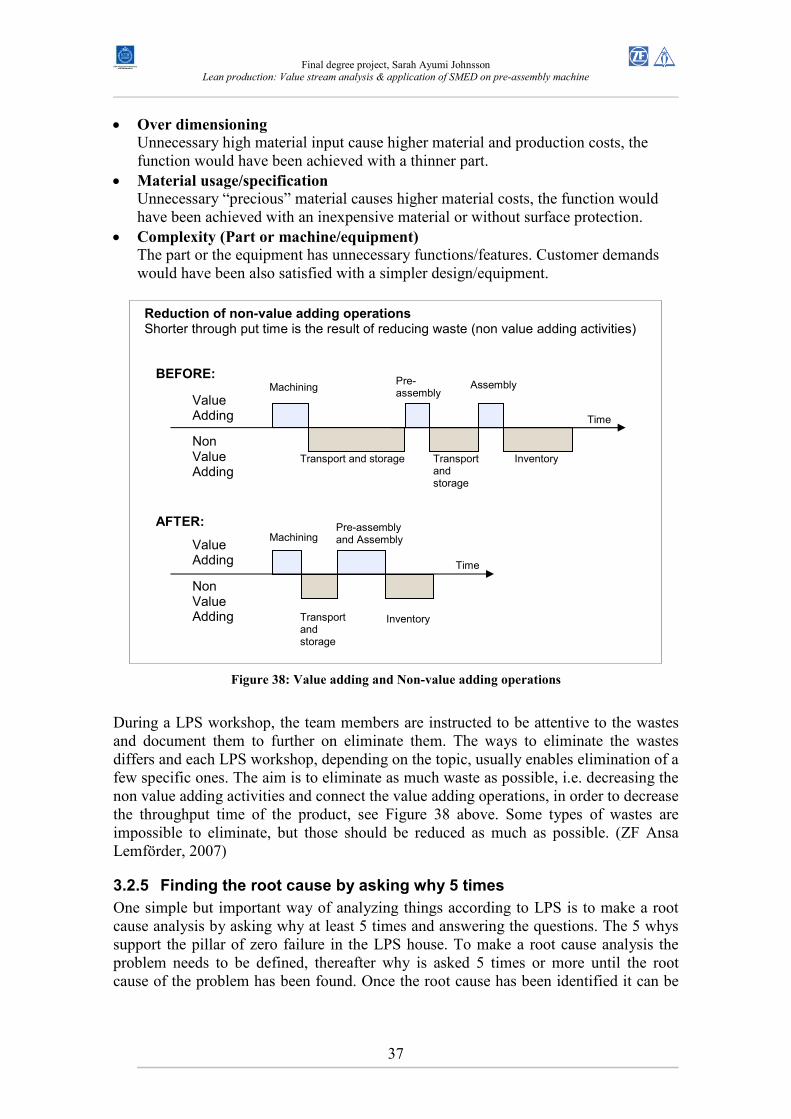
Final degree project, Sarah Ayumi Johnsson
Lean production: Value stream analysis & application of SMED on pre-assembly machine
37
• Over dimensioning
Unnecessary high material input cause higher material and production costs, the function would have been achieved with a thinner part.
• Material usage/specification
Unnecessary “precious” material causes higher material costs, the function would have been achieved with an inexpensive material or without surface protection.
• Complexity (Part or machine/equipment) The part or the equipment has unnecessary functions/features. Customer demands would have been also satisfied with a simpler design/equipment.
Figure 38: Value adding and Non-value adding operations
During a LPS workshop, the team members are instructed to be attentive to the wastes and document them to further on eliminate them. The ways to eliminate the wastes differs and each LPS workshop, depending on the topic, usually enables elimination of a few specific ones. The aim is to eliminate as much waste as possible, i.e. decreasing the non value adding activities and connect the value adding operations, in order to decrease the throughput time of the product, see Figure 38 above. Some types of wastes are impossible to eliminate, but those should be reduced as much as possible. (ZF Ansa Lemförder, 2007)
3.2.5 Finding the root cause by asking why 5 times
One simple but important way of analyzing things according to LPS is to make a root cause analysis by asking why at least 5 times and answering the questions. The 5 whys support the pillar of zero failure in the LPS house. To make a root cause analysis the problem needs to be defined, thereafter why is asked 5 times or more until the root cause of the problem has been found. Once the root cause has been identified it can be
Value Adding
Value Adding
Non Value Adding
Non Value Adding
Reduction of non-value adding operations Shorter through put time is the result of reducing waste (non value adding activities)
BEFORE:
AFTER:
Machining Pre-assembly
Assembly
Machining Pre-assembly and Assembly
Transport and storage Inventory Transport and storage
Transport and storage
Inventory
Time
Time
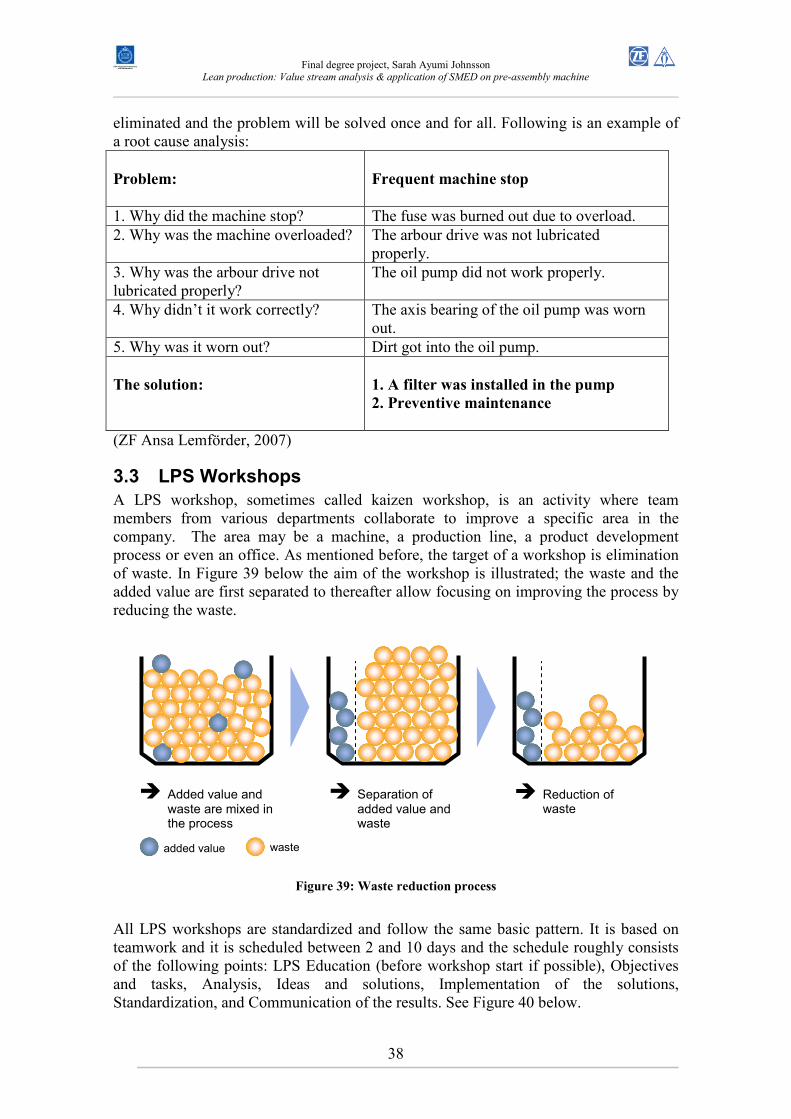
Final degree project, Sarah Ayumi Johnsson
Lean production: Value stream analysis & application of SMED on pre-assembly machine
38
eliminated and the problem will be solved once and for all. Following is an example of a root cause analysis:
Problem:
Frequent machine stop
1. Why did the machine stop? The fuse was burned out due to overload. 2. Why was the machine overloaded? The arbour drive was not lubricated
properly. 3. Why was the arbour drive not lubricated properly?
The oil pump did not work properly.
4. Why didn’t it work correctly? The axis bearing of the oil pump was worn out.
5. Why was it worn out? Dirt got into the oil pump.
The solution:
1. A filter was installed in the pump
2. Preventive maintenance
(ZF Ansa Lemförder, 2007)
3.3 LPS Workshops
A LPS workshop, sometimes called kaizen workshop, is an activity where team members from various departments collaborate to improve a specific area in the company. The area may be a machine, a production line, a product development process or even an office. As mentioned before, the target of a workshop is elimination of waste. In Figure 39 below the aim of the workshop is illustrated; the waste and the added value are first separated to thereafter allow focusing on improving the process by reducing the waste.
Figure 39: Waste reduction process
All LPS workshops are standardized and follow the same basic pattern. It is based on teamwork and it is scheduled between 2 and 10 days and the schedule roughly consists of the following points: LPS Education (before workshop start if possible), Objectives and tasks, Analysis, Ideas and solutions, Implementation of the solutions, Standardization, and Communication of the results. See Figure 40 below.
� Added value and waste are mixed in the process
� Separation of added value and waste
� Reduction of waste
added value waste
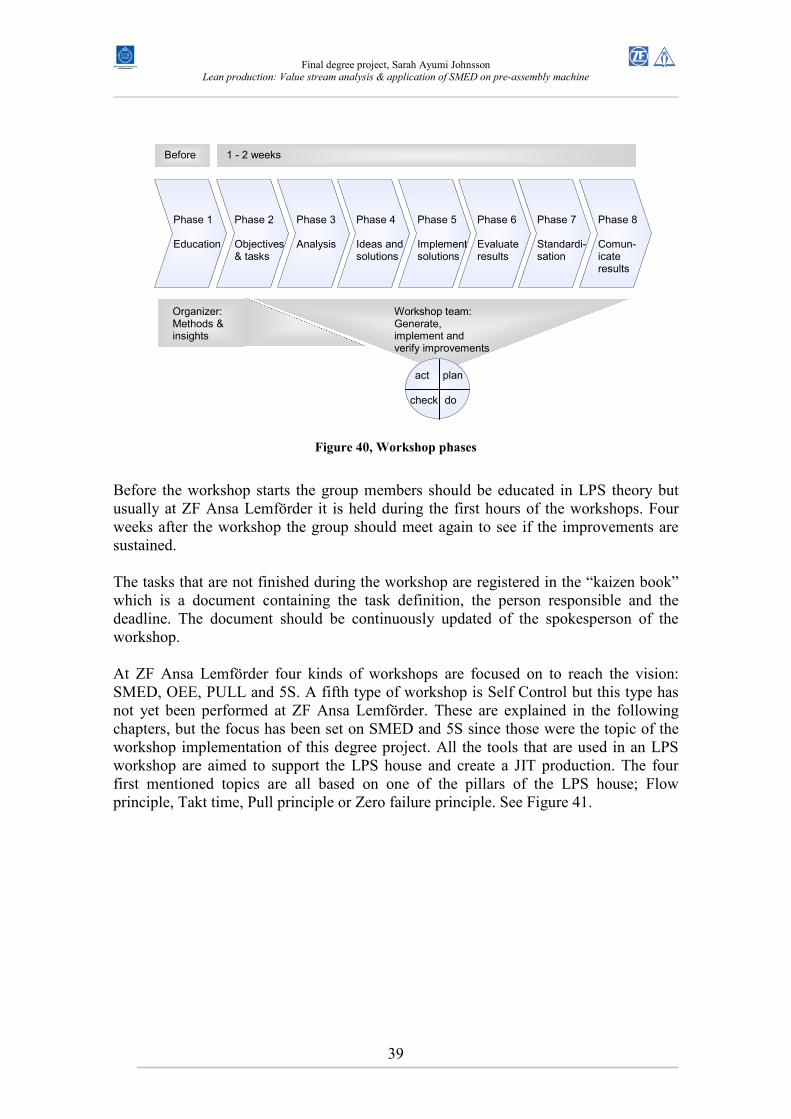
Final degree project, Sarah Ayumi Johnsson
Lean production: Value stream analysis & application of SMED on pre-assembly machine
39
Figure 40, Workshop phases
Before the workshop starts the group members should be educated in LPS theory but usually at ZF Ansa Lemförder it is held during the first hours of the workshops. Four weeks after the workshop the group should meet again to see if the improvements are sustained. The tasks that are not finished during the workshop are registered in the “kaizen book” which is a document containing the task definition, the person responsible and the deadline. The document should be continuously updated of the spokesperson of the workshop. At ZF Ansa Lemförder four kinds of workshops are focused on to reach the vision: SMED, OEE, PULL and 5S. A fifth type of workshop is Self Control but this type has not yet been performed at ZF Ansa Lemförder. These are explained in the following chapters, but the focus has been set on SMED and 5S since those were the topic of the workshop implementation of this degree project. All the tools that are used in an LPS workshop are aimed to support the LPS house and create a JIT production. The four first mentioned topics are all based on one of the pillars of the LPS house; Flow principle, Takt time, Pull principle or Zero failure principle. See Figure 41.
Phase 1 Education
Before 1 - 2 weeks
Phase 2 Objectives & tasks
Phase 3 Analysis
Phase 4 Ideas and solutions
Phase 5 Implementsolutions
Phase 6 Evaluate results
Phase 7 Standardi-sation
Phase 8 Comun-icate results
Organizer: Methods & insights
Workshop team: Generate, implement and verify improvements
plan
do check
act
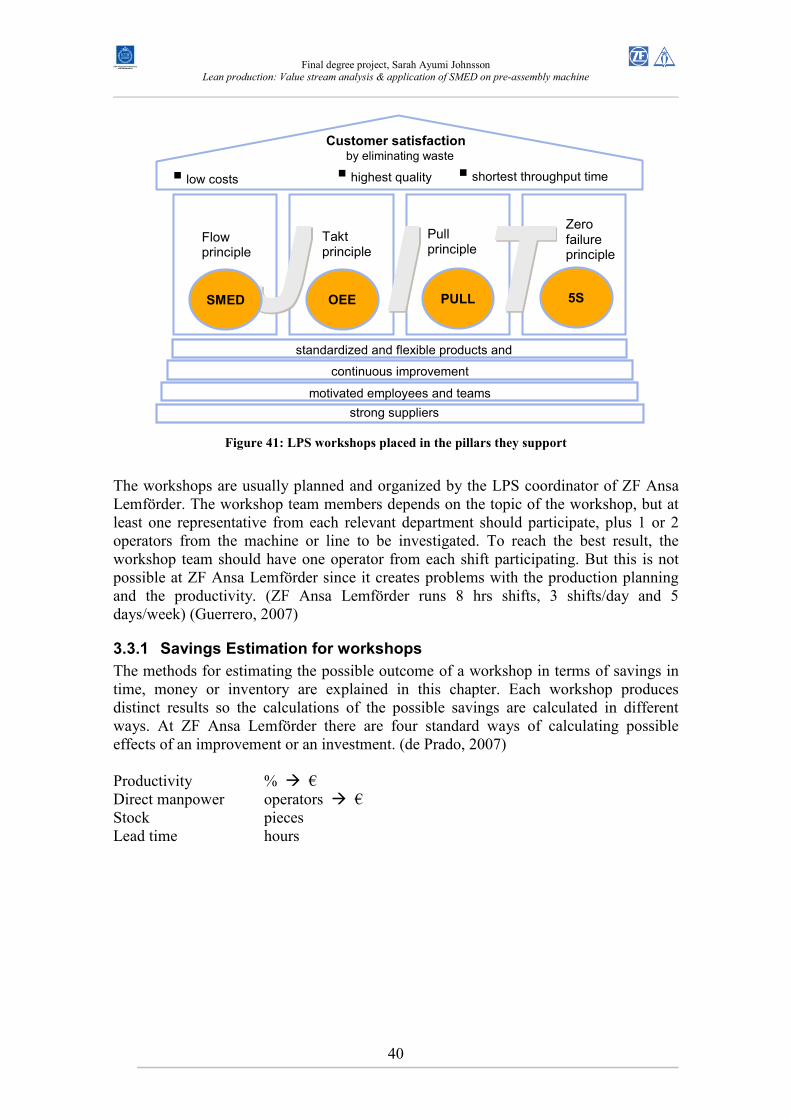
Final degree project, Sarah Ayumi Johnsson
Lean production: Value stream analysis & application of SMED on pre-assembly machine
40
Figure 41: LPS workshops placed in the pillars they support
The workshops are usually planned and organized by the LPS coordinator of ZF Ansa Lemförder. The workshop team members depends on the topic of the workshop, but at least one representative from each relevant department should participate, plus 1 or 2 operators from the machine or line to be investigated. To reach the best result, the workshop team should have one operator from each shift participating. But this is not possible at ZF Ansa Lemförder since it creates problems with the production planning and the productivity. (ZF Ansa Lemförder runs 8 hrs shifts, 3 shifts/day and 5 days/week) (Guerrero, 2007)
3.3.1 Savings Estimation for workshops
The methods for estimating the possible outcome of a workshop in terms of savings in time, money or inventory are explained in this chapter. Each workshop produces distinct results so the calculations of the possible savings are calculated in different ways. At ZF Ansa Lemförder there are four standard ways of calculating possible effects of an improvement or an investment. (de Prado, 2007) Productivity % � € Direct manpower operators � € Stock pieces Lead time hours
J J I I T T
motivated employees and teams
continuous improvement
standardized and flexible products and
strong suppliers
� highest quality � shortest throughput time
Customer satisfaction by eliminating waste
Takt principle
� low costs
Zero failure principle
Flow principle
Pull principle
SMED OEE PULL 5S
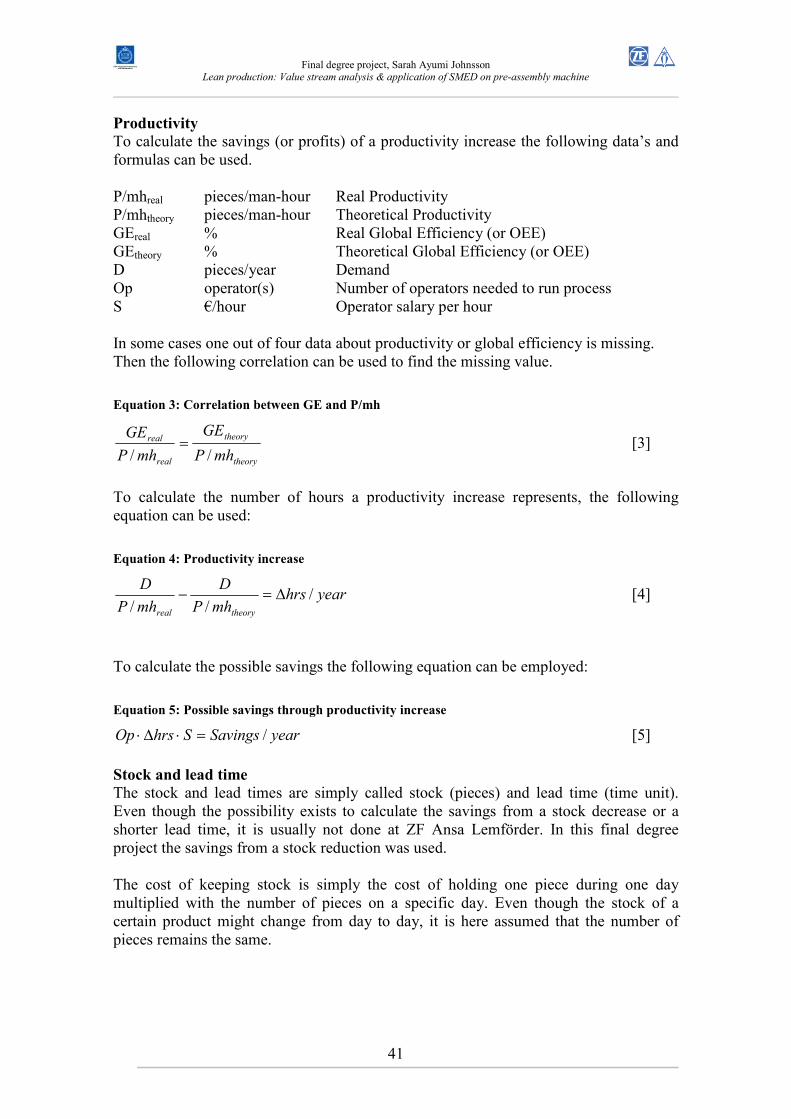
Final degree project, Sarah Ayumi Johnsson
Lean production: Value stream analysis & application of SMED on pre-assembly machine
41
Productivity
To calculate the savings (or profits) of a productivity increase the following data’s and formulas can be used. P/mhreal pieces/man-hour Real Productivity P/mhtheory pieces/man-hour Theoretical Productivity GEreal % Real Global Efficiency (or OEE) GEtheory % Theoretical Global Efficiency (or OEE) D pieces/year Demand Op operator(s) Number of operators needed to run process S €/hour Operator salary per hour In some cases one out of four data about productivity or global efficiency is missing. Then the following correlation can be used to find the missing value.
Equation 3: Correlation between GE and P/mh
theory
theory
real
real
mhP
GE
mhP
GE
//= [3]
To calculate the number of hours a productivity increase represents, the following equation can be used:
Equation 4: Productivity increase
yearhrsmhP
D
mhP
D
theoryreal
///
∆=− [4]
To calculate the possible savings the following equation can be employed:
Equation 5: Possible savings through productivity increase
yearSavingsShrsOp /=⋅∆⋅ [5]
Stock and lead time
The stock and lead times are simply called stock (pieces) and lead time (time unit). Even though the possibility exists to calculate the savings from a stock decrease or a shorter lead time, it is usually not done at ZF Ansa Lemförder. In this final degree project the savings from a stock reduction was used. The cost of keeping stock is simply the cost of holding one piece during one day multiplied with the number of pieces on a specific day. Even though the stock of a certain product might change from day to day, it is here assumed that the number of pieces remains the same.
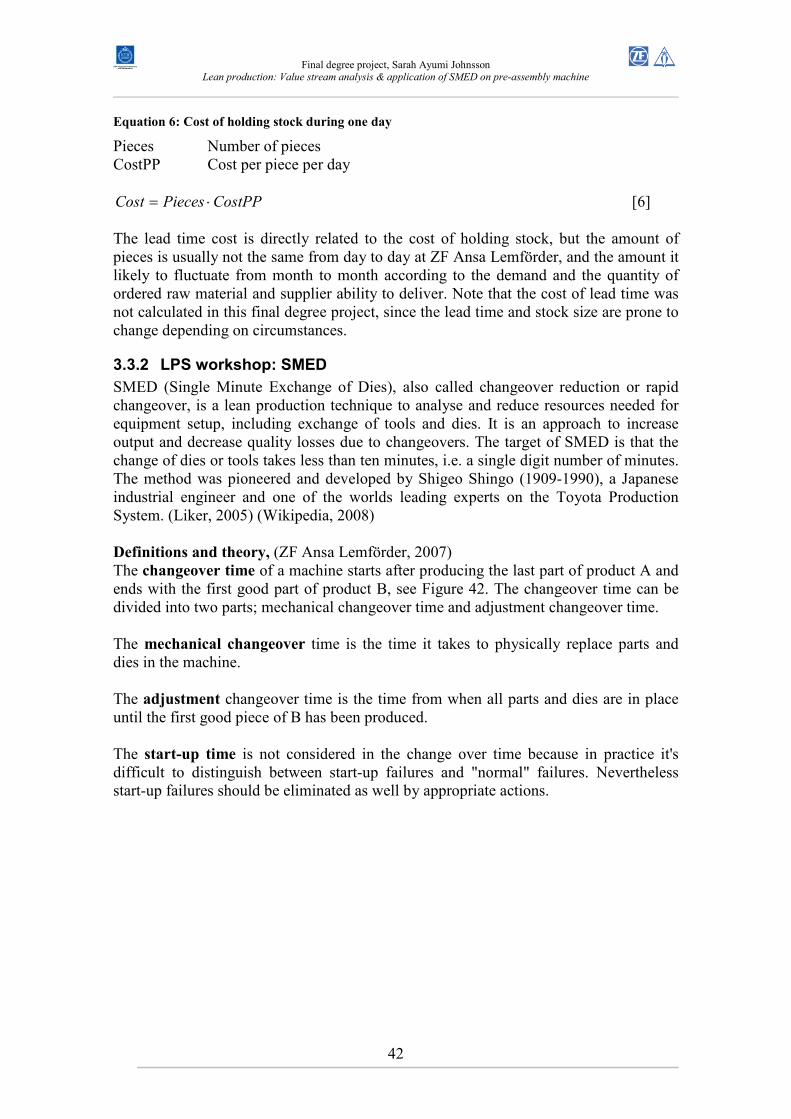
Final degree project, Sarah Ayumi Johnsson
Lean production: Value stream analysis & application of SMED on pre-assembly machine
42
Equation 6: Cost of holding stock during one day
Pieces Number of pieces CostPP Cost per piece per day
CostPPPiecesCost ⋅= [6] The lead time cost is directly related to the cost of holding stock, but the amount of pieces is usually not the same from day to day at ZF Ansa Lemförder, and the amount it likely to fluctuate from month to month according to the demand and the quantity of ordered raw material and supplier ability to deliver. Note that the cost of lead time was not calculated in this final degree project, since the lead time and stock size are prone to change depending on circumstances.
3.3.2 LPS workshop: SMED
SMED (Single Minute Exchange of Dies), also called changeover reduction or rapid changeover, is a lean production technique to analyse and reduce resources needed for equipment setup, including exchange of tools and dies. It is an approach to increase output and decrease quality losses due to changeovers. The target of SMED is that the change of dies or tools takes less than ten minutes, i.e. a single digit number of minutes. The method was pioneered and developed by Shigeo Shingo (1909-1990), a Japanese industrial engineer and one of the worlds leading experts on the Toyota Production System. (Liker, 2005) (Wikipedia, 2008)
Definitions and theory, (ZF Ansa Lemförder, 2007) The changeover time of a machine starts after producing the last part of product A and ends with the first good part of product B, see Figure 42. The changeover time can be divided into two parts; mechanical changeover time and adjustment changeover time. The mechanical changeover time is the time it takes to physically replace parts and dies in the machine. The adjustment changeover time is the time from when all parts and dies are in place until the first good piece of B has been produced. The start-up time is not considered in the change over time because in practice it's difficult to distinguish between start-up failures and "normal" failures. Nevertheless start-up failures should be eliminated as well by appropriate actions.
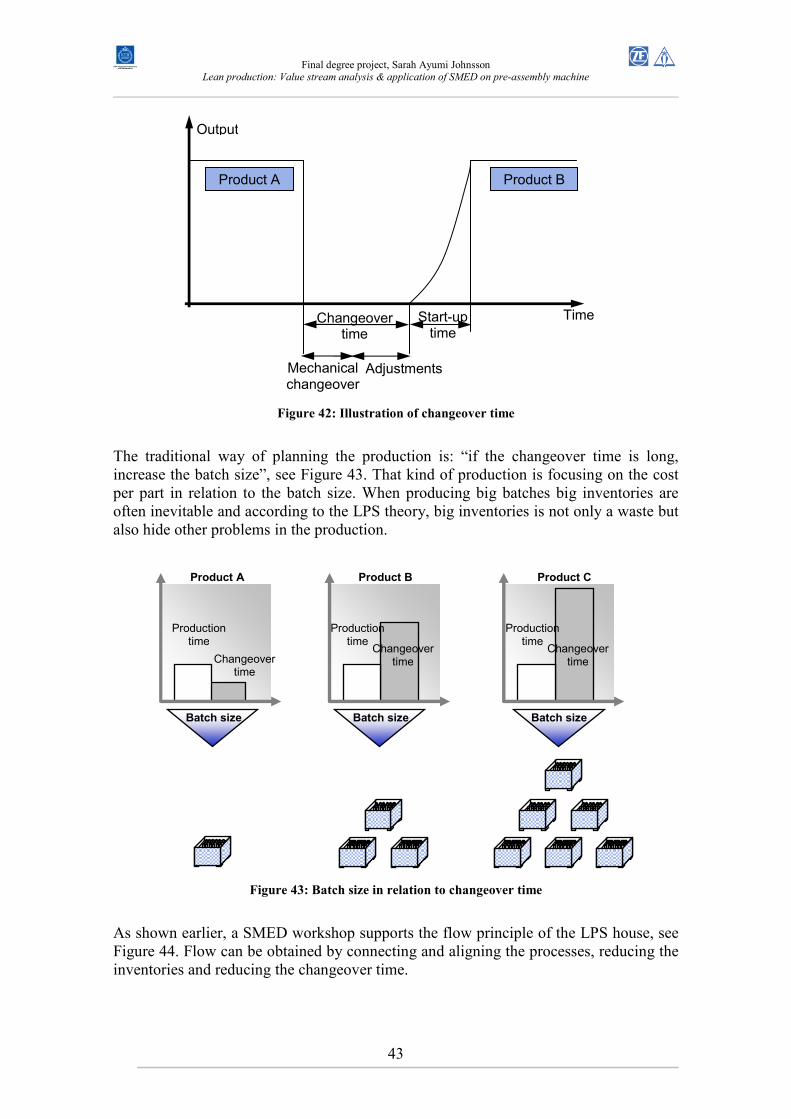
Final degree project, Sarah Ayumi Johnsson
Lean production: Value stream analysis & application of SMED on pre-assembly machine
43
Figure 42: Illustration of changeover time
The traditional way of planning the production is: “if the changeover time is long, increase the batch size”, see Figure 43. That kind of production is focusing on the cost per part in relation to the batch size. When producing big batches big inventories are often inevitable and according to the LPS theory, big inventories is not only a waste but also hide other problems in the production.
Figure 43: Batch size in relation to changeover time
As shown earlier, a SMED workshop supports the flow principle of the LPS house, see Figure 44. Flow can be obtained by connecting and aligning the processes, reducing the inventories and reducing the changeover time.
Time
Output
Product A Product B
Start-up time
Changeover time
Mechanical changeover
Adjustments
Product C Product B Product A
Batch size
Production time
Changeover time
Changeover time
Changeover time
Production time
Production time
Batch size Batch size
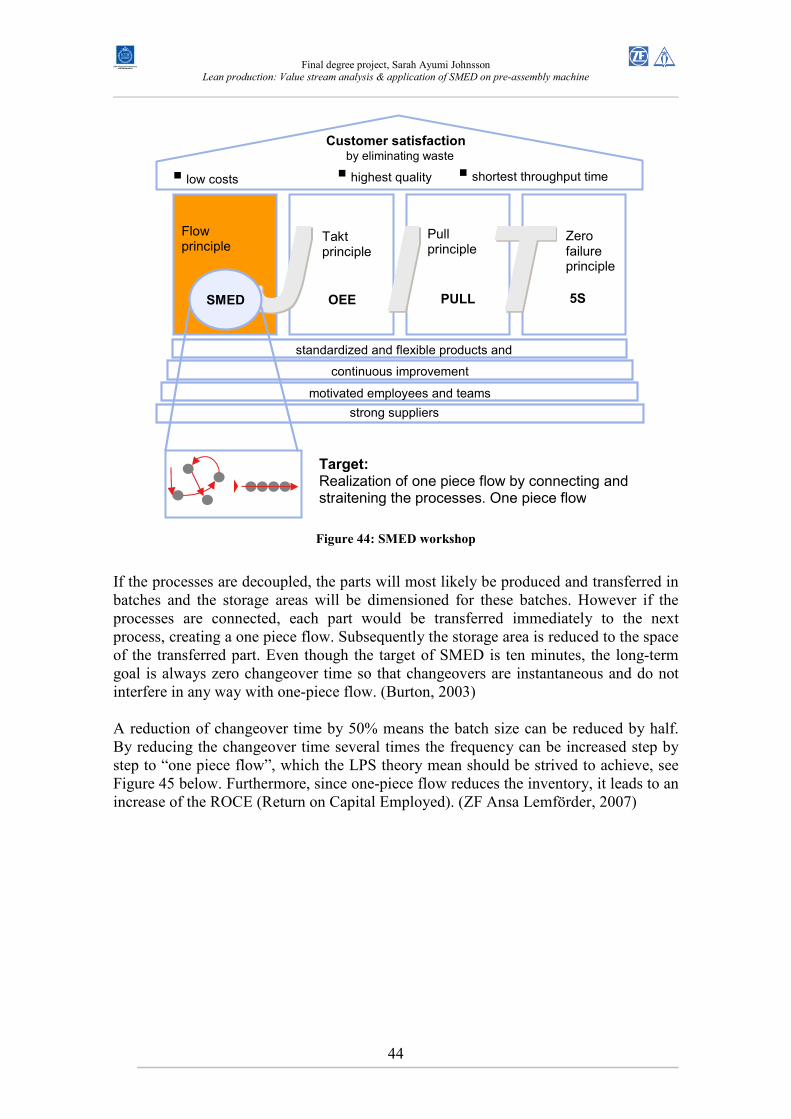
Final degree project, Sarah Ayumi Johnsson
Lean production: Value stream analysis & application of SMED on pre-assembly machine
44
Figure 44: SMED workshop
If the processes are decoupled, the parts will most likely be produced and transferred in batches and the storage areas will be dimensioned for these batches. However if the processes are connected, each part would be transferred immediately to the next process, creating a one piece flow. Subsequently the storage area is reduced to the space of the transferred part. Even though the target of SMED is ten minutes, the long-term goal is always zero changeover time so that changeovers are instantaneous and do not interfere in any way with one-piece flow. (Burton, 2003) A reduction of changeover time by 50% means the batch size can be reduced by half. By reducing the changeover time several times the frequency can be increased step by step to “one piece flow”, which the LPS theory mean should be strived to achieve, see Figure 45 below. Furthermore, since one-piece flow reduces the inventory, it leads to an increase of the ROCE (Return on Capital Employed). (ZF Ansa Lemförder, 2007)
J J I I T T
motivated employees and teams
continuous improvement
standardized and flexible products and
strong suppliers
� highest quality � shortest throughput time
Customer satisfaction by eliminating waste
Takt principle
� low costs
Zero failure principle
Flow principle
Pull principle
SMED OEE PULL
Target: Realization of one piece flow by connecting and straitening the processes. One piece flow
5S
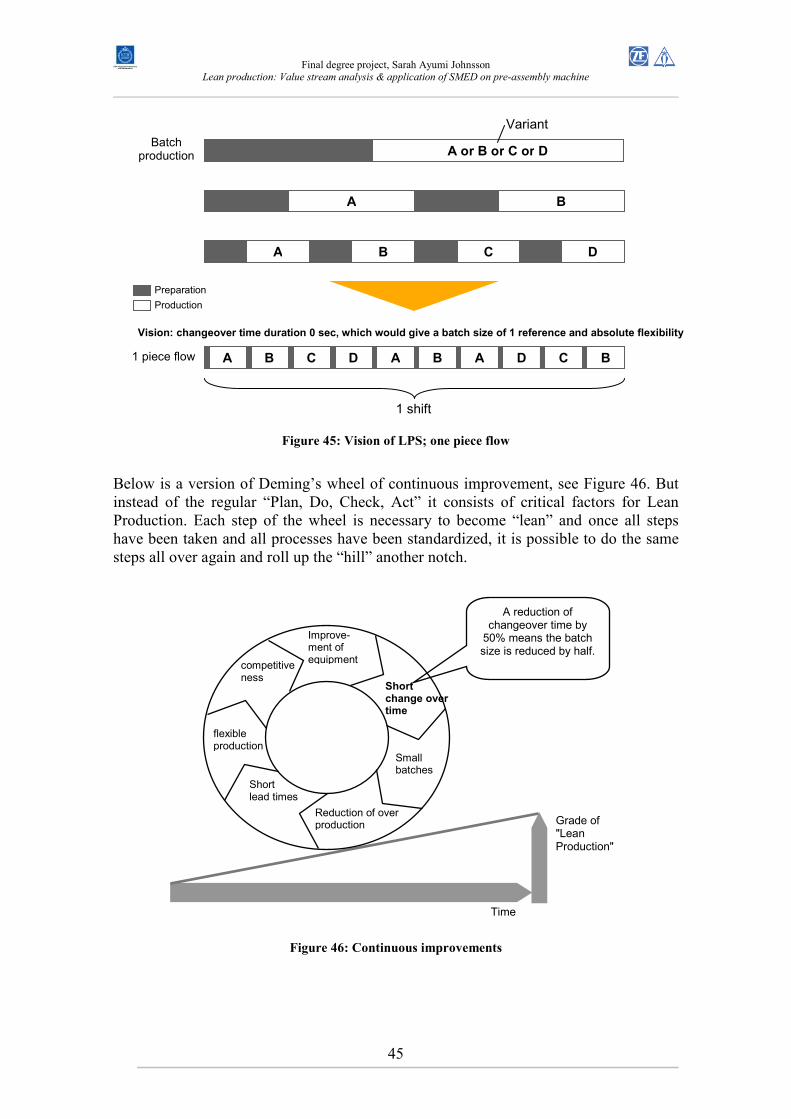
Final degree project, Sarah Ayumi Johnsson
Lean production: Value stream analysis & application of SMED on pre-assembly machine
45
Figure 45: Vision of LPS; one piece flow
Below is a version of Deming’s wheel of continuous improvement, see Figure 46. But instead of the regular “Plan, Do, Check, Act” it consists of critical factors for Lean Production. Each step of the wheel is necessary to become “lean” and once all steps have been taken and all processes have been standardized, it is possible to do the same steps all over again and roll up the “hill” another notch.
Figure 46: Continuous improvements
A or B or C or D
Variant
Preparation
Production
Vision: changeover time duration 0 sec, which would give a batch size of 1 reference and absolute flexibility
1 shift
A B
A C B D
A B B C D A B A D C
Batch production
1 piece flow
Time
Grade of "Lean Production"
A reduction of changeover time by 50% means the batch size is reduced by half.
Short change over time
Small batches
Reduction of over production
flexible production
competitiveness
Short lead times
Improve-ment of equipment
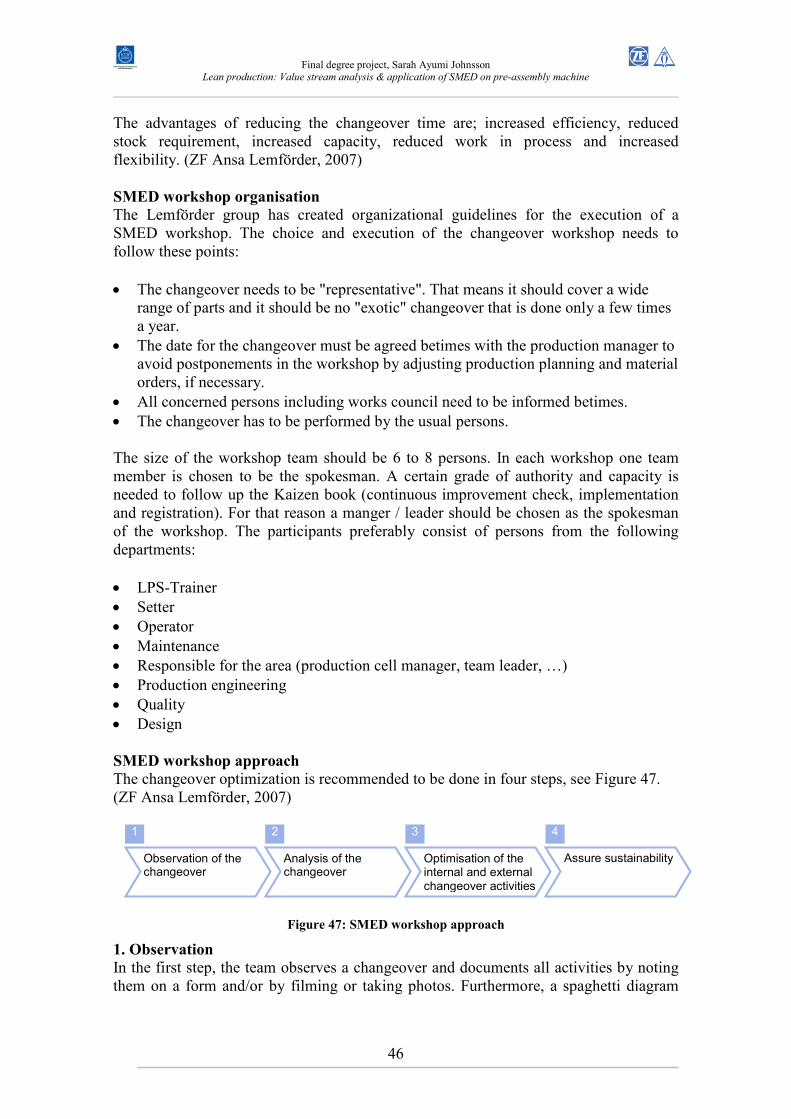
Final degree project, Sarah Ayumi Johnsson
Lean production: Value stream analysis & application of SMED on pre-assembly machine
46
The advantages of reducing the changeover time are; increased efficiency, reduced stock requirement, increased capacity, reduced work in process and increased flexibility. (ZF Ansa Lemförder, 2007)
SMED workshop organisation
The Lemförder group has created organizational guidelines for the execution of a SMED workshop. The choice and execution of the changeover workshop needs to follow these points: • The changeover needs to be "representative". That means it should cover a wide
range of parts and it should be no "exotic" changeover that is done only a few times a year.
• The date for the changeover must be agreed betimes with the production manager to avoid postponements in the workshop by adjusting production planning and material orders, if necessary.
• All concerned persons including works council need to be informed betimes. • The changeover has to be performed by the usual persons. The size of the workshop team should be 6 to 8 persons. In each workshop one team member is chosen to be the spokesman. A certain grade of authority and capacity is needed to follow up the Kaizen book (continuous improvement check, implementation and registration). For that reason a manger / leader should be chosen as the spokesman of the workshop. The participants preferably consist of persons from the following departments: • LPS-Trainer • Setter • Operator • Maintenance • Responsible for the area (production cell manager, team leader, …) • Production engineering • Quality • Design
SMED workshop approach
The changeover optimization is recommended to be done in four steps, see Figure 47. (ZF Ansa Lemförder, 2007)
Figure 47: SMED workshop approach
1. Observation
In the first step, the team observes a changeover and documents all activities by noting them on a form and/or by filming or taking photos. Furthermore, a spaghetti diagram
Optimisation of the internal and external changeover activities
Observation of the changeover
1 2 3 4
Analysis of the changeover
Assure sustainability

Final degree project, Sarah Ayumi Johnsson
Lean production: Value stream analysis & application of SMED on pre-assembly machine
47
and a muda check are made during the observation. All wastes should be documented and possible improvements should be written down. 2. Analysis
The analysis consists of classification of the activities that were observed during the changeover. The activities are classified into one out of eight groups together with the duration of each activity, and are thereafter split up into internal and external activities, see Table 2 and
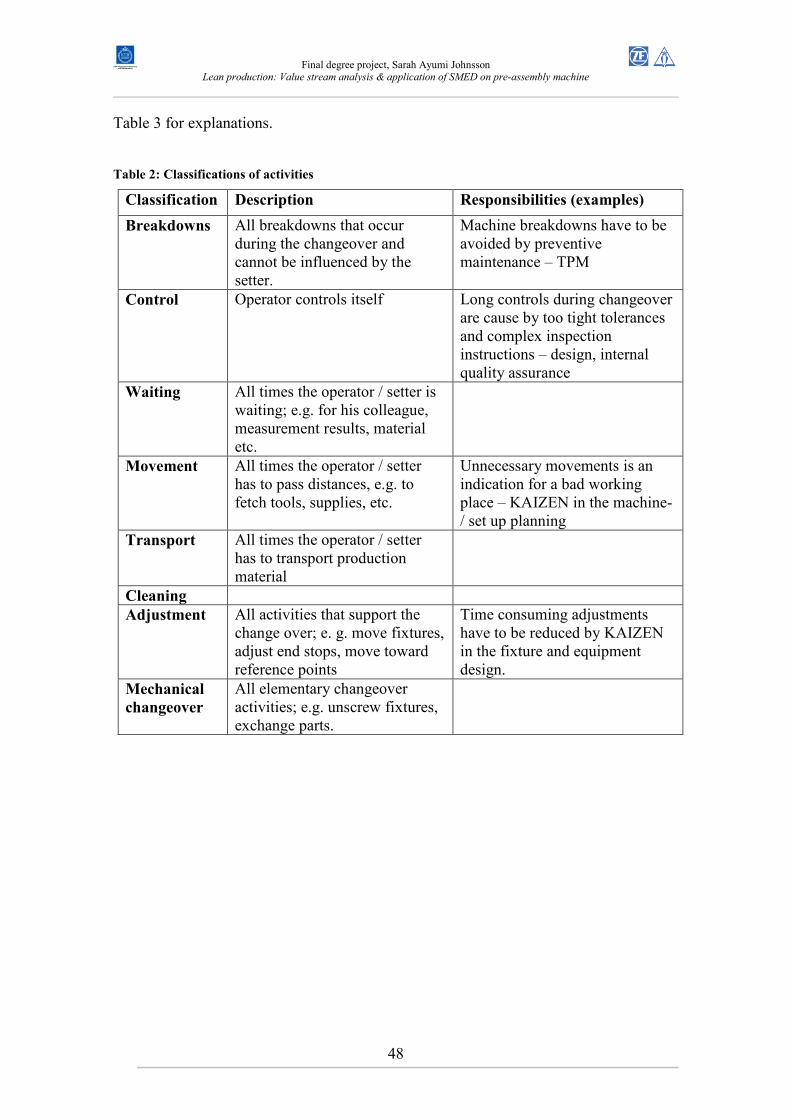
Final degree project, Sarah Ayumi Johnsson
Lean production: Value stream analysis & application of SMED on pre-assembly machine
48
Table 3 for explanations.
Table 2: Classifications of activities
Classification Description Responsibilities (examples)
Breakdowns All breakdowns that occur during the changeover and cannot be influenced by the setter.
Machine breakdowns have to be avoided by preventive maintenance – TPM
Control Operator controls itself Long controls during changeover are cause by too tight tolerances and complex inspection instructions – design, internal quality assurance
Waiting All times the operator / setter is waiting; e.g. for his colleague, measurement results, material etc.
Movement All times the operator / setter has to pass distances, e.g. to fetch tools, supplies, etc.
Unnecessary movements is an indication for a bad working place – KAIZEN in the machine- / set up planning
Transport All times the operator / setter has to transport production material
Cleaning Adjustment All activities that support the
change over; e. g. move fixtures, adjust end stops, move toward reference points
Time consuming adjustments have to be reduced by KAIZEN in the fixture and equipment design.
Mechanical
changeover
All elementary changeover activities; e.g. unscrew fixtures, exchange parts.
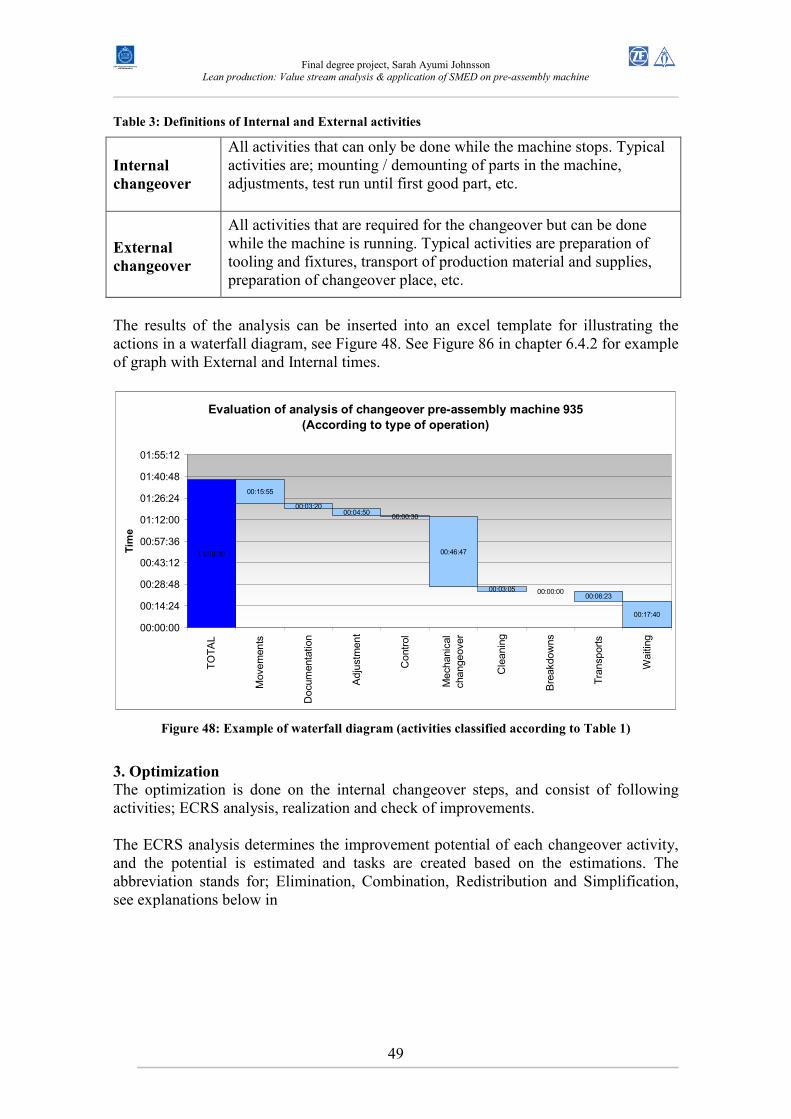
Final degree project, Sarah Ayumi Johnsson
Lean production: Value stream analysis & application of SMED on pre-assembly machine
49
Table 3: Definitions of Internal and External activities
Internal
changeover
All activities that can only be done while the machine stops. Typical activities are; mounting / demounting of parts in the machine, adjustments, test run until first good part, etc.
External
changeover
All activities that are required for the changeover but can be done while the machine is running. Typical activities are preparation of tooling and fixtures, transport of production material and supplies, preparation of changeover place, etc.
The results of the analysis can be inserted into an excel template for illustrating the actions in a waterfall diagram, see Figure 48. See Figure 86 in chapter 6.4.2 for example of graph with External and Internal times.
Evaluation of analysis of changeover pre-assembly machine 935
(According to type of operation)
01:38:30
00:15:55
00:03:2000:04:50
00:00:30
00:46:47
00:03:05 00:00:0000:06:23
00:17:40
00:00:00
00:14:24
00:28:48
00:43:12
00:57:36
01:12:00
01:26:24
01:40:48
01:55:12
TOTAL
Movements
Documentation
Adjustment
Control
Mechanical
changeover
Cleaning
Breakdowns
Transports
Waiting
Time
Figure 48: Example of waterfall diagram (activities classified according to Table 1)
3. Optimization
The optimization is done on the internal changeover steps, and consist of following activities; ECRS analysis, realization and check of improvements. The ECRS analysis determines the improvement potential of each changeover activity, and the potential is estimated and tasks are created based on the estimations. The abbreviation stands for; Elimination, Combination, Redistribution and Simplification, see explanations below in

Final degree project, Sarah Ayumi Johnsson
Lean production: Value stream analysis & application of SMED on pre-assembly machine
50
Table 4.
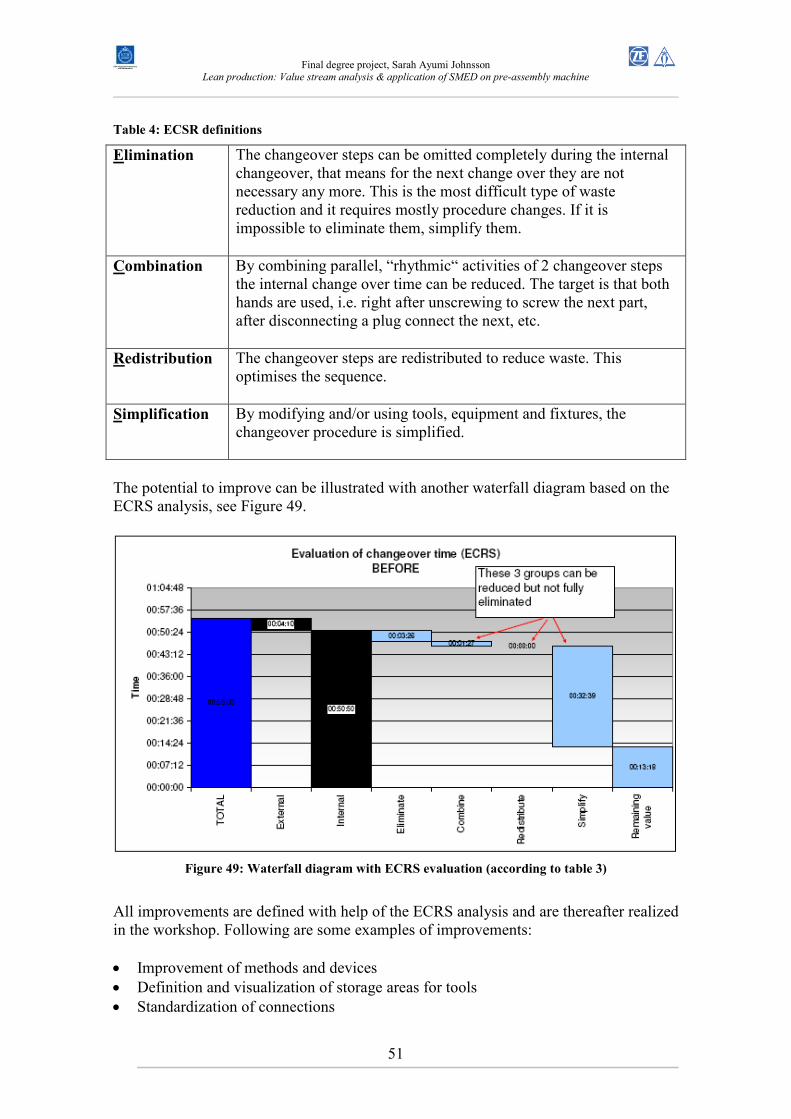
Final degree project, Sarah Ayumi Johnsson
Lean production: Value stream analysis & application of SMED on pre-assembly machine
51
Table 4: ECSR definitions
Elimination The changeover steps can be omitted completely during the internal changeover, that means for the next change over they are not necessary any more. This is the most difficult type of waste reduction and it requires mostly procedure changes. If it is impossible to eliminate them, simplify them.
Combination By combining parallel, “rhythmic“ activities of 2 changeover steps the internal change over time can be reduced. The target is that both hands are used, i.e. right after unscrewing to screw the next part, after disconnecting a plug connect the next, etc.
Redistribution The changeover steps are redistributed to reduce waste. This optimises the sequence.
Simplification By modifying and/or using tools, equipment and fixtures, the changeover procedure is simplified.
The potential to improve can be illustrated with another waterfall diagram based on the ECRS analysis, see Figure 49.
Figure 49: Waterfall diagram with ECRS evaluation (according to table 3)
All improvements are defined with help of the ECRS analysis and are thereafter realized in the workshop. Following are some examples of improvements: • Improvement of methods and devices • Definition and visualization of storage areas for tools • Standardization of connections
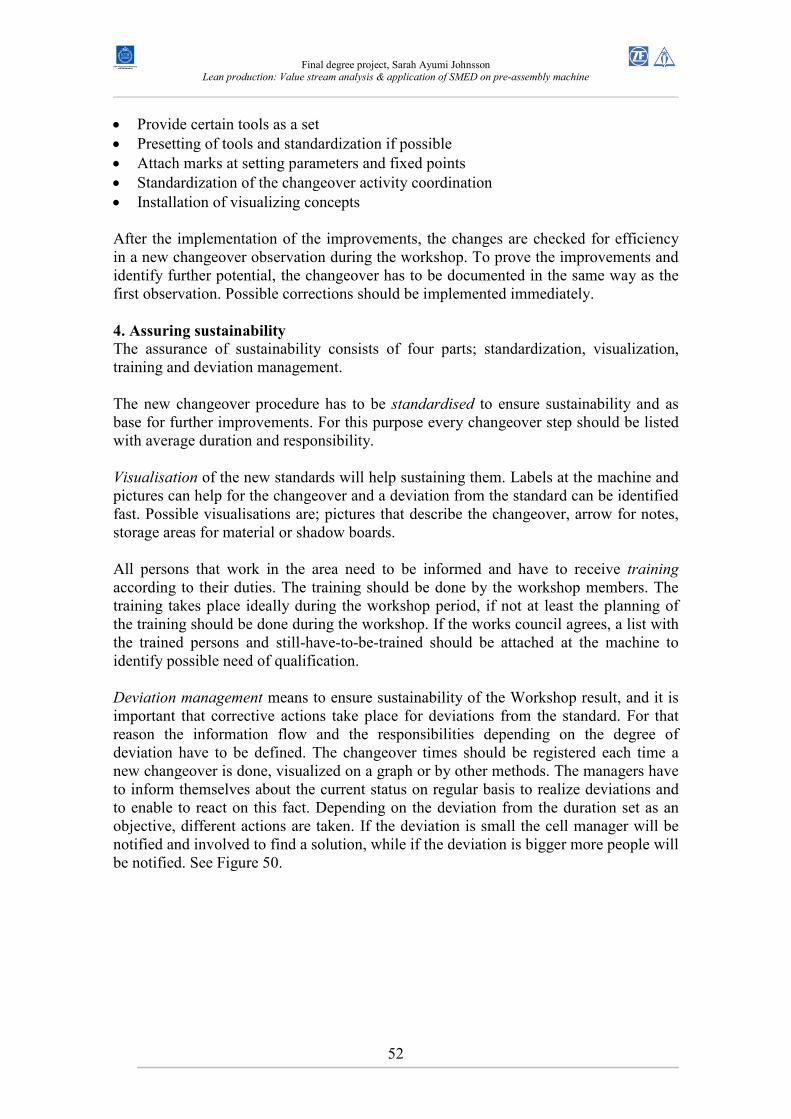
Final degree project, Sarah Ayumi Johnsson
Lean production: Value stream analysis & application of SMED on pre-assembly machine
52
• Provide certain tools as a set • Presetting of tools and standardization if possible • Attach marks at setting parameters and fixed points • Standardization of the changeover activity coordination • Installation of visualizing concepts After the implementation of the improvements, the changes are checked for efficiency in a new changeover observation during the workshop. To prove the improvements and identify further potential, the changeover has to be documented in the same way as the first observation. Possible corrections should be implemented immediately. 4. Assuring sustainability
The assurance of sustainability consists of four parts; standardization, visualization, training and deviation management. The new changeover procedure has to be standardised to ensure sustainability and as base for further improvements. For this purpose every changeover step should be listed with average duration and responsibility. Visualisation of the new standards will help sustaining them. Labels at the machine and pictures can help for the changeover and a deviation from the standard can be identified fast. Possible visualisations are; pictures that describe the changeover, arrow for notes, storage areas for material or shadow boards. All persons that work in the area need to be informed and have to receive training according to their duties. The training should be done by the workshop members. The training takes place ideally during the workshop period, if not at least the planning of the training should be done during the workshop. If the works council agrees, a list with the trained persons and still-have-to-be-trained should be attached at the machine to identify possible need of qualification. Deviation management means to ensure sustainability of the Workshop result, and it is important that corrective actions take place for deviations from the standard. For that reason the information flow and the responsibilities depending on the degree of deviation have to be defined. The changeover times should be registered each time a new changeover is done, visualized on a graph or by other methods. The managers have to inform themselves about the current status on regular basis to realize deviations and to enable to react on this fact. Depending on the deviation from the duration set as an objective, different actions are taken. If the deviation is small the cell manager will be notified and involved to find a solution, while if the deviation is bigger more people will be notified. See Figure 50.
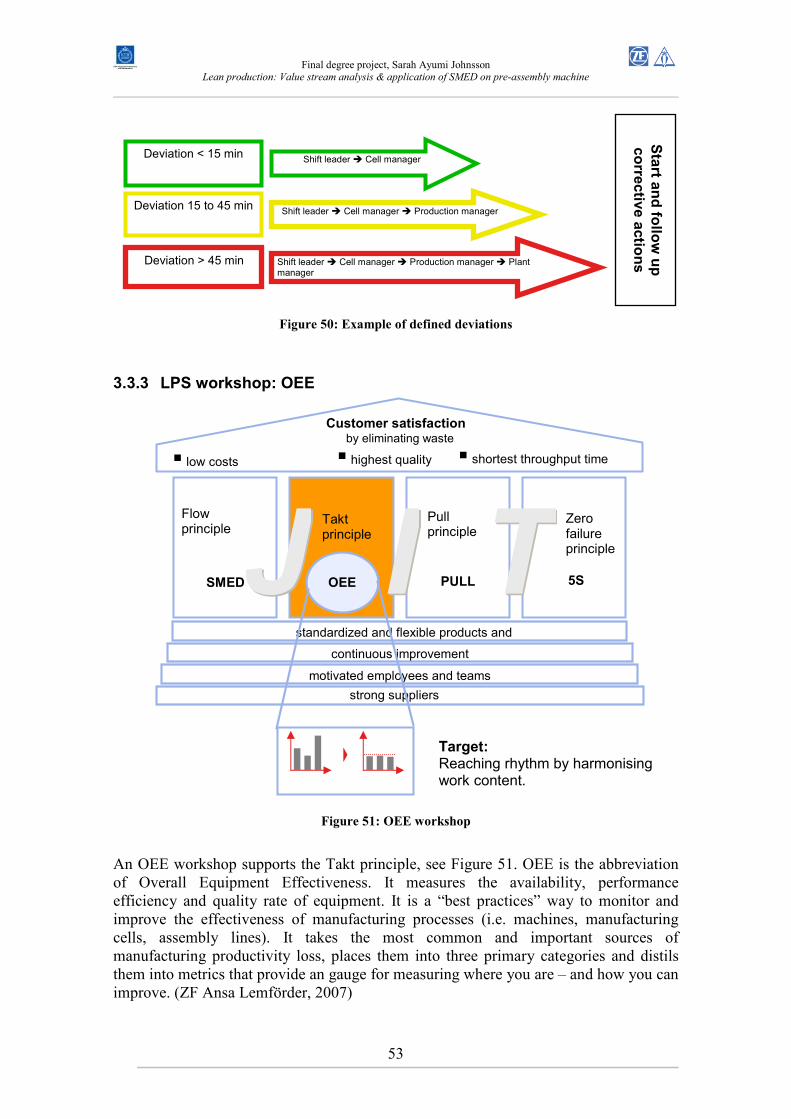
Final degree project, Sarah Ayumi Johnsson
Lean production: Value stream analysis & application of SMED on pre-assembly machine
53
Figure 50: Example of defined deviations
3.3.3 LPS workshop: OEE
Figure 51: OEE workshop
An OEE workshop supports the Takt principle, see Figure 51. OEE is the abbreviation of Overall Equipment Effectiveness. It measures the availability, performance efficiency and quality rate of equipment. It is a “best practices” way to monitor and improve the effectiveness of manufacturing processes (i.e. machines, manufacturing cells, assembly lines). It takes the most common and important sources of manufacturing productivity loss, places them into three primary categories and distils them into metrics that provide an gauge for measuring where you are – and how you can improve. (ZF Ansa Lemförder, 2007)
J J I I T T
motivated employees and teams
continuous improvement
standardized and flexible products and
strong suppliers
� highest quality � shortest throughput time
Customer satisfaction by eliminating waste
Takt principle
� low costs
Zero failure principle
Flow principle
Pull principle
SMED OEE PULL 5S
Target: Reaching rhythm by harmonising work content.
Deviation < 15 min Shift leader � Cell manager
Deviation 15 to 45 min Shift leader � Cell manager � Production manager
Deviation > 45 min Shift leader � Cell manager � Production manager � Plant manager
Start a
nd follow up
corrective actions
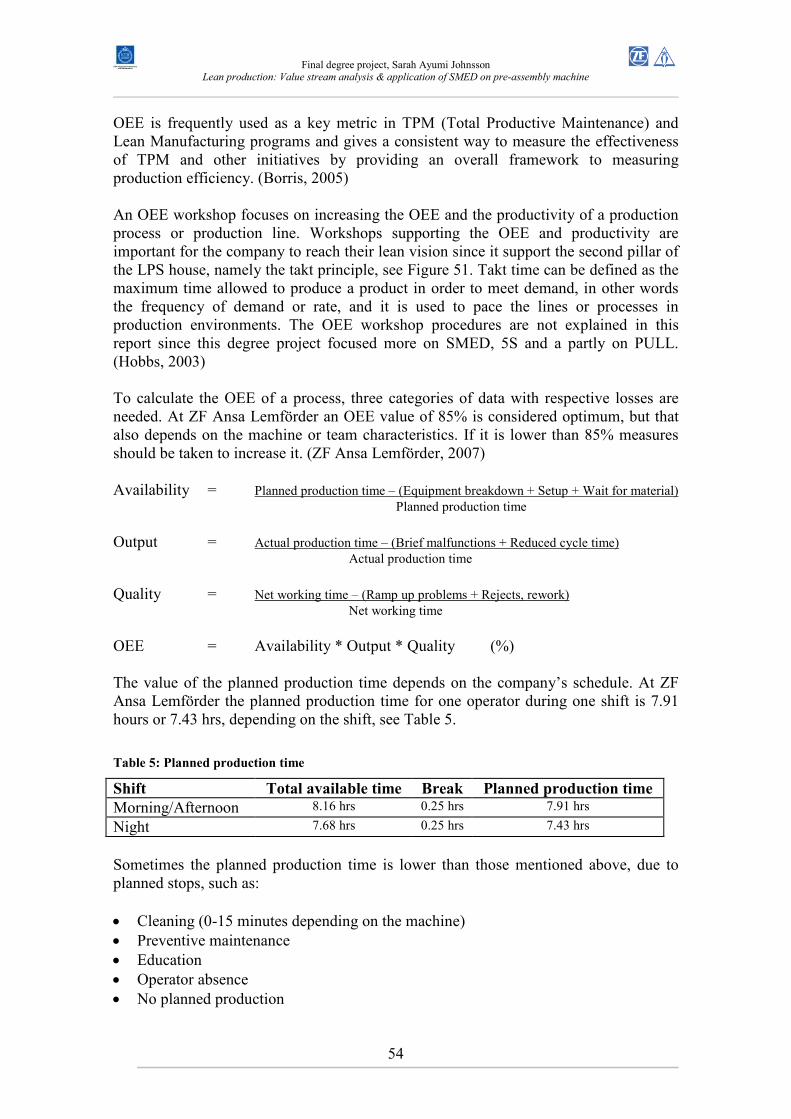
Final degree project, Sarah Ayumi Johnsson
Lean production: Value stream analysis & application of SMED on pre-assembly machine
54
OEE is frequently used as a key metric in TPM (Total Productive Maintenance) and Lean Manufacturing programs and gives a consistent way to measure the effectiveness of TPM and other initiatives by providing an overall framework to measuring production efficiency. (Borris, 2005) An OEE workshop focuses on increasing the OEE and the productivity of a production process or production line. Workshops supporting the OEE and productivity are important for the company to reach their lean vision since it support the second pillar of the LPS house, namely the takt principle, see Figure 51. Takt time can be defined as the maximum time allowed to produce a product in order to meet demand, in other words the frequency of demand or rate, and it is used to pace the lines or processes in production environments. The OEE workshop procedures are not explained in this report since this degree project focused more on SMED, 5S and a partly on PULL. (Hobbs, 2003) To calculate the OEE of a process, three categories of data with respective losses are needed. At ZF Ansa Lemförder an OEE value of 85% is considered optimum, but that also depends on the machine or team characteristics. If it is lower than 85% measures should be taken to increase it. (ZF Ansa Lemförder, 2007) Availability = Planned production time – (Equipment breakdown + Setup + Wait for material) Planned production time Output = Actual production time – (Brief malfunctions + Reduced cycle time) Actual production time Quality = Net working time – (Ramp up problems + Rejects, rework) Net working time OEE = Availability * Output * Quality (%) The value of the planned production time depends on the company’s schedule. At ZF Ansa Lemförder the planned production time for one operator during one shift is 7.91 hours or 7.43 hrs, depending on the shift, see Table 5.
Table 5: Planned production time
Shift Total available time Break Planned production time
Morning/Afternoon 8.16 hrs 0.25 hrs 7.91 hrs
Night 7.68 hrs 0.25 hrs 7.43 hrs
Sometimes the planned production time is lower than those mentioned above, due to planned stops, such as: • Cleaning (0-15 minutes depending on the machine) • Preventive maintenance • Education • Operator absence • No planned production
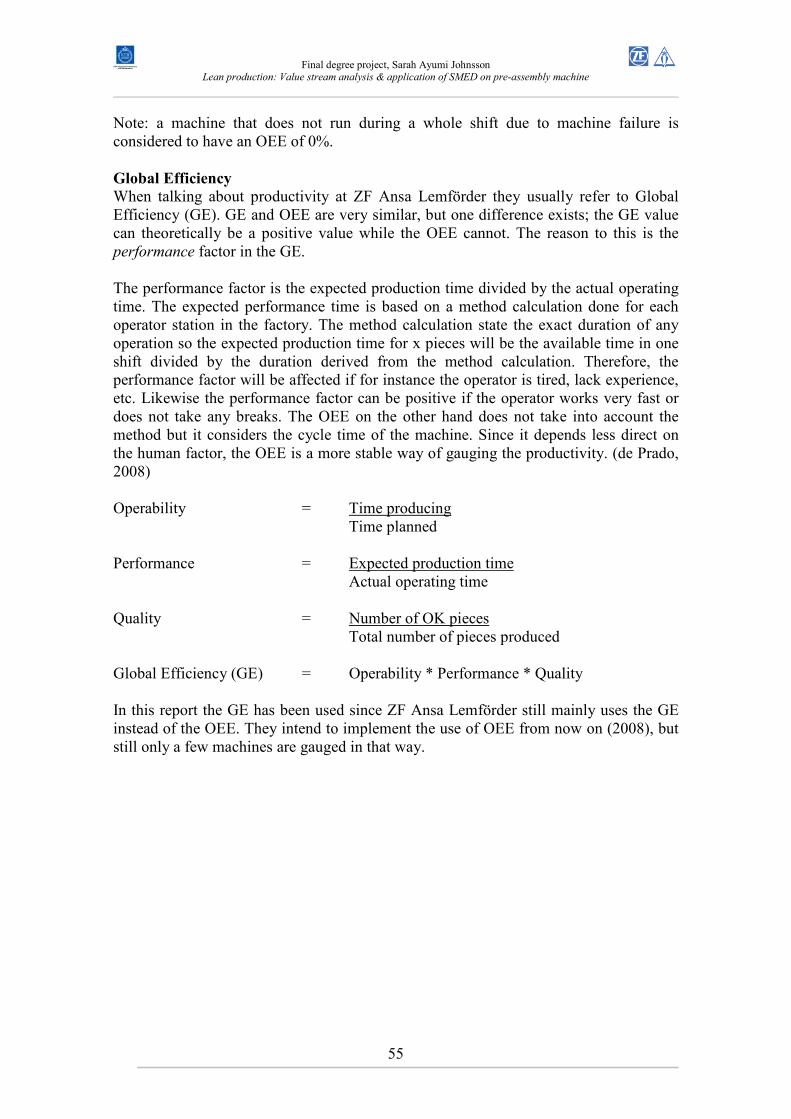
Final degree project, Sarah Ayumi Johnsson
Lean production: Value stream analysis & application of SMED on pre-assembly machine
55
Note: a machine that does not run during a whole shift due to machine failure is considered to have an OEE of 0%. Global Efficiency
When talking about productivity at ZF Ansa Lemförder they usually refer to Global Efficiency (GE). GE and OEE are very similar, but one difference exists; the GE value can theoretically be a positive value while the OEE cannot. The reason to this is the performance factor in the GE. The performance factor is the expected production time divided by the actual operating time. The expected performance time is based on a method calculation done for each operator station in the factory. The method calculation state the exact duration of any operation so the expected production time for x pieces will be the available time in one shift divided by the duration derived from the method calculation. Therefore, the performance factor will be affected if for instance the operator is tired, lack experience, etc. Likewise the performance factor can be positive if the operator works very fast or does not take any breaks. The OEE on the other hand does not take into account the method but it considers the cycle time of the machine. Since it depends less direct on the human factor, the OEE is a more stable way of gauging the productivity. (de Prado, 2008) Operability = Time producing Time planned Performance = Expected production time Actual operating time Quality = Number of OK pieces Total number of pieces produced Global Efficiency (GE) = Operability * Performance * Quality In this report the GE has been used since ZF Ansa Lemförder still mainly uses the GE instead of the OEE. They intend to implement the use of OEE from now on (2008), but still only a few machines are gauged in that way.
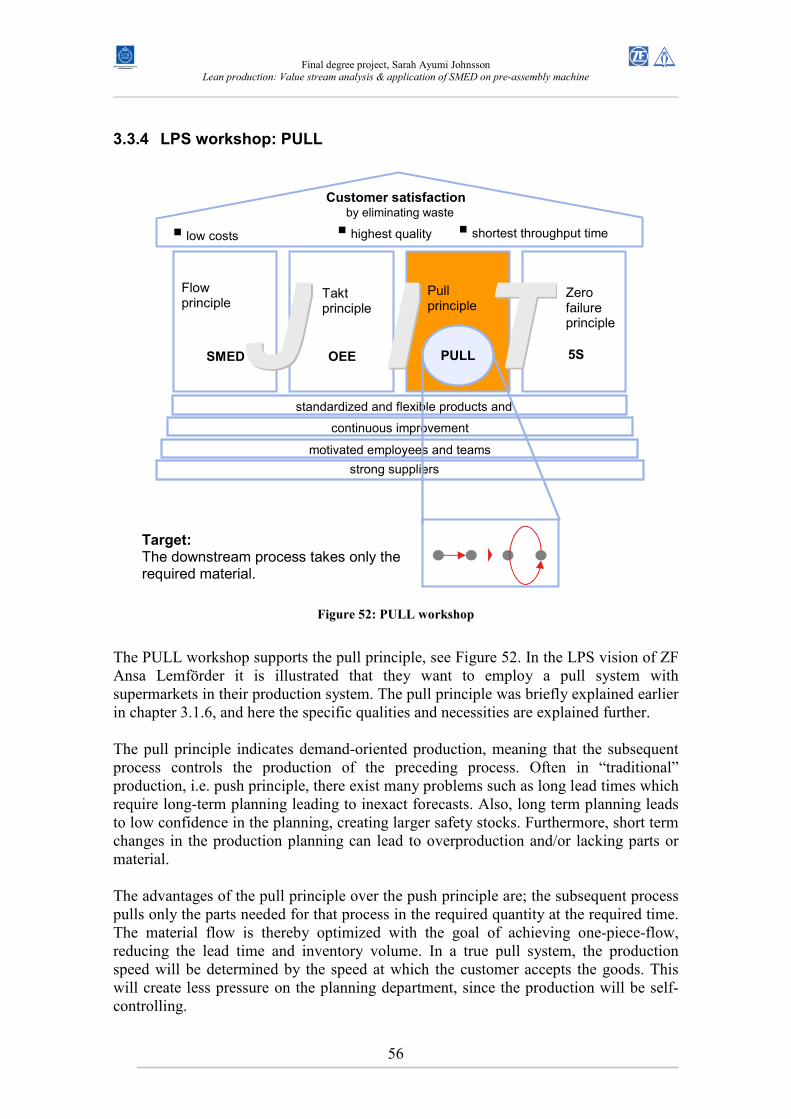
Final degree project, Sarah Ayumi Johnsson
Lean production: Value stream analysis & application of SMED on pre-assembly machine
56
3.3.4 LPS workshop: PULL
Figure 52: PULL workshop
The PULL workshop supports the pull principle, see Figure 52. In the LPS vision of ZF Ansa Lemförder it is illustrated that they want to employ a pull system with supermarkets in their production system. The pull principle was briefly explained earlier in chapter 3.1.6, and here the specific qualities and necessities are explained further. The pull principle indicates demand-oriented production, meaning that the subsequent process controls the production of the preceding process. Often in “traditional” production, i.e. push principle, there exist many problems such as long lead times which require long-term planning leading to inexact forecasts. Also, long term planning leads to low confidence in the planning, creating larger safety stocks. Furthermore, short term changes in the production planning can lead to overproduction and/or lacking parts or material. The advantages of the pull principle over the push principle are; the subsequent process pulls only the parts needed for that process in the required quantity at the required time. The material flow is thereby optimized with the goal of achieving one-piece-flow, reducing the lead time and inventory volume. In a true pull system, the production speed will be determined by the speed at which the customer accepts the goods. This will create less pressure on the planning department, since the production will be self-controlling.
J J I I T T
motivated employees and teams
continuous improvement
standardized and flexible products and
strong suppliers
� highest quality � shortest throughput time
Customer satisfaction by eliminating waste
Takt principle
� low costs
Zero failure principle
Flow principle
Pull principle
SMED OEE PULL 5S
Target: The downstream process takes only the required material.
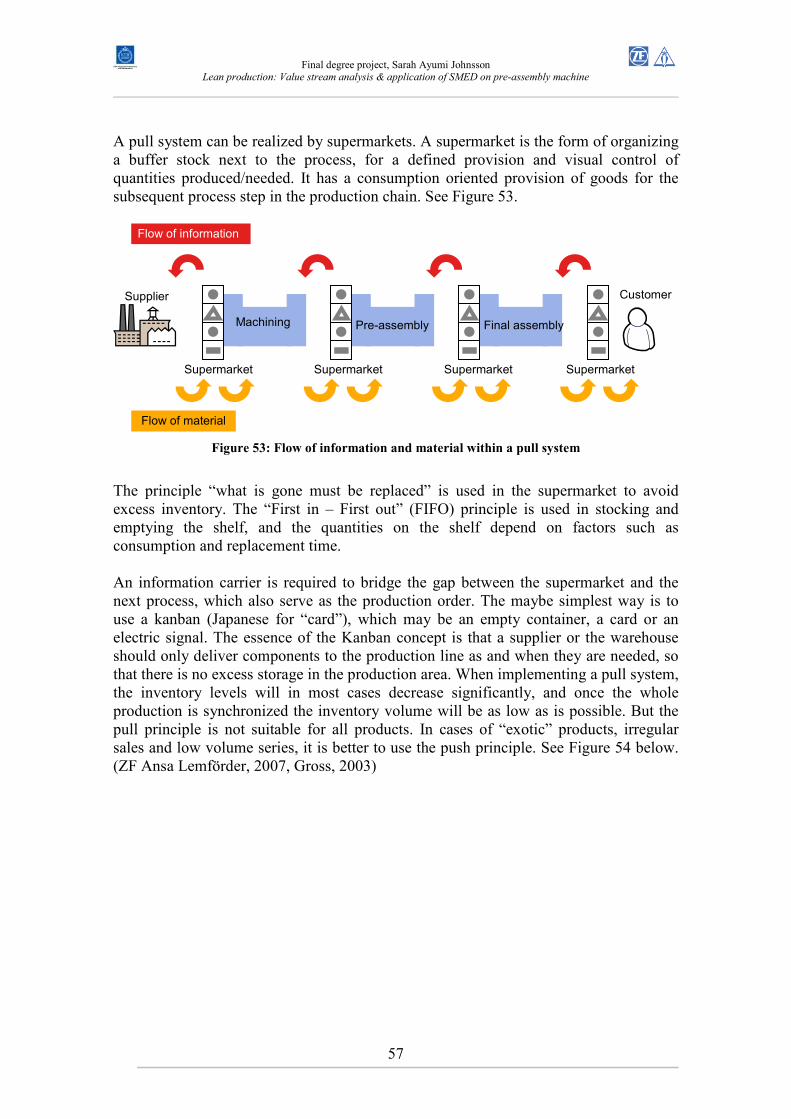
Final degree project, Sarah Ayumi Johnsson
Lean production: Value stream analysis & application of SMED on pre-assembly machine
57
A pull system can be realized by supermarkets. A supermarket is the form of organizing a buffer stock next to the process, for a defined provision and visual control of quantities produced/needed. It has a consumption oriented provision of goods for the subsequent process step in the production chain. See Figure 53.
Figure 53: Flow of information and material within a pull system
The principle “what is gone must be replaced” is used in the supermarket to avoid excess inventory. The “First in – First out” (FIFO) principle is used in stocking and emptying the shelf, and the quantities on the shelf depend on factors such as consumption and replacement time. An information carrier is required to bridge the gap between the supermarket and the next process, which also serve as the production order. The maybe simplest way is to use a kanban (Japanese for “card”), which may be an empty container, a card or an electric signal. The essence of the Kanban concept is that a supplier or the warehouse should only deliver components to the production line as and when they are needed, so that there is no excess storage in the production area. When implementing a pull system, the inventory levels will in most cases decrease significantly, and once the whole production is synchronized the inventory volume will be as low as is possible. But the pull principle is not suitable for all products. In cases of “exotic” products, irregular sales and low volume series, it is better to use the push principle. See Figure 54 below. (ZF Ansa Lemförder, 2007, Gross, 2003)
Supplier Customer
Machining Pre-assembly Final assembly
Flow of information
Flow of material
Supermarket Supermarket Supermarket Supermarket
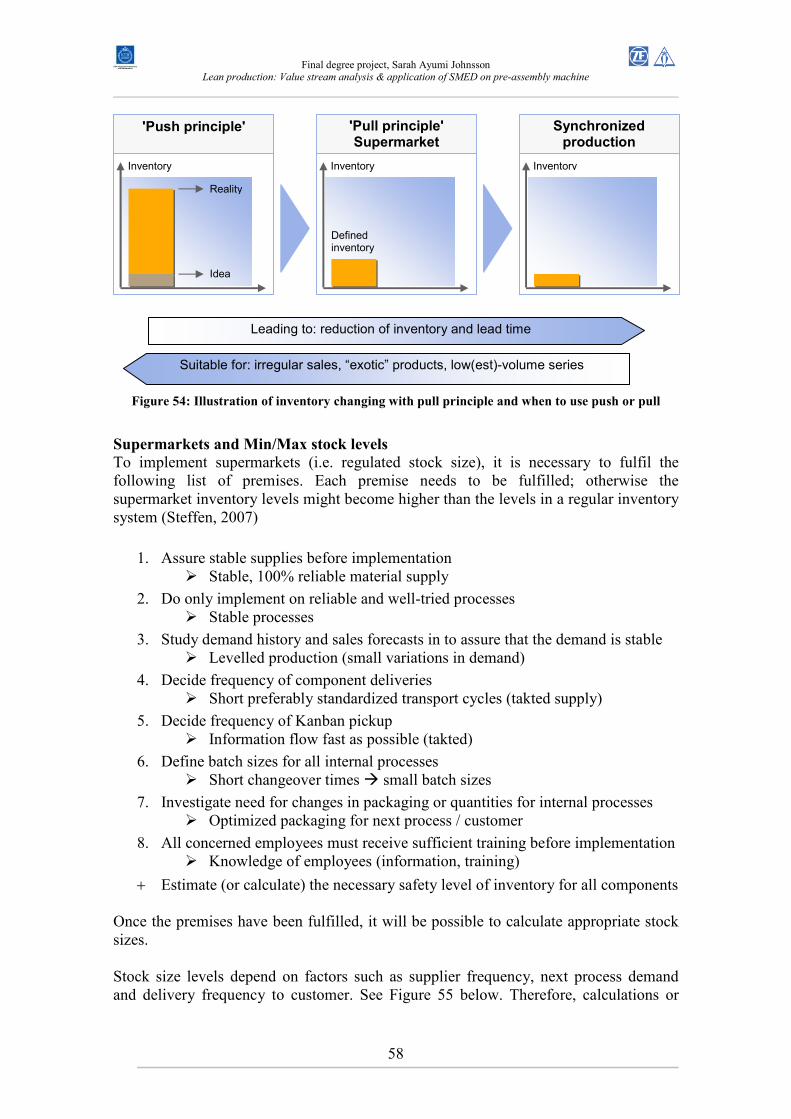
Final degree project, Sarah Ayumi Johnsson
Lean production: Value stream analysis & application of SMED on pre-assembly machine
58
Figure 54: Illustration of inventory changing with pull principle and when to use push or pull
Supermarkets and Min/Max stock levels
To implement supermarkets (i.e. regulated stock size), it is necessary to fulfil the following list of premises. Each premise needs to be fulfilled; otherwise the supermarket inventory levels might become higher than the levels in a regular inventory system (Steffen, 2007)
1. Assure stable supplies before implementation � Stable, 100% reliable material supply
2. Do only implement on reliable and well-tried processes � Stable processes
3. Study demand history and sales forecasts in to assure that the demand is stable � Levelled production (small variations in demand)
4. Decide frequency of component deliveries � Short preferably standardized transport cycles (takted supply)
5. Decide frequency of Kanban pickup � Information flow fast as possible (takted)
6. Define batch sizes for all internal processes � Short changeover times � small batch sizes
7. Investigate need for changes in packaging or quantities for internal processes � Optimized packaging for next process / customer
8. All concerned employees must receive sufficient training before implementation � Knowledge of employees (information, training)
+ Estimate (or calculate) the necessary safety level of inventory for all components Once the premises have been fulfilled, it will be possible to calculate appropriate stock sizes. Stock size levels depend on factors such as supplier frequency, next process demand and delivery frequency to customer. See Figure 55 below. Therefore, calculations or
'Push principle'
Inventory
Reality
Ideal
'Pull principle' Supermarket
Inventory
Synchronized production
Inventory
Defined inventory in supermarket
Leading to: reduction of inventory and lead time
Suitable for: irregular sales, “exotic” products, low(est)-volume series
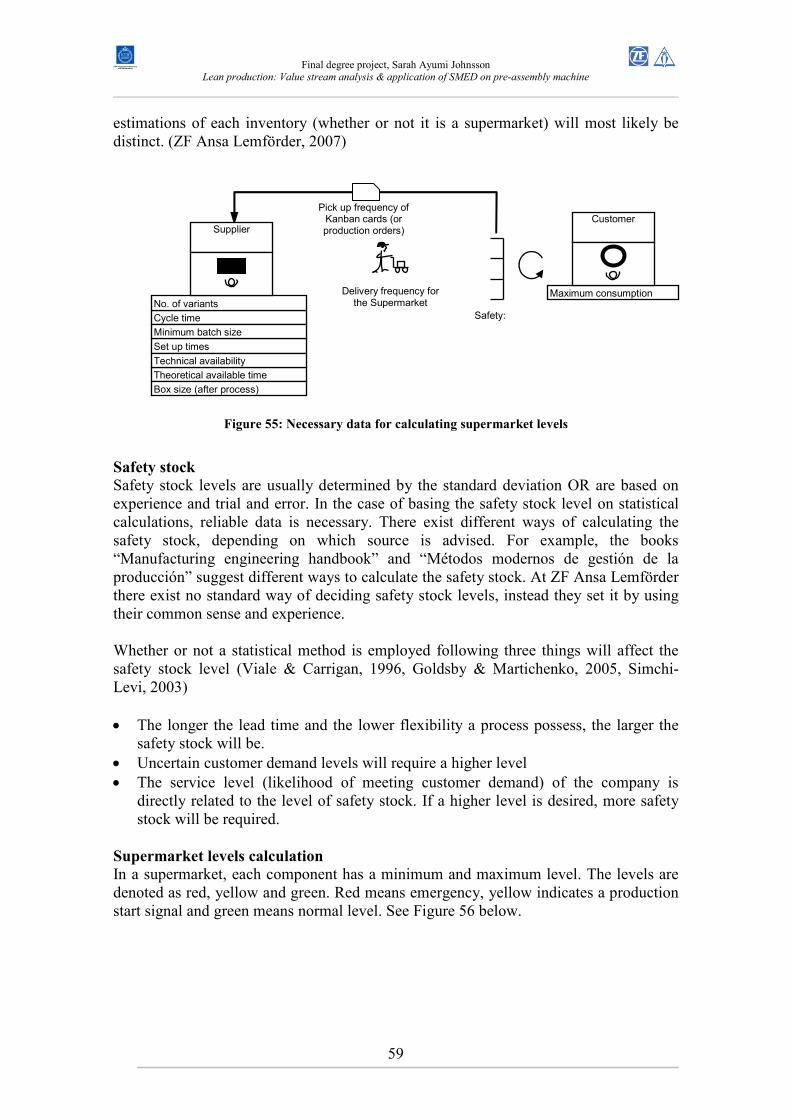
Final degree project, Sarah Ayumi Johnsson
Lean production: Value stream analysis & application of SMED on pre-assembly machine
59
estimations of each inventory (whether or not it is a supermarket) will most likely be distinct. (ZF Ansa Lemförder, 2007)
Figure 55: Necessary data for calculating supermarket levels
Safety stock
Safety stock levels are usually determined by the standard deviation OR are based on experience and trial and error. In the case of basing the safety stock level on statistical calculations, reliable data is necessary. There exist different ways of calculating the safety stock, depending on which source is advised. For example, the books “Manufacturing engineering handbook” and “Métodos modernos de gestión de la producción” suggest different ways to calculate the safety stock. At ZF Ansa Lemförder there exist no standard way of deciding safety stock levels, instead they set it by using their common sense and experience. Whether or not a statistical method is employed following three things will affect the safety stock level (Viale & Carrigan, 1996, Goldsby & Martichenko, 2005, Simchi-Levi, 2003) • The longer the lead time and the lower flexibility a process possess, the larger the
safety stock will be. • Uncertain customer demand levels will require a higher level • The service level (likelihood of meeting customer demand) of the company is
directly related to the level of safety stock. If a higher level is desired, more safety stock will be required.
Supermarket levels calculation
In a supermarket, each component has a minimum and maximum level. The levels are denoted as red, yellow and green. Red means emergency, yellow indicates a production start signal and green means normal level. See Figure 56 below.
Maximum consumption
Set up times
Theoretical available time
Technical availability
Box size (after process)
Cycle time
No. of variants
Delivery frequency for the Supermarket
Pick up frequency of Kanban cards (or production orders) Supplier
Customer
Minimum batch size
Safety:
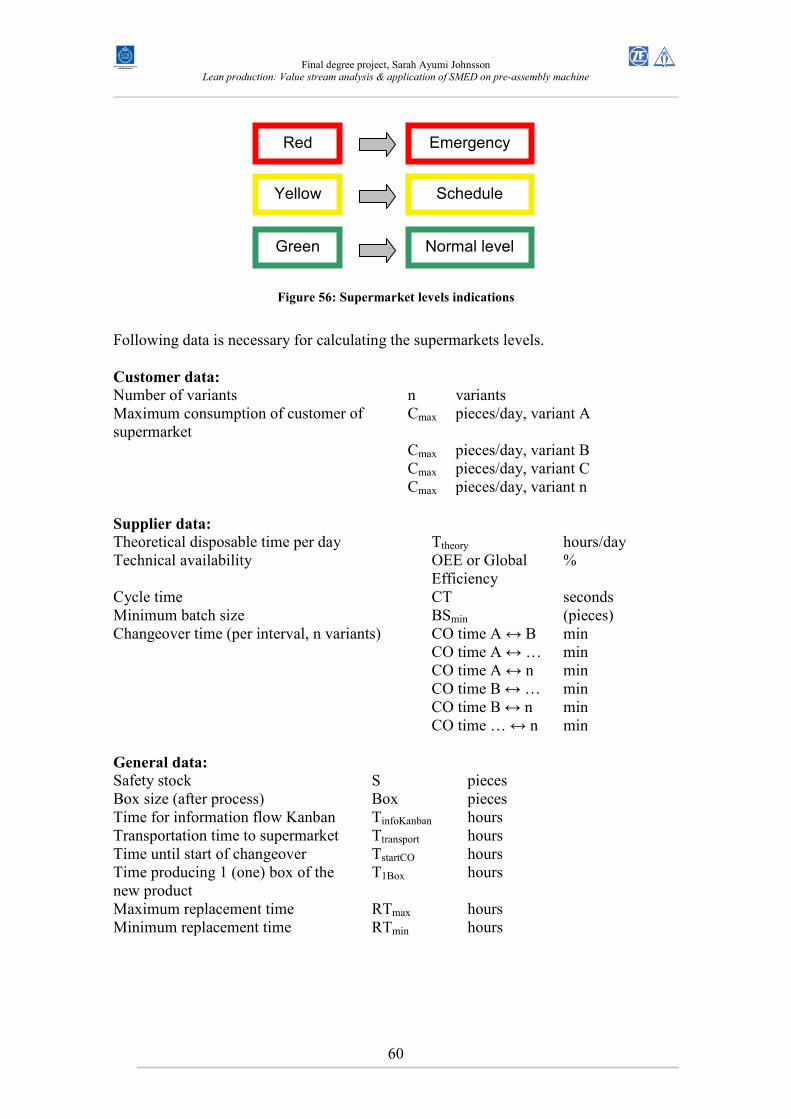
Final degree project, Sarah Ayumi Johnsson
Lean production: Value stream analysis & application of SMED on pre-assembly machine
60
Figure 56: Supermarket levels indications
Following data is necessary for calculating the supermarkets levels. Customer data:
Number of variants n variants Maximum consumption of customer of supermarket
Cmax pieces/day, variant A
Cmax pieces/day, variant B Cmax pieces/day, variant C Cmax pieces/day, variant n Supplier data:
Theoretical disposable time per day Ttheory hours/day Technical availability OEE or Global
Efficiency %
Cycle time CT seconds Minimum batch size BSmin (pieces) Changeover time (per interval, n variants) CO time A ↔ B min CO time A ↔ … min CO time A ↔ n min CO time B ↔ … min CO time B ↔ n min CO time … ↔ n min General data:
Safety stock S pieces Box size (after process) Box pieces Time for information flow Kanban TinfoKanban hours Transportation time to supermarket Ttransport hours Time until start of changeover TstartCO hours Time producing 1 (one) box of the new product
T1Box hours
Maximum replacement time RTmax hours Minimum replacement time RTmin hours
Red
Yellow
Green
Emergency
Schedule signal
Normal level
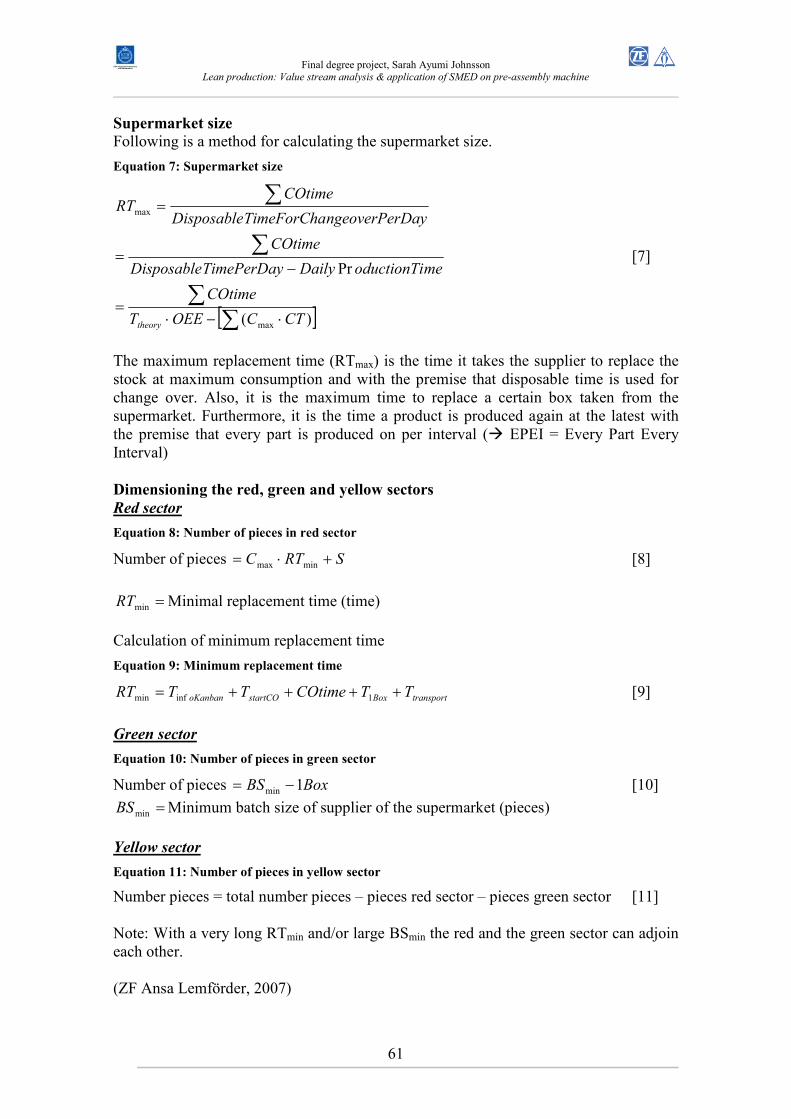
Final degree project, Sarah Ayumi Johnsson
Lean production: Value stream analysis & application of SMED on pre-assembly machine
61
Supermarket size
Following is a method for calculating the supermarket size.
Equation 7: Supermarket size
[ ]∑∑
∑
∑
⋅−⋅=
−=
=
)(
Pr
max
max
CTCOEET
COtime
meoductionTiDailyTimePerDayDisposable
COtime
DayngeoverPerTimeForChaDisposable
COtimeRT
theory
[7]
The maximum replacement time (RTmax) is the time it takes the supplier to replace the stock at maximum consumption and with the premise that disposable time is used for change over. Also, it is the maximum time to replace a certain box taken from the supermarket. Furthermore, it is the time a product is produced again at the latest with the premise that every part is produced on per interval (� EPEI = Every Part Every Interval)
Dimensioning the red, green and yellow sectors
Red sector
Equation 8: Number of pieces in red sector
Number of pieces SRTC +⋅= minmax [8]
=minRT Minimal replacement time (time)
Calculation of minimum replacement time
Equation 9: Minimum replacement time
transportBoxstartCOoKanban TTCOtimeTTRT ++++= 1infmin [9]
Green sector
Equation 10: Number of pieces in green sector
Number of pieces BoxBS 1min −= [10]
=minBS Minimum batch size of supplier of the supermarket (pieces) Yellow sector
Equation 11: Number of pieces in yellow sector
Number pieces = total number pieces – pieces red sector – pieces green sector [11] Note: With a very long RTmin and/or large BSmin the red and the green sector can adjoin each other. (ZF Ansa Lemförder, 2007)
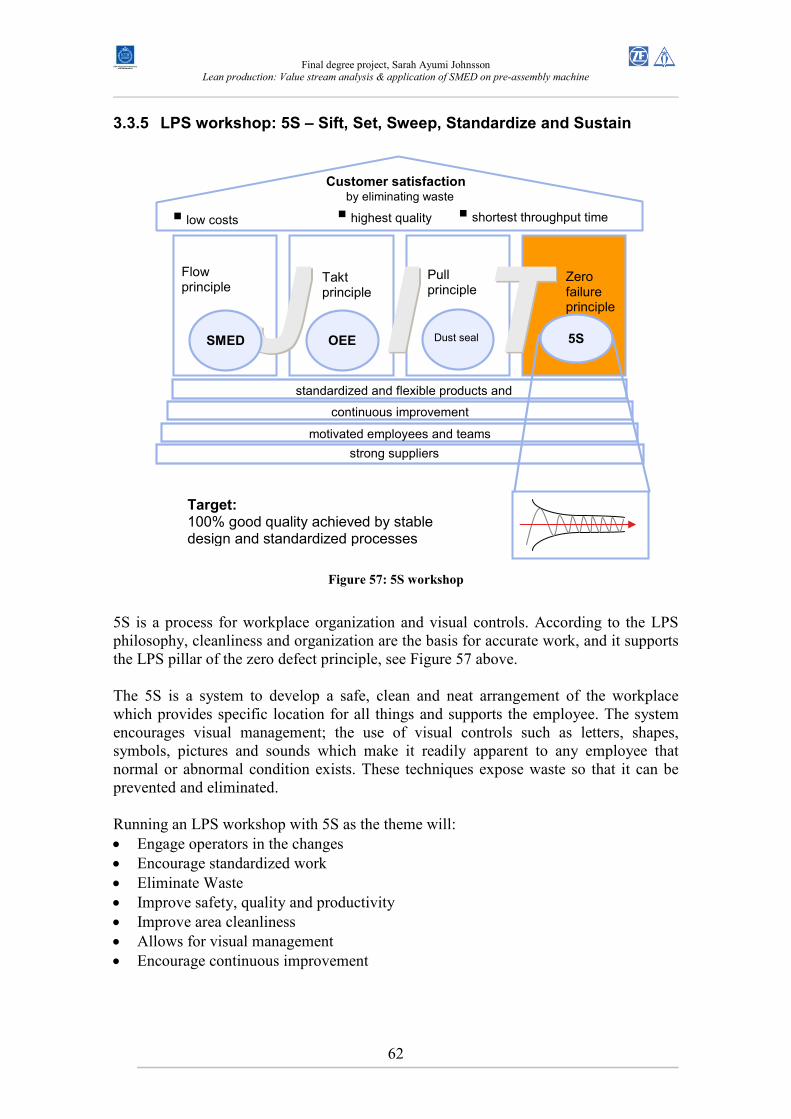
Final degree project, Sarah Ayumi Johnsson
Lean production: Value stream analysis & application of SMED on pre-assembly machine
62
3.3.5 LPS workshop: 5S – Sift, Set, Sweep, Standardize and Sustain
Figure 57: 5S workshop
5S is a process for workplace organization and visual controls. According to the LPS philosophy, cleanliness and organization are the basis for accurate work, and it supports the LPS pillar of the zero defect principle, see Figure 57 above. The 5S is a system to develop a safe, clean and neat arrangement of the workplace which provides specific location for all things and supports the employee. The system encourages visual management; the use of visual controls such as letters, shapes, symbols, pictures and sounds which make it readily apparent to any employee that normal or abnormal condition exists. These techniques expose waste so that it can be prevented and eliminated. Running an LPS workshop with 5S as the theme will: • Engage operators in the changes • Encourage standardized work • Eliminate Waste • Improve safety, quality and productivity • Improve area cleanliness • Allows for visual management • Encourage continuous improvement
J J I I T T
motivated employees and teams
continuous improvement
standardized and flexible products and
strong suppliers
� highest quality � shortest throughput time
Customer satisfaction by eliminating waste
Takt principle
� low costs
Zero failure principle
Flow principle
Pull principle
SMED OEE Dust seal 5S
Target: 100% good quality achieved by stable design and standardized processes
Final degree project, Sarah Ayumi Johnsson
Lean production: Value stream analysis & application of SMED on pre-assembly machine
63
The expected results from a 5S workshop are: • Quantitative results:
� Reduction of time for searching � Minimizing of inventory of tools and utilities � Error prevention � Reduction of space consumption
• Qualitative results: � Improvement of safety � Increasing transparency of processes � Increasing capabilities
To be able to eliminate waste, we need a common definition of what it is and a way to measure it. Also it is needed to make sure it is not only done reactively, but as a continuous improvement which will be standardized. As a reminder, the seven types of waste are listed below: Overproduction More than customer demand or faster than needed Inventory Parts in excess of just in time Distance Unnecessary distances Transport Excessive transporting of material Waiting Idle time, waiting on: machines, parts, people, information Defects Repair, scrap, inspection Space Inappropriate layout The procedure for eliminating the waste contains 5 steps and in the original language of the LPS philosophy, Japanese, the name of each step begins with an S, thereof the expression 5S. Conveniently, there are similar words in English beginning with S, but the translation differs depending on the source. Following are the five original words together with translations.
1. Seiri = Sift or clear 2. Seiton = Set in order or organize 3. Seiso = Sweep or shine or clean 4. Seiketsu = Standardize 5. Shitsuke = Sustain
The main aims of each step are listed in Figure 58 below.
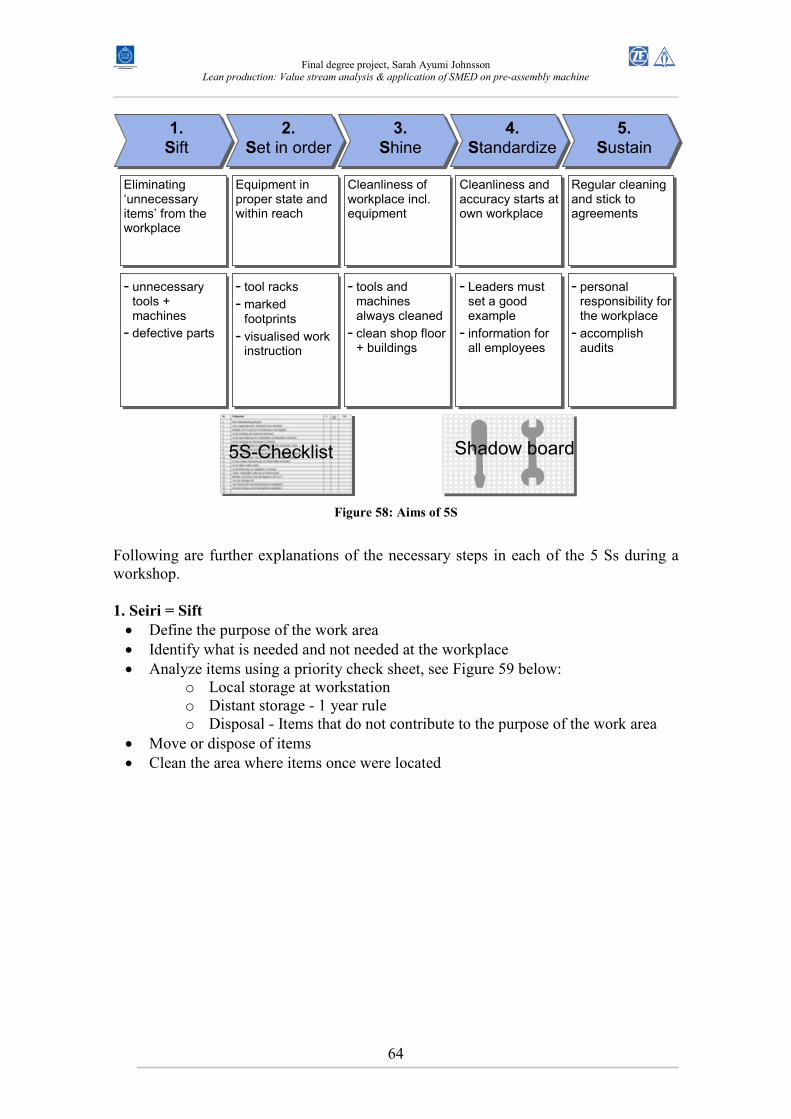
Final degree project, Sarah Ayumi Johnsson
Lean production: Value stream analysis & application of SMED on pre-assembly machine
64
Figure 58: Aims of 5S
Following are further explanations of the necessary steps in each of the 5 Ss during a workshop. 1. Seiri = Sift
• Define the purpose of the work area • Identify what is needed and not needed at the workplace • Analyze items using a priority check sheet, see Figure 59 below:
o Local storage at workstation o Distant storage - 1 year rule o Disposal - Items that do not contribute to the purpose of the work area
• Move or dispose of items • Clean the area where items once were located
1.
Sift
2.
Set in order
3.
Shine
4.
Standardize
5.
Sustain
Eliminating ‘unnecessary items’ from the workplace
Equipment in proper state and within reach
Cleanliness of workplace incl. equipment
Cleanliness and accuracy starts at own workplace
Regular cleaning and stick to agreements
- unnecessary tools + machines
- defective parts
- tool racks - marked footprints
- visualised work instruction
- tools and machines always cleaned
- clean shop floor + buildings
- Leaders must set a good example
- information for all employees
- personal responsibility for the workplace
- accomplish audits
5S-Checklist Shadow board
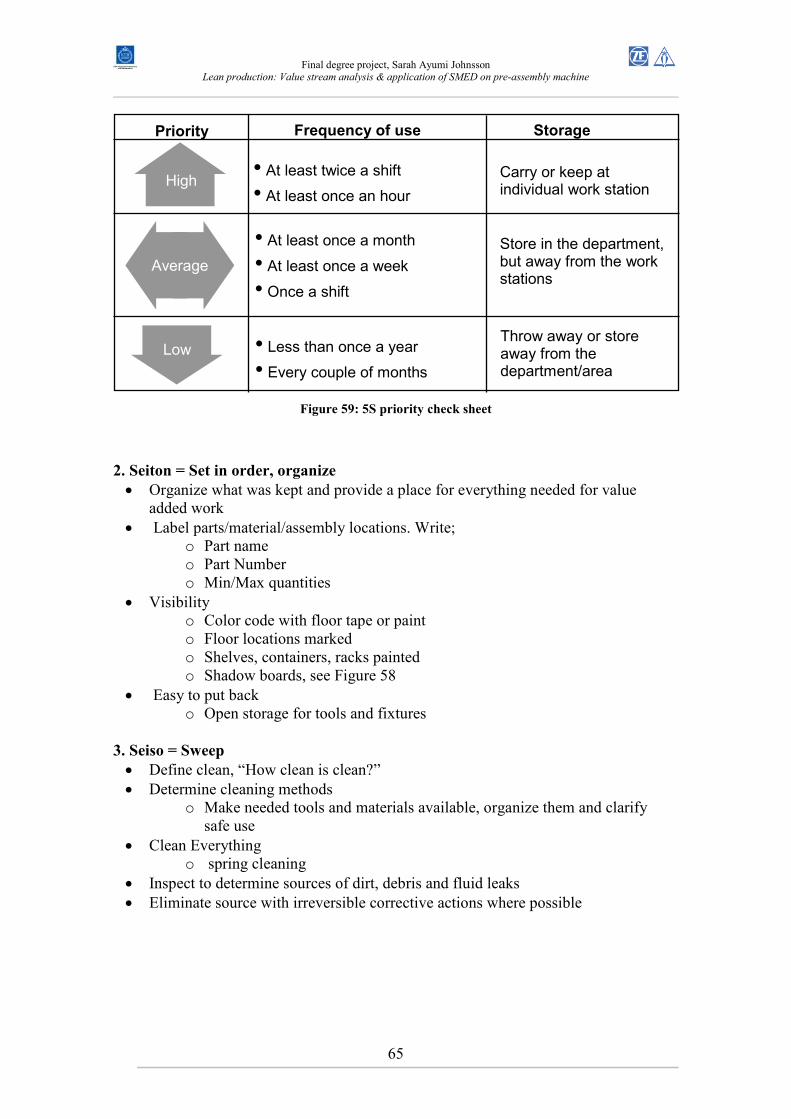
Final degree project, Sarah Ayumi Johnsson
Lean production: Value stream analysis & application of SMED on pre-assembly machine
65
Figure 59: 5S priority check sheet
2. Seiton = Set in order, organize
• Organize what was kept and provide a place for everything needed for value added work
• Label parts/material/assembly locations. Write; o Part name o Part Number o Min/Max quantities
• Visibility o Color code with floor tape or paint o Floor locations marked o Shelves, containers, racks painted o Shadow boards, see Figure 58
• Easy to put back o Open storage for tools and fixtures
3. Seiso = Sweep
• Define clean, “How clean is clean?” • Determine cleaning methods
o Make needed tools and materials available, organize them and clarify safe use
• Clean Everything o spring cleaning
• Inspect to determine sources of dirt, debris and fluid leaks • Eliminate source with irreversible corrective actions where possible
Priority Frequency of use Storage
Low • Less than once a year • Every couple of months
Throw away or store away from the department/area
Average
• At least once a month • At least once a week • Once a shift
Store in the department, but away from the work stations
High • At least twice a shift • At least once an hour
Carry or keep at individual work station
Final degree project, Sarah Ayumi Johnsson
Lean production: Value stream analysis & application of SMED on pre-assembly machine
66
4. Seiketsu = Standardize
The standardization helps in maintaining the first 3 S's. • Map area into zones; assign responsibilities; develop schedule and display it • Create procedures, guidelines, steps, standards • Workplace organization audits • Establish visual controls:
o Maintains organization o Serve as reminders o Are quickly and easily recognized o Colors, symbols, pictures, letters, sounds o Makes it easy to see if things are running the way they are supposed to
be o Helps to identify when assistance is needed
5. Shitsuke = Sustain
• Eliminate the source of waste • Following 5S becomes the standard way to work • Continued training (share knowledge, ideas) • Establish 5S communication item within area information center
o before and after photos o recent audit results
(ZF Ansa Lemförder, 2007)
3.3.6 LPS workshop: Self Control
Another LPS workshop theme is self-control. It supports the pillar of the flow principle, see Figure 24 in chapter 3.1.6 and it focus primarily on eliminating the waste of movements and waiting. Many manufacturing processes at ZF Ansa Lemförder require a quality check after changeovers or change of lot number. This quality control is usually performed by the personnel from the quality department, so the operator needs to go look for the right person to control the product before continuing the production. Sometimes the quality control person is busy so the operator either has to wait or go look for someone else. This is a time consuming procedure which interrupt the flow of production, since while going around the plant looking for someone production time is lost. This procedure can be avoided by implementing self-control, meaning that the operator himself or herself controls the products. This requires that the operators receive the appropriate training as well as an investment in control stations with the proper equipment. (Guerrero, 2007) The procedure for implementing self-control at ZF Ansa Lemförder is not further explained in this report since there still do not exist examples or instructions of how to implement it.

Final degree project, Sarah Ayumi Johnsson
Lean production: Value stream analysis & application of SMED on pre-assembly machine
67
3.3.7 Other LPS workshops
It is possible to execute workshops in other areas than on the production floor, which is rarely done at ZF Ansa Lemförder but it has been done. For instance they did one workshop at one of their suppliers with the theme of making a value stream analysis in order to see where in their process they could work make improvements. Also, at other Lemförder group companies they have held workshops for the product development processes. (Guerrero, 2007)
Final degree project, Sarah Ayumi Johnsson
Lean production: Value stream analysis & application of SMED on pre-assembly machine
68
4 PRE-STUDY - LPS practice workshop: SMED and 5S in BTB machine 928
As a part of the pre-study the student participated in a SMED workshop. The aim was to learn the LPS workshop procedures.
4.1 Theme and objective
The theme of this LPS workshop was time reduction and simplification of changeover as well as improvement of the state of the order and cleanliness. The objective was to reduce the changeover time by 50%, decrease the walk distances by 70% and improve the order and cleanliness at the workplace.
4.2 Method and schedule
The workshop was carried out during seven days in accordance to the eight phases of a typical LPS workshop, see Figure 17 in chapter 0. What was completed during each phase is explained further on, together with a part called “important points”. The important points are matters which the student should keep in mind when organizing and implementing an LPS workshop, and they are based on interviews with the LPS coordinator (Guerrero, 2007) All LPS workshops are held in the LPS room at ZF Ansa Lemförder and so was this workshop. The schedule was planned in advance by the LPS workshop coordinator, but some activities were rescheduled to fit with the schedule of production changeovers, see schedule Figure 60.
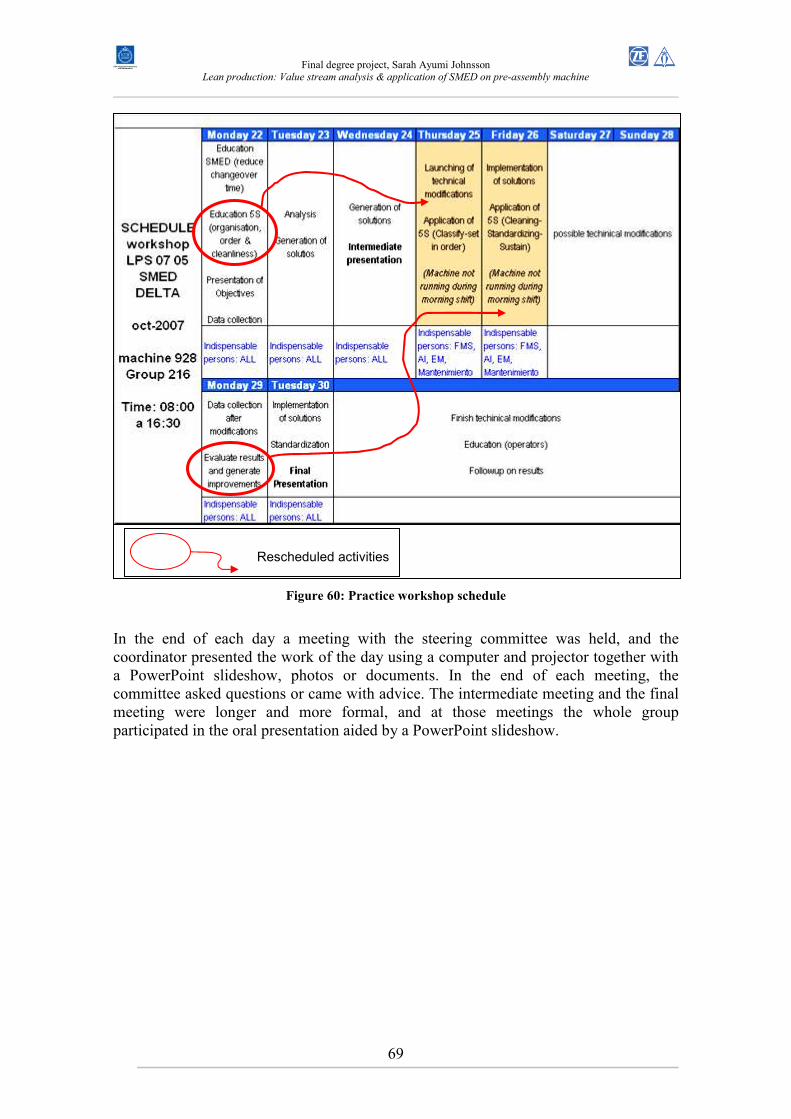
Final degree project, Sarah Ayumi Johnsson
Lean production: Value stream analysis & application of SMED on pre-assembly machine
69
Figure 60: Practice workshop schedule
In the end of each day a meeting with the steering committee was held, and the coordinator presented the work of the day using a computer and projector together with a PowerPoint slideshow, photos or documents. In the end of each meeting, the committee asked questions or came with advice. The intermediate meeting and the final meeting were longer and more formal, and at those meetings the whole group participated in the oral presentation aided by a PowerPoint slideshow.
Rescheduled activities
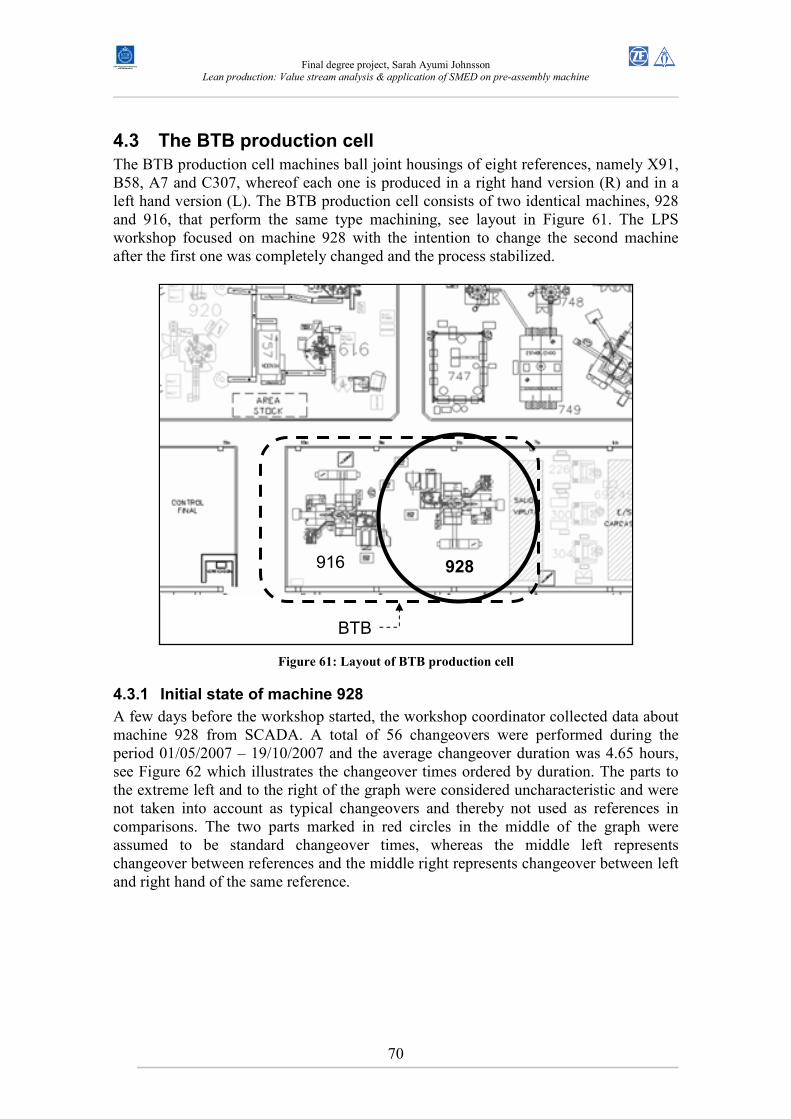
Final degree project, Sarah Ayumi Johnsson
Lean production: Value stream analysis & application of SMED on pre-assembly machine
70
4.3 The BTB production cell
The BTB production cell machines ball joint housings of eight references, namely X91, B58, A7 and C307, whereof each one is produced in a right hand version (R) and in a left hand version (L). The BTB production cell consists of two identical machines, 928 and 916, that perform the same type machining, see layout in Figure 61. The LPS workshop focused on machine 928 with the intention to change the second machine after the first one was completely changed and the process stabilized.
Figure 61: Layout of BTB production cell
4.3.1 Initial state of machine 928
A few days before the workshop started, the workshop coordinator collected data about machine 928 from SCADA. A total of 56 changeovers were performed during the period 01/05/2007 – 19/10/2007 and the average changeover duration was 4.65 hours, see Figure 62 which illustrates the changeover times ordered by duration. The parts to the extreme left and to the right of the graph were considered uncharacteristic and were not taken into account as typical changeovers and thereby not used as references in comparisons. The two parts marked in red circles in the middle of the graph were assumed to be standard changeover times, whereas the middle left represents changeover between references and the middle right represents changeover between left and right hand of the same reference.
928 916
BTB
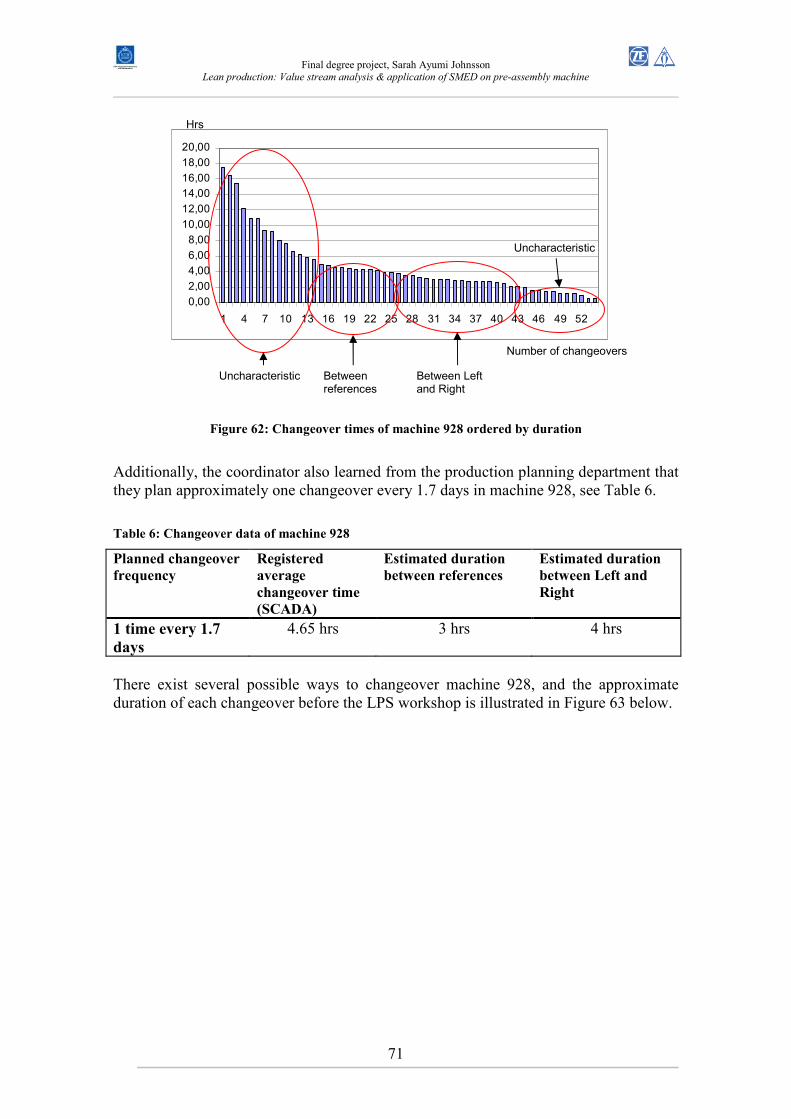
Final degree project, Sarah Ayumi Johnsson
Lean production: Value stream analysis & application of SMED on pre-assembly machine
71
Figure 62: Changeover times of machine 928 ordered by duration
Additionally, the coordinator also learned from the production planning department that they plan approximately one changeover every 1.7 days in machine 928, see Table 6.
Table 6: Changeover data of machine 928
Planned changeover
frequency
Registered
average
changeover time
(SCADA)
Estimated duration
between references
Estimated duration
between Left and
Right
1 time every 1.7
days
4.65 hrs 3 hrs 4 hrs
There exist several possible ways to changeover machine 928, and the approximate duration of each changeover before the LPS workshop is illustrated in Figure 63 below.
0,00
2,00
4,00
6,00
8,00
10,00
12,00
14,00
16,00
18,00
20,00
1 4 7 10 13 16 19 22 25 28 31 34 37 40 43 46 49 52
Uncharacteristic
Uncharacteristic
Between references
Between Left and Right
Hrs
Number of changeovers
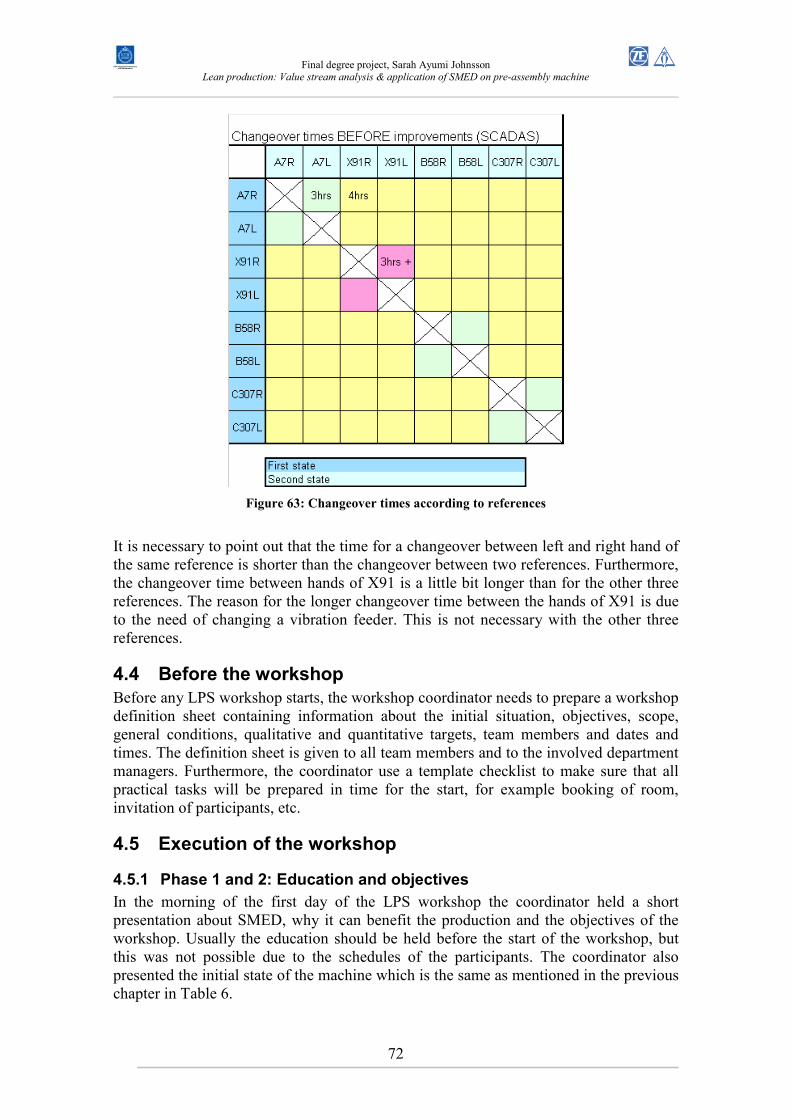
Final degree project, Sarah Ayumi Johnsson
Lean production: Value stream analysis & application of SMED on pre-assembly machine
72
Figure 63: Changeover times according to references
It is necessary to point out that the time for a changeover between left and right hand of the same reference is shorter than the changeover between two references. Furthermore, the changeover time between hands of X91 is a little bit longer than for the other three references. The reason for the longer changeover time between the hands of X91 is due to the need of changing a vibration feeder. This is not necessary with the other three references.
4.4 Before the workshop
Before any LPS workshop starts, the workshop coordinator needs to prepare a workshop definition sheet containing information about the initial situation, objectives, scope, general conditions, qualitative and quantitative targets, team members and dates and times. The definition sheet is given to all team members and to the involved department managers. Furthermore, the coordinator use a template checklist to make sure that all practical tasks will be prepared in time for the start, for example booking of room, invitation of participants, etc.
4.5 Execution of the workshop
4.5.1 Phase 1 and 2: Education and objectives
In the morning of the first day of the LPS workshop the coordinator held a short presentation about SMED, why it can benefit the production and the objectives of the workshop. Usually the education should be held before the start of the workshop, but this was not possible due to the schedules of the participants. The coordinator also presented the initial state of the machine which is the same as mentioned in the previous chapter in Table 6.
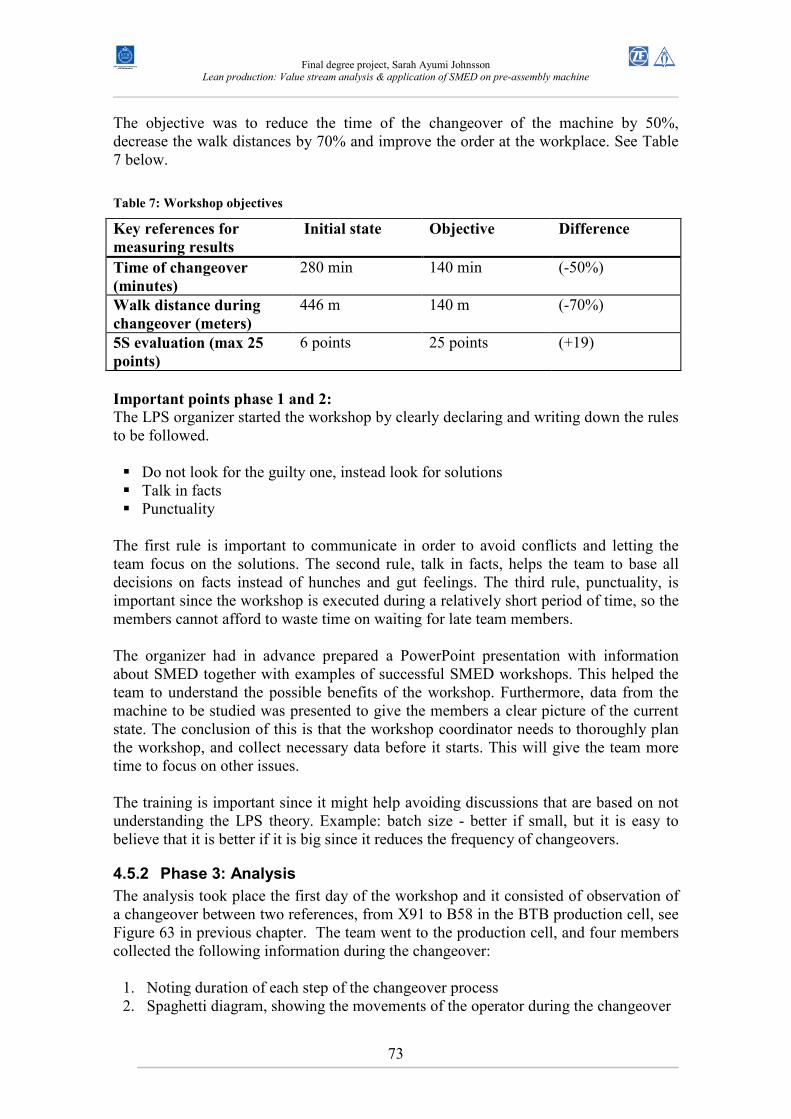
Final degree project, Sarah Ayumi Johnsson
Lean production: Value stream analysis & application of SMED on pre-assembly machine
73
The objective was to reduce the time of the changeover of the machine by 50%, decrease the walk distances by 70% and improve the order at the workplace. See Table 7 below.
Table 7: Workshop objectives
Key references for
measuring results
Initial state Objective Difference
Time of changeover
(minutes)
280 min 140 min (-50%)
Walk distance during
changeover (meters)
446 m 140 m (-70%)
5S evaluation (max 25
points)
6 points 25 points (+19)
Important points phase 1 and 2:
The LPS organizer started the workshop by clearly declaring and writing down the rules to be followed. � Do not look for the guilty one, instead look for solutions � Talk in facts � Punctuality
The first rule is important to communicate in order to avoid conflicts and letting the team focus on the solutions. The second rule, talk in facts, helps the team to base all decisions on facts instead of hunches and gut feelings. The third rule, punctuality, is important since the workshop is executed during a relatively short period of time, so the members cannot afford to waste time on waiting for late team members. The organizer had in advance prepared a PowerPoint presentation with information about SMED together with examples of successful SMED workshops. This helped the team to understand the possible benefits of the workshop. Furthermore, data from the machine to be studied was presented to give the members a clear picture of the current state. The conclusion of this is that the workshop coordinator needs to thoroughly plan the workshop, and collect necessary data before it starts. This will give the team more time to focus on other issues. The training is important since it might help avoiding discussions that are based on not understanding the LPS theory. Example: batch size - better if small, but it is easy to believe that it is better if it is big since it reduces the frequency of changeovers.
4.5.2 Phase 3: Analysis
The analysis took place the first day of the workshop and it consisted of observation of a changeover between two references, from X91 to B58 in the BTB production cell, see Figure 63 in previous chapter. The team went to the production cell, and four members collected the following information during the changeover:
1. Noting duration of each step of the changeover process 2. Spaghetti diagram, showing the movements of the operator during the changeover
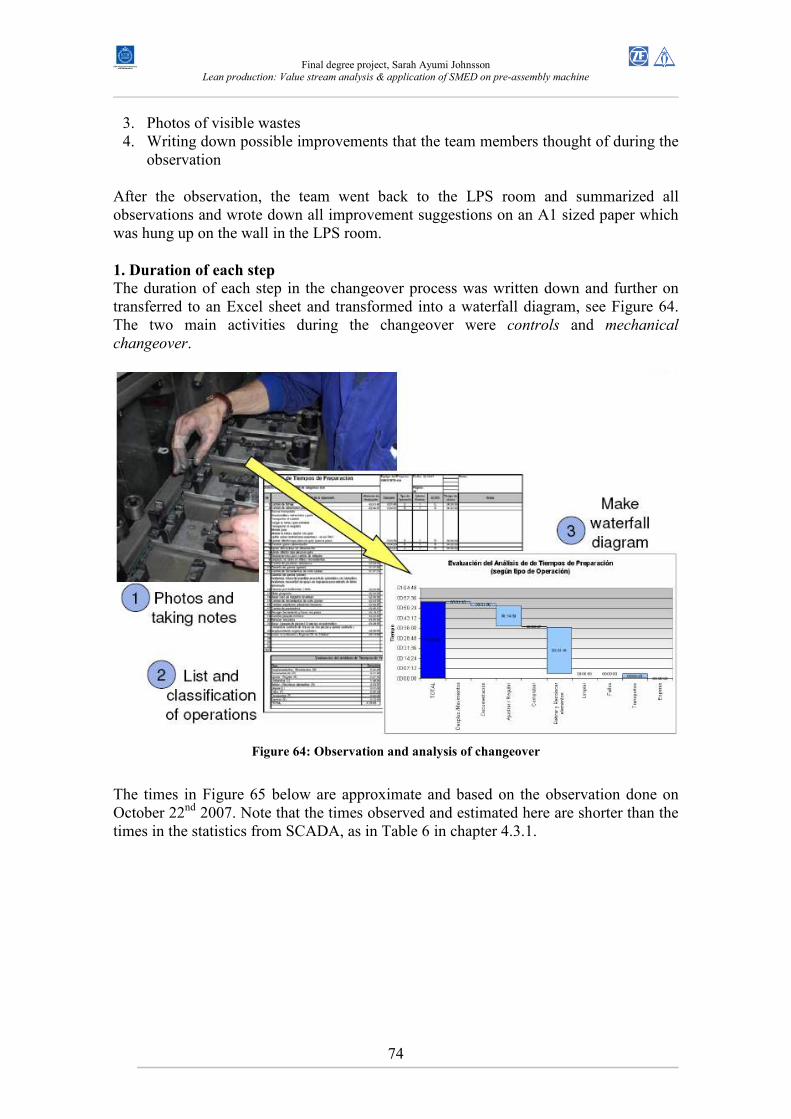
Final degree project, Sarah Ayumi Johnsson
Lean production: Value stream analysis & application of SMED on pre-assembly machine
74
3. Photos of visible wastes 4. Writing down possible improvements that the team members thought of during the
observation After the observation, the team went back to the LPS room and summarized all observations and wrote down all improvement suggestions on an A1 sized paper which was hung up on the wall in the LPS room. 1. Duration of each step
The duration of each step in the changeover process was written down and further on transferred to an Excel sheet and transformed into a waterfall diagram, see Figure 64. The two main activities during the changeover were controls and mechanical changeover.
Figure 64: Observation and analysis of changeover
The times in Figure 65 below are approximate and based on the observation done on October 22nd 2007. Note that the times observed and estimated here are shorter than the times in the statistics from SCADA, as in Table 6 in chapter 4.3.1.
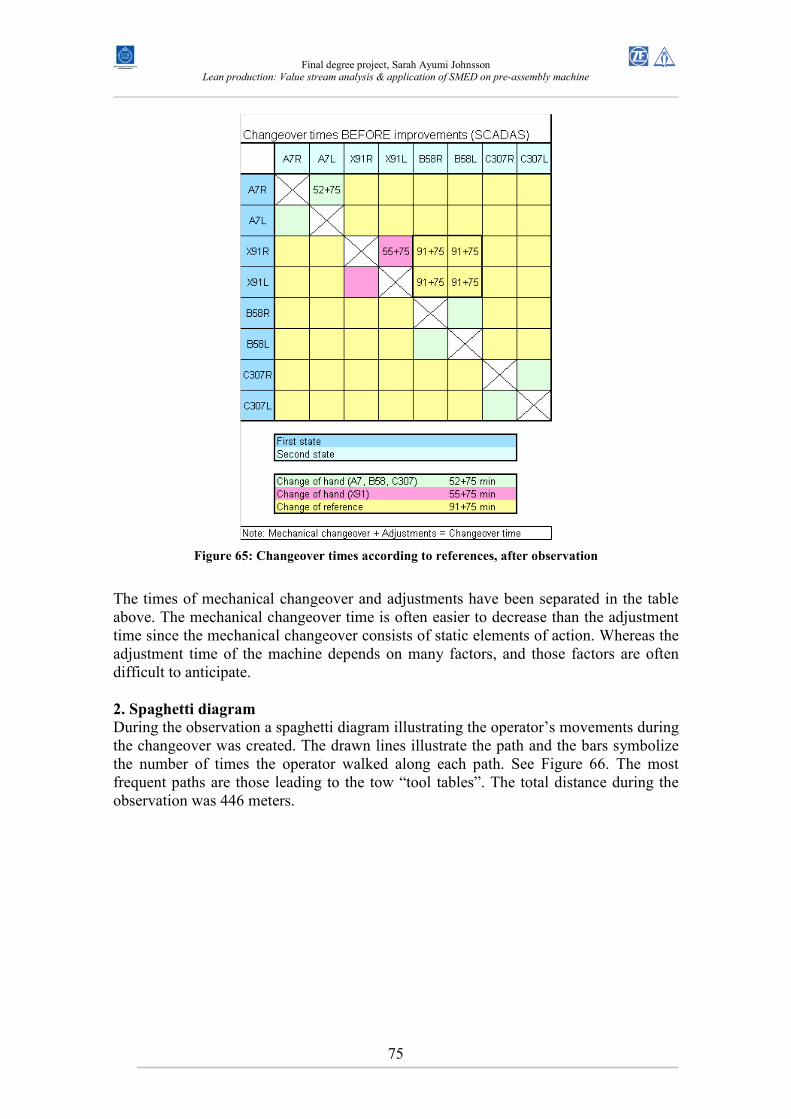
Final degree project, Sarah Ayumi Johnsson
Lean production: Value stream analysis & application of SMED on pre-assembly machine
75
Figure 65: Changeover times according to references, after observation
The times of mechanical changeover and adjustments have been separated in the table above. The mechanical changeover time is often easier to decrease than the adjustment time since the mechanical changeover consists of static elements of action. Whereas the adjustment time of the machine depends on many factors, and those factors are often difficult to anticipate. 2. Spaghetti diagram
During the observation a spaghetti diagram illustrating the operator’s movements during the changeover was created. The drawn lines illustrate the path and the bars symbolize the number of times the operator walked along each path. See Figure 66. The most frequent paths are those leading to the tow “tool tables”. The total distance during the observation was 446 meters.
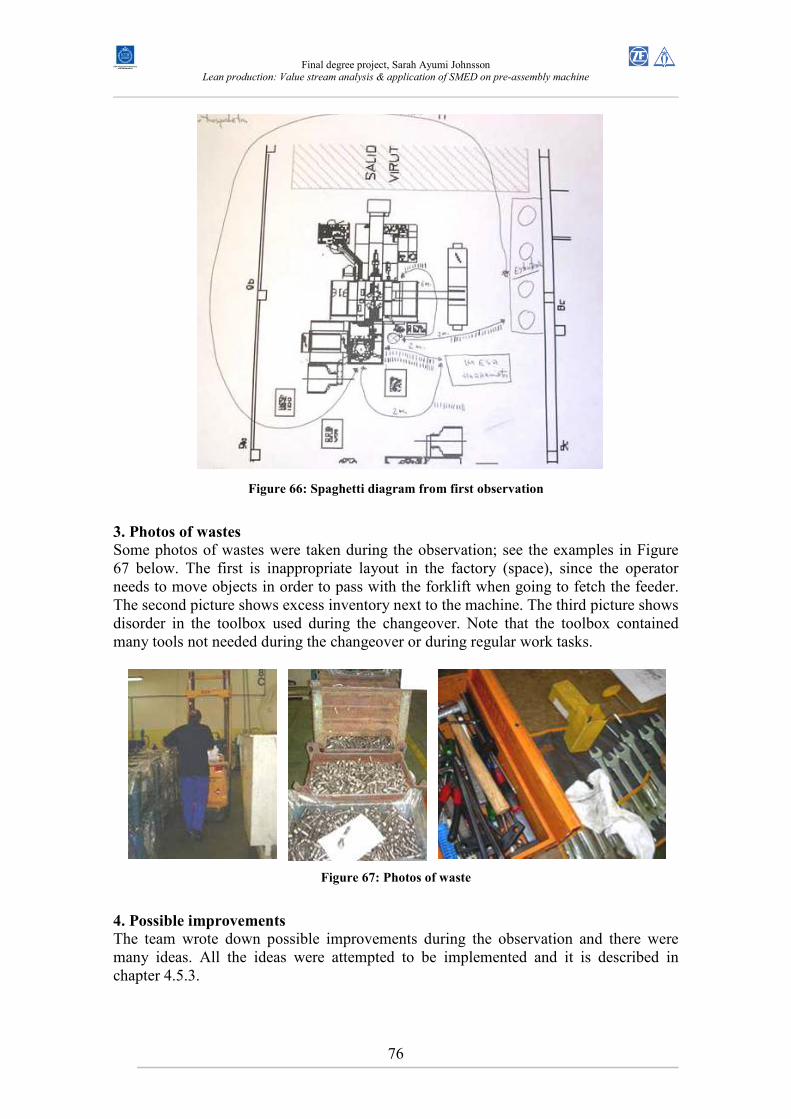
Final degree project, Sarah Ayumi Johnsson
Lean production: Value stream analysis & application of SMED on pre-assembly machine
76
Figure 66: Spaghetti diagram from first observation
3. Photos of wastes
Some photos of wastes were taken during the observation; see the examples in Figure 67 below. The first is inappropriate layout in the factory (space), since the operator needs to move objects in order to pass with the forklift when going to fetch the feeder. The second picture shows excess inventory next to the machine. The third picture shows disorder in the toolbox used during the changeover. Note that the toolbox contained many tools not needed during the changeover or during regular work tasks.
Figure 67: Photos of waste
4. Possible improvements
The team wrote down possible improvements during the observation and there were many ideas. All the ideas were attempted to be implemented and it is described in chapter 4.5.3.
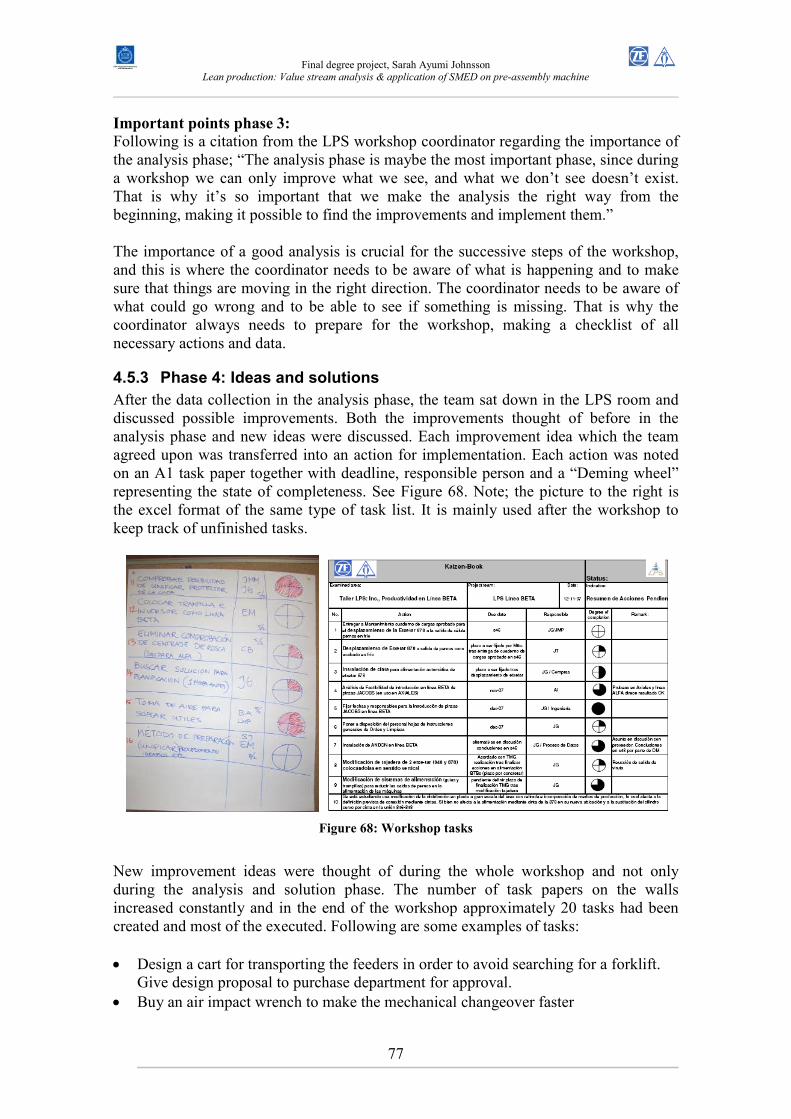
Final degree project, Sarah Ayumi Johnsson
Lean production: Value stream analysis & application of SMED on pre-assembly machine
77
Important points phase 3:
Following is a citation from the LPS workshop coordinator regarding the importance of the analysis phase; “The analysis phase is maybe the most important phase, since during a workshop we can only improve what we see, and what we don’t see doesn’t exist. That is why it’s so important that we make the analysis the right way from the beginning, making it possible to find the improvements and implement them.” The importance of a good analysis is crucial for the successive steps of the workshop, and this is where the coordinator needs to be aware of what is happening and to make sure that things are moving in the right direction. The coordinator needs to be aware of what could go wrong and to be able to see if something is missing. That is why the coordinator always needs to prepare for the workshop, making a checklist of all necessary actions and data.
4.5.3 Phase 4: Ideas and solutions
After the data collection in the analysis phase, the team sat down in the LPS room and discussed possible improvements. Both the improvements thought of before in the analysis phase and new ideas were discussed. Each improvement idea which the team agreed upon was transferred into an action for implementation. Each action was noted on an A1 task paper together with deadline, responsible person and a “Deming wheel” representing the state of completeness. See Figure 68. Note; the picture to the right is the excel format of the same type of task list. It is mainly used after the workshop to keep track of unfinished tasks.
Figure 68: Workshop tasks
New improvement ideas were thought of during the whole workshop and not only during the analysis and solution phase. The number of task papers on the walls increased constantly and in the end of the workshop approximately 20 tasks had been created and most of the executed. Following are some examples of tasks: • Design a cart for transporting the feeders in order to avoid searching for a forklift.
Give design proposal to purchase department for approval. • Buy an air impact wrench to make the mechanical changeover faster
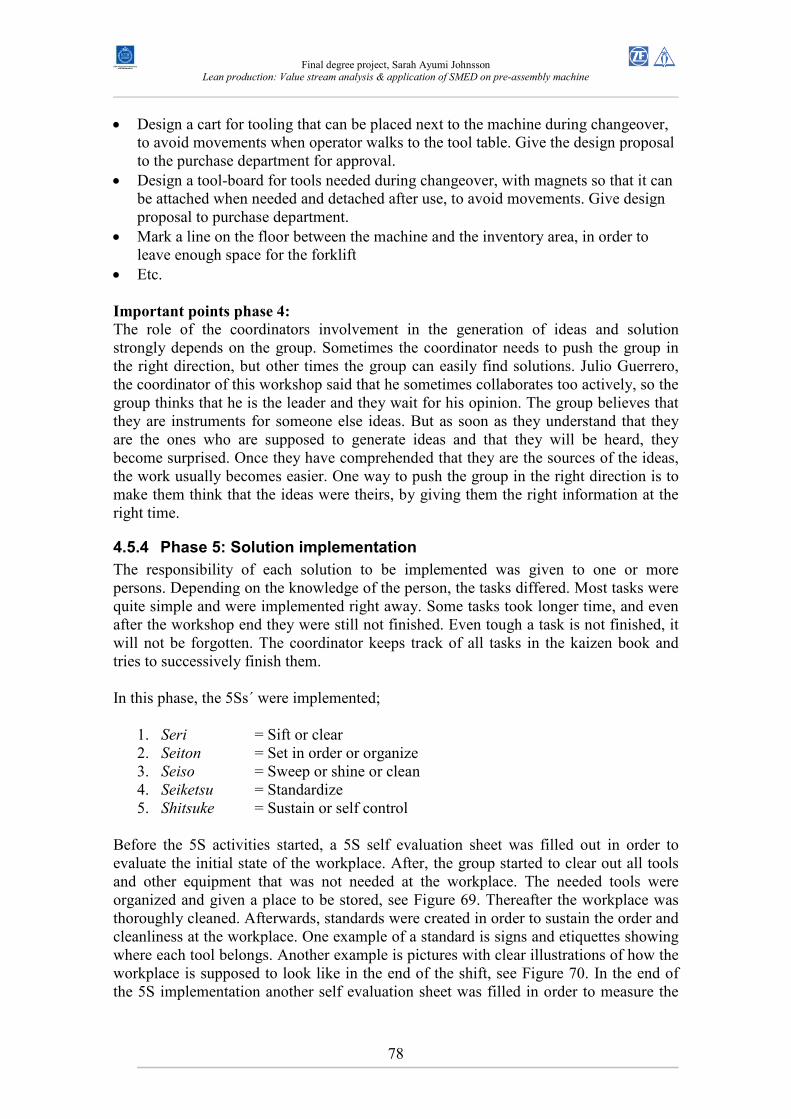
Final degree project, Sarah Ayumi Johnsson
Lean production: Value stream analysis & application of SMED on pre-assembly machine
78
• Design a cart for tooling that can be placed next to the machine during changeover, to avoid movements when operator walks to the tool table. Give the design proposal to the purchase department for approval.
• Design a tool-board for tools needed during changeover, with magnets so that it can be attached when needed and detached after use, to avoid movements. Give design proposal to purchase department.
• Mark a line on the floor between the machine and the inventory area, in order to leave enough space for the forklift
• Etc. Important points phase 4:
The role of the coordinators involvement in the generation of ideas and solution strongly depends on the group. Sometimes the coordinator needs to push the group in the right direction, but other times the group can easily find solutions. Julio Guerrero, the coordinator of this workshop said that he sometimes collaborates too actively, so the group thinks that he is the leader and they wait for his opinion. The group believes that they are instruments for someone else ideas. But as soon as they understand that they are the ones who are supposed to generate ideas and that they will be heard, they become surprised. Once they have comprehended that they are the sources of the ideas, the work usually becomes easier. One way to push the group in the right direction is to make them think that the ideas were theirs, by giving them the right information at the right time.
4.5.4 Phase 5: Solution implementation
The responsibility of each solution to be implemented was given to one or more persons. Depending on the knowledge of the person, the tasks differed. Most tasks were quite simple and were implemented right away. Some tasks took longer time, and even after the workshop end they were still not finished. Even tough a task is not finished, it will not be forgotten. The coordinator keeps track of all tasks in the kaizen book and tries to successively finish them. In this phase, the 5Ss´ were implemented;
1. Seri = Sift or clear 2. Seiton = Set in order or organize 3. Seiso = Sweep or shine or clean 4. Seiketsu = Standardize 5. Shitsuke = Sustain or self control
Before the 5S activities started, a 5S self evaluation sheet was filled out in order to evaluate the initial state of the workplace. After, the group started to clear out all tools and other equipment that was not needed at the workplace. The needed tools were organized and given a place to be stored, see Figure 69. Thereafter the workplace was thoroughly cleaned. Afterwards, standards were created in order to sustain the order and cleanliness at the workplace. One example of a standard is signs and etiquettes showing where each tool belongs. Another example is pictures with clear illustrations of how the workplace is supposed to look like in the end of the shift, see Figure 70. In the end of the 5S implementation another self evaluation sheet was filled in order to measure the
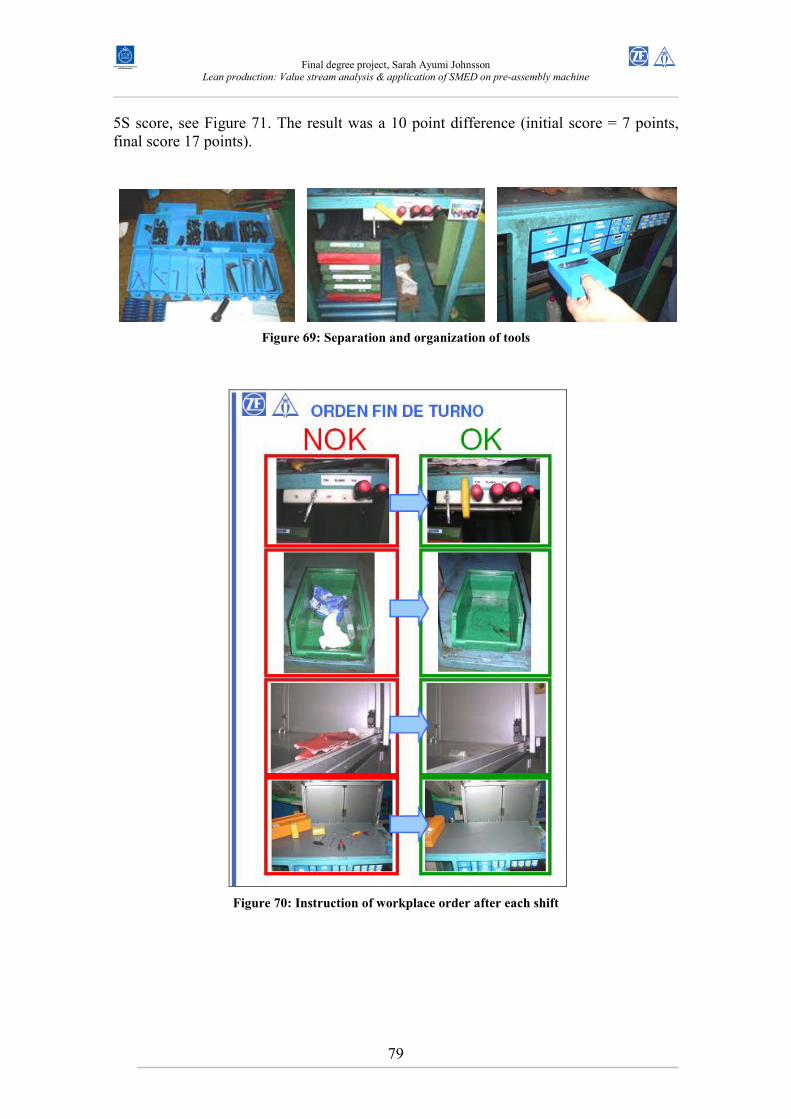
Final degree project, Sarah Ayumi Johnsson
Lean production: Value stream analysis & application of SMED on pre-assembly machine
79
5S score, see Figure 71. The result was a 10 point difference (initial score = 7 points, final score 17 points).
Figure 69: Separation and organization of tools
Figure 70: Instruction of workplace order after each shift
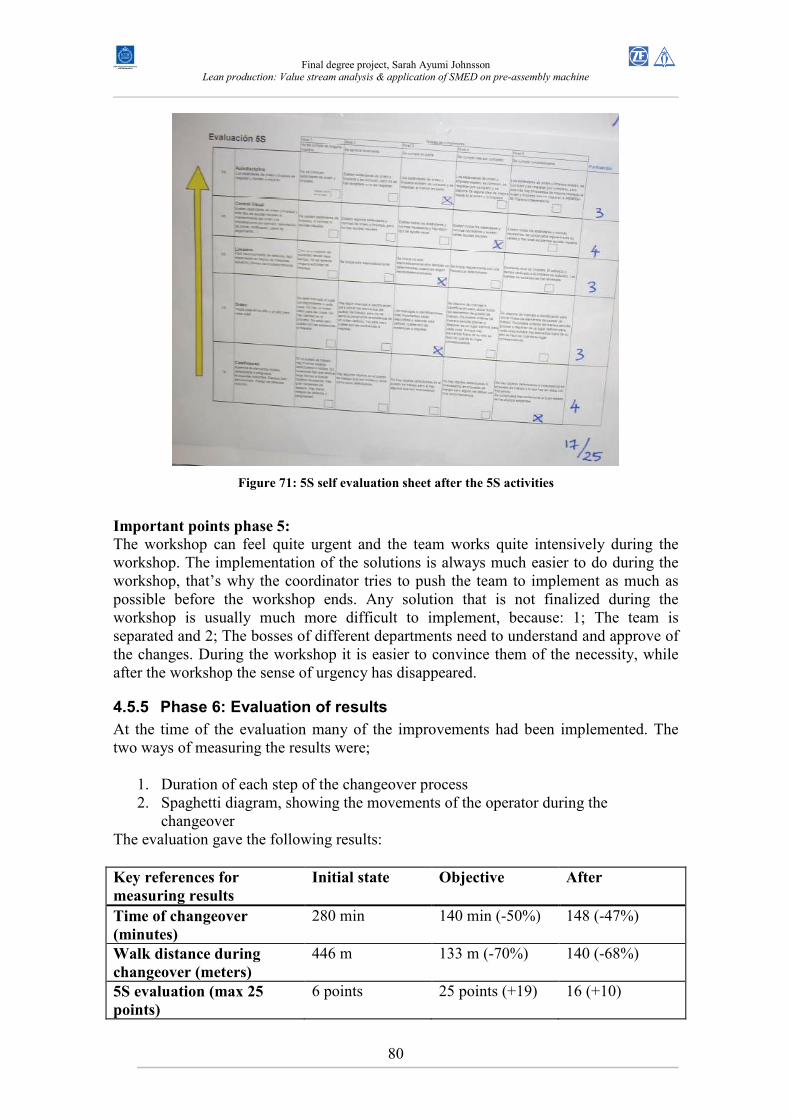
Final degree project, Sarah Ayumi Johnsson
Lean production: Value stream analysis & application of SMED on pre-assembly machine
80
Figure 71: 5S self evaluation sheet after the 5S activities
Important points phase 5:
The workshop can feel quite urgent and the team works quite intensively during the workshop. The implementation of the solutions is always much easier to do during the workshop, that’s why the coordinator tries to push the team to implement as much as possible before the workshop ends. Any solution that is not finalized during the workshop is usually much more difficult to implement, because: 1; The team is separated and 2; The bosses of different departments need to understand and approve of the changes. During the workshop it is easier to convince them of the necessity, while after the workshop the sense of urgency has disappeared.
4.5.5 Phase 6: Evaluation of results
At the time of the evaluation many of the improvements had been implemented. The two ways of measuring the results were;
1. Duration of each step of the changeover process 2. Spaghetti diagram, showing the movements of the operator during the
changeover The evaluation gave the following results: Key references for
measuring results
Initial state Objective After
Time of changeover
(minutes)
280 min 140 min (-50%) 148 (-47%)
Walk distance during
changeover (meters)
446 m 133 m (-70%) 140 (-68%)
5S evaluation (max 25
points)
6 points 25 points (+19) 16 (+10)
Final degree project, Sarah Ayumi Johnsson
Lean production: Value stream analysis & application of SMED on pre-assembly machine
81
Important points phase 6:
It is important that the key-figures chosen in the beginning of the workshop are clear to measure and can be understood by everyone. There should be only one way to measure one thing and the value should be meaningful and easy to understand for the people using it. If not, there is a risk of misunderstandings and that the measurements will not be made. For instance, during the evaluation, the spaghetti diagram was made by another person than who made the previous one. The diagrams looked very different and the comparison became unnecessarily difficult.
4.5.6 Phase 7: Standardization
Some standardization of the changes have already been mentioned in the part describing the 5S, there many visual aids helps to standardize the work. Another type of standardisation is written instructions, in addition to educating all operators of the new procedures of work. All operators must receive education about the new procedures, and the coordinator has to prepare the education and further on inform the shift leader. To keep track of which operators received education, a list of the operators names can be placed by the work place and the names will be checked after the education. Important points phase 7:
The coordinators responsibility after the workshop is to check and register the changes every month. The standardisation helps to establish key-values to measure and the visual aids makes any abnormalities immediately obvious.
4.5.7 Phase 8: Communication of results
After the workshop, the coordinator prepared a report for the steering committee and presented the results. The report is brief and it is written on an A4 sized sheet containing target, changes and results. He also made a report and presentation for the shift responsible and leaders, which train the operators. Furthermore, he prepared a standard form for the operators to register the changeover times. The coordinator also makes an information board to be placed by the machine, explaining that an LPS workshop was performed there. The info-board also contains things like; workshop target, agenda, participants, initial and final state and results. The board is updated every month until the process is considered stable. The same information is available on the company intranet, so other plants within the Lemförder group can learn from the experience. Important points phase 8:
It is important that all operators receive the education, to ensure that all changes are actually being employed.
4.6 Lessons learned
In the end of all LPS workshops a part called lessons learned is carried out. Then the group discuss the things that went wrong as well as things that wasn’t thought of during the workshop but would be done if they could do the workshop over again. These points are important because they work as reminders for the next workshop, and hopefully the lessons will make the next one run smoother. Following are the lessons learned during the LPS workshop - SMED and 5S in BTB machine 928:
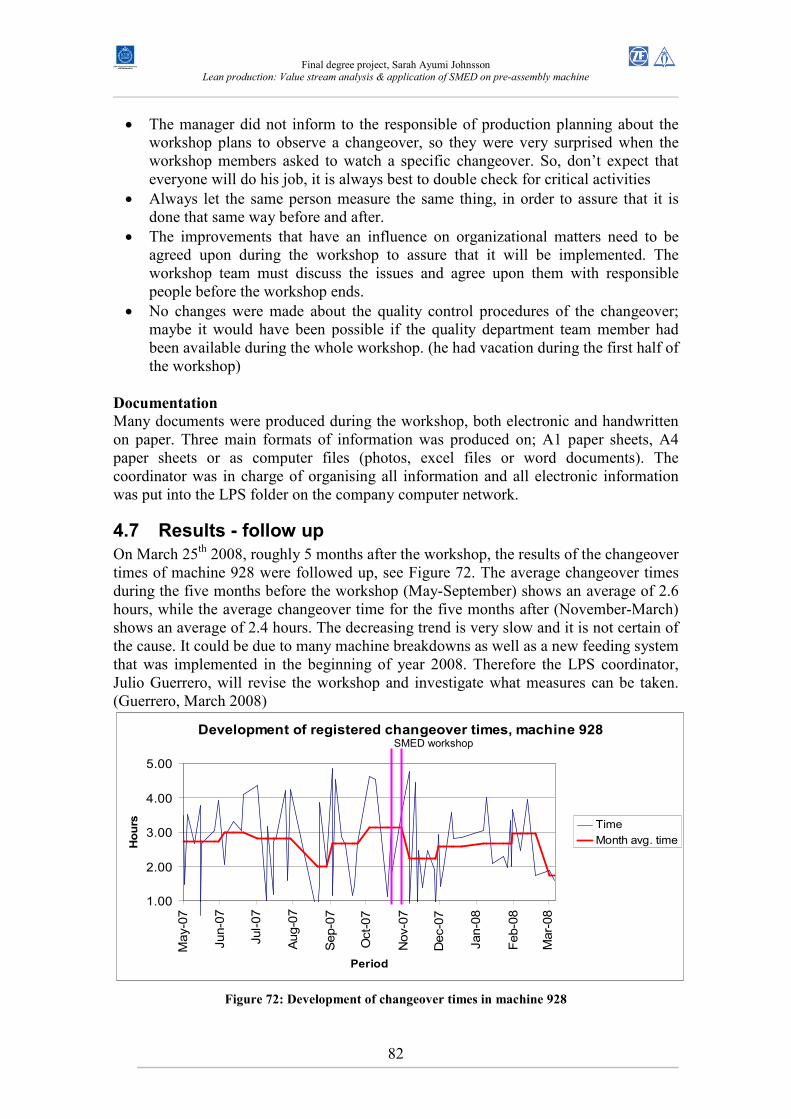
Final degree project, Sarah Ayumi Johnsson
Lean production: Value stream analysis & application of SMED on pre-assembly machine
82
• The manager did not inform to the responsible of production planning about the workshop plans to observe a changeover, so they were very surprised when the workshop members asked to watch a specific changeover. So, don’t expect that everyone will do his job, it is always best to double check for critical activities
• Always let the same person measure the same thing, in order to assure that it is done that same way before and after.
• The improvements that have an influence on organizational matters need to be agreed upon during the workshop to assure that it will be implemented. The workshop team must discuss the issues and agree upon them with responsible people before the workshop ends.
• No changes were made about the quality control procedures of the changeover; maybe it would have been possible if the quality department team member had been available during the whole workshop. (he had vacation during the first half of the workshop)
Documentation
Many documents were produced during the workshop, both electronic and handwritten on paper. Three main formats of information was produced on; A1 paper sheets, A4 paper sheets or as computer files (photos, excel files or word documents). The coordinator was in charge of organising all information and all electronic information was put into the LPS folder on the company computer network.
4.7 Results - follow up
On March 25th 2008, roughly 5 months after the workshop, the results of the changeover times of machine 928 were followed up, see Figure 72. The average changeover times during the five months before the workshop (May-September) shows an average of 2.6 hours, while the average changeover time for the five months after (November-March) shows an average of 2.4 hours. The decreasing trend is very slow and it is not certain of the cause. It could be due to many machine breakdowns as well as a new feeding system that was implemented in the beginning of year 2008. Therefore the LPS coordinator, Julio Guerrero, will revise the workshop and investigate what measures can be taken. (Guerrero, March 2008)
Figure 72: Development of changeover times in machine 928
Development of registered changeover times, machine 928
1.00
2.00
3.00
4.00
5.00
May-07
Jun-07
Jul-07
Aug-07
Sep-07
Oct-07
Nov-07
Dec-07
Jan-08
Feb-08
Mar-08
Period
Hours Time
Month avg. time
SMED workshop
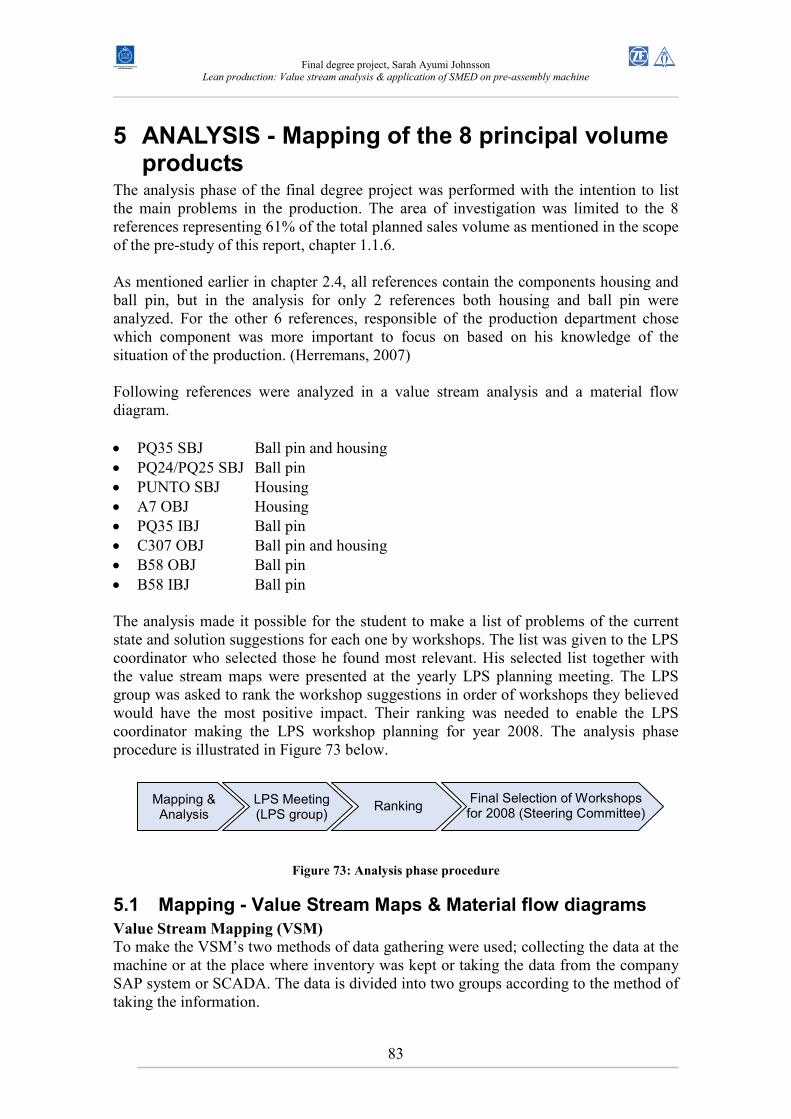
Final degree project, Sarah Ayumi Johnsson
Lean production: Value stream analysis & application of SMED on pre-assembly machine
83
5 ANALYSIS - Mapping of the 8 principal volume products
The analysis phase of the final degree project was performed with the intention to list the main problems in the production. The area of investigation was limited to the 8 references representing 61% of the total planned sales volume as mentioned in the scope of the pre-study of this report, chapter 1.1.6. As mentioned earlier in chapter 2.4, all references contain the components housing and ball pin, but in the analysis for only 2 references both housing and ball pin were analyzed. For the other 6 references, responsible of the production department chose which component was more important to focus on based on his knowledge of the situation of the production. (Herremans, 2007) Following references were analyzed in a value stream analysis and a material flow diagram. • PQ35 SBJ Ball pin and housing • PQ24/PQ25 SBJ Ball pin • PUNTO SBJ Housing • A7 OBJ Housing • PQ35 IBJ Ball pin • C307 OBJ Ball pin and housing • B58 OBJ Ball pin • B58 IBJ Ball pin The analysis made it possible for the student to make a list of problems of the current state and solution suggestions for each one by workshops. The list was given to the LPS coordinator who selected those he found most relevant. His selected list together with the value stream maps were presented at the yearly LPS planning meeting. The LPS group was asked to rank the workshop suggestions in order of workshops they believed would have the most positive impact. Their ranking was needed to enable the LPS coordinator making the LPS workshop planning for year 2008. The analysis phase procedure is illustrated in Figure 73 below.
Figure 73: Analysis phase procedure
5.1 Mapping - Value Stream Maps & Material flow diagrams
Value Stream Mapping (VSM)
To make the VSM’s two methods of data gathering were used; collecting the data at the machine or at the place where inventory was kept or taking the data from the company SAP system or SCADA. The data is divided into two groups according to the method of taking the information.
Mapping & Analysis
LPS Meeting (LPS group)
Ranking Final Selection of Workshops for 2008 (Steering Committee)
Final degree project, Sarah Ayumi Johnsson
Lean production: Value stream analysis & application of SMED on pre-assembly machine
84
At machine & inventory CT Cycle Time (seconds) TPT Through Put Time (seconds) I Inventory by machine or intermediate inventory (pieces) SAP & SCADA OP/sh Operators per shift (1 operator per shift / 3 shifts per day � 1/3) Qty Quantity produced (pieces / operator / shift) BS Batch Size (pieces) # ref Number of distinct references treated in the process C/O Changeover frequency (number of changeovers / week) C/O t Changeover time (hours) Scrap (%) GE Global Efficiency (%) I Inventory in warehouse or at supplier (pieces) The VSM’s were made according to the schedule, but some data’s were not possible to attain due to problems such as no production activities on the day of the mapping or insufficient data about individual machines in SCADA. Before the presentation of the analysis as much data as possible was obtained. In the cases when the data was not available it was noted on the value stream maps and those maps not completed after the presentation were left uncompleted since after the presentation and decision of workshops for 2008, the maps would not be used again. Material Flow Diagrams
The material flow diagrams were based on the VSM’s and a layout map of the plant. Machine numbers were noted on both the VSM’s and the plant layout; therefore the distance the material flows in the plant could be estimated. The distances were calculated by using a scale layout of the plant and measuring the distance with a ruler. The VSM’s and material flow diagrams can be found in Appendix II and Appendix III.
5.2 Analysis – Problems, solution proposals & LPS group meeting
The VSM’s were utilized to create improvement proposals. All data in the VSM’s was examined together with a list of critical machines which can be retrieved from SCADA. In this case the list of critical machines was obtained by the LPS coordinator. The data were discussed with the supervisor and thereafter a list of LPS workshop suggestions was created. Approximately half of the suggestions were created together with the supervisor and the rest were created by the student alone. Three major types of workshops were suggested; OEE, SMED and PULL (See chapter 3.3 on page 38 for definitions). For the two former types of workshops following criteria were used; low value on Global Efficiency, existence on “critical machine list” and high values on changeover time & frequency. For the latter, a workshop was proposed for all investigated references because no reliable criteria existed since it was not possible to estimate a realistic stock size.
Final degree project, Sarah Ayumi Johnsson
Lean production: Value stream analysis & application of SMED on pre-assembly machine
85
All machines with a GE under 90 % were proposed as candidates for an OEE workshop. Most candidates for SMED workshops have a changeover time above 2 hours and a frequency of roughly 1.5 times per week. Some of the candidates that have lower values are either based on discussion with the supervisor or chosen because the value was the highest in the value stream of that reference. The final list contained 41 workshop suggestions, and once the list was done it was given to the supervisor who selected the 20 proposals he found most relevant. His selected list together with the VSM analyses was presented at the yearly LPS meeting. At the meeting the LPS group members discussed the proposals and agreed about the suggestions they found most important. They deleted some proposals and added some additional suggestions to the list, see Table 8 below. In the end of the meeting, a list consisting of 18 suggestions and thereby shorter than in the original, was agreed upon. The group members were asked to rank the workshop suggestions to enable the LPS coordinator to make the LPS workshop planning for year 2008. Two suggestions were missed during the presentation, number 19 and 20 in the list below, so they were added to the list afterwards, thus in the end the list consisted of 20 workshop proposals. The list was e-mailed to the LPS group members for the purpose of ranking it. The criteria for ranking was in order of which workshop they thought would have the greatest impact in terms of money. The ranking was highly subjective, and depending on the work responsibilities of each group member, the ranking looked different. There are two reasons for asking the LPS group for advice when planning the improvements: 1) the members come from different departments so the votes will not be favorable for one specific department, 2) there exist no precise or scientific manner for ranking workshop suggestions, and if it did exist the LPS groups’ opinion would not be needed.
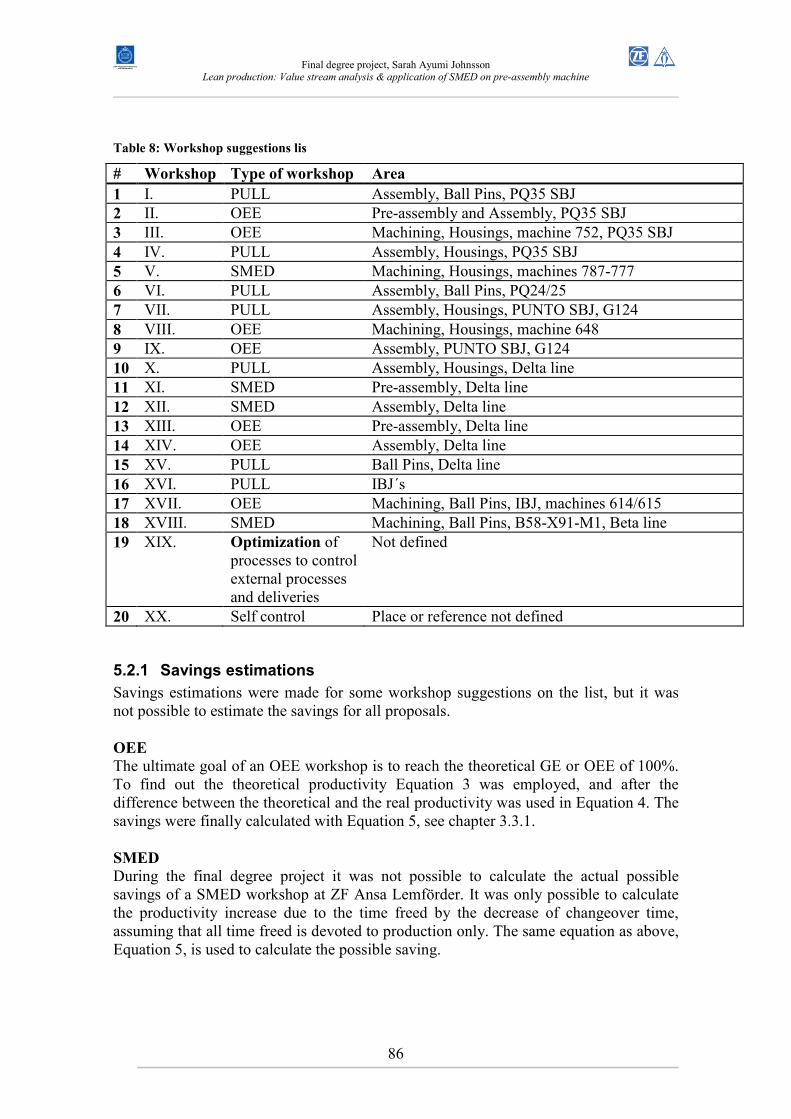
Final degree project, Sarah Ayumi Johnsson
Lean production: Value stream analysis & application of SMED on pre-assembly machine
86
Table 8: Workshop suggestions lis
# Workshop Type of workshop Area
1 I. PULL Assembly, Ball Pins, PQ35 SBJ 2 II. OEE Pre-assembly and Assembly, PQ35 SBJ 3 III. OEE Machining, Housings, machine 752, PQ35 SBJ 4 IV. PULL Assembly, Housings, PQ35 SBJ 5 V. SMED Machining, Housings, machines 787-777 6 VI. PULL Assembly, Ball Pins, PQ24/25 7 VII. PULL Assembly, Housings, PUNTO SBJ, G124 8 VIII. OEE Machining, Housings, machine 648 9 IX. OEE Assembly, PUNTO SBJ, G124 10 X. PULL Assembly, Housings, Delta line 11 XI. SMED Pre-assembly, Delta line 12 XII. SMED Assembly, Delta line 13 XIII. OEE Pre-assembly, Delta line 14 XIV. OEE Assembly, Delta line 15 XV. PULL Ball Pins, Delta line 16 XVI. PULL IBJ´s 17 XVII. OEE Machining, Ball Pins, IBJ, machines 614/615 18 XVIII. SMED Machining, Ball Pins, B58-X91-M1, Beta line 19 XIX. Optimization of
processes to control external processes and deliveries
Not defined
20 XX. Self control Place or reference not defined
5.2.1 Savings estimations
Savings estimations were made for some workshop suggestions on the list, but it was not possible to estimate the savings for all proposals. OEE
The ultimate goal of an OEE workshop is to reach the theoretical GE or OEE of 100%. To find out the theoretical productivity Equation 3 was employed, and after the difference between the theoretical and the real productivity was used in Equation 4. The savings were finally calculated with Equation 5, see chapter 3.3.1. SMED
During the final degree project it was not possible to calculate the actual possible savings of a SMED workshop at ZF Ansa Lemförder. It was only possible to calculate the productivity increase due to the time freed by the decrease of changeover time, assuming that all time freed is devoted to production only. The same equation as above, Equation 5, is used to calculate the possible saving.
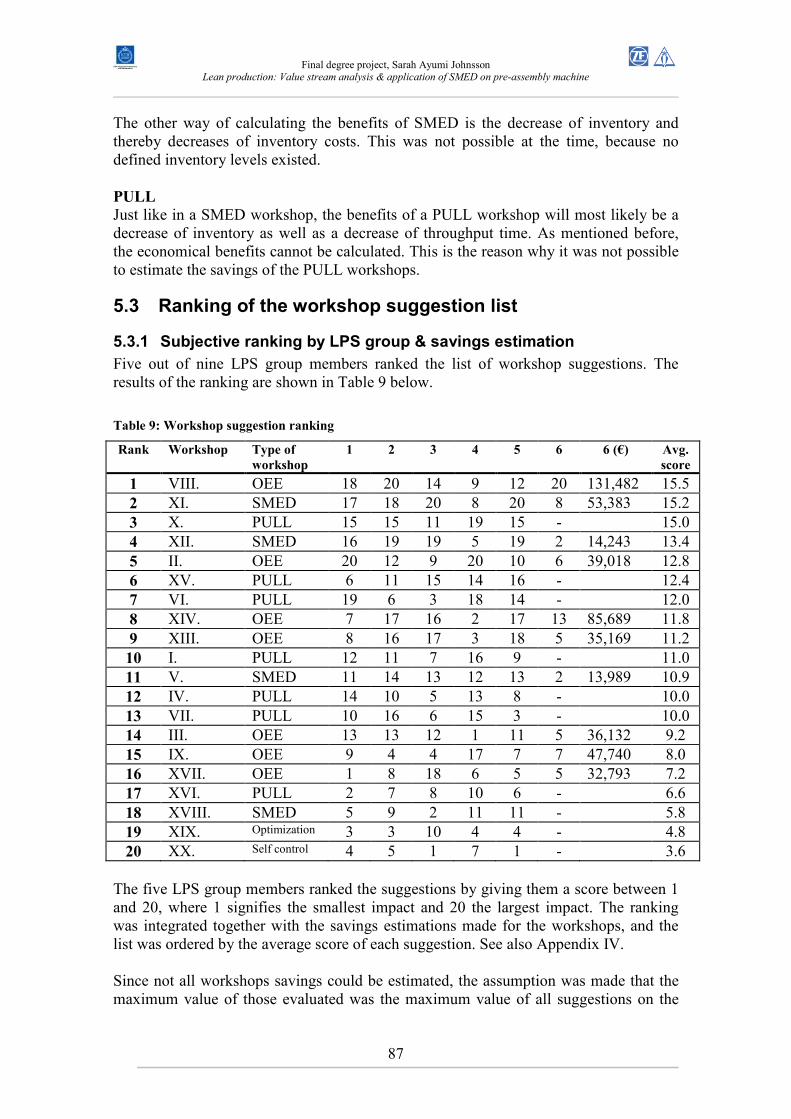
Final degree project, Sarah Ayumi Johnsson
Lean production: Value stream analysis & application of SMED on pre-assembly machine
87
The other way of calculating the benefits of SMED is the decrease of inventory and thereby decreases of inventory costs. This was not possible at the time, because no defined inventory levels existed. PULL
Just like in a SMED workshop, the benefits of a PULL workshop will most likely be a decrease of inventory as well as a decrease of throughput time. As mentioned before, the economical benefits cannot be calculated. This is the reason why it was not possible to estimate the savings of the PULL workshops.
5.3 Ranking of the workshop suggestion list
5.3.1 Subjective ranking by LPS group & savings estimation
Five out of nine LPS group members ranked the list of workshop suggestions. The results of the ranking are shown in Table 9 below.
Table 9: Workshop suggestion ranking
Rank Workshop Type of
workshop
1 2 3 4 5 6 6 (€) Avg.
score
1 VIII. OEE 18 20 14 9 12 20 131,482 15.5 2 XI. SMED 17 18 20 8 20 8 53,383 15.2 3 X. PULL 15 15 11 19 15 - 15.0 4 XII. SMED 16 19 19 5 19 2 14,243 13.4 5 II. OEE 20 12 9 20 10 6 39,018 12.8 6 XV. PULL 6 11 15 14 16 - 12.4 7 VI. PULL 19 6 3 18 14 - 12.0 8 XIV. OEE 7 17 16 2 17 13 85,689 11.8 9 XIII. OEE 8 16 17 3 18 5 35,169 11.2 10 I. PULL 12 11 7 16 9 - 11.0 11 V. SMED 11 14 13 12 13 2 13,989 10.9 12 IV. PULL 14 10 5 13 8 - 10.0 13 VII. PULL 10 16 6 15 3 - 10.0 14 III. OEE 13 13 12 1 11 5 36,132 9.2 15 IX. OEE 9 4 4 17 7 7 47,740 8.0 16 XVII. OEE 1 8 18 6 5 5 32,793 7.2 17 XVI. PULL 2 7 8 10 6 - 6.6 18 XVIII. SMED 5 9 2 11 11 - 5.8 19 XIX. Optimization 3 3 10 4 4 - 4.8 20 XX. Self control 4 5 1 7 1 - 3.6
The five LPS group members ranked the suggestions by giving them a score between 1 and 20, where 1 signifies the smallest impact and 20 the largest impact. The ranking was integrated together with the savings estimations made for the workshops, and the list was ordered by the average score of each suggestion. See also Appendix IV. Since not all workshops savings could be estimated, the assumption was made that the maximum value of those evaluated was the maximum value of all suggestions on the
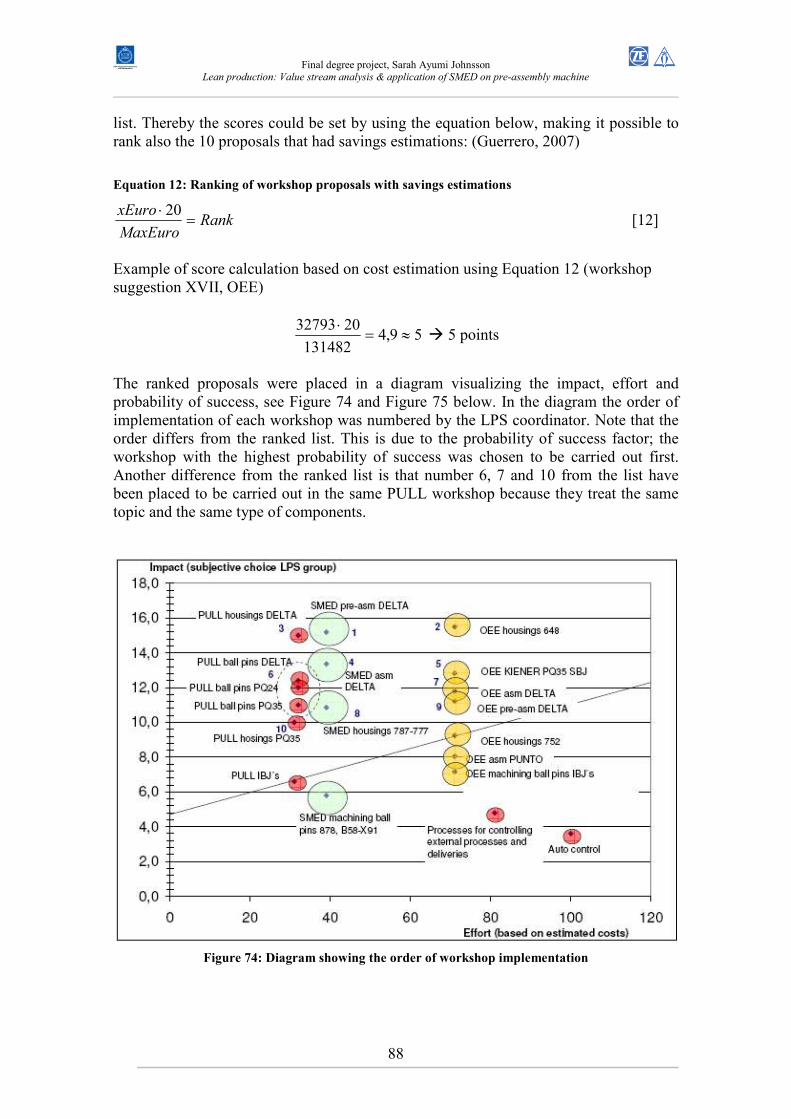
Final degree project, Sarah Ayumi Johnsson
Lean production: Value stream analysis & application of SMED on pre-assembly machine
88
list. Thereby the scores could be set by using the equation below, making it possible to rank also the 10 proposals that had savings estimations: (Guerrero, 2007)
Equation 12: Ranking of workshop proposals with savings estimations
RankMaxEuro
xEuro=
⋅ 20 [12]
Example of score calculation based on cost estimation using Equation 12 (workshop suggestion XVII, OEE)
59,4131482
2032793≈=
⋅ � 5 points
The ranked proposals were placed in a diagram visualizing the impact, effort and probability of success, see Figure 74 and Figure 75 below. In the diagram the order of implementation of each workshop was numbered by the LPS coordinator. Note that the order differs from the ranked list. This is due to the probability of success factor; the workshop with the highest probability of success was chosen to be carried out first. Another difference from the ranked list is that number 6, 7 and 10 from the list have been placed to be carried out in the same PULL workshop because they treat the same topic and the same type of components.
Figure 74: Diagram showing the order of workshop implementation
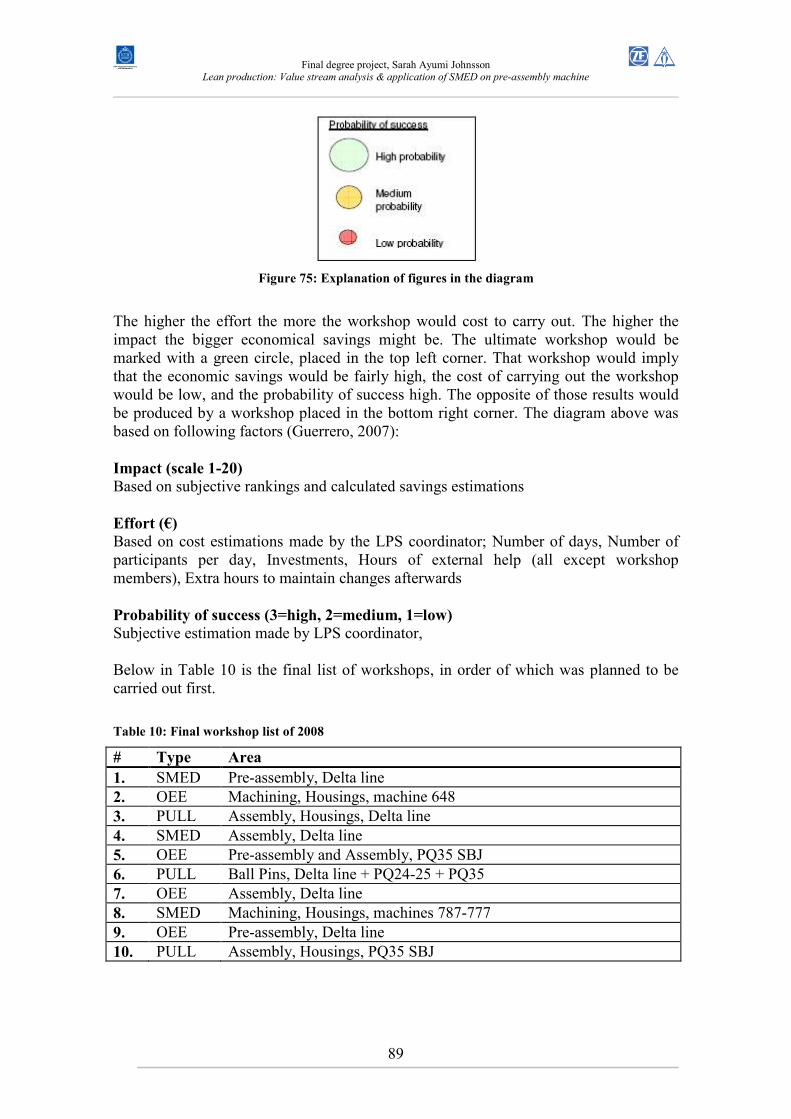
Final degree project, Sarah Ayumi Johnsson
Lean production: Value stream analysis & application of SMED on pre-assembly machine
89
Figure 75: Explanation of figures in the diagram
The higher the effort the more the workshop would cost to carry out. The higher the impact the bigger economical savings might be. The ultimate workshop would be marked with a green circle, placed in the top left corner. That workshop would imply that the economic savings would be fairly high, the cost of carrying out the workshop would be low, and the probability of success high. The opposite of those results would be produced by a workshop placed in the bottom right corner. The diagram above was based on following factors (Guerrero, 2007):
Impact (scale 1-20)
Based on subjective rankings and calculated savings estimations
Effort (€)
Based on cost estimations made by the LPS coordinator; Number of days, Number of participants per day, Investments, Hours of external help (all except workshop members), Extra hours to maintain changes afterwards
Probability of success (3=high, 2=medium, 1=low)
Subjective estimation made by LPS coordinator, Below in Table 10 is the final list of workshops, in order of which was planned to be carried out first.
Table 10: Final workshop list of 2008
# Type Area
1. SMED Pre-assembly, Delta line 2. OEE Machining, Housings, machine 648 3. PULL Assembly, Housings, Delta line 4. SMED Assembly, Delta line 5. OEE Pre-assembly and Assembly, PQ35 SBJ 6. PULL Ball Pins, Delta line + PQ24-25 + PQ35 7. OEE Assembly, Delta line 8. SMED Machining, Housings, machines 787-777 9. OEE Pre-assembly, Delta line 10. PULL Assembly, Housings, PQ35 SBJ
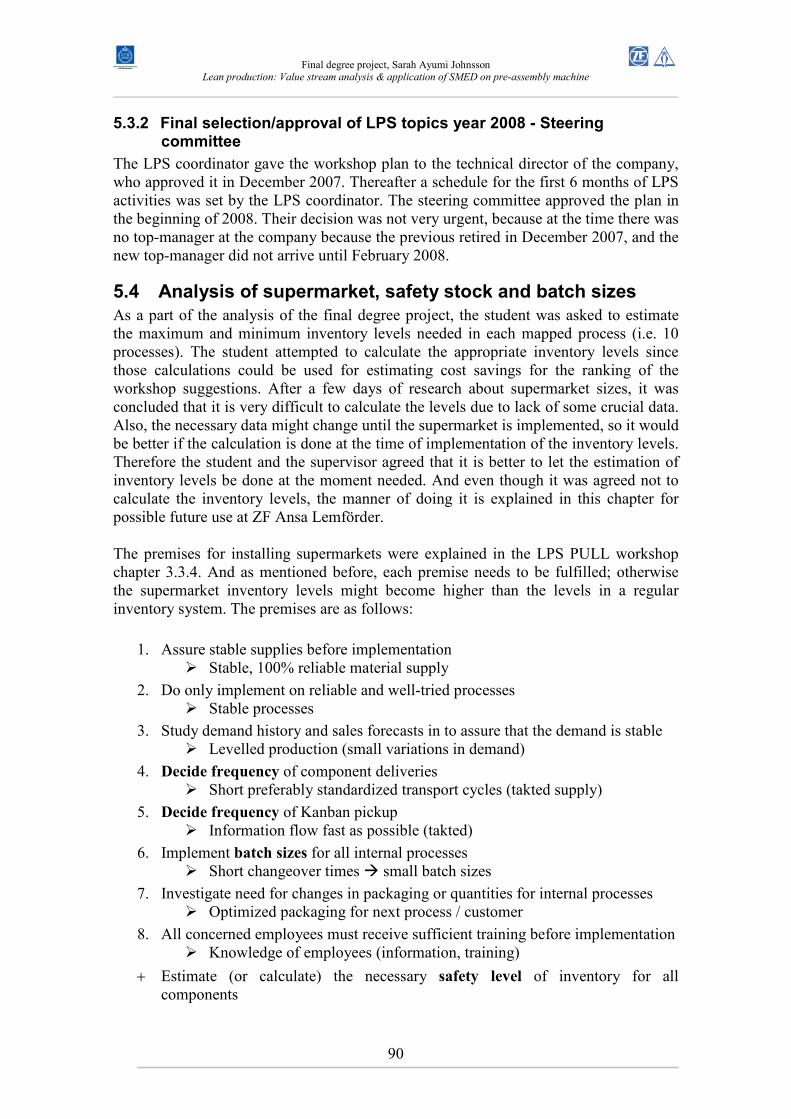
Final degree project, Sarah Ayumi Johnsson
Lean production: Value stream analysis & application of SMED on pre-assembly machine
90
5.3.2 Final selection/approval of LPS topics year 2008 - Steering committee
The LPS coordinator gave the workshop plan to the technical director of the company, who approved it in December 2007. Thereafter a schedule for the first 6 months of LPS activities was set by the LPS coordinator. The steering committee approved the plan in the beginning of 2008. Their decision was not very urgent, because at the time there was no top-manager at the company because the previous retired in December 2007, and the new top-manager did not arrive until February 2008.
5.4 Analysis of supermarket, safety stock and batch sizes
As a part of the analysis of the final degree project, the student was asked to estimate the maximum and minimum inventory levels needed in each mapped process (i.e. 10 processes). The student attempted to calculate the appropriate inventory levels since those calculations could be used for estimating cost savings for the ranking of the workshop suggestions. After a few days of research about supermarket sizes, it was concluded that it is very difficult to calculate the levels due to lack of some crucial data. Also, the necessary data might change until the supermarket is implemented, so it would be better if the calculation is done at the time of implementation of the inventory levels. Therefore the student and the supervisor agreed that it is better to let the estimation of inventory levels be done at the moment needed. And even though it was agreed not to calculate the inventory levels, the manner of doing it is explained in this chapter for possible future use at ZF Ansa Lemförder. The premises for installing supermarkets were explained in the LPS PULL workshop chapter 3.3.4. And as mentioned before, each premise needs to be fulfilled; otherwise the supermarket inventory levels might become higher than the levels in a regular inventory system. The premises are as follows:
1. Assure stable supplies before implementation � Stable, 100% reliable material supply
2. Do only implement on reliable and well-tried processes � Stable processes
3. Study demand history and sales forecasts in to assure that the demand is stable � Levelled production (small variations in demand)
4. Decide frequency of component deliveries � Short preferably standardized transport cycles (takted supply)
5. Decide frequency of Kanban pickup � Information flow fast as possible (takted)
6. Implement batch sizes for all internal processes � Short changeover times � small batch sizes
7. Investigate need for changes in packaging or quantities for internal processes � Optimized packaging for next process / customer
8. All concerned employees must receive sufficient training before implementation � Knowledge of employees (information, training)
+ Estimate (or calculate) the necessary safety level of inventory for all components
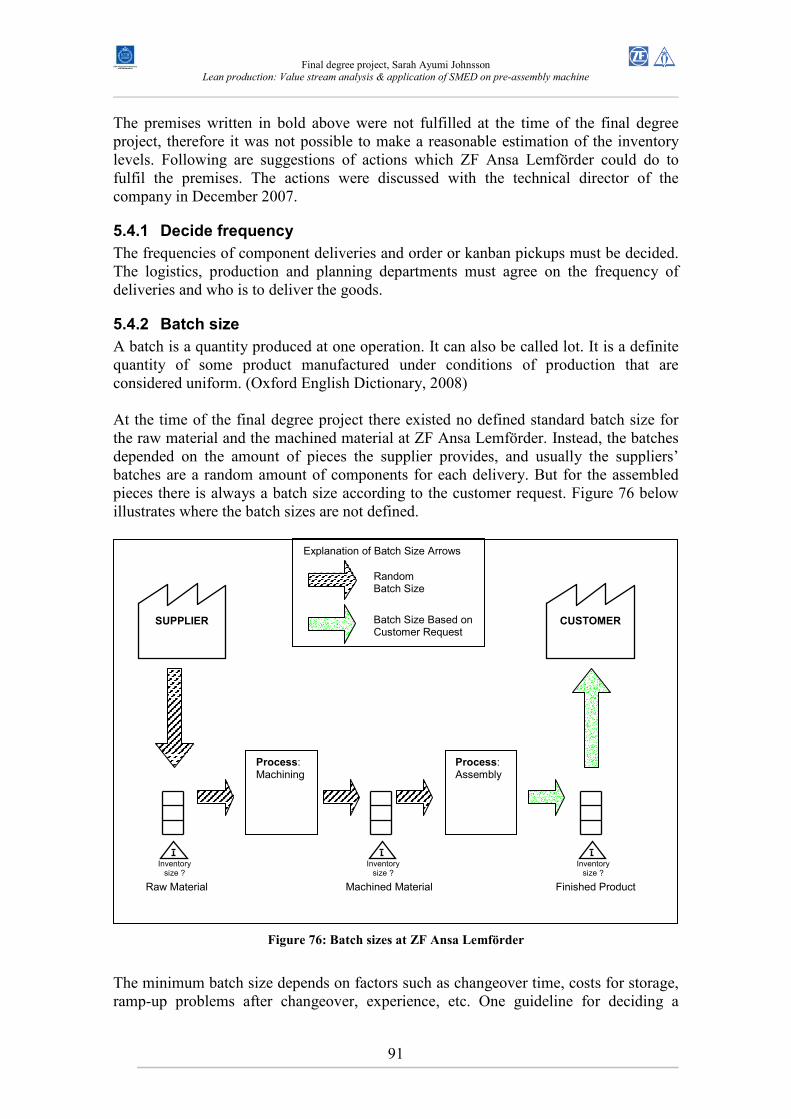
Final degree project, Sarah Ayumi Johnsson
Lean production: Value stream analysis & application of SMED on pre-assembly machine
91
The premises written in bold above were not fulfilled at the time of the final degree project, therefore it was not possible to make a reasonable estimation of the inventory levels. Following are suggestions of actions which ZF Ansa Lemförder could do to fulfil the premises. The actions were discussed with the technical director of the company in December 2007.
5.4.1 Decide frequency
The frequencies of component deliveries and order or kanban pickups must be decided. The logistics, production and planning departments must agree on the frequency of deliveries and who is to deliver the goods.
5.4.2 Batch size
A batch is a quantity produced at one operation. It can also be called lot. It is a definite quantity of some product manufactured under conditions of production that are considered uniform. (Oxford English Dictionary, 2008) At the time of the final degree project there existed no defined standard batch size for the raw material and the machined material at ZF Ansa Lemförder. Instead, the batches depended on the amount of pieces the supplier provides, and usually the suppliers’ batches are a random amount of components for each delivery. But for the assembled pieces there is always a batch size according to the customer request. Figure 76 below illustrates where the batch sizes are not defined.
Figure 76: Batch sizes at ZF Ansa Lemförder
The minimum batch size depends on factors such as changeover time, costs for storage, ramp-up problems after changeover, experience, etc. One guideline for deciding a
Process: Machining
Process: Assembly
SUPPLIER
Inventory size ?
Inventory size ?
CUSTOMER
Inventory size ?
Raw Material Machined Material Finished Product
Random Batch Size
Batch Size Based on Customer Request
Explanation of Batch Size Arrows
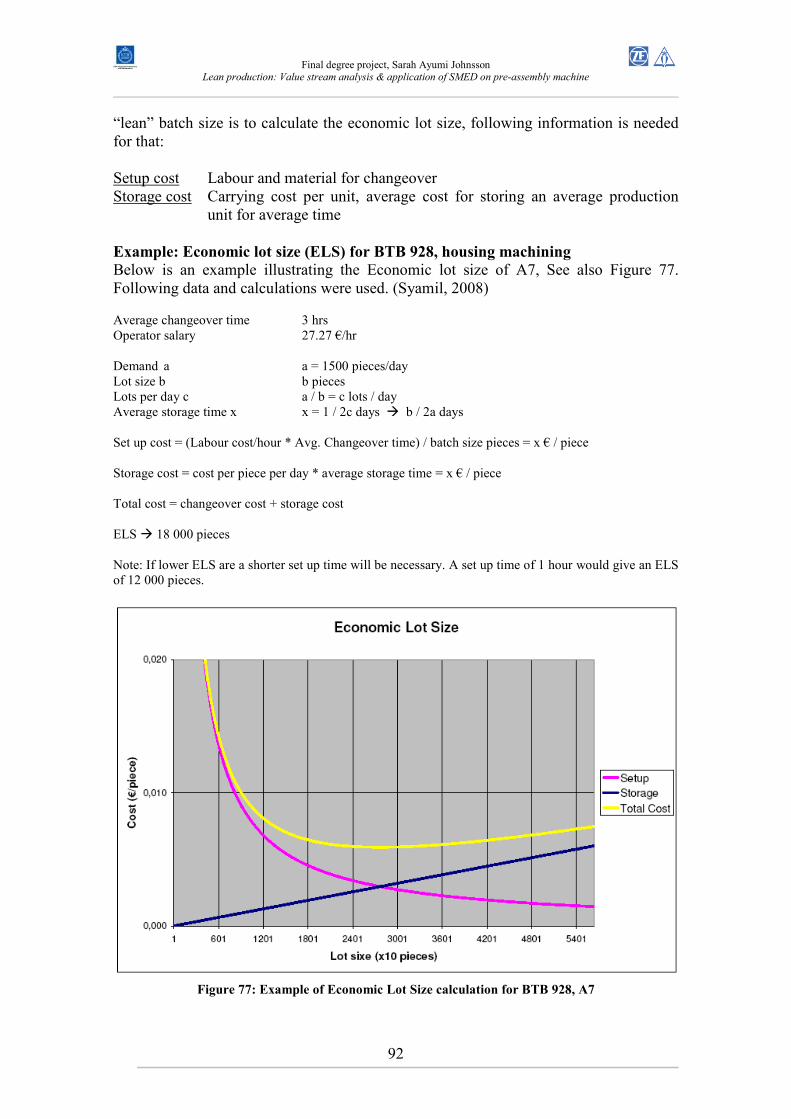
Final degree project, Sarah Ayumi Johnsson
Lean production: Value stream analysis & application of SMED on pre-assembly machine
92
“lean” batch size is to calculate the economic lot size, following information is needed for that: Setup cost Labour and material for changeover Storage cost Carrying cost per unit, average cost for storing an average production unit for average time Example: Economic lot size (ELS) for BTB 928, housing machining
Below is an example illustrating the Economic lot size of A7, See also Figure 77. Following data and calculations were used. (Syamil, 2008) Average changeover time 3 hrs Operator salary 27.27 €/hr Demand a a = 1500 pieces/day Lot size b b pieces Lots per day c a / b = c lots / day Average storage time x x = 1 / 2c days � b / 2a days Set up cost = (Labour cost/hour * Avg. Changeover time) / batch size pieces = x € / piece Storage cost = cost per piece per day * average storage time = x € / piece Total cost = changeover cost + storage cost ELS � 18 000 pieces Note: If lower ELS are a shorter set up time will be necessary. A set up time of 1 hour would give an ELS of 12 000 pieces.
Figure 77: Example of Economic Lot Size calculation for BTB 928, A7
Final degree project, Sarah Ayumi Johnsson
Lean production: Value stream analysis & application of SMED on pre-assembly machine
93
The graph above in Figure 77 shows that the economic lot size is 18 000 pieces at the point of the curve where the total cost is minimum. But since the curve of the total cost is quite flat it is better to choose a lower quantity of the batch size, since it will increase flexibility and makes the inventory levels lower which will release space. The lot size could be set to 12 000 pieces or even 9000 pieces if the production responsible believes that the benefits of having a more flexible system are greater compared to the costs of changeovers. The economic lot size can be rounded up to an appropriate unit, such as production of 1 day or 1 shift. The current average “batch size” of machine BTB 928 is about 8000 pieces in average, based on that there were 120 changeovers and 960.000 pieces produced in 2007. This is lower than the ELS calculated in the example above, which was between 12 000 and 9000 pieces. But in fact the batch size of the machine is not always 8000, it usually differs for each batch and can be smaller or larger than 8000. The size of the batch (or order for changeover) often depends on the availability of raw material as well as customer demand. It is important to point out that the Economic lot size is only a guideline because of two reasons; 1) Other factors affect the needs of the production, such as delayed deliveries causing the need of urgent changeovers; hence the quantity needs to be chosen with care, 2) The economic benefits of having smaller batch sizes is not easy to calculate, but there are benefits such as; shorter lead time, increased quality, smaller stocks and increased flexibility. Hence caution should be taken when picking a batch size, the decision should not only be based on the economic batch size, but also other benefits such as those mentioned above needs to be considered. It is important that experienced personnel are involved in the decision of the size of the batch for each reference. Most likely, planning, production, logistics and maybe purchase departments will need to give their opinion about the batch size.
5.4.3 Safety stock
As explained in the report, the safety stock levels can be set based on experience. This is probably the easiest way, since there are many experienced employees at the company. If it turns out that it is too big or too small, it is easy to change the size of the safety stock, assumed that there is a follow up after the implementation. (Steffen, 2007) Just like in the other two cases, it is important that experienced personnel from involved departments are a part of the decision of the size of the safety stock. Involved in the decision should be the planning and production departments, maybe together with operators and shift leaders who know the production very well.
Final degree project, Sarah Ayumi Johnsson
Lean production: Value stream analysis & application of SMED on pre-assembly machine
94
6 IMPLEMENTATION - LPS workshop SMED & 5S
6.1 Choice of topic
After discussions it was agreed that the workshop topic would be SMED and 5S since that was also the topic of the practice workshop in which the student participated in as a pre-study. But in year 2008 a new way of defining a workshop was implemented at ZF Ansa Lemförder, making it necessary to separate the main topics of the workshops. Therefore, two separate consecutively workshops on the same machine, SMED and 5S, were chosen as the topic for the final degree project. The reason to the change was that the global LPS group had seen a summary of the workshops of the past year, 2007, and had pointed out that ZF Ansa Lemförder had a very low number of workshops compared to other plants in the group. The cause for that was that in each workshop run at Ansa, 5S was included. While at the other plants, 5S was always done as a separate workshop. Therefore the LPS coordinator decided it was better to separate all workshop topics in order to follow the Lemförder group standards. The proposed area in the plant was the Delta line pre-assembly machine 935, based on the list of planned workshops for 2008. See Table 10 in chapter 5.3.2. But when discussing the topic with Emiliano de los Mozos of the engineering department who has a lot of experience from the Delta line, he said that the changeovers for that particular machine usually do not take more than an hour. He suggested that another machine, assembly machine 936 in the same production line should be investigated instead. Both machine 935 and 936 were on the list of planned workshops for 2008, but the LPS coordinator found it important to start the year with the workshop on the machine with the longest changeover time. It was decided that two preliminary observations of changeovers, one of each machine, were to be done before taking a decision of which machine to focus on. (de los Mozos, 2008)
6.1.1 First preliminary observation – Delta line machine 935
On December 18th 2007 the preliminary observation of the changeover in pre-assembly machine 935 was made. All the actions the operator made during the changeover were written down together with the duration and classification of operations. The data was thereafter transferred into an excel template do create a waterfall diagram, see Figure 78. The total time of the changeover was 98.5 minutes (1.64 hrs), and the main parts of the changeover time were; Mechanical changeover (47%), Waiting (18%) and Movements (16%).
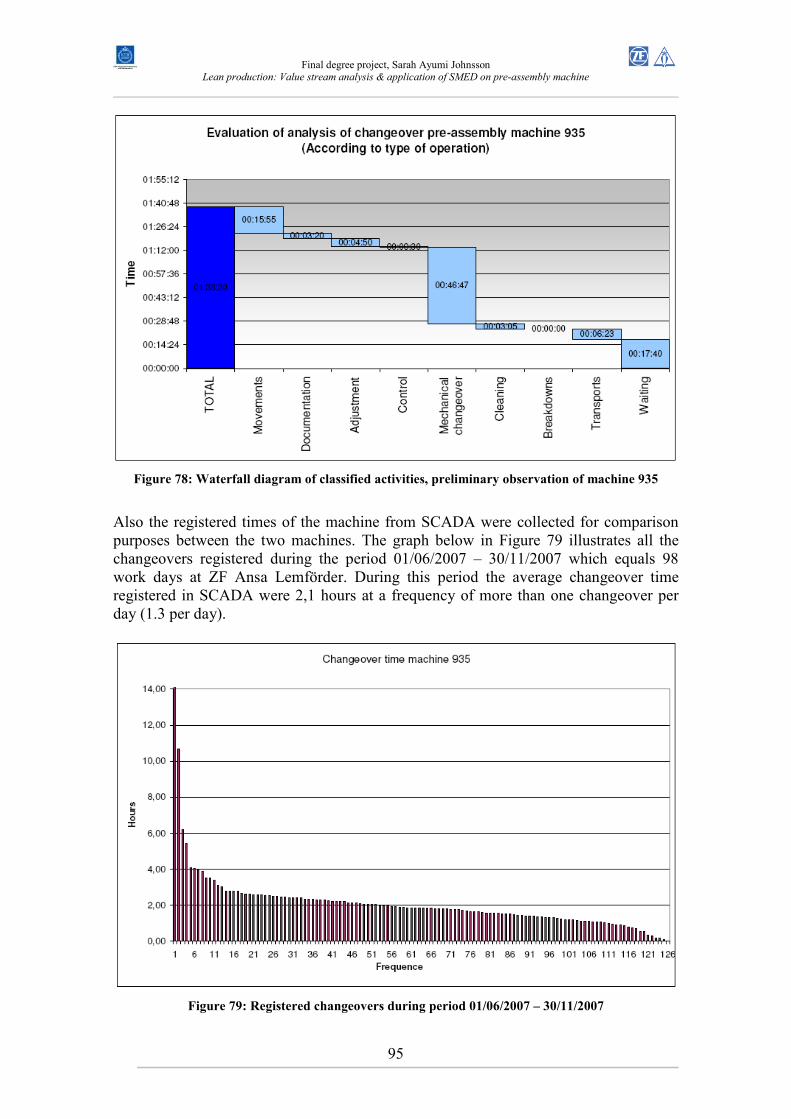
Final degree project, Sarah Ayumi Johnsson
Lean production: Value stream analysis & application of SMED on pre-assembly machine
95
Figure 78: Waterfall diagram of classified activities, preliminary observation of machine 935
Also the registered times of the machine from SCADA were collected for comparison purposes between the two machines. The graph below in Figure 79 illustrates all the changeovers registered during the period 01/06/2007 – 30/11/2007 which equals 98 work days at ZF Ansa Lemförder. During this period the average changeover time registered in SCADA were 2,1 hours at a frequency of more than one changeover per day (1.3 per day).
Figure 79: Registered changeovers during period 01/06/2007 – 30/11/2007
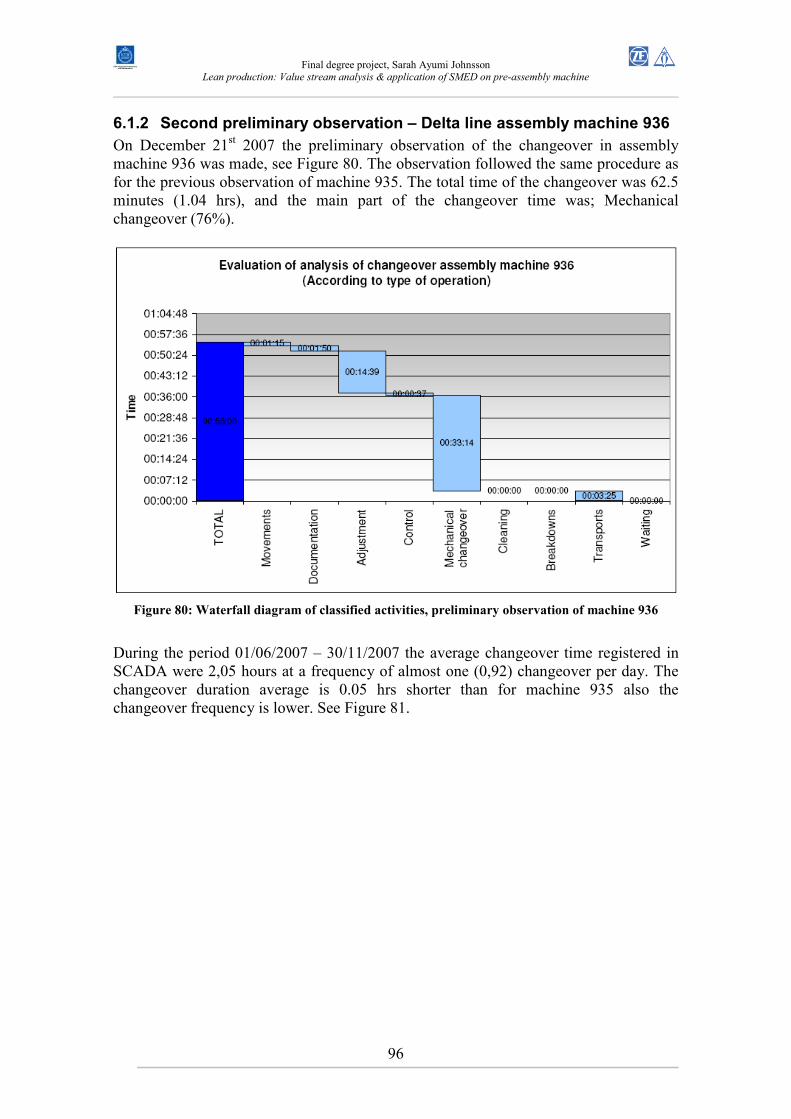
Final degree project, Sarah Ayumi Johnsson
Lean production: Value stream analysis & application of SMED on pre-assembly machine
96
6.1.2 Second preliminary observation – Delta line assembly machine 936
On December 21st 2007 the preliminary observation of the changeover in assembly machine 936 was made, see Figure 80. The observation followed the same procedure as for the previous observation of machine 935. The total time of the changeover was 62.5 minutes (1.04 hrs), and the main part of the changeover time was; Mechanical changeover (76%).
Figure 80: Waterfall diagram of classified activities, preliminary observation of machine 936
During the period 01/06/2007 – 30/11/2007 the average changeover time registered in SCADA were 2,05 hours at a frequency of almost one (0,92) changeover per day. The changeover duration average is 0.05 hrs shorter than for machine 935 also the changeover frequency is lower. See Figure 81.
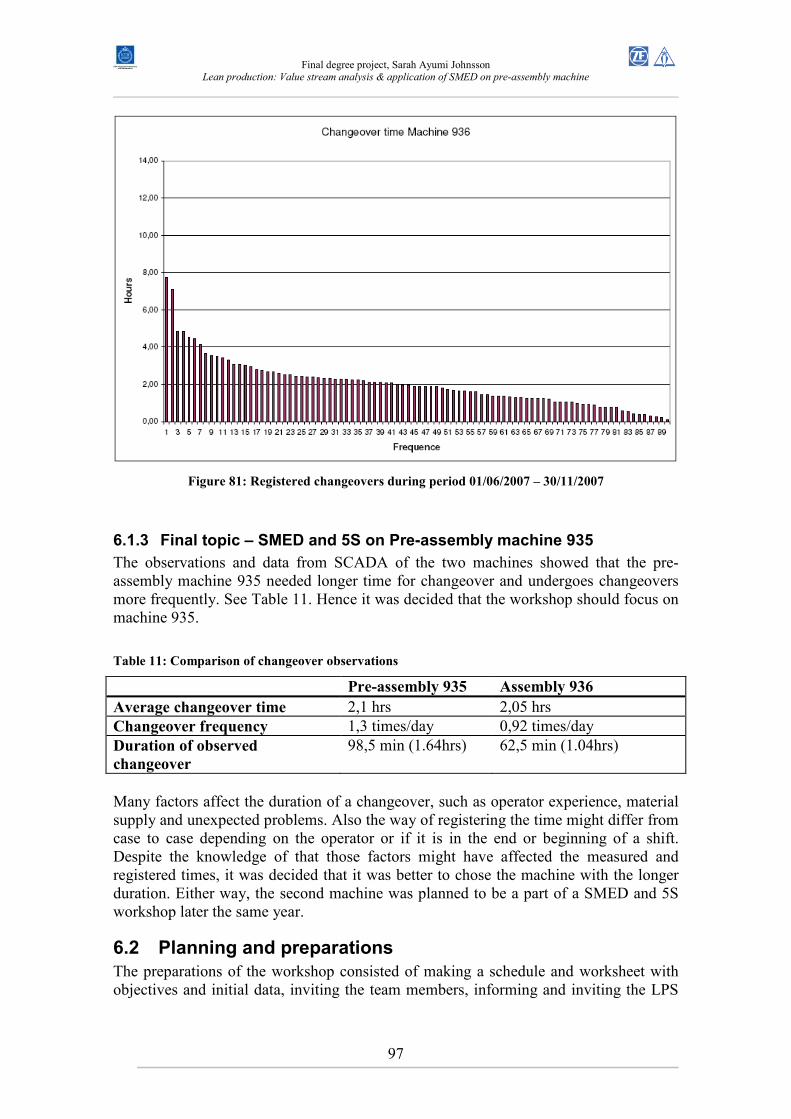
Final degree project, Sarah Ayumi Johnsson
Lean production: Value stream analysis & application of SMED on pre-assembly machine
97
Figure 81: Registered changeovers during period 01/06/2007 – 30/11/2007
6.1.3 Final topic – SMED and 5S on Pre-assembly machine 935
The observations and data from SCADA of the two machines showed that the pre-assembly machine 935 needed longer time for changeover and undergoes changeovers more frequently. See Table 11. Hence it was decided that the workshop should focus on machine 935.
Table 11: Comparison of changeover observations
Pre-assembly 935 Assembly 936
Average changeover time 2,1 hrs 2,05 hrs Changeover frequency 1,3 times/day 0,92 times/day Duration of observed
changeover
98,5 min (1.64hrs) 62,5 min (1.04hrs)
Many factors affect the duration of a changeover, such as operator experience, material supply and unexpected problems. Also the way of registering the time might differ from case to case depending on the operator or if it is in the end or beginning of a shift. Despite the knowledge of that those factors might have affected the measured and registered times, it was decided that it was better to chose the machine with the longer duration. Either way, the second machine was planned to be a part of a SMED and 5S workshop later the same year.
6.2 Planning and preparations
The preparations of the workshop consisted of making a schedule and worksheet with objectives and initial data, inviting the team members, informing and inviting the LPS
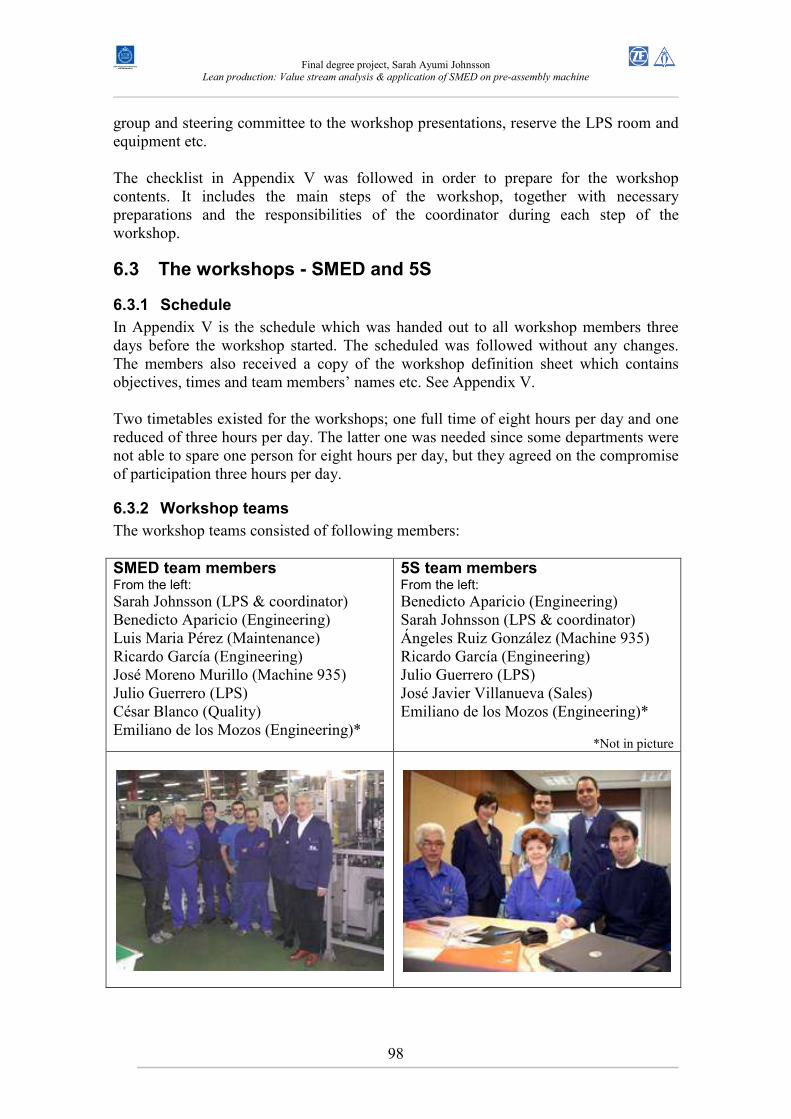
Final degree project, Sarah Ayumi Johnsson
Lean production: Value stream analysis & application of SMED on pre-assembly machine
98
group and steering committee to the workshop presentations, reserve the LPS room and equipment etc. The checklist in Appendix V was followed in order to prepare for the workshop contents. It includes the main steps of the workshop, together with necessary preparations and the responsibilities of the coordinator during each step of the workshop.
6.3 The workshops - SMED and 5S
6.3.1 Schedule
In Appendix V is the schedule which was handed out to all workshop members three days before the workshop started. The scheduled was followed without any changes. The members also received a copy of the workshop definition sheet which contains objectives, times and team members’ names etc. See Appendix V. Two timetables existed for the workshops; one full time of eight hours per day and one reduced of three hours per day. The latter one was needed since some departments were not able to spare one person for eight hours per day, but they agreed on the compromise of participation three hours per day.
6.3.2 Workshop teams
The workshop teams consisted of following members: SMED team members From the left:
Sarah Johnsson (LPS & coordinator) Benedicto Aparicio (Engineering) Luis Maria Pérez (Maintenance) Ricardo García (Engineering) José Moreno Murillo (Machine 935) Julio Guerrero (LPS) César Blanco (Quality) Emiliano de los Mozos (Engineering)*
5S team members From the left:
Benedicto Aparicio (Engineering) Sarah Johnsson (LPS & coordinator) Ángeles Ruiz González (Machine 935) Ricardo García (Engineering) Julio Guerrero (LPS) José Javier Villanueva (Sales) Emiliano de los Mozos (Engineering)*
*Not in picture
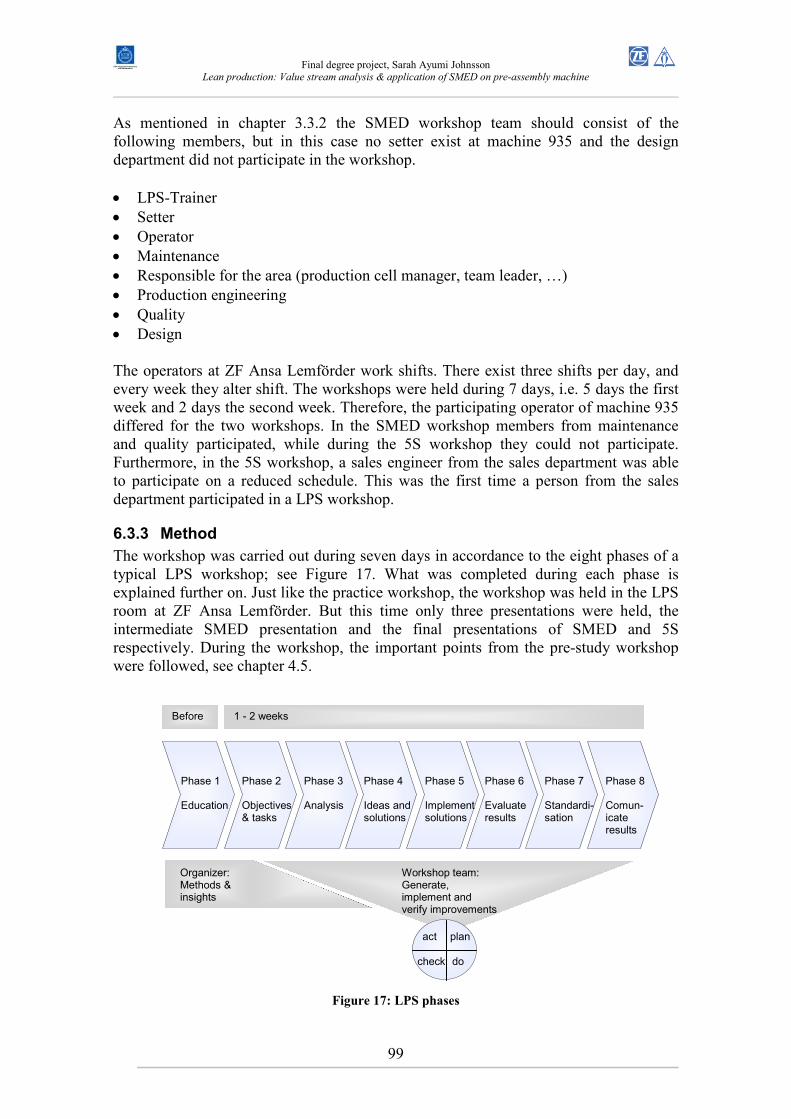
Final degree project, Sarah Ayumi Johnsson
Lean production: Value stream analysis & application of SMED on pre-assembly machine
99
As mentioned in chapter 3.3.2 the SMED workshop team should consist of the following members, but in this case no setter exist at machine 935 and the design department did not participate in the workshop. • LPS-Trainer • Setter • Operator • Maintenance • Responsible for the area (production cell manager, team leader, …) • Production engineering • Quality • Design The operators at ZF Ansa Lemförder work shifts. There exist three shifts per day, and every week they alter shift. The workshops were held during 7 days, i.e. 5 days the first week and 2 days the second week. Therefore, the participating operator of machine 935 differed for the two workshops. In the SMED workshop members from maintenance and quality participated, while during the 5S workshop they could not participate. Furthermore, in the 5S workshop, a sales engineer from the sales department was able to participate on a reduced schedule. This was the first time a person from the sales department participated in a LPS workshop.
6.3.3 Method
The workshop was carried out during seven days in accordance to the eight phases of a typical LPS workshop; see Figure 17. What was completed during each phase is explained further on. Just like the practice workshop, the workshop was held in the LPS room at ZF Ansa Lemförder. But this time only three presentations were held, the intermediate SMED presentation and the final presentations of SMED and 5S respectively. During the workshop, the important points from the pre-study workshop were followed, see chapter 4.5.
Figure 17: LPS phases
Phase 1 Education
Before 1 - 2 weeks
Phase 2 Objectives & tasks
Phase 3 Analysis
Phase 4 Ideas and solutions
Phase 5 Implementsolutions
Phase 6 Evaluate results
Phase 7 Standardi-sation
Phase 8 Comun-icate results
Organizer: Methods & insights
Workshop team: Generate, implement and verify improvements
plan
do check
act
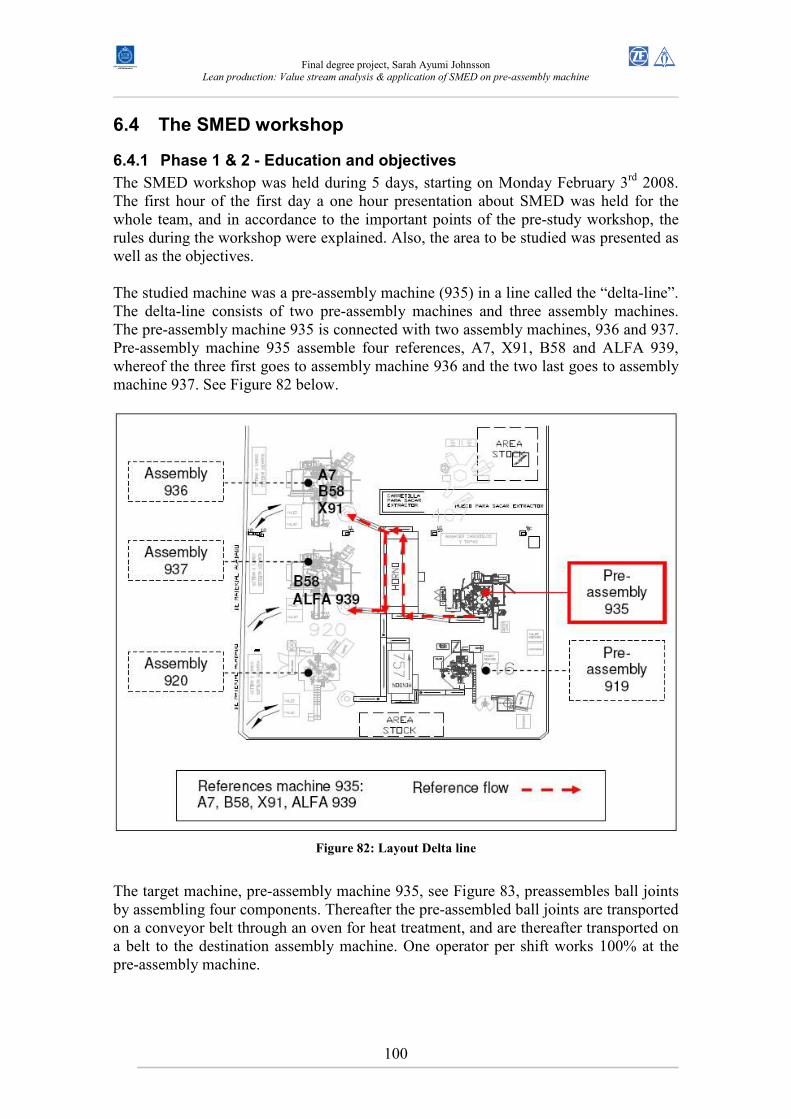
Final degree project, Sarah Ayumi Johnsson
Lean production: Value stream analysis & application of SMED on pre-assembly machine
100
6.4 The SMED workshop
6.4.1 Phase 1 & 2 - Education and objectives
The SMED workshop was held during 5 days, starting on Monday February 3rd 2008. The first hour of the first day a one hour presentation about SMED was held for the whole team, and in accordance to the important points of the pre-study workshop, the rules during the workshop were explained. Also, the area to be studied was presented as well as the objectives. The studied machine was a pre-assembly machine (935) in a line called the “delta-line”. The delta-line consists of two pre-assembly machines and three assembly machines. The pre-assembly machine 935 is connected with two assembly machines, 936 and 937. Pre-assembly machine 935 assemble four references, A7, X91, B58 and ALFA 939, whereof the three first goes to assembly machine 936 and the two last goes to assembly machine 937. See Figure 82 below.
Figure 82: Layout Delta line
The target machine, pre-assembly machine 935, see Figure 83, preassembles ball joints by assembling four components. Thereafter the pre-assembled ball joints are transported on a conveyor belt through an oven for heat treatment, and are thereafter transported on a belt to the destination assembly machine. One operator per shift works 100% at the pre-assembly machine.
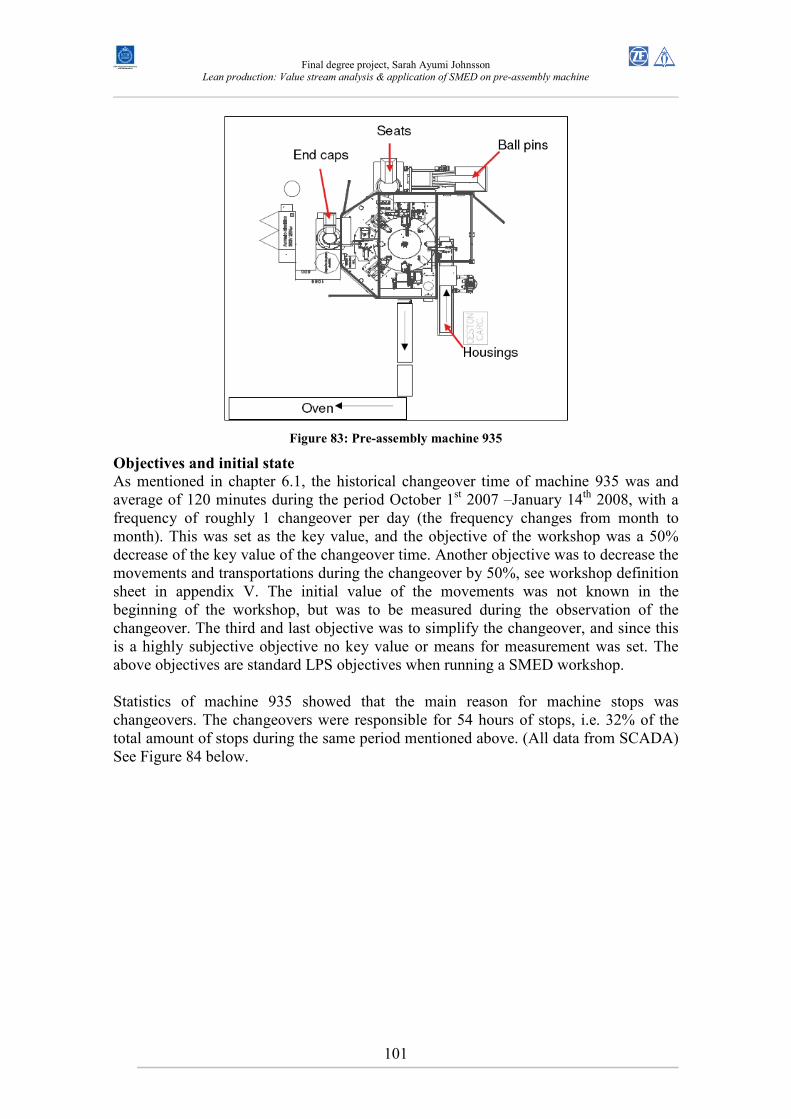
Final degree project, Sarah Ayumi Johnsson
Lean production: Value stream analysis & application of SMED on pre-assembly machine
101
Figure 83: Pre-assembly machine 935
Objectives and initial state
As mentioned in chapter 6.1, the historical changeover time of machine 935 was and average of 120 minutes during the period October 1st 2007 –January 14th 2008, with a frequency of roughly 1 changeover per day (the frequency changes from month to month). This was set as the key value, and the objective of the workshop was a 50% decrease of the key value of the changeover time. Another objective was to decrease the movements and transportations during the changeover by 50%, see workshop definition sheet in appendix V. The initial value of the movements was not known in the beginning of the workshop, but was to be measured during the observation of the changeover. The third and last objective was to simplify the changeover, and since this is a highly subjective objective no key value or means for measurement was set. The above objectives are standard LPS objectives when running a SMED workshop. Statistics of machine 935 showed that the main reason for machine stops was changeovers. The changeovers were responsible for 54 hours of stops, i.e. 32% of the total amount of stops during the same period mentioned above. (All data from SCADA) See Figure 84 below.
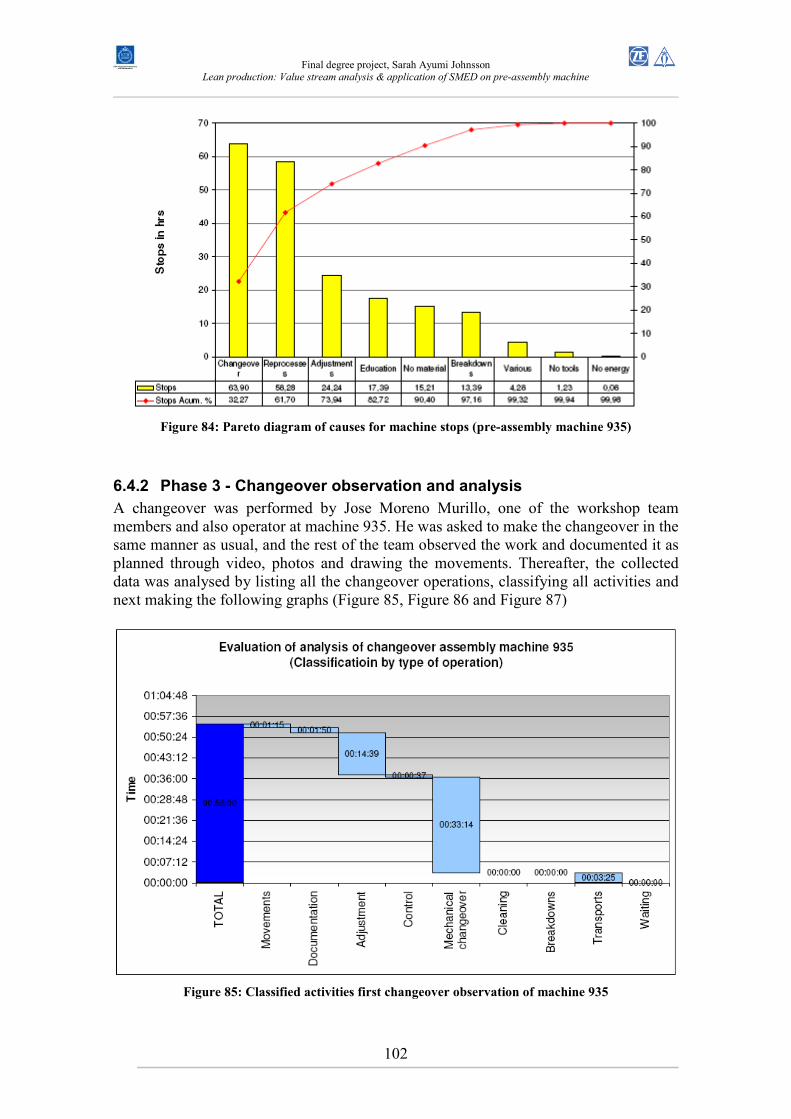
Final degree project, Sarah Ayumi Johnsson
Lean production: Value stream analysis & application of SMED on pre-assembly machine
102
Figure 84: Pareto diagram of causes for machine stops (pre-assembly machine 935)
6.4.2 Phase 3 - Changeover observation and analysis
A changeover was performed by Jose Moreno Murillo, one of the workshop team members and also operator at machine 935. He was asked to make the changeover in the same manner as usual, and the rest of the team observed the work and documented it as planned through video, photos and drawing the movements. Thereafter, the collected data was analysed by listing all the changeover operations, classifying all activities and next making the following graphs (Figure 85, Figure 86 and Figure 87)
Figure 85: Classified activities first changeover observation of machine 935
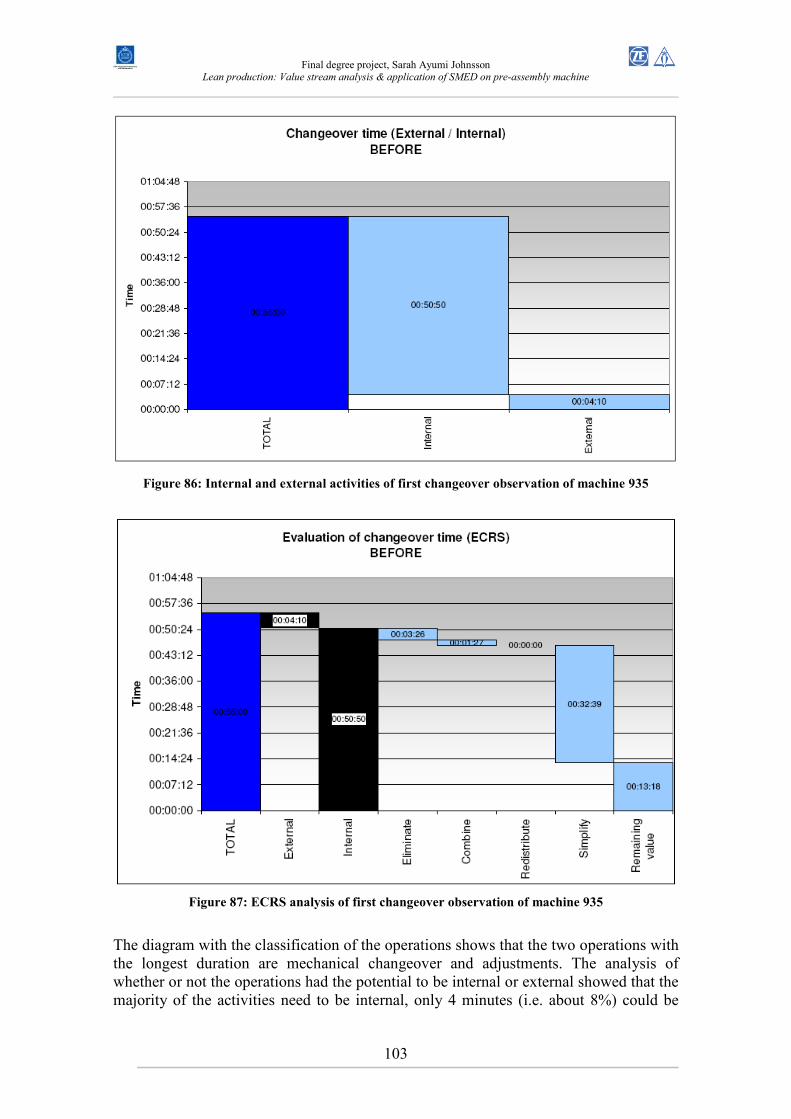
Final degree project, Sarah Ayumi Johnsson
Lean production: Value stream analysis & application of SMED on pre-assembly machine
103
Figure 86: Internal and external activities of first changeover observation of machine 935
Figure 87: ECRS analysis of first changeover observation of machine 935
The diagram with the classification of the operations shows that the two operations with the longest duration are mechanical changeover and adjustments. The analysis of whether or not the operations had the potential to be internal or external showed that the majority of the activities need to be internal, only 4 minutes (i.e. about 8%) could be
Final degree project, Sarah Ayumi Johnsson
Lean production: Value stream analysis & application of SMED on pre-assembly machine
104
converted into external activities. The ECRS analysis shows that the team estimated that several operations could be simplified and a few be eliminated or combined. The spaghetti diagram from the observation showed that the operator had moved 391 meters during the changeover. See appendix V.
6.4.3 Phase 4 & 5 - Problems, tasks and solutions
Looking at the analysis the team started to discuss the main problems causing the long durations of the mechanical changeover and the adjustments. The team was enthusiastic and came up with many ideas without the need of guidance from the coordinator. The analysis showed that there was not one main operation, rather several shorter activities. Therefore, several tasks were created with the hope that the total amount of time savings created by the implementations would be enough to create a decrease. Following are the 16 problems thought of during the workshop, together with tasks and implementations. Problem It is difficult to fasten the guides of the ball pins and seats, very time
consuming to screw down the screws since they are long.
Task Look for alternative systems to tighten the guides for ball pins and seats.
Final solution Rapid changeover washers were added so that the operator does not need to screw down the screws as far down as before. Also, the washers were fastened in the machine by chains to eliminate the risk of loosing the washer during changeover.
Problem While exchanging some tooling inside the machine the operator starts
to take out the eight old ones and thereafter place the eight new ones. The separation of operations (that could be combined) is a waste.
Task Investigate possibility of combine the exchange of tooling Final solution An additional space for putting tooling was created, enabling the
operations to be combined. Problem The emptying of the feeder drums for seats and end caps is time
consuming and sometimes ergonomically incorrect. Task Investigate possibility to empty the feeders of seats and end caps
automatically Final solution The feeder drum for the seats already had an automatic function for
emptying that was not known to the operators; this function was put into the new procedure of the changeover, also a stand was made for placing the box where the seats will exit during emptying. The feeder drum for the end caps also had the same function, but the drum is covered with a sound reducing shell which disables the function of automatically emptying the end cap feeder. But to facilitate the emptying of the feeder a stick with a magnet attached on the end was placed next to the feeder. This makes the work a bit easier.
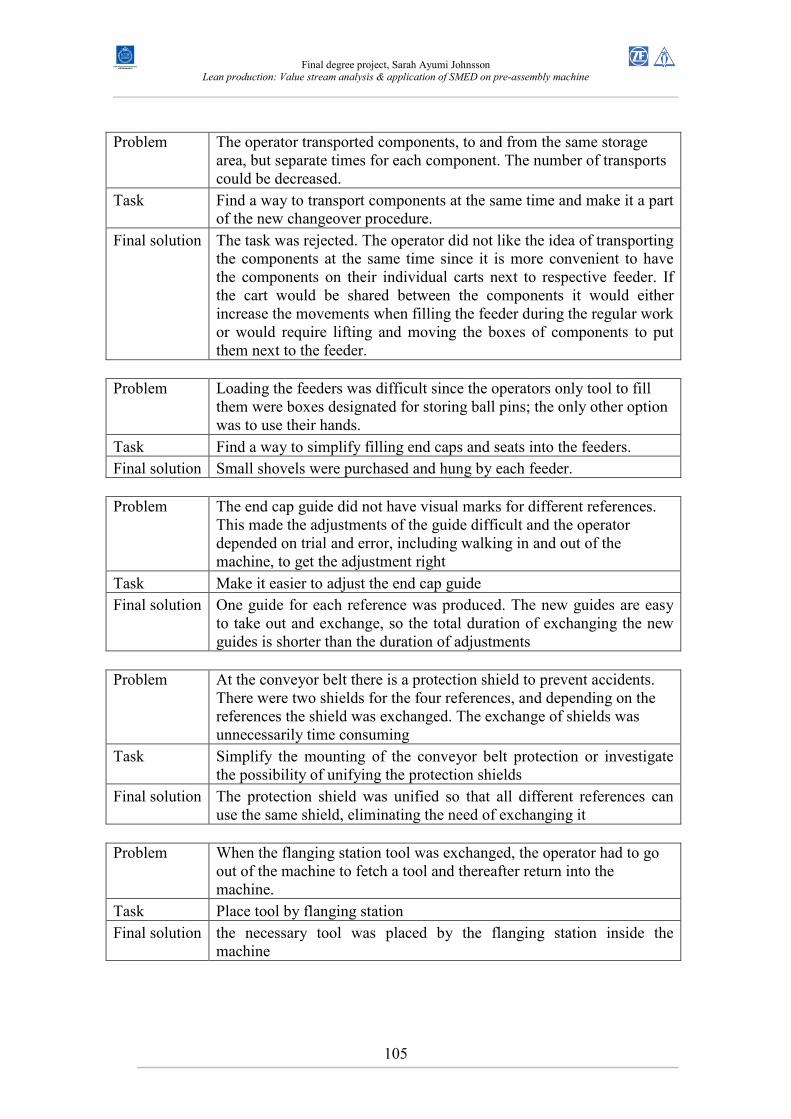
Final degree project, Sarah Ayumi Johnsson
Lean production: Value stream analysis & application of SMED on pre-assembly machine
105
Problem The operator transported components, to and from the same storage
area, but separate times for each component. The number of transports could be decreased.
Task Find a way to transport components at the same time and make it a part of the new changeover procedure.
Final solution The task was rejected. The operator did not like the idea of transporting the components at the same time since it is more convenient to have the components on their individual carts next to respective feeder. If the cart would be shared between the components it would either increase the movements when filling the feeder during the regular work or would require lifting and moving the boxes of components to put them next to the feeder.
Problem Loading the feeders was difficult since the operators only tool to fill
them were boxes designated for storing ball pins; the only other option was to use their hands.
Task Find a way to simplify filling end caps and seats into the feeders. Final solution Small shovels were purchased and hung by each feeder. Problem The end cap guide did not have visual marks for different references.
This made the adjustments of the guide difficult and the operator depended on trial and error, including walking in and out of the machine, to get the adjustment right
Task Make it easier to adjust the end cap guide Final solution One guide for each reference was produced. The new guides are easy
to take out and exchange, so the total duration of exchanging the new guides is shorter than the duration of adjustments
Problem At the conveyor belt there is a protection shield to prevent accidents.
There were two shields for the four references, and depending on the references the shield was exchanged. The exchange of shields was unnecessarily time consuming
Task Simplify the mounting of the conveyor belt protection or investigate the possibility of unifying the protection shields
Final solution The protection shield was unified so that all different references can use the same shield, eliminating the need of exchanging it
Problem When the flanging station tool was exchanged, the operator had to go
out of the machine to fetch a tool and thereafter return into the machine.
Task Place tool by flanging station Final solution the necessary tool was placed by the flanging station inside the
machine
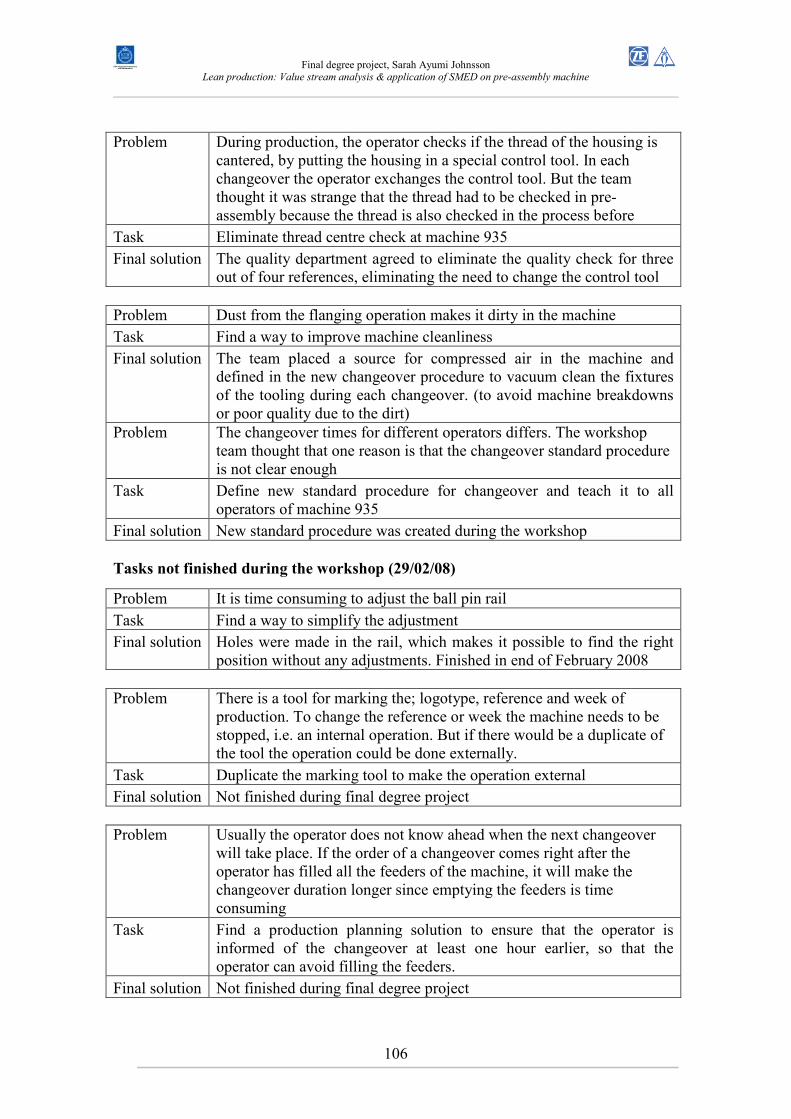
Final degree project, Sarah Ayumi Johnsson
Lean production: Value stream analysis & application of SMED on pre-assembly machine
106
Problem During production, the operator checks if the thread of the housing is
cantered, by putting the housing in a special control tool. In each changeover the operator exchanges the control tool. But the team thought it was strange that the thread had to be checked in pre-assembly because the thread is also checked in the process before
Task Eliminate thread centre check at machine 935 Final solution The quality department agreed to eliminate the quality check for three
out of four references, eliminating the need to change the control tool Problem Dust from the flanging operation makes it dirty in the machine Task Find a way to improve machine cleanliness Final solution The team placed a source for compressed air in the machine and
defined in the new changeover procedure to vacuum clean the fixtures of the tooling during each changeover. (to avoid machine breakdowns or poor quality due to the dirt)
Problem The changeover times for different operators differs. The workshop team thought that one reason is that the changeover standard procedure is not clear enough
Task Define new standard procedure for changeover and teach it to all operators of machine 935
Final solution New standard procedure was created during the workshop Tasks not finished during the workshop (29/02/08)
Problem There is a tool for marking the; logotype, reference and week of
production. To change the reference or week the machine needs to be stopped, i.e. an internal operation. But if there would be a duplicate of the tool the operation could be done externally.
Task Duplicate the marking tool to make the operation external Final solution Not finished during final degree project Problem Usually the operator does not know ahead when the next changeover
will take place. If the order of a changeover comes right after the operator has filled all the feeders of the machine, it will make the changeover duration longer since emptying the feeders is time consuming
Task Find a production planning solution to ensure that the operator is informed of the changeover at least one hour earlier, so that the operator can avoid filling the feeders.
Final solution Not finished during final degree project
Problem It is time consuming to adjust the ball pin rail
Task Find a way to simplify the adjustment Final solution Holes were made in the rail, which makes it possible to find the right
position without any adjustments. Finished in end of February 2008
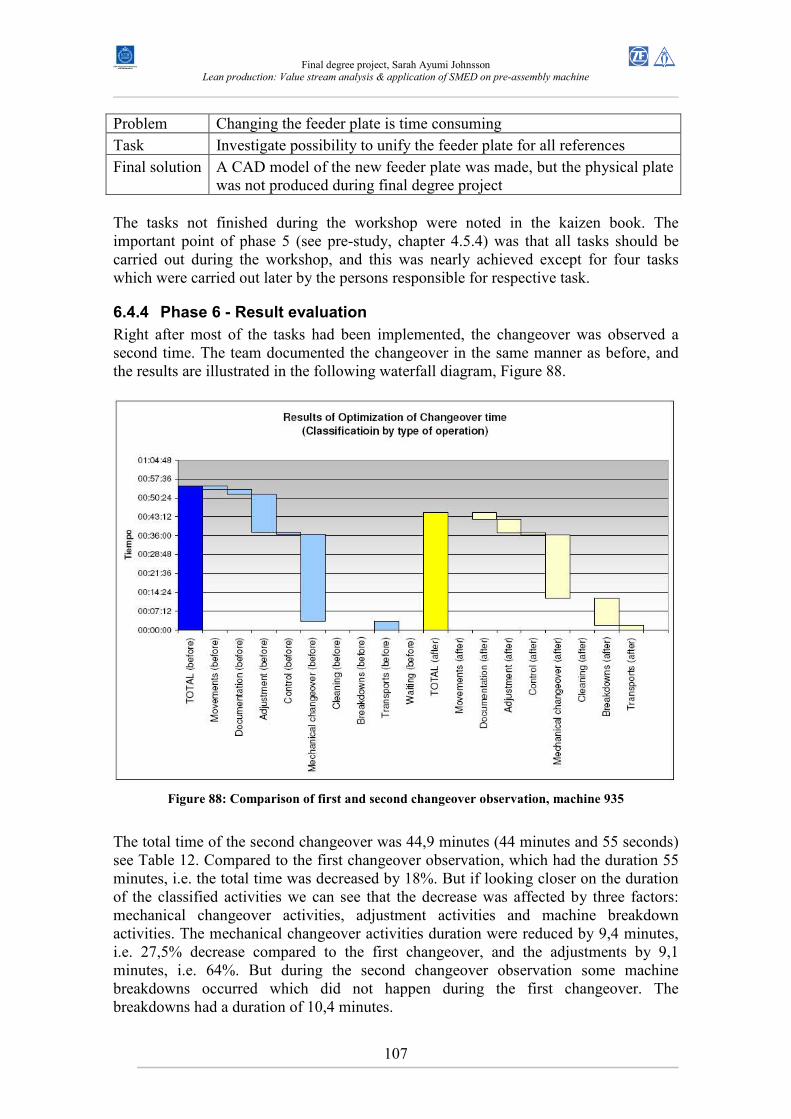
Final degree project, Sarah Ayumi Johnsson
Lean production: Value stream analysis & application of SMED on pre-assembly machine
107
Problem Changing the feeder plate is time consuming Task Investigate possibility to unify the feeder plate for all references Final solution A CAD model of the new feeder plate was made, but the physical plate
was not produced during final degree project The tasks not finished during the workshop were noted in the kaizen book. The important point of phase 5 (see pre-study, chapter 4.5.4) was that all tasks should be carried out during the workshop, and this was nearly achieved except for four tasks which were carried out later by the persons responsible for respective task.
6.4.4 Phase 6 - Result evaluation
Right after most of the tasks had been implemented, the changeover was observed a second time. The team documented the changeover in the same manner as before, and the results are illustrated in the following waterfall diagram, Figure 88.
Figure 88: Comparison of first and second changeover observation, machine 935
The total time of the second changeover was 44,9 minutes (44 minutes and 55 seconds) see Table 12. Compared to the first changeover observation, which had the duration 55 minutes, i.e. the total time was decreased by 18%. But if looking closer on the duration of the classified activities we can see that the decrease was affected by three factors: mechanical changeover activities, adjustment activities and machine breakdown activities. The mechanical changeover activities duration were reduced by 9,4 minutes, i.e. 27,5% decrease compared to the first changeover, and the adjustments by 9,1 minutes, i.e. 64%. But during the second changeover observation some machine breakdowns occurred which did not happen during the first changeover. The breakdowns had a duration of 10,4 minutes.
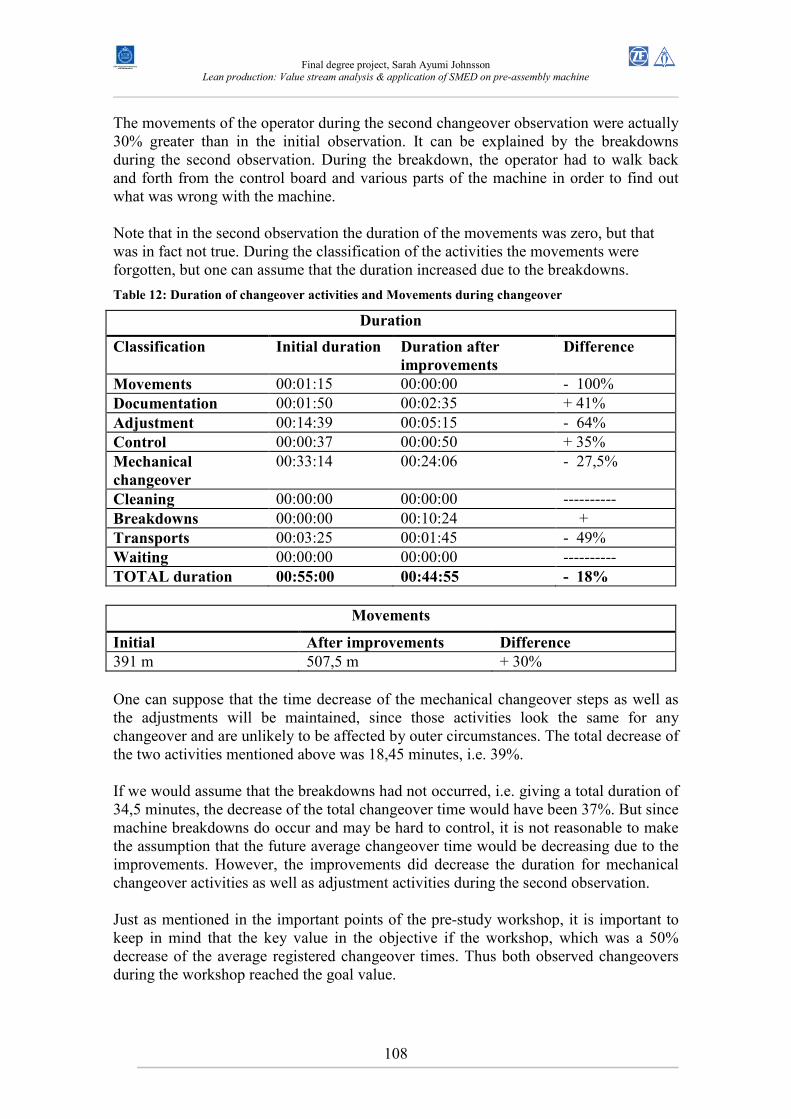
Final degree project, Sarah Ayumi Johnsson
Lean production: Value stream analysis & application of SMED on pre-assembly machine
108
The movements of the operator during the second changeover observation were actually 30% greater than in the initial observation. It can be explained by the breakdowns during the second observation. During the breakdown, the operator had to walk back and forth from the control board and various parts of the machine in order to find out what was wrong with the machine. Note that in the second observation the duration of the movements was zero, but that was in fact not true. During the classification of the activities the movements were forgotten, but one can assume that the duration increased due to the breakdowns.
Table 12: Duration of changeover activities and Movements during changeover
Duration
Classification Initial duration Duration after
improvements
Difference
Movements 00:01:15 00:00:00 - 100% Documentation 00:01:50 00:02:35 + 41% Adjustment 00:14:39 00:05:15 - 64% Control 00:00:37 00:00:50 + 35% Mechanical
changeover
00:33:14 00:24:06 - 27,5%
Cleaning 00:00:00 00:00:00 ---------- Breakdowns 00:00:00 00:10:24 + Transports 00:03:25 00:01:45 - 49% Waiting 00:00:00 00:00:00 ---------- TOTAL duration 00:55:00 00:44:55 - 18%
Movements
Initial After improvements Difference
391 m 507,5 m + 30% One can suppose that the time decrease of the mechanical changeover steps as well as the adjustments will be maintained, since those activities look the same for any changeover and are unlikely to be affected by outer circumstances. The total decrease of the two activities mentioned above was 18,45 minutes, i.e. 39%. If we would assume that the breakdowns had not occurred, i.e. giving a total duration of 34,5 minutes, the decrease of the total changeover time would have been 37%. But since machine breakdowns do occur and may be hard to control, it is not reasonable to make the assumption that the future average changeover time would be decreasing due to the improvements. However, the improvements did decrease the duration for mechanical changeover activities as well as adjustment activities during the second observation. Just as mentioned in the important points of the pre-study workshop, it is important to keep in mind that the key value in the objective if the workshop, which was a 50% decrease of the average registered changeover times. Thus both observed changeovers during the workshop reached the goal value.
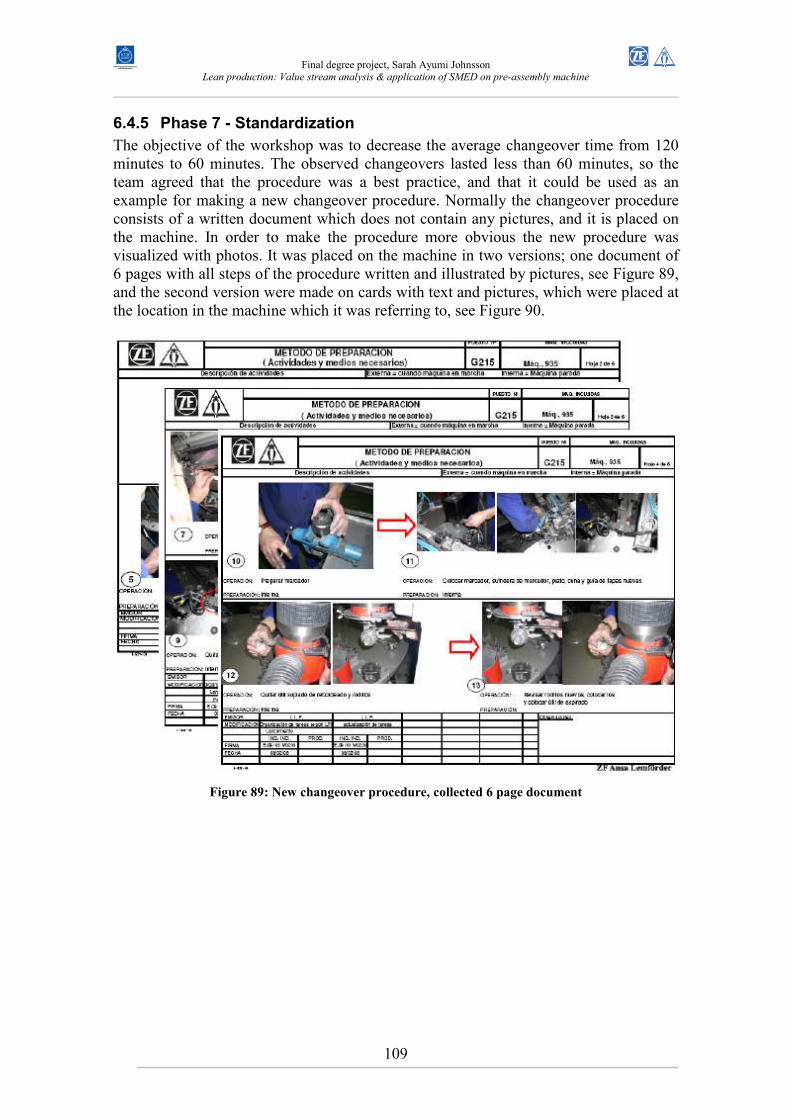
Final degree project, Sarah Ayumi Johnsson
Lean production: Value stream analysis & application of SMED on pre-assembly machine
109
6.4.5 Phase 7 - Standardization
The objective of the workshop was to decrease the average changeover time from 120 minutes to 60 minutes. The observed changeovers lasted less than 60 minutes, so the team agreed that the procedure was a best practice, and that it could be used as an example for making a new changeover procedure. Normally the changeover procedure consists of a written document which does not contain any pictures, and it is placed on the machine. In order to make the procedure more obvious the new procedure was visualized with photos. It was placed on the machine in two versions; one document of 6 pages with all steps of the procedure written and illustrated by pictures, see Figure 89, and the second version were made on cards with text and pictures, which were placed at the location in the machine which it was referring to, see Figure 90.
Figure 89: New changeover procedure, collected 6 page document
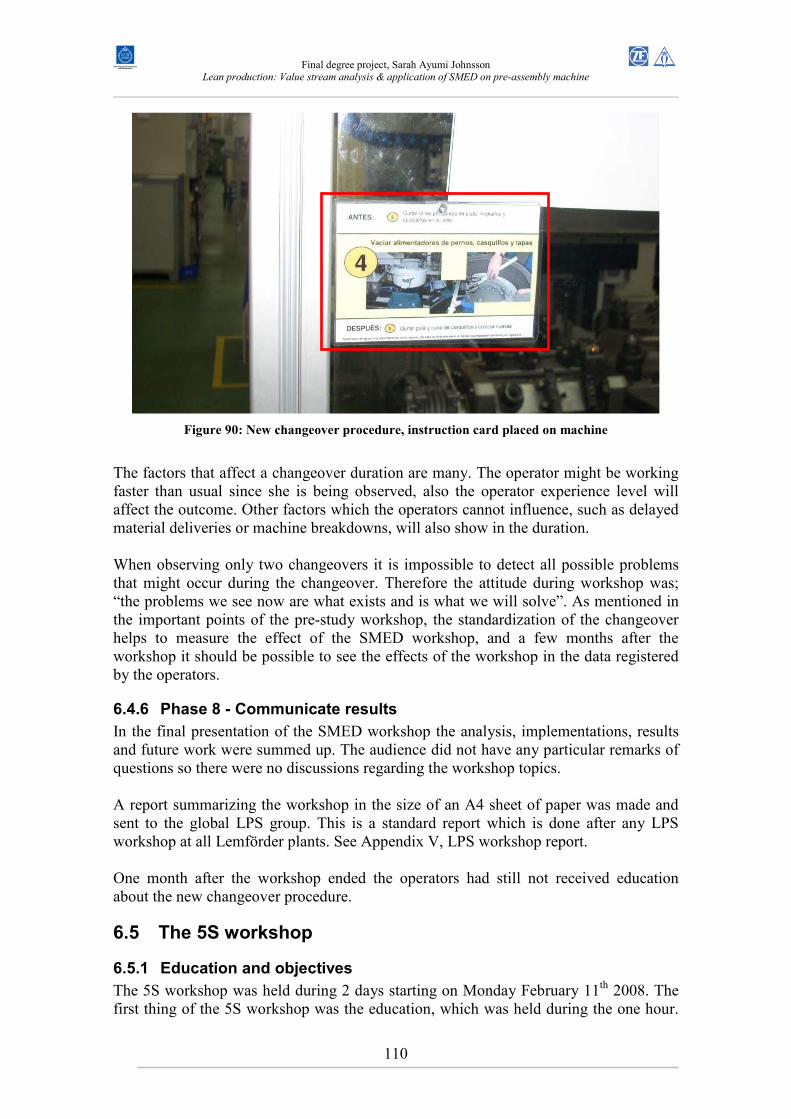
Final degree project, Sarah Ayumi Johnsson
Lean production: Value stream analysis & application of SMED on pre-assembly machine
110
Figure 90: New changeover procedure, instruction card placed on machine
The factors that affect a changeover duration are many. The operator might be working faster than usual since she is being observed, also the operator experience level will affect the outcome. Other factors which the operators cannot influence, such as delayed material deliveries or machine breakdowns, will also show in the duration. When observing only two changeovers it is impossible to detect all possible problems that might occur during the changeover. Therefore the attitude during workshop was; “the problems we see now are what exists and is what we will solve”. As mentioned in the important points of the pre-study workshop, the standardization of the changeover helps to measure the effect of the SMED workshop, and a few months after the workshop it should be possible to see the effects of the workshop in the data registered by the operators.
6.4.6 Phase 8 - Communicate results
In the final presentation of the SMED workshop the analysis, implementations, results and future work were summed up. The audience did not have any particular remarks of questions so there were no discussions regarding the workshop topics. A report summarizing the workshop in the size of an A4 sheet of paper was made and sent to the global LPS group. This is a standard report which is done after any LPS workshop at all Lemförder plants. See Appendix V, LPS workshop report. One month after the workshop ended the operators had still not received education about the new changeover procedure.
6.5 The 5S workshop
6.5.1 Education and objectives
The 5S workshop was held during 2 days starting on Monday February 11th 2008. The first thing of the 5S workshop was the education, which was held during the one hour.
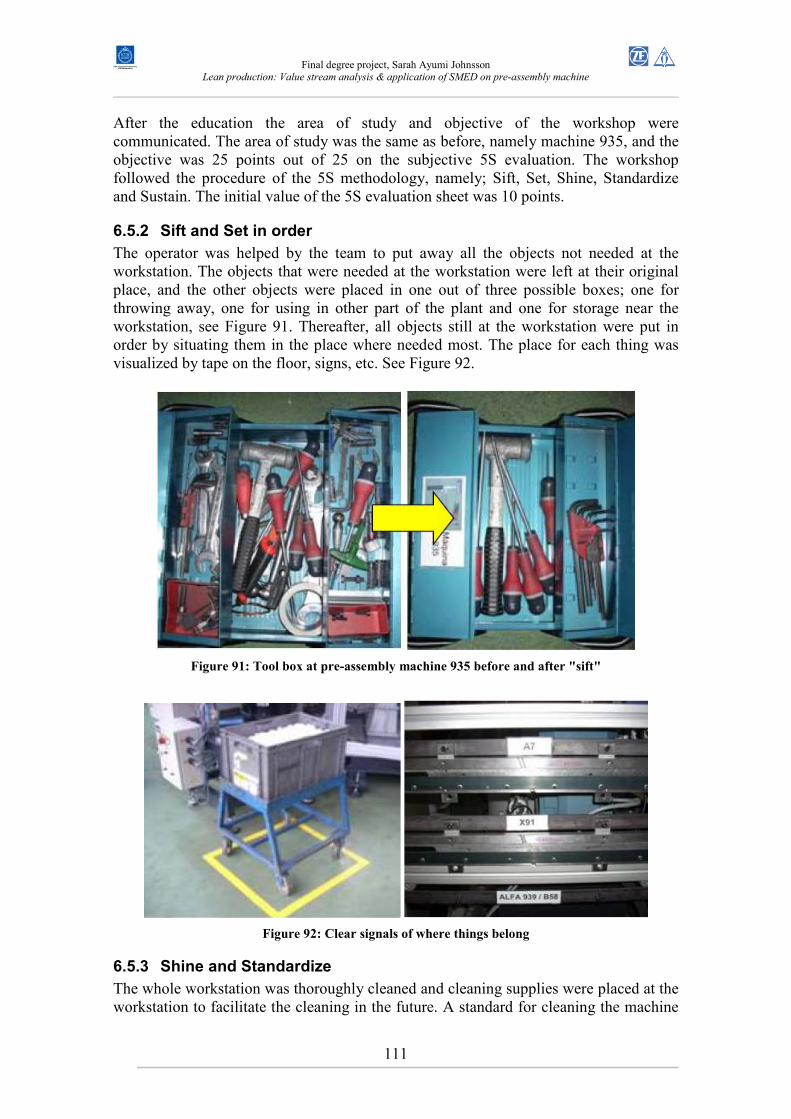
Final degree project, Sarah Ayumi Johnsson
Lean production: Value stream analysis & application of SMED on pre-assembly machine
111
After the education the area of study and objective of the workshop were communicated. The area of study was the same as before, namely machine 935, and the objective was 25 points out of 25 on the subjective 5S evaluation. The workshop followed the procedure of the 5S methodology, namely; Sift, Set, Shine, Standardize and Sustain. The initial value of the 5S evaluation sheet was 10 points.
6.5.2 Sift and Set in order
The operator was helped by the team to put away all the objects not needed at the workstation. The objects that were needed at the workstation were left at their original place, and the other objects were placed in one out of three possible boxes; one for throwing away, one for using in other part of the plant and one for storage near the workstation, see Figure 91. Thereafter, all objects still at the workstation were put in order by situating them in the place where needed most. The place for each thing was visualized by tape on the floor, signs, etc. See Figure 92.
Figure 91: Tool box at pre-assembly machine 935 before and after "sift"
Figure 92: Clear signals of where things belong
6.5.3 Shine and Standardize
The whole workstation was thoroughly cleaned and cleaning supplies were placed at the workstation to facilitate the cleaning in the future. A standard for cleaning the machine
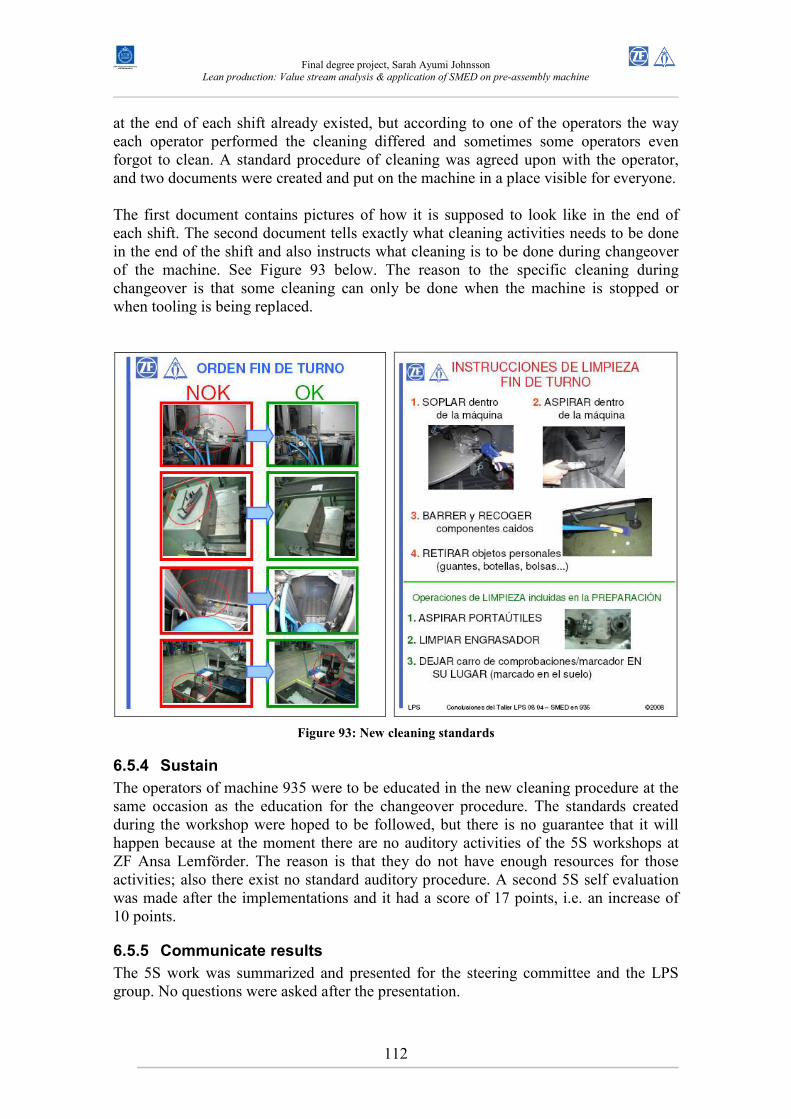
Final degree project, Sarah Ayumi Johnsson
Lean production: Value stream analysis & application of SMED on pre-assembly machine
112
at the end of each shift already existed, but according to one of the operators the way each operator performed the cleaning differed and sometimes some operators even forgot to clean. A standard procedure of cleaning was agreed upon with the operator, and two documents were created and put on the machine in a place visible for everyone. The first document contains pictures of how it is supposed to look like in the end of each shift. The second document tells exactly what cleaning activities needs to be done in the end of the shift and also instructs what cleaning is to be done during changeover of the machine. See Figure 93 below. The reason to the specific cleaning during changeover is that some cleaning can only be done when the machine is stopped or when tooling is being replaced.
Figure 93: New cleaning standards
6.5.4 Sustain
The operators of machine 935 were to be educated in the new cleaning procedure at the same occasion as the education for the changeover procedure. The standards created during the workshop were hoped to be followed, but there is no guarantee that it will happen because at the moment there are no auditory activities of the 5S workshops at ZF Ansa Lemförder. The reason is that they do not have enough resources for those activities; also there exist no standard auditory procedure. A second 5S self evaluation was made after the implementations and it had a score of 17 points, i.e. an increase of 10 points.
6.5.5 Communicate results
The 5S work was summarized and presented for the steering committee and the LPS group. No questions were asked after the presentation.
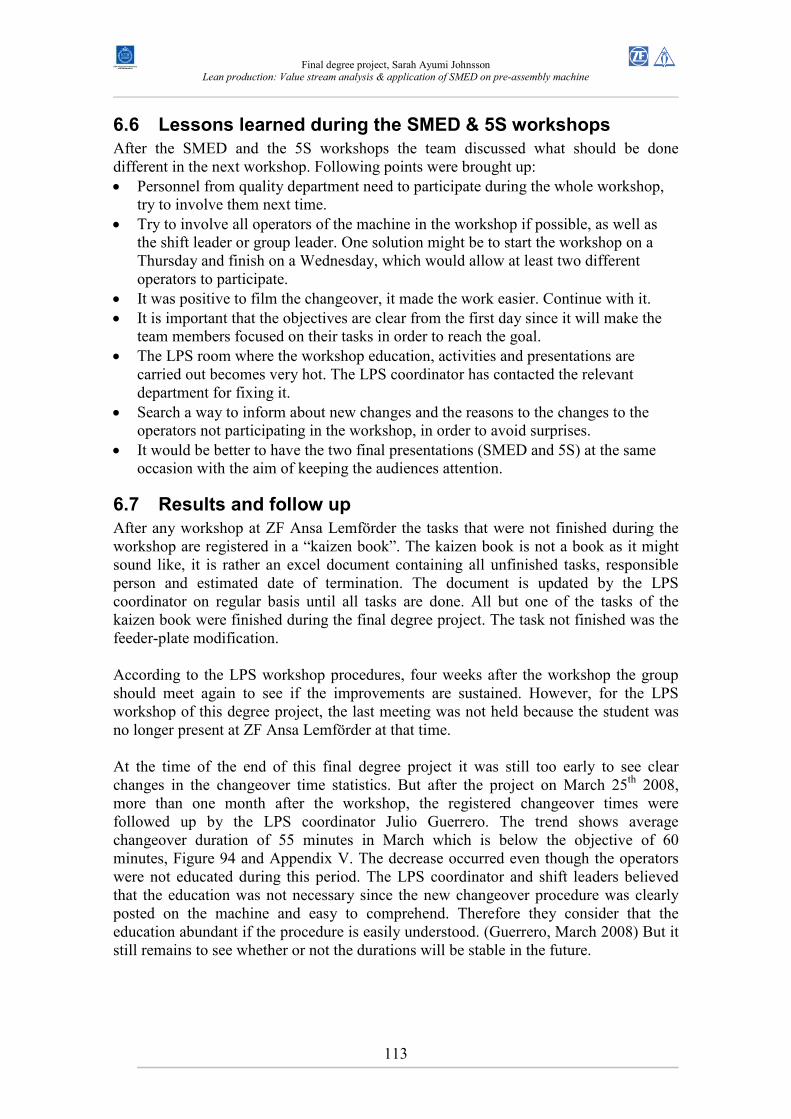
Final degree project, Sarah Ayumi Johnsson
Lean production: Value stream analysis & application of SMED on pre-assembly machine
113
6.6 Lessons learned during the SMED & 5S workshops
After the SMED and the 5S workshops the team discussed what should be done different in the next workshop. Following points were brought up: • Personnel from quality department need to participate during the whole workshop,
try to involve them next time. • Try to involve all operators of the machine in the workshop if possible, as well as
the shift leader or group leader. One solution might be to start the workshop on a Thursday and finish on a Wednesday, which would allow at least two different operators to participate.
• It was positive to film the changeover, it made the work easier. Continue with it. • It is important that the objectives are clear from the first day since it will make the
team members focused on their tasks in order to reach the goal. • The LPS room where the workshop education, activities and presentations are
carried out becomes very hot. The LPS coordinator has contacted the relevant department for fixing it.
• Search a way to inform about new changes and the reasons to the changes to the operators not participating in the workshop, in order to avoid surprises.
• It would be better to have the two final presentations (SMED and 5S) at the same occasion with the aim of keeping the audiences attention.
6.7 Results and follow up
After any workshop at ZF Ansa Lemförder the tasks that were not finished during the workshop are registered in a “kaizen book”. The kaizen book is not a book as it might sound like, it is rather an excel document containing all unfinished tasks, responsible person and estimated date of termination. The document is updated by the LPS coordinator on regular basis until all tasks are done. All but one of the tasks of the kaizen book were finished during the final degree project. The task not finished was the feeder-plate modification. According to the LPS workshop procedures, four weeks after the workshop the group should meet again to see if the improvements are sustained. However, for the LPS workshop of this degree project, the last meeting was not held because the student was no longer present at ZF Ansa Lemförder at that time. At the time of the end of this final degree project it was still too early to see clear changes in the changeover time statistics. But after the project on March 25th 2008, more than one month after the workshop, the registered changeover times were followed up by the LPS coordinator Julio Guerrero. The trend shows average changeover duration of 55 minutes in March which is below the objective of 60 minutes, Figure 94 and Appendix V. The decrease occurred even though the operators were not educated during this period. The LPS coordinator and shift leaders believed that the education was not necessary since the new changeover procedure was clearly posted on the machine and easy to comprehend. Therefore they consider that the education abundant if the procedure is easily understood. (Guerrero, March 2008) But it still remains to see whether or not the durations will be stable in the future.
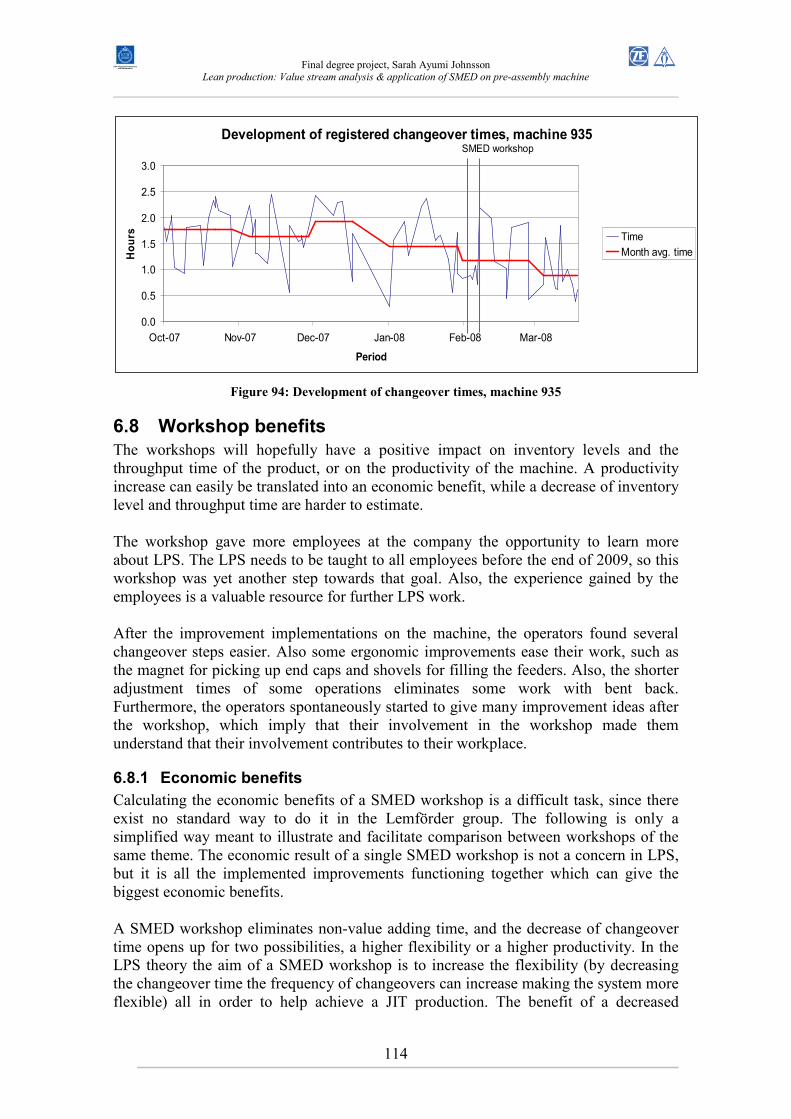
Final degree project, Sarah Ayumi Johnsson
Lean production: Value stream analysis & application of SMED on pre-assembly machine
114
Development of registered changeover times, machine 935
0.0
0.5
1.0
1.5
2.0
2.5
3.0
Oct-07 Nov-07 Dec-07 Jan-08 Feb-08 Mar-08
Period
Hours Time
Month avg. time
SMED workshop
Figure 94: Development of changeover times, machine 935
6.8 Workshop benefits
The workshops will hopefully have a positive impact on inventory levels and the throughput time of the product, or on the productivity of the machine. A productivity increase can easily be translated into an economic benefit, while a decrease of inventory level and throughput time are harder to estimate. The workshop gave more employees at the company the opportunity to learn more about LPS. The LPS needs to be taught to all employees before the end of 2009, so this workshop was yet another step towards that goal. Also, the experience gained by the employees is a valuable resource for further LPS work. After the improvement implementations on the machine, the operators found several changeover steps easier. Also some ergonomic improvements ease their work, such as the magnet for picking up end caps and shovels for filling the feeders. Also, the shorter adjustment times of some operations eliminates some work with bent back. Furthermore, the operators spontaneously started to give many improvement ideas after the workshop, which imply that their involvement in the workshop made them understand that their involvement contributes to their workplace.
6.8.1 Economic benefits
Calculating the economic benefits of a SMED workshop is a difficult task, since there exist no standard way to do it in the Lemförder group. The following is only a simplified way meant to illustrate and facilitate comparison between workshops of the same theme. The economic result of a single SMED workshop is not a concern in LPS, but it is all the implemented improvements functioning together which can give the biggest economic benefits. A SMED workshop eliminates non-value adding time, and the decrease of changeover time opens up for two possibilities, a higher flexibility or a higher productivity. In the LPS theory the aim of a SMED workshop is to increase the flexibility (by decreasing the changeover time the frequency of changeovers can increase making the system more flexible) all in order to help achieve a JIT production. The benefit of a decreased
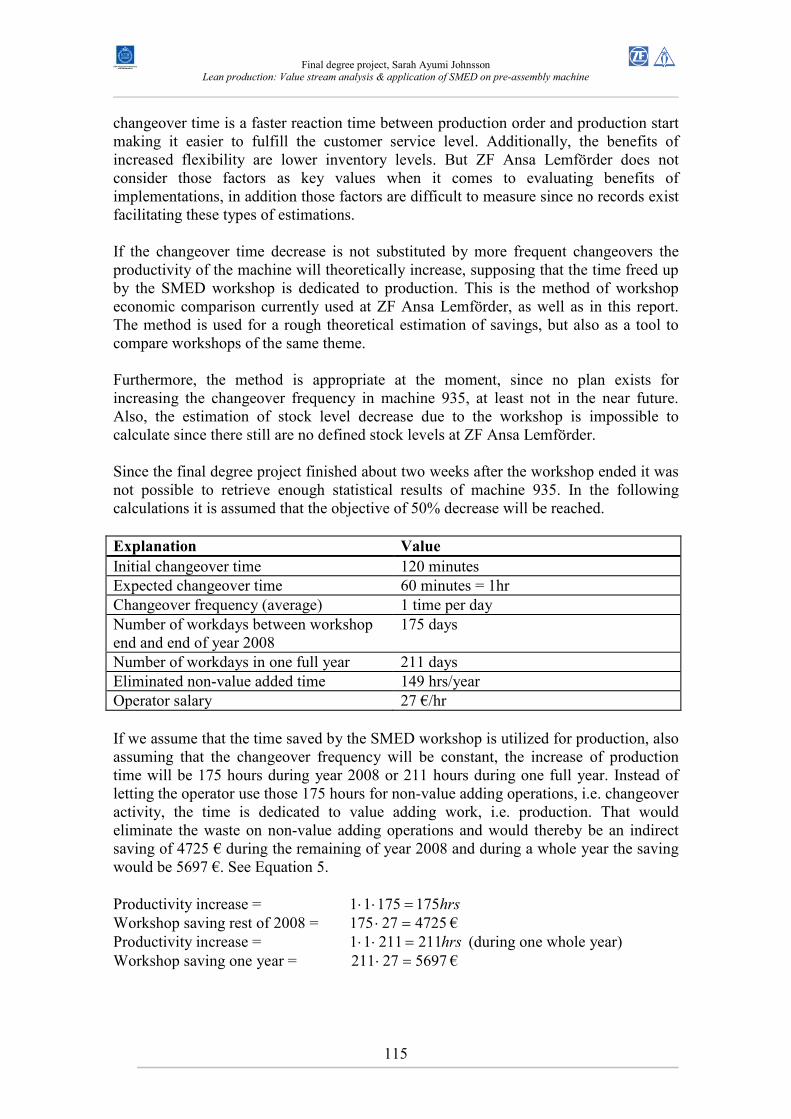
Final degree project, Sarah Ayumi Johnsson
Lean production: Value stream analysis & application of SMED on pre-assembly machine
115
changeover time is a faster reaction time between production order and production start making it easier to fulfill the customer service level. Additionally, the benefits of increased flexibility are lower inventory levels. But ZF Ansa Lemförder does not consider those factors as key values when it comes to evaluating benefits of implementations, in addition those factors are difficult to measure since no records exist facilitating these types of estimations. If the changeover time decrease is not substituted by more frequent changeovers the productivity of the machine will theoretically increase, supposing that the time freed up by the SMED workshop is dedicated to production. This is the method of workshop economic comparison currently used at ZF Ansa Lemförder, as well as in this report. The method is used for a rough theoretical estimation of savings, but also as a tool to compare workshops of the same theme. Furthermore, the method is appropriate at the moment, since no plan exists for increasing the changeover frequency in machine 935, at least not in the near future. Also, the estimation of stock level decrease due to the workshop is impossible to calculate since there still are no defined stock levels at ZF Ansa Lemförder. Since the final degree project finished about two weeks after the workshop ended it was not possible to retrieve enough statistical results of machine 935. In the following calculations it is assumed that the objective of 50% decrease will be reached. Explanation Value
Initial changeover time 120 minutes Expected changeover time 60 minutes = 1hr Changeover frequency (average) 1 time per day Number of workdays between workshop end and end of year 2008
175 days
Number of workdays in one full year 211 days Eliminated non-value added time 149 hrs/year Operator salary 27 €/hr If we assume that the time saved by the SMED workshop is utilized for production, also assuming that the changeover frequency will be constant, the increase of production time will be 175 hours during year 2008 or 211 hours during one full year. Instead of letting the operator use those 175 hours for non-value adding operations, i.e. changeover activity, the time is dedicated to value adding work, i.e. production. That would eliminate the waste on non-value adding operations and would thereby be an indirect saving of 4725 € during the remaining of year 2008 and during a whole year the saving would be 5697 €. See Equation 5. Productivity increase = hrs17517511 =⋅⋅ Workshop saving rest of 2008 = 472527175 =⋅ € Productivity increase = hrs21121111 =⋅⋅ (during one whole year) Workshop saving one year = 569727211 =⋅ €
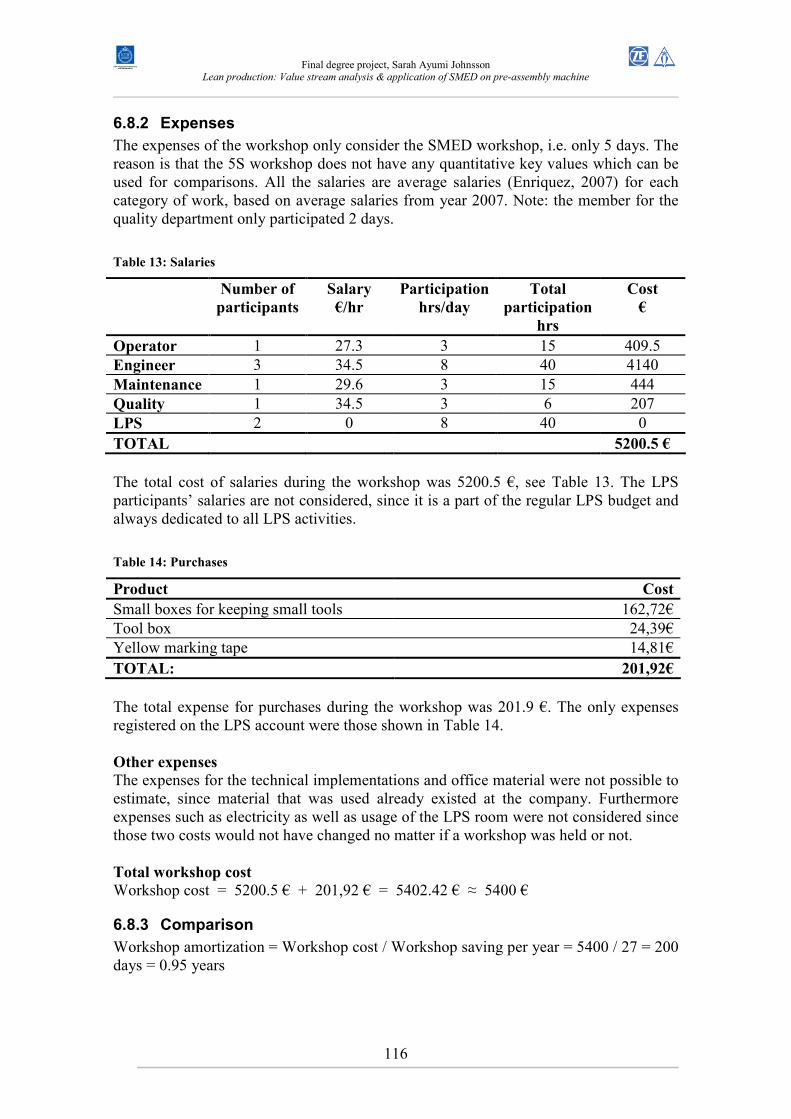
Final degree project, Sarah Ayumi Johnsson
Lean production: Value stream analysis & application of SMED on pre-assembly machine
116
6.8.2 Expenses
The expenses of the workshop only consider the SMED workshop, i.e. only 5 days. The reason is that the 5S workshop does not have any quantitative key values which can be used for comparisons. All the salaries are average salaries (Enriquez, 2007) for each category of work, based on average salaries from year 2007. Note: the member for the quality department only participated 2 days.
Table 13: Salaries
Number of
participants
Salary
€/hr
Participation
hrs/day
Total
participation
hrs
Cost
€
Operator 1 27.3 3 15 409.5 Engineer 3 34.5 8 40 4140 Maintenance 1 29.6 3 15 444 Quality 1 34.5 3 6 207 LPS 2 0 8 40 0 TOTAL 5200.5 €
The total cost of salaries during the workshop was 5200.5 €, see Table 13. The LPS participants’ salaries are not considered, since it is a part of the regular LPS budget and always dedicated to all LPS activities.
Table 14: Purchases
Product Cost
Small boxes for keeping small tools 162,72€ Tool box 24,39€ Yellow marking tape 14,81€ TOTAL: 201,92€
The total expense for purchases during the workshop was 201.9 €. The only expenses registered on the LPS account were those shown in Table 14. Other expenses
The expenses for the technical implementations and office material were not possible to estimate, since material that was used already existed at the company. Furthermore expenses such as electricity as well as usage of the LPS room were not considered since those two costs would not have changed no matter if a workshop was held or not. Total workshop cost
Workshop cost = 5200.5 € + 201,92 € = 5402.42 € ≈ 5400 €
6.8.3 Comparison
Workshop amortization = Workshop cost / Workshop saving per year = 5400 / 27 = 200 days = 0.95 years

Final degree project, Sarah Ayumi Johnsson
Lean production: Value stream analysis & application of SMED on pre-assembly machine
117
The time for amortization of the workshop will approximately be one year (200 days). That is a relatively long time, but it is important to remind and point out that the actual savings gained from the workshop are very difficult to estimate correctly. A SMED workshop might not show any immediate economical benefits, but the actual winning lies in the possibility of making the whole production chain lean through continuous improvements.
Final degree project, Sarah Ayumi Johnsson
Lean production: Value stream analysis & application of SMED on pre-assembly machine
118
7 CONCLUSIONS AND RECOMMENDATIONS
7.1 Conclusions of the final degree projects
Goal
The goal of this final degree project was to: 1. Find the main problems of the production of the eight highest volume products 2. Select LPS tools/solutions which can solve those problems 3. Successfully implement the most relevant solution through a LPS workshop. The two first goals were reached during the final degree project. At the end of the degree project it was still too early to say whether or not the third goal was reached, since a long period of time is needed to determine the real results of a LPS workshop. Desired conclusion
The desired conclusion was that one of at the time biggest production problems would be found and successfully eliminated by using the LPS philosophy and tools. The biggest problems of the production were found through a value stream analysis and a subjective ranking made by the LPS group of the company. The problem area perceived as the most important was focused on in the LPS workshop. As mentioned earlier, it was too early to state if the workshop was a success or not. Expected result and usage
The expected results of the degree project were: • If internal deliveries of heavy components is the biggest problem
� Result: reduced stock and lead time, leading to released capital • If another problem is bigger, the expected result will be stated in the implementation
phase of the final degree project. The internal deliveries of heavy components were not found to be the most important problem at the time, based on the subjective ranking of the LPS group, see chapter 5.3.1. The area that was focused on was the changeover time of a pre-assembly machine, and the objective was a 50% decrease. The planned uses of the final results were: • Ideas for future LPS activities • Knowledge and know-how for future LPS activities During the analysis phase of the degree project many ideas for LPS workshops were created. The results and procedures are documented in this report which was handed in to the company. Tasks
In the pre-study chapter “tasks”, chapter 1.1.3, the tasks were not clearly stated, instead following questions were asked and the tasks were stated in the schedule of the final
Final degree project, Sarah Ayumi Johnsson
Lean production: Value stream analysis & application of SMED on pre-assembly machine
119
degree project, see Appendix I. The answer to the questions can be found in the chapters denoted in brackets in the end of each question. Questions to be answered: • What does the current system look like for the 8 most sold products? (Appendix II
and III) • What are the main problems? (5.3.1) • Is the internal delivery system the main problem? (no)
� If answer is no: • Which LPS tools can be used to solve the problem? (5.3.1) • Which LPS tools should be used in the workshop executed by the
student? (6.1.3) � If answer is yes:
• What is the main problem? • Which LPS tools can be used to solve the problem? • Which LPS tools should be used in the workshop executed by the
student? • What will be the targets and objectives of the workshop? (6.4.1) • How much would it cost to make the changes? (not answered) • How much money can be saved if changes are made? (5.3.1) • How can the changes be standardized in order to maintain the result? (6.4.5) The question “How much would it cost to make the changes” was not investigated prior to the execution of the workshop since it was not possible to predict the specific solutions that would be created. Instead an economic study was made after the workshop, estimating the cost of the workshop, see chapter 6.8. Note - incorrectly asked questions:
Three months into the final degree project, it was realized that the “questions to be answered” were not correctly expressed. The question “Is the internal delivery system the main problem” was too specific, since the aim was to get a more general idea of the problems. The question was asked after discussions about the project topic with the company supervisor, who had suggested that the internal delivery system would be an interesting area to focus on. Believing that the analysis might lead to the conclusion that the internal delivery system was the main problem, the question was written in the pre-study. But it is important to say that the internal delivery system is one big part which the LPS focus on, and the system can be broken down into several sub problems. For instance, the rates of the internal deliveries are affected by factors such as changeover times, demand, deliveries, etc. Thereby one could say that all LPS related work are somehow connected to the internal deliveries, but also that it is the entire chain of processes and systems working together which affects the production output.
7.2 Conclusions and recommendations of the Analysis
The value stream maps created in the beginning of the project were used as a base for creating the list of workshop proposals. The list was ranked through a combination of
Final degree project, Sarah Ayumi Johnsson
Lean production: Value stream analysis & application of SMED on pre-assembly machine
120
mainly subjective votes and some possible economic benefits, and the outcome of the list was the planning of the improvement work of year 2008. The method of ranking the list by using mainly subjective votes was a necessity. As mentioned earlier there exists no standard manner of comparing the possible impact of a workshop in the LPS, since it is impossible to make a correct estimation what the result will be, but also because the impact of two distinct workshops can have very distinct outcomes. The choice of area to focus the LPS activities on can be based on the production data collected from the processes, such as changeover times, productivity or inventory sizes. But the data from SCADA or SAP does not reveal problems in the production process. A value stream analysis helped to make the problems more visible, but since the value stream map is a snapshot of the production it does not reveal all problems. In the case of this final degree project, the student made the value stream analysis and at that time she did not have much knowledge about the processes, thereby there was an increased risk of missing important problems during the mapping. But since the LPS group participated in the decision of which LPS activities to do and where to do them, as well as gave proposals of workshop topics, the likelihood of choosing the areas which would have the greatest impact increased. During the final degree project the student was asked to estimate appropriate levels of regulated inventories needed in the processes of the 8 investigated references. This was not possible due to lack of necessary data which were batch sizes, delivery frequency, order pickup frequency and safety stock size, see chapter 3.3.4. It is recommended that the mentioned premises are established before implementing regulated inventories, which can be done using the methods for implementing supermarkets including Equation 6 to Equation 11 explained in chapter 3.3.4 starting on page 56. Supermarkets are necessary for implementing pull, and since there may be a need of organisational changes to implement supermarkets; it might be a good idea to set the maximum and minimum levels of stocks in connection to the execution of a PULL workshop.
7.3 Results and recommendations of the Workshop
Results
The objective of the SMED workshop was a 50% decrease of the changeover time, from an average of 120 minutes to 60 minutes in the registered times in SCADA. During the workshop two changeovers were observed, one initial and one after improvements had been implemented. The difference between the two observations was an 18% decrease of the total time. See Table 15. Within the total time the activities “adjustments” and “mechanical changeover” took up the largest part in both changeover observations, and they had the total initial duration of 47,88 minutes and after the improvements their total duration was 29,35 minutes. Thus a decrease of 18,53 minutes (-39%). But in the second observation, there was a 10,4 minutes duration caused by “breakdowns” while in the first observation no breakdowns occurred. The movements of the operator during the first observation were
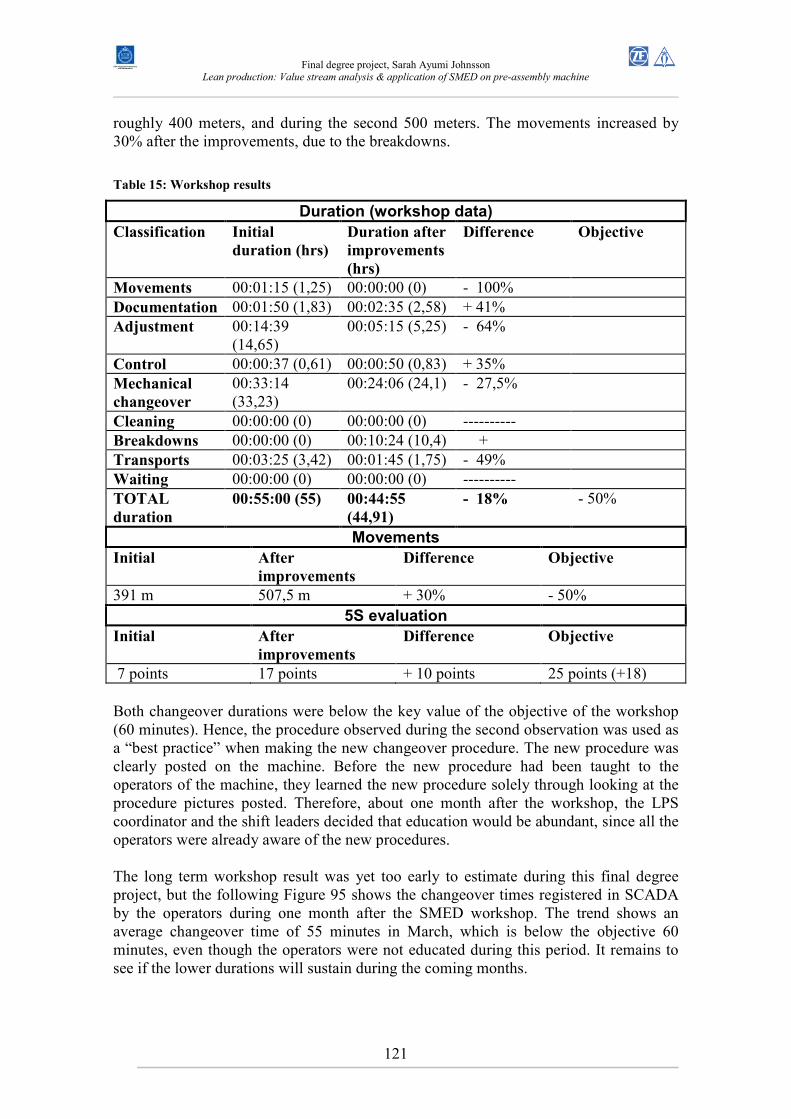
Final degree project, Sarah Ayumi Johnsson
Lean production: Value stream analysis & application of SMED on pre-assembly machine
121
roughly 400 meters, and during the second 500 meters. The movements increased by 30% after the improvements, due to the breakdowns.
Table 15: Workshop results
Duration (workshop data)
Classification Initial
duration (hrs)
Duration after
improvements
(hrs)
Difference Objective
Movements 00:01:15 (1,25) 00:00:00 (0) - 100% Documentation 00:01:50 (1,83) 00:02:35 (2,58) + 41% Adjustment 00:14:39
(14,65) 00:05:15 (5,25) - 64%
Control 00:00:37 (0,61) 00:00:50 (0,83) + 35% Mechanical
changeover
00:33:14 (33,23)
00:24:06 (24,1) - 27,5%
Cleaning 00:00:00 (0) 00:00:00 (0) ---------- Breakdowns 00:00:00 (0) 00:10:24 (10,4) + Transports 00:03:25 (3,42) 00:01:45 (1,75) - 49% Waiting 00:00:00 (0) 00:00:00 (0) ---------- TOTAL
duration
00:55:00 (55) 00:44:55
(44,91)
- 18% - 50%
Movements
Initial After
improvements
Difference Objective
391 m 507,5 m + 30% - 50% 5S evaluation
Initial After
improvements
Difference Objective
7 points 17 points + 10 points 25 points (+18) Both changeover durations were below the key value of the objective of the workshop (60 minutes). Hence, the procedure observed during the second observation was used as a “best practice” when making the new changeover procedure. The new procedure was clearly posted on the machine. Before the new procedure had been taught to the operators of the machine, they learned the new procedure solely through looking at the procedure pictures posted. Therefore, about one month after the workshop, the LPS coordinator and the shift leaders decided that education would be abundant, since all the operators were already aware of the new procedures. The long term workshop result was yet too early to estimate during this final degree project, but the following Figure 95 shows the changeover times registered in SCADA by the operators during one month after the SMED workshop. The trend shows an average changeover time of 55 minutes in March, which is below the objective 60 minutes, even though the operators were not educated during this period. It remains to see if the lower durations will sustain during the coming months.
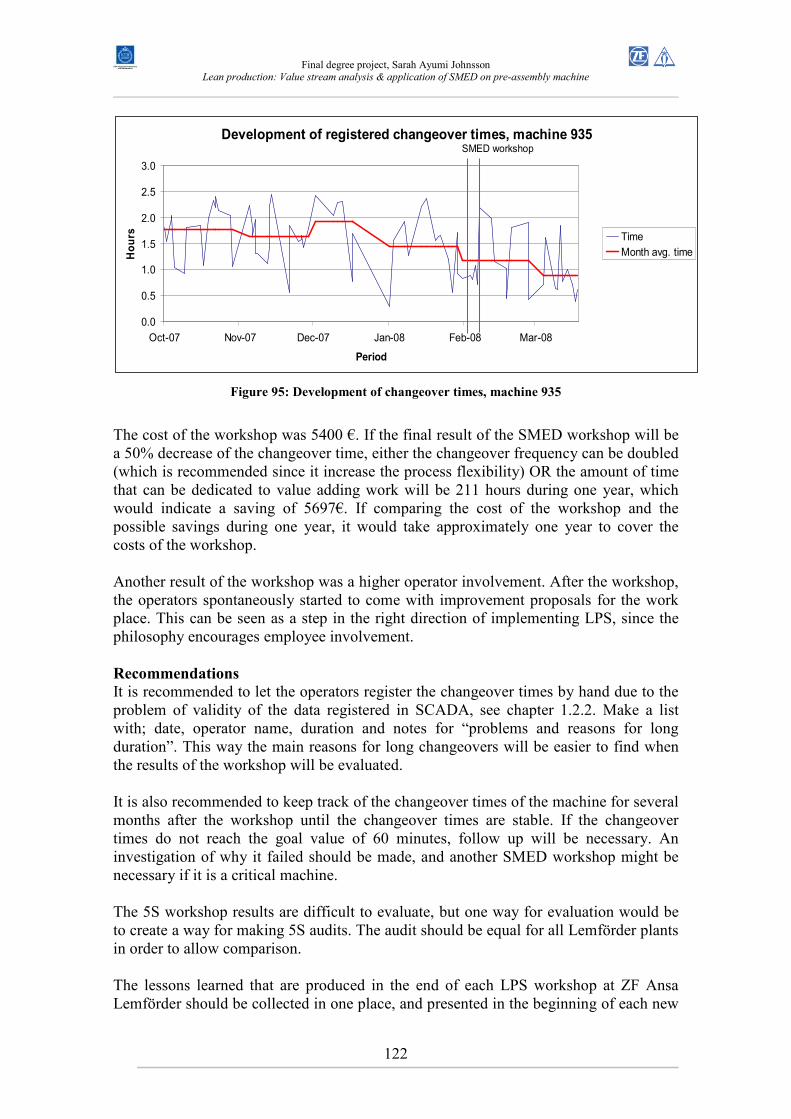
Final degree project, Sarah Ayumi Johnsson
Lean production: Value stream analysis & application of SMED on pre-assembly machine
122
Development of registered changeover times, machine 935
0.0
0.5
1.0
1.5
2.0
2.5
3.0
Oct-07 Nov-07 Dec-07 Jan-08 Feb-08 Mar-08
Period
Hours Time
Month avg. time
SMED workshop
Figure 95: Development of changeover times, machine 935
The cost of the workshop was 5400 €. If the final result of the SMED workshop will be a 50% decrease of the changeover time, either the changeover frequency can be doubled (which is recommended since it increase the process flexibility) OR the amount of time that can be dedicated to value adding work will be 211 hours during one year, which would indicate a saving of 5697€. If comparing the cost of the workshop and the possible savings during one year, it would take approximately one year to cover the costs of the workshop. Another result of the workshop was a higher operator involvement. After the workshop, the operators spontaneously started to come with improvement proposals for the work place. This can be seen as a step in the right direction of implementing LPS, since the philosophy encourages employee involvement. Recommendations
It is recommended to let the operators register the changeover times by hand due to the problem of validity of the data registered in SCADA, see chapter 1.2.2. Make a list with; date, operator name, duration and notes for “problems and reasons for long duration”. This way the main reasons for long changeovers will be easier to find when the results of the workshop will be evaluated. It is also recommended to keep track of the changeover times of the machine for several months after the workshop until the changeover times are stable. If the changeover times do not reach the goal value of 60 minutes, follow up will be necessary. An investigation of why it failed should be made, and another SMED workshop might be necessary if it is a critical machine. The 5S workshop results are difficult to evaluate, but one way for evaluation would be to create a way for making 5S audits. The audit should be equal for all Lemförder plants in order to allow comparison. The lessons learned that are produced in the end of each LPS workshop at ZF Ansa Lemförder should be collected in one place, and presented in the beginning of each new
Final degree project, Sarah Ayumi Johnsson
Lean production: Value stream analysis & application of SMED on pre-assembly machine
123
workshop. This could help the workshop team to avoid making mistakes. Also, if possible, a “lessons learned data base” for the whole Lemförder group could be created.
7.4 Integrating LPS
Letting only the LPS coordinator be responsible for all LPS activities sends out the message that the activities are only a concern of the LPS department, while it is actually a concern of the whole company. It is important that the LPS methodology is spread throughout the company and that the knowledge deepens and gradually integrates the company culture, otherwise there might be a risk that the LPS will just become a quick fix and all efforts will be wasted. In the field of LPS workshops it would be recommendable to let more people be involved in order to make the LPS implementation faster and to spread deeper knowledge to more people. One reason for promoting a fast implementation is that if the implementation is too slow, the results will not be as obvious and employees might start to think that the LPS does not work as promised. One way to implement LPS faster is to let the engineers of the engineering department plan and arrange one LPS workshop each per year in an area of their speciality. This would deepen their understanding of the LPS work. It would also make the LPS education of the operators spread more rapidly, assuming that the workshops held would be “extra” workshops, and not a part of the 10 yearly workshops of the LPS coordinator. The engineers already do work with improvements, and they have a busy schedule and are often needed in many places on the production floor throughout the day. But it is advisable that also they learn how to work with improvements through the methods of LPS. To make it possible for them to both carry out their normal work as well as LPS activities, they could devote maybe 3 or 4 hours per day during one week to a LPS workshop or a project, and time could also be set off for improvements based on the LPS methodology. This does not only have to be limited to the production department but could be spread to the other departments as well. A recommendation for next years planning of LPS activities, for year 2009, is to let employees already involved with production problems make value stream maps, and thereafter let them make workshop suggestions. This would give a wider range of information input and make it more likely that no important problem is forgotten. Another advantage of involving more people in such LPS activities is that the LPS knowledge would be further spread out in the company.
Final degree project, Sarah Ayumi Johnsson
Lean production: Value stream analysis & application of SMED on pre-assembly machine
124
8 REFERENCES
Oxford English Dictionary online, Validity, Oxford Univesity Press, Second edition (1989), Printed 2008-03-14, 14:03 http://dictionary.oed.com.focus.lib.kth.se/cgi/entry/50274591?single=1&query_type=word&queryword=validity&first=1&max_to_show=10, Appendix VI
Oxford English Dictionary online, Reliability, Oxford Univesity Press, Second edition (1989), Printed 2008-03-14, 14:19 http://dictionary.oed.com.focus.lib.kth.se/cgi/entry/50202002?single=1&query_type=word&queryword=reliability&first=1&max_to_show=10, Appendix VI
Oxford English Dictionary online, Batch, Oxford Univesity Press, Second edition (1989), Printed 2008-03-14, 16:55 http://dictionary.oed.com.focus.lib.kth.se/cgi/entry/50018304?query_type=word&queryword=batch&first=1&max_to_show=10&sort_type=alpha&result_place=3&search_id=W7RW-twsuYn-6991&hilite=50018304, Appendix VI
Wikipedia, Author unknown, SCADA, page last modified 2008-03-11, 17:17, Printed 2008-03-13, 14:47, http://en.wikipedia.org/wiki/SCADA, Appendix VI
Wikipedia, Author unknown, SAP, page last modified 2008-03-12, 10:18, Printed 2008-03-13, 14:43, http://en.wikipedia.org/wiki/SAP_AG, Appendix VI
Wikipedia, Author unknown, Lean Manufacturing, page last modified 2008-03-12, 05:13, Printed 2008-03-14, 14:27, http://en.wikipedia.org/wiki/Lean_manufacturing, Appendix VI
Wikipedia, Author unknown, SMED, page last modified 2008-02-15, 18:29, Printed 2008-03-14, 15:55, http://en.wikipedia.org/wiki/Single_Minute_Exchange_of_Die, Appendix VI
ZF webpage, Company: ZF group overview, Responsible VVK, Last Update 2008-03-04, Printed 2008-03-13, 14:54, http://www.zf.com/content/en/import/zf_konzern/startseite/unternehmen/Unternehmen.html, Appendix VI
Arkansas State University webpage, Syamil A., Supply chain design, Last update xxxx, Printed 2008-03-18, 13:44, http://www.clt.astate.edu/asyamil/chase11/ppt/, www.clt.astate.edu/asyamil/chase11/ppt/Handout_TPS%20&%20Lean.ppt, Appendix VI
Final degree project, Sarah Ayumi Johnsson
Lean production: Value stream analysis & application of SMED on pre-assembly machine
125
Written material from ZF Ansa Lemförder regarding LPS Note: The material is copyrighted and not available to the public. To receive copies of any document please contact Mr. Julio Guerrero, LPS coordinator at ZF Ansa Lemförder, e-mail: [email protected], telephone: +34 947 47 90 00
ZF Ansa Lemförder, (2007), Lemförder Production System - Compact-Training (Company information about LPS), F-VL, lm000370, PowerPoint slideshow EN_Compact_Training.ppt
ZF Ansa Lemförder, (2007), Value stream analysis training (Company information about LPS), F-VL, lm007798, PowerPoint slideshow EN_WSA-Training.ppt
ZF Ansa Lemförder, (2007), Lemförder Production System - Guideline changeover time reduction, (Company information about LPS), F-VL, lm002734, PowerPoint slideshow EN_Changeover_reduction.ppt
ZF Ansa Lemförder, (2007), Lemförder Production System - OEE, (Company information about LPS), F-VL, lm002734, PowerPoint slideshow EN_OEE.ppt
ZF Ansa Lemförder, (2007), Lemförder Production System - Guideline for Supermarket Dimensioning, (Company information about LPS), F-VL, lm002734, PowerPoint slideshow EN_Supermarkt.ppt
ZF Ansa Lemförder, (2007), Lemförder Production System - 5S A Process for Workplace Organization and Visual Controls, F-VL, PowerPoint slideshow EN_5S-Training.ppt
ZF Ansa Lemförder (2007), Final presentation of the LPS vision phase, 070604_PRES_5_Presentación final de la fase de vision.ppt, J:\LPS\FASE DE VISION\Presentaciones
Enriquez Baranda M.A., (2007), Aplicación de técnicas LPS a maquinas de rebordedado y montaje de rótulas de suspensión, Universidad de Burgos, (Final degree project report - implementation of LPS in Suspension Ball Joint assembly)
Interviews & information
Guerrero J., Engineer and LPS coordinator, ZF Ansa Lemförder, Burgos, Spain, interview, several times between October 2007 and February 2008
de Prado J.M., Engineer, ZF Ansa Lemförder, Burgos, Spain, interview, January 2008
de los Mozos E., Engineer, ZF Ansa Lemförder, Burgos, Spain, interview, January 2008
Herremans P., Production responsible, ZF Ansa Lemförder, Burgos, Spain, interview, October 2008
Steffen E., Engineer, ZF Lemförder GmbH, Dielingen, Germany, telephone interview, November 2007
Melgar Plaza J.J, Engineer, ZF Ansa Lemförder, Burgos, Spain, October 2007
Final degree project, Sarah Ayumi Johnsson
Lean production: Value stream analysis & application of SMED on pre-assembly machine
126
Literature
Bergman, B., Klefsjö, B., (2003), Quality - From customer need to customer satisfaction, 2nd edition, Lund, Student Litteratur, ISBN 91-44-04166-7
Liker, J., (2003), The Toyota Way, Blacklick, OH, USA, McGraw-Hill Professional Publishing, ISBN 97-0-07-139231-0
Liker, J., (2005), Toyota Way Fieldbook: A Practical Guide for Implementing Toyota's 4Ps, Blacklick, OH, USA, McGraw-Hill Companies, ISBN 97-0-07-144893-2
George, M. L., (2002), Lean Six Sigma : Combining Six Sigma Quality with Lean Production Speed, Blacklick, OH, USA, McGraw-Hill Companies, ISBN 0-07-138521-5
Burton, T. T., (2003), Lean Extended Enterprise : Moving Beyond the Four Walls to Value Stream Excellence, Boca Raton, FL, USA, J. Ross Publishing Incorporated, ISBN 1-932159-12-6
Borris, S., (2005), Total Productive Maintenance, Blacklick, OH, USA: McGraw-Hill Professional Publishing, ISBN 97-0-07-146733-9
Hobbs, D. P., (2003), Lean Manufacturing Implementation : A Complete Execution Manual for Any Size Manufacturer, Boca Raton, FL, USA: J. Ross Publishing, Incorporated, ISBN 1-932159-14-2
Viale, J.D., Carrigan, C., (1996), Inventory Management: From warehouse to distribution center, Course Technology Crisp, Menlo Park, CA, U.S.A., ISBN 1-56052-361-1,
Goldsby, T.J., Martichenko, R., (2005), Lean Six Sigma Logistics, Boca Raton, FL, USA , J. Ross Publishing Incorporated, ISBN 1-932159-36-3
Simchi-Levi, D., (2003) Managing the Supply Chain, Blacklick, OH, USA: McGraw-Hill Professional, ISBN 0-07-143587-5
Gross, J. M., (2003), Kanban Made Simple : Demystifying and Applying Toyota's Legendary Manufacturing Process, New York, NY, USA, AMACOM, ISBN 0-8144-0763-3
Referred to but contents not used for conclusions etc.
Geng, H., 2004, Manufacturing engineering handbook, New York, NY, USA: McGraw-Hill, ISBN 97-0-07-139825-1 Larrañeta, J, (1995), Métodos modernos de gestión de la producción, Madrid, Alianza Editorial S.A., ISBN 84-206-8122-9
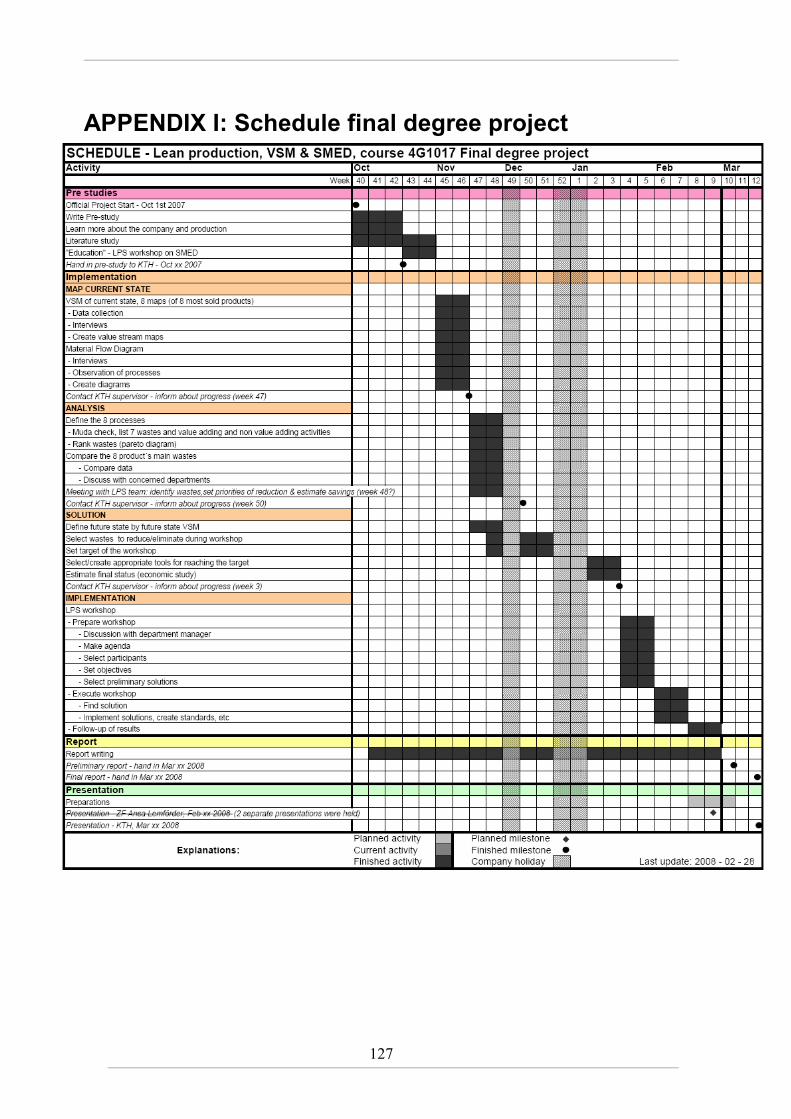
127
APPENDIX I: Schedule final degree project
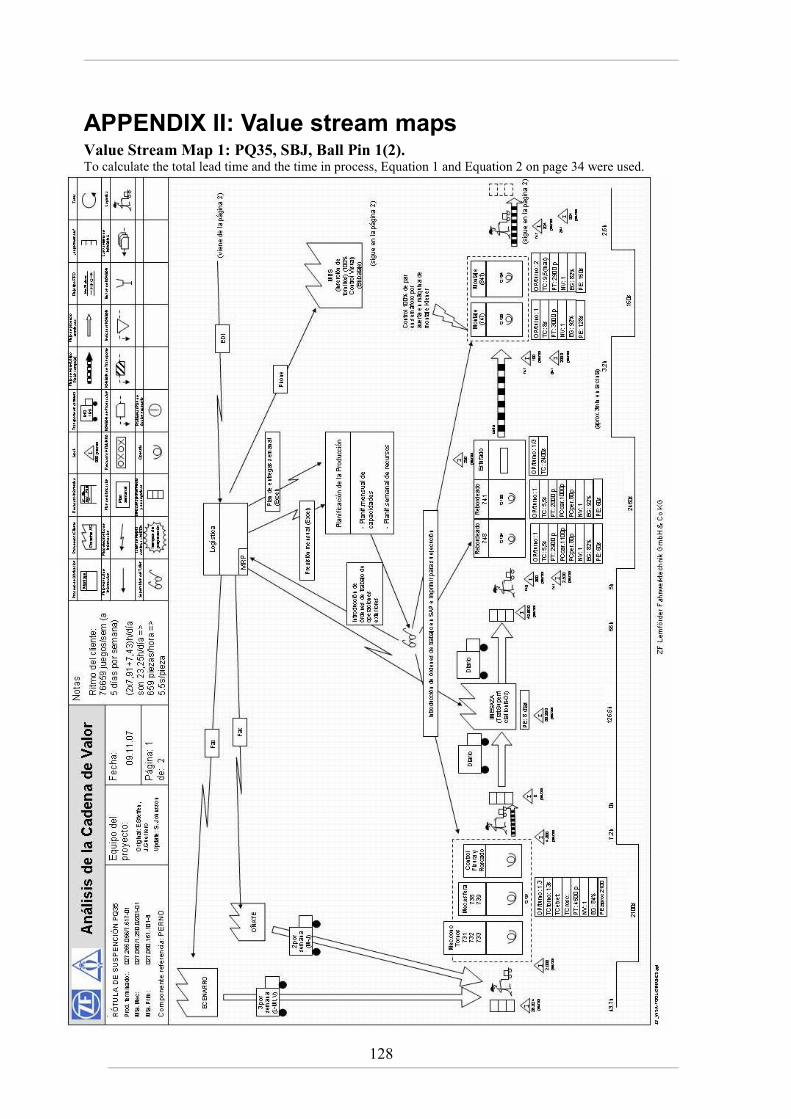
128
APPENDIX II: Value stream maps Value Stream Map 1: PQ35, SBJ, Ball Pin 1(2). To calculate the total lead time and the time in process, Equation 1 and Equation 2 on page 34 were used.
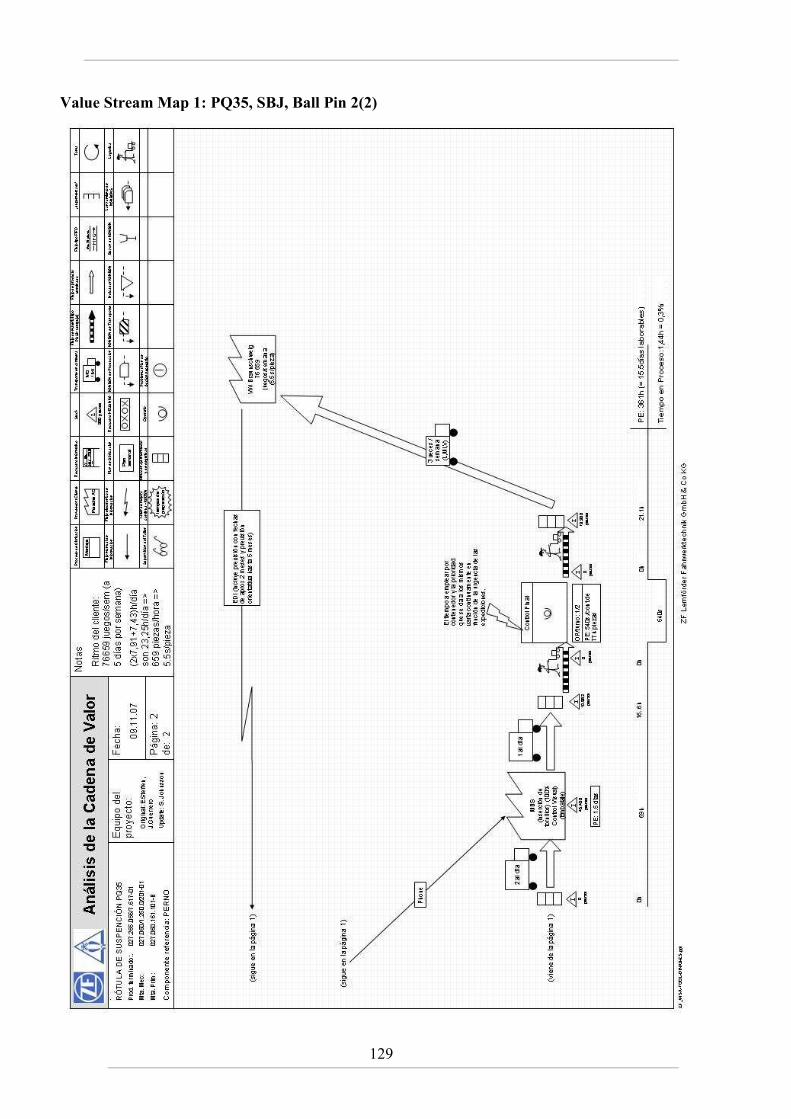
129
Value Stream Map 1: PQ35, SBJ, Ball Pin 2(2)
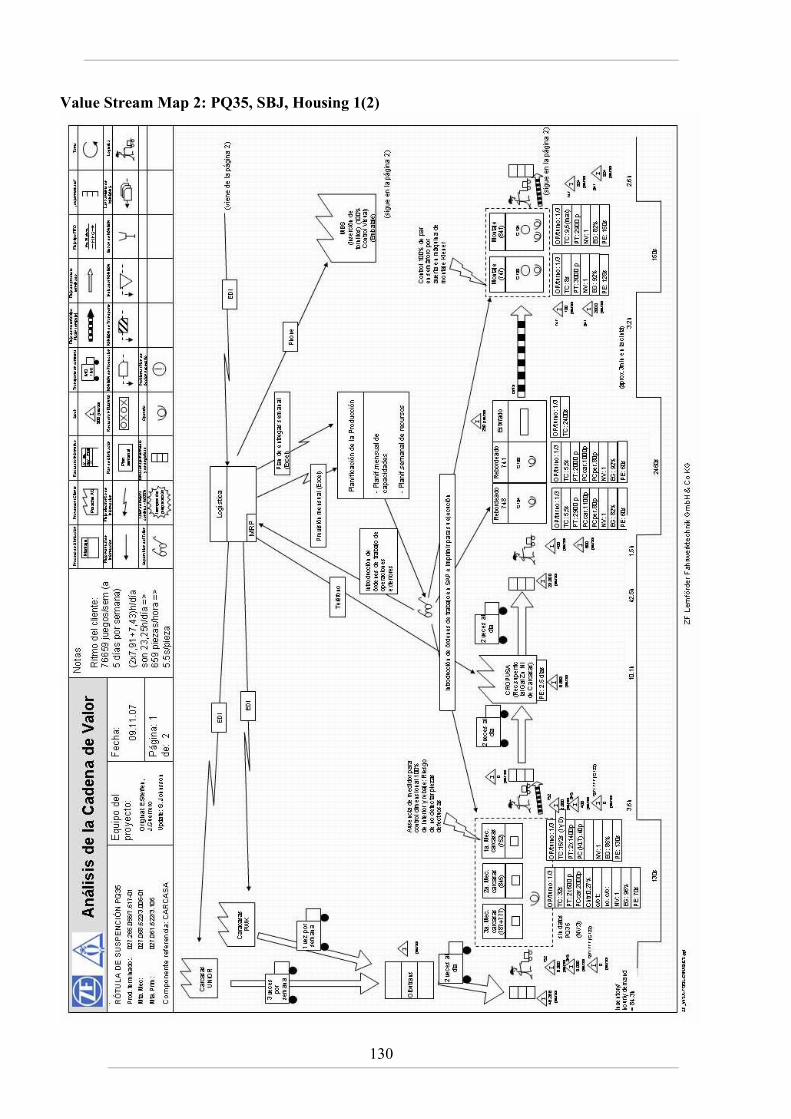
130
Value Stream Map 2: PQ35, SBJ, Housing 1(2)
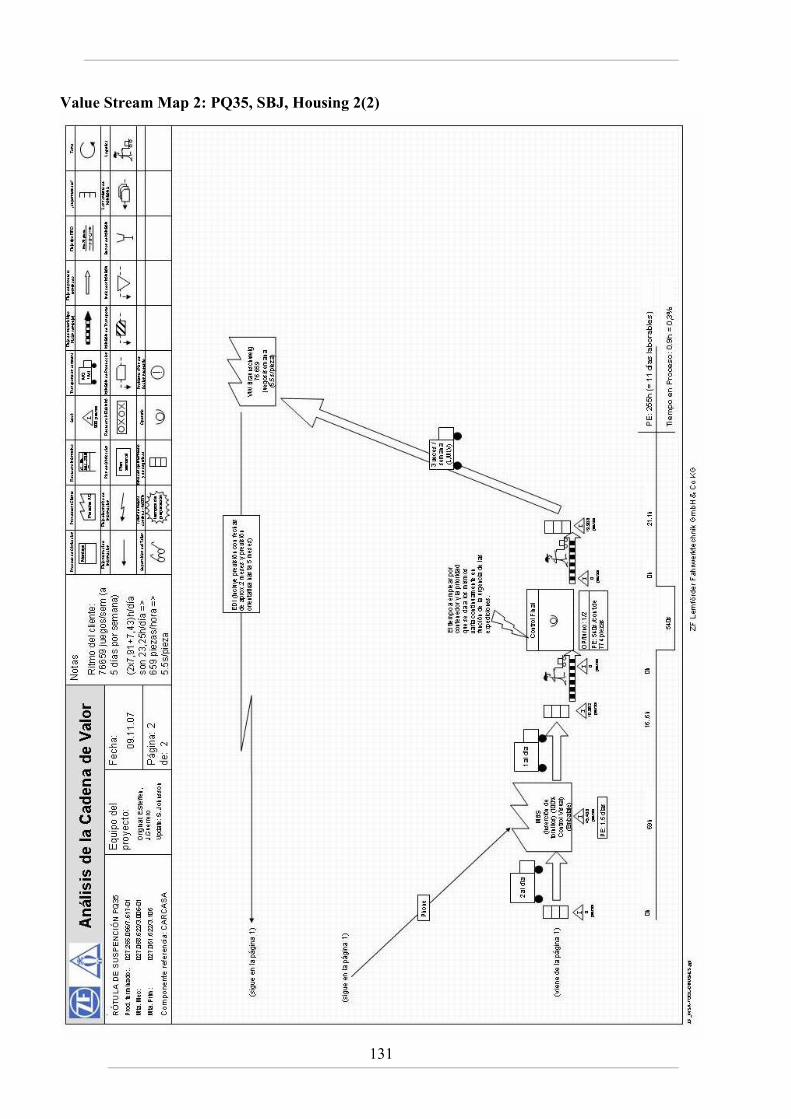
131
Value Stream Map 2: PQ35, SBJ, Housing 2(2)
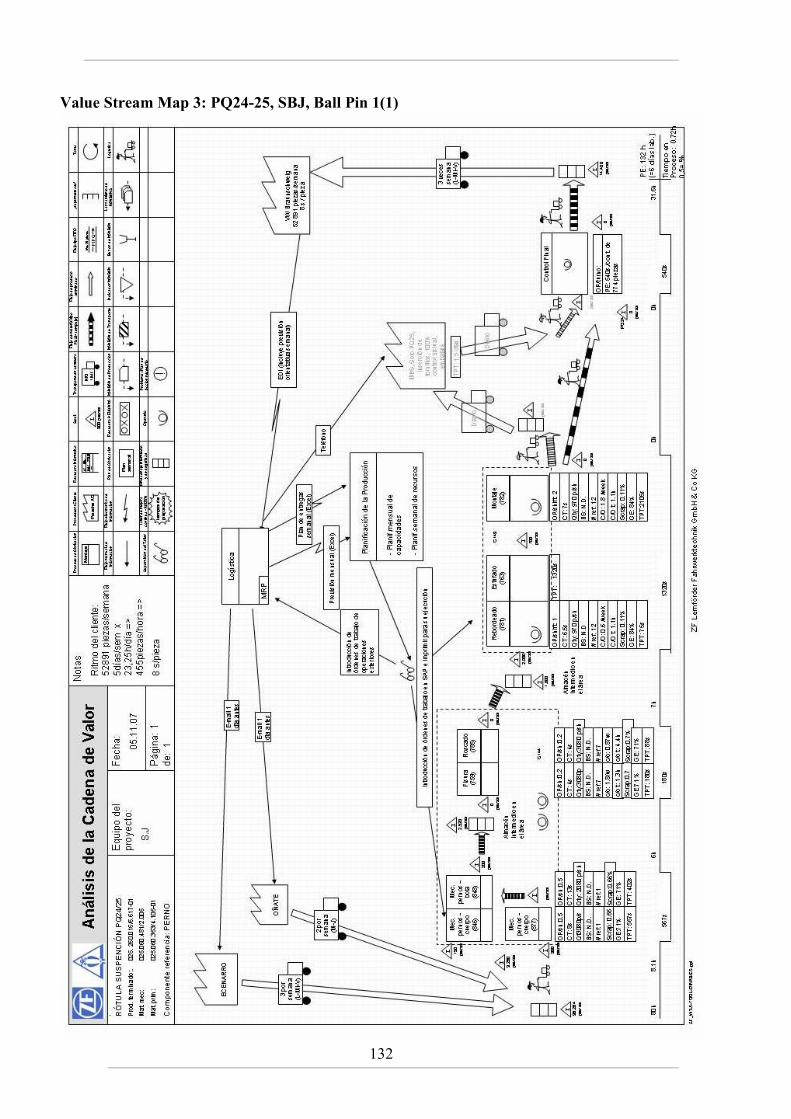
132
Value Stream Map 3: PQ24-25, SBJ, Ball Pin 1(1)
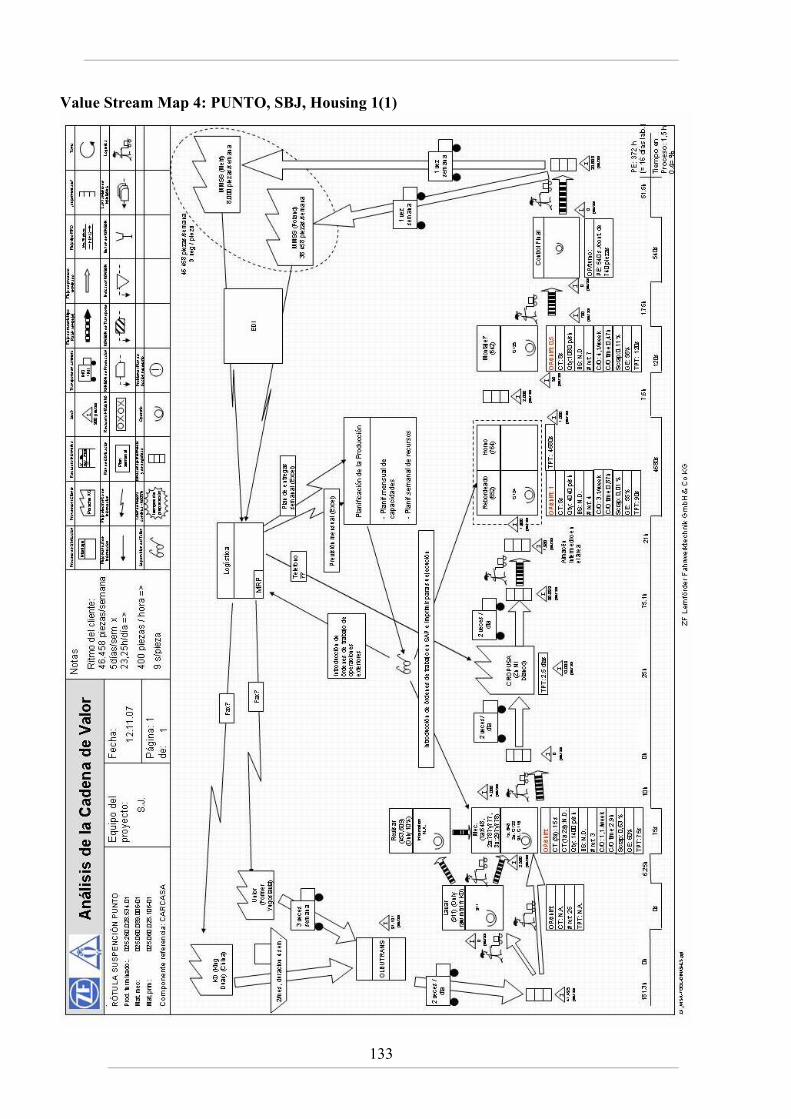
133
Value Stream Map 4: PUNTO, SBJ, Housing 1(1)
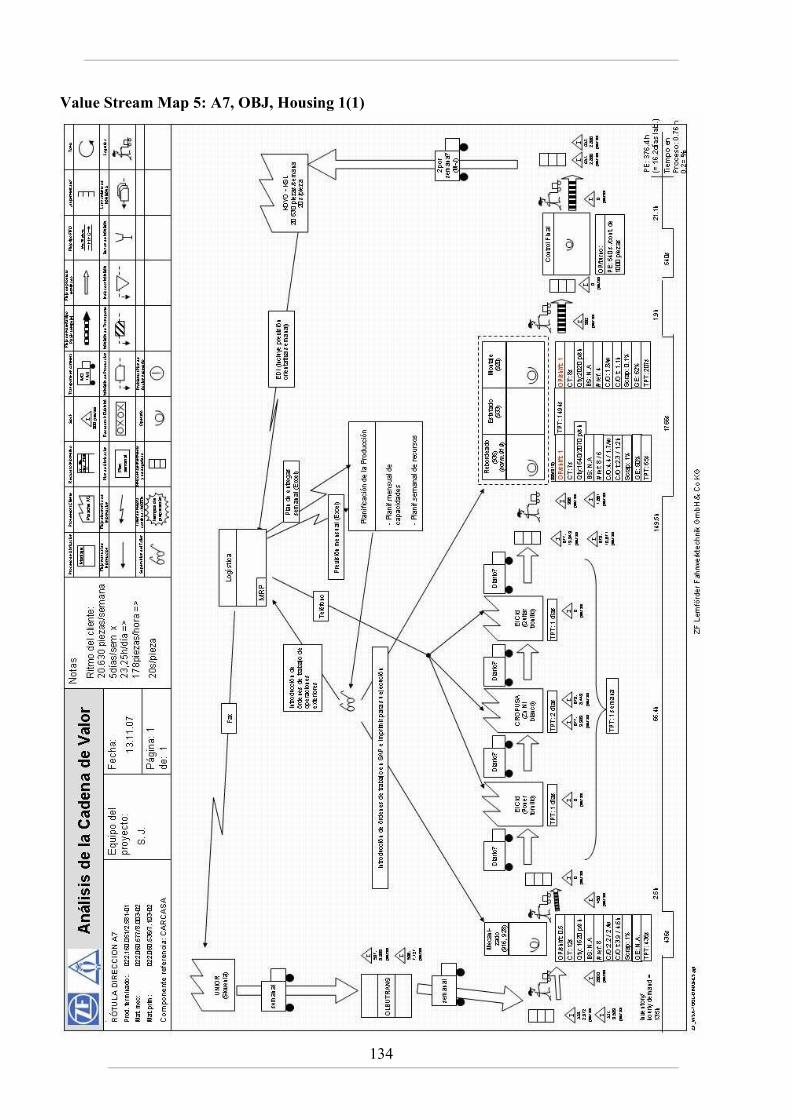
134
Value Stream Map 5: A7, OBJ, Housing 1(1)
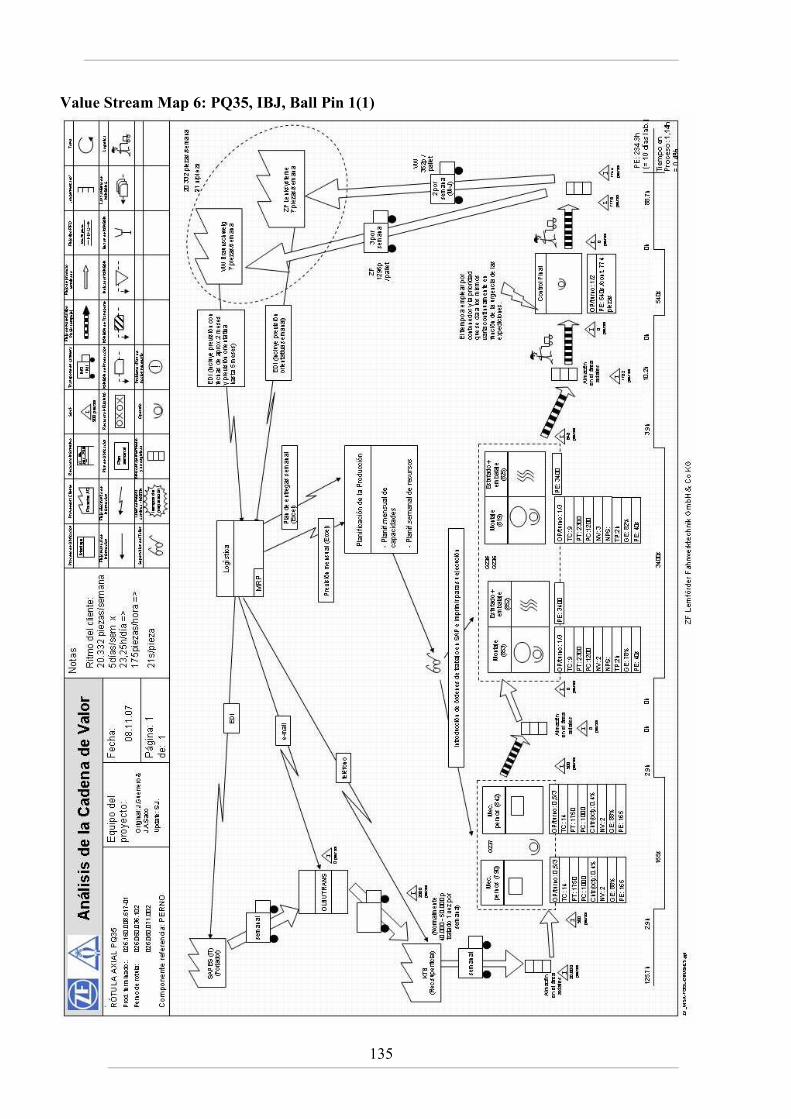
135
Value Stream Map 6: PQ35, IBJ, Ball Pin 1(1)
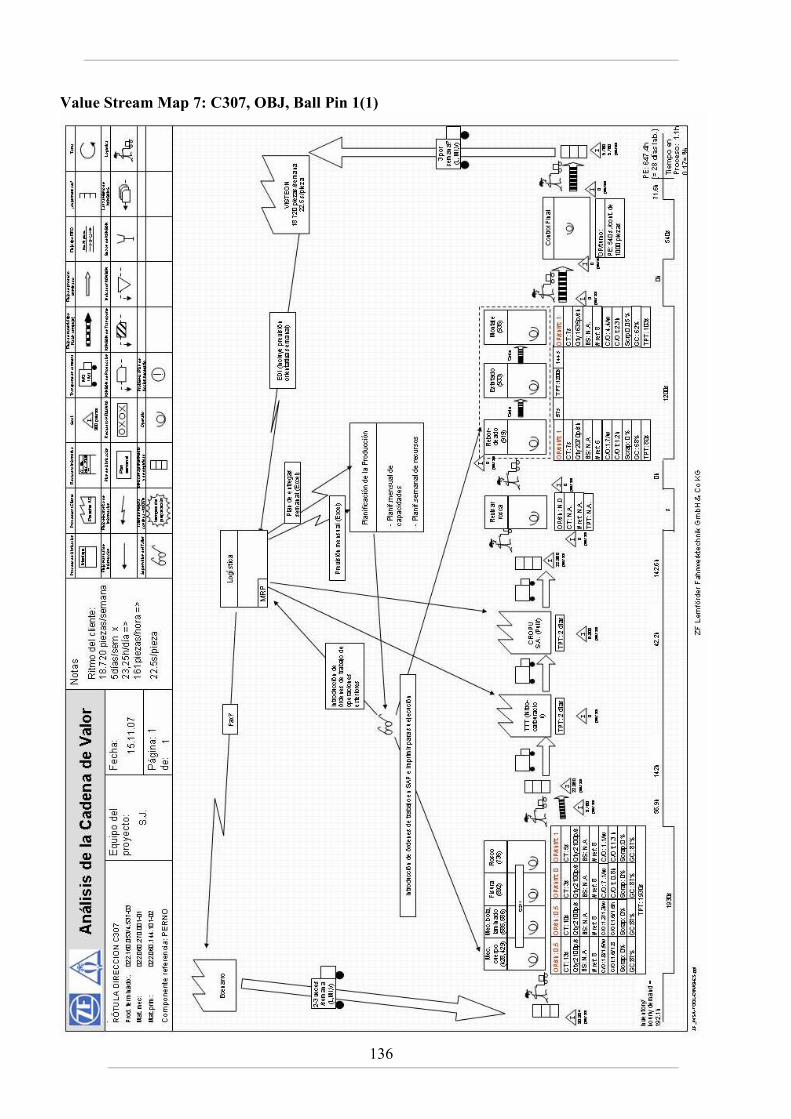
136
Value Stream Map 7: C307, OBJ, Ball Pin 1(1)
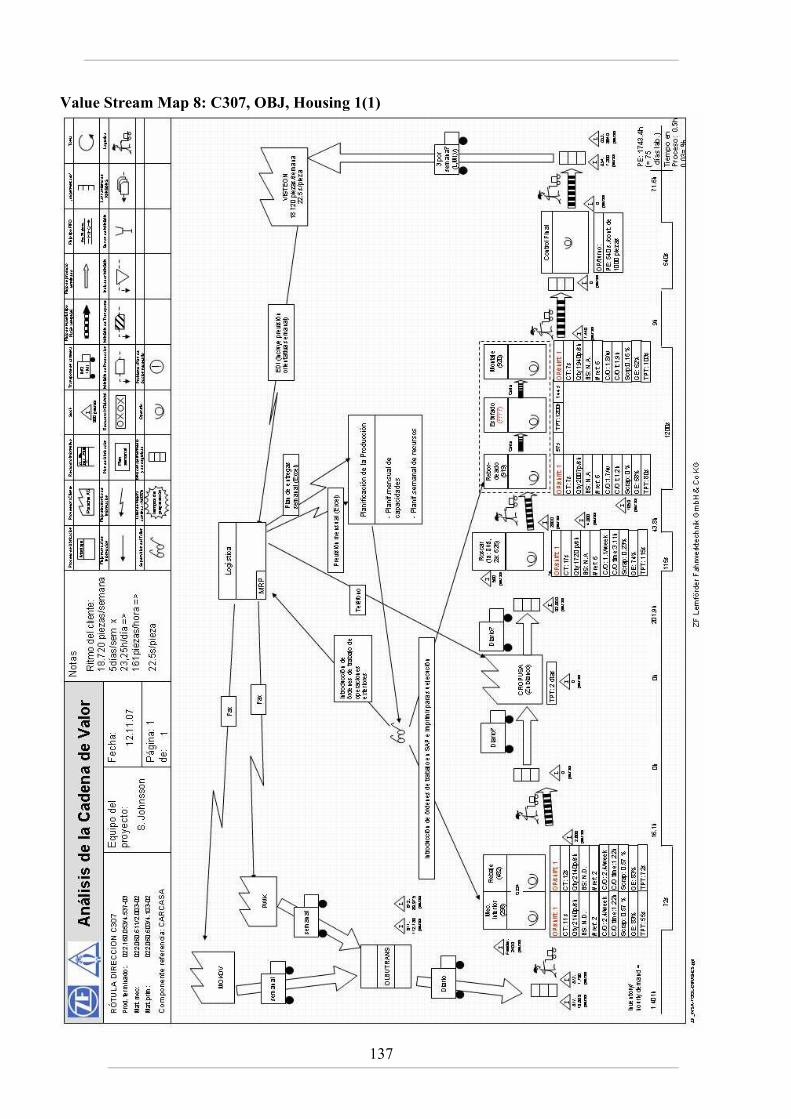
137
Value Stream Map 8: C307, OBJ, Housing 1(1)
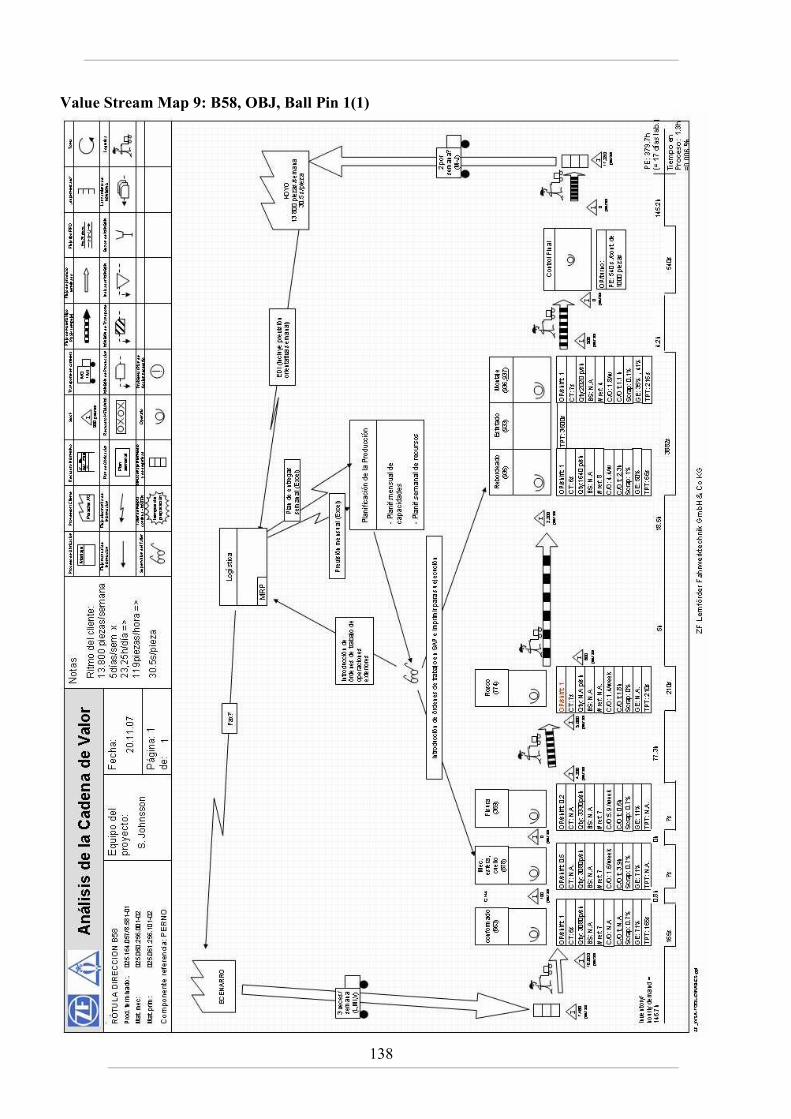
138
Value Stream Map 9: B58, OBJ, Ball Pin 1(1)
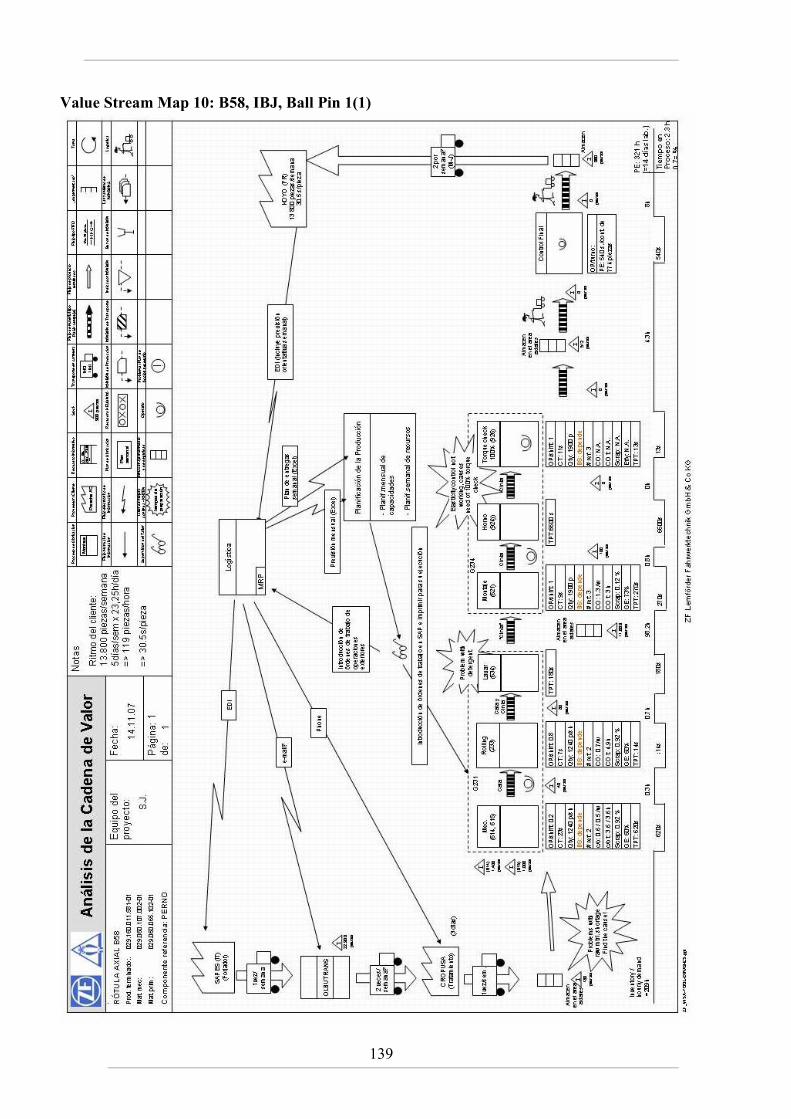
139
Value Stream Map 10: B58, IBJ, Ball Pin 1(1)
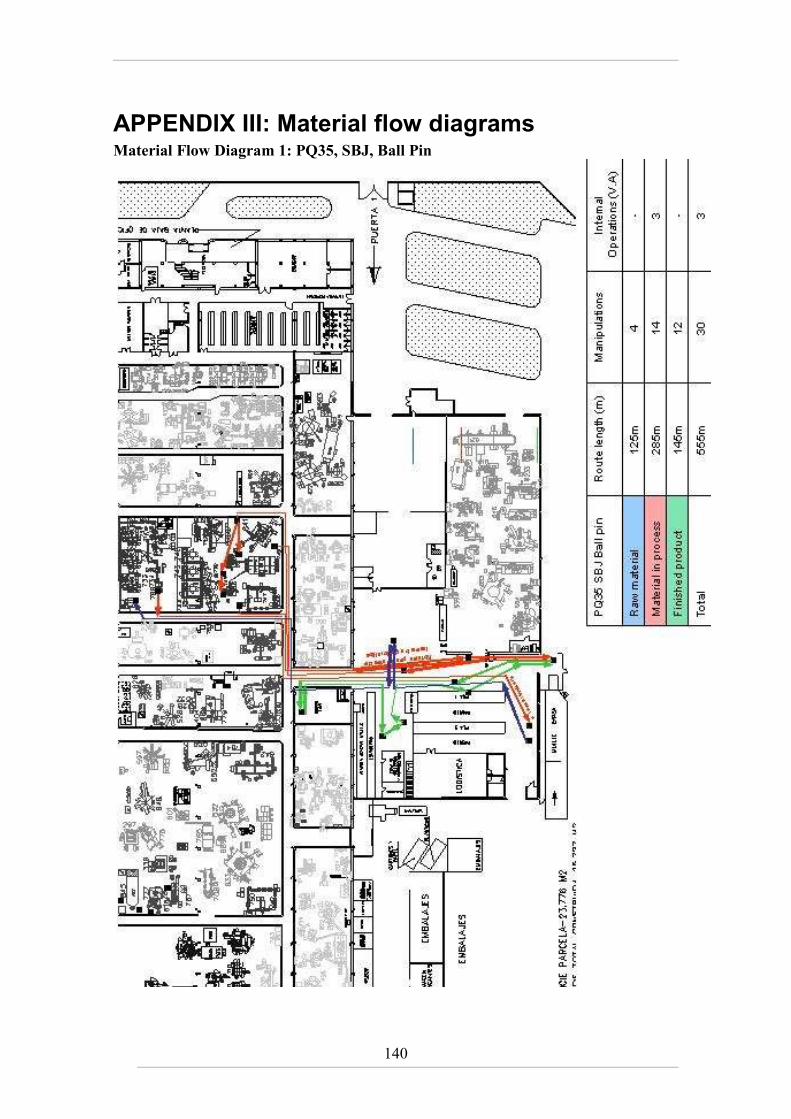
140
APPENDIX III: Material flow diagrams Material Flow Diagram 1: PQ35, SBJ, Ball Pin
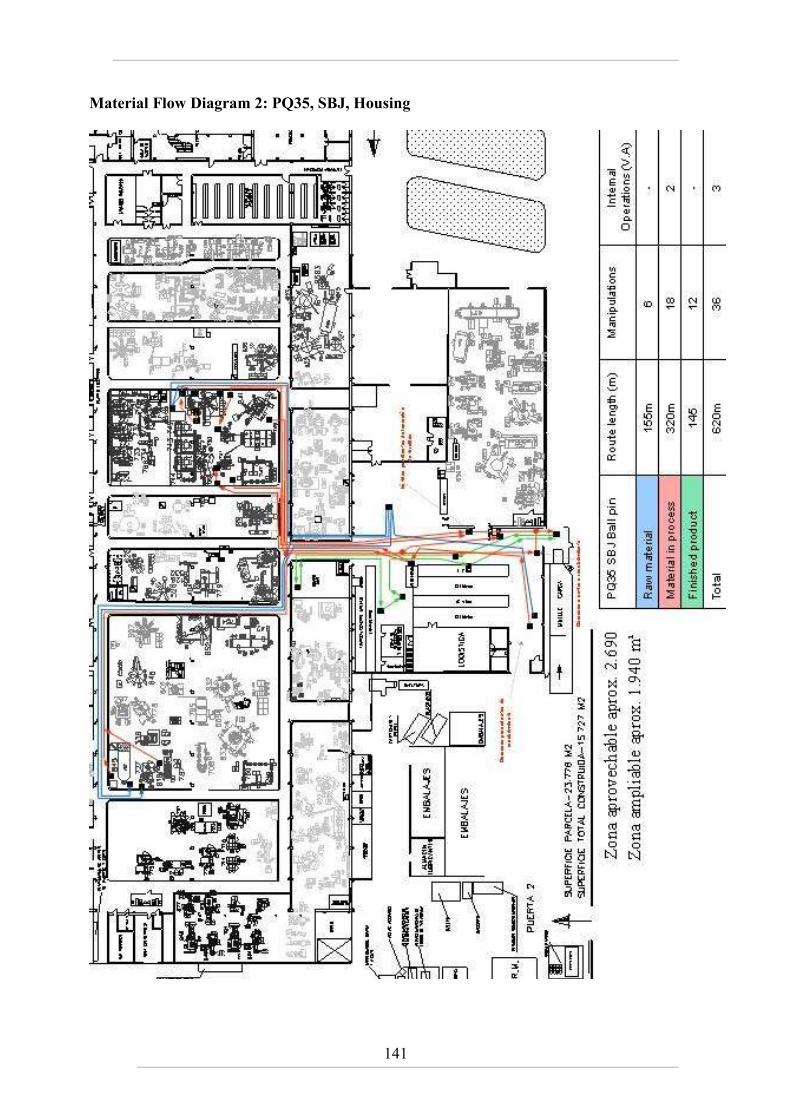
141
Material Flow Diagram 2: PQ35, SBJ, Housing
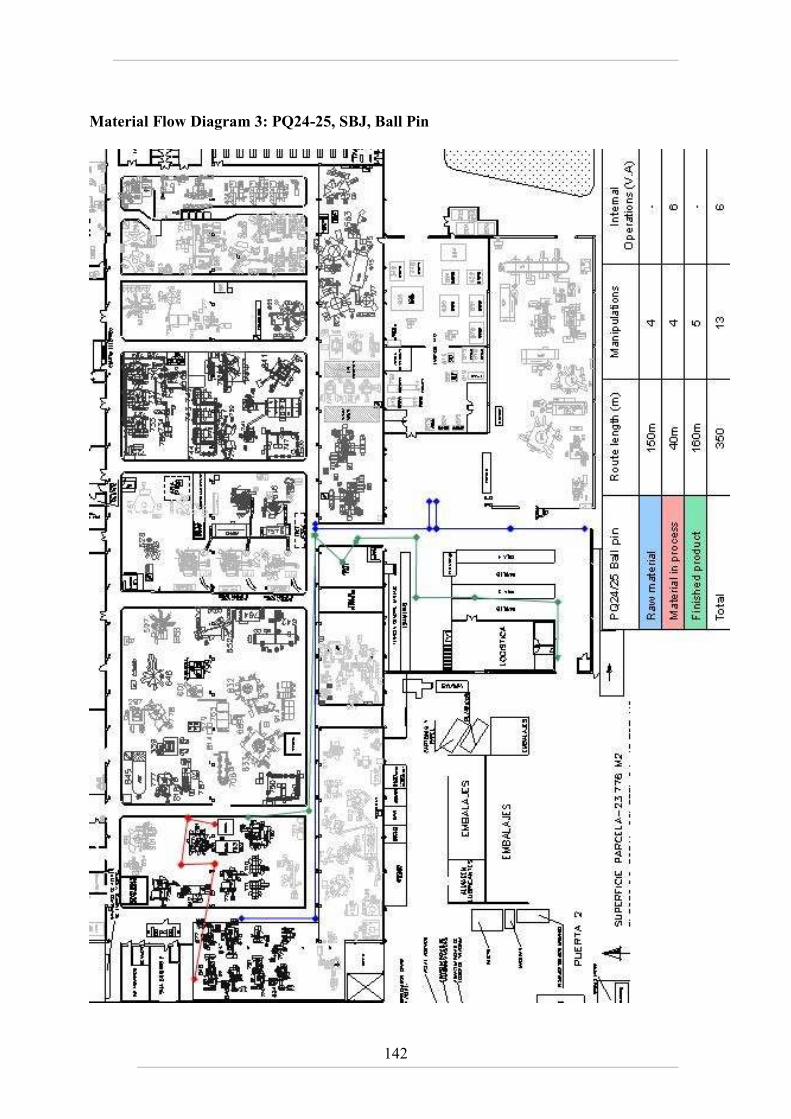
142
Material Flow Diagram 3: PQ24-25, SBJ, Ball Pin
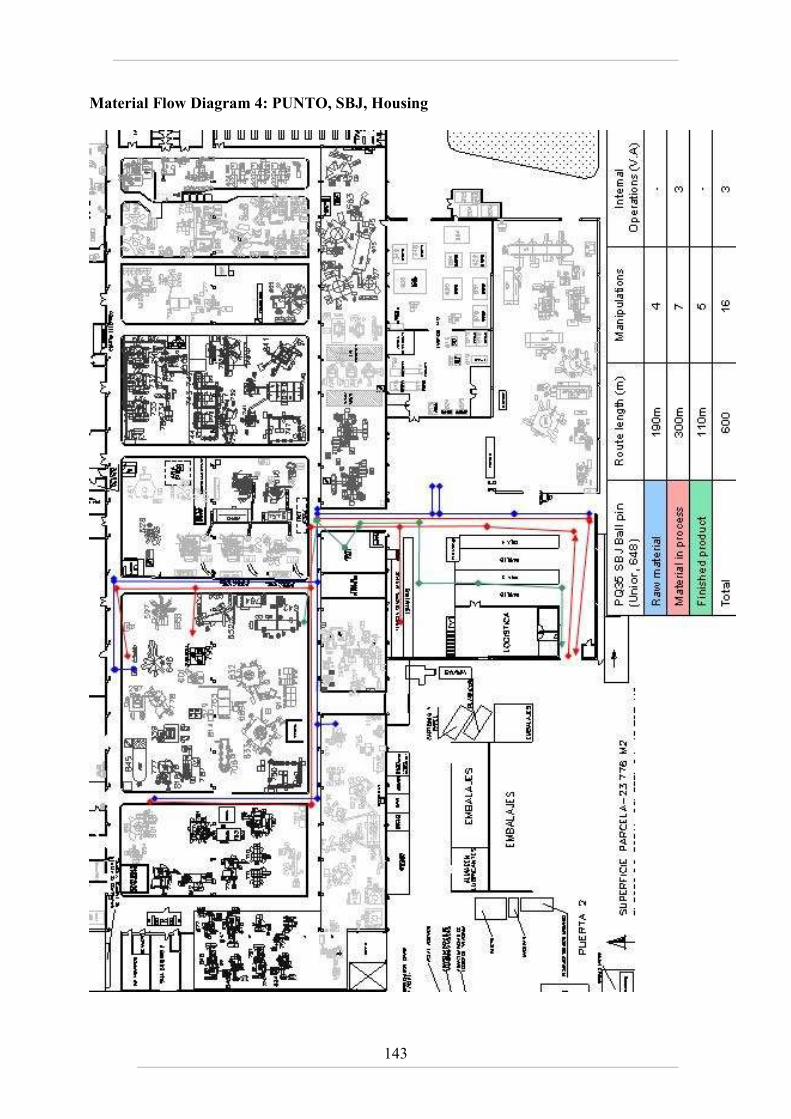
143
Material Flow Diagram 4: PUNTO, SBJ, Housing
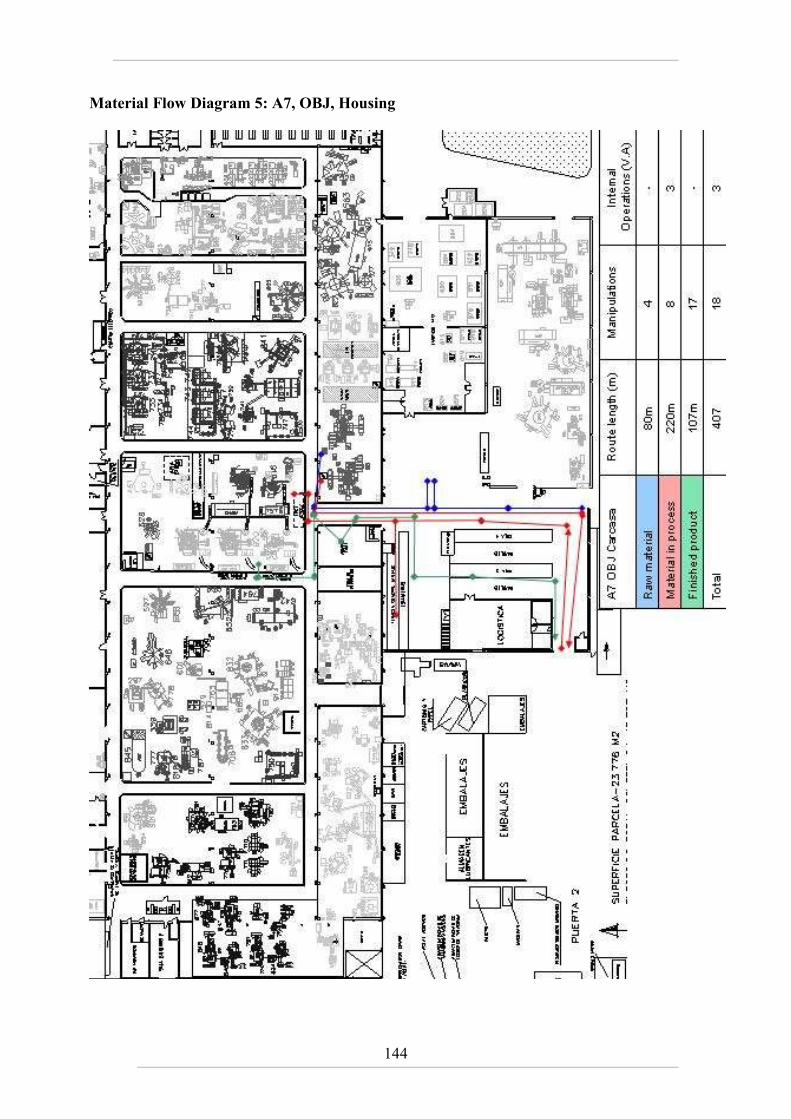
144
Material Flow Diagram 5: A7, OBJ, Housing
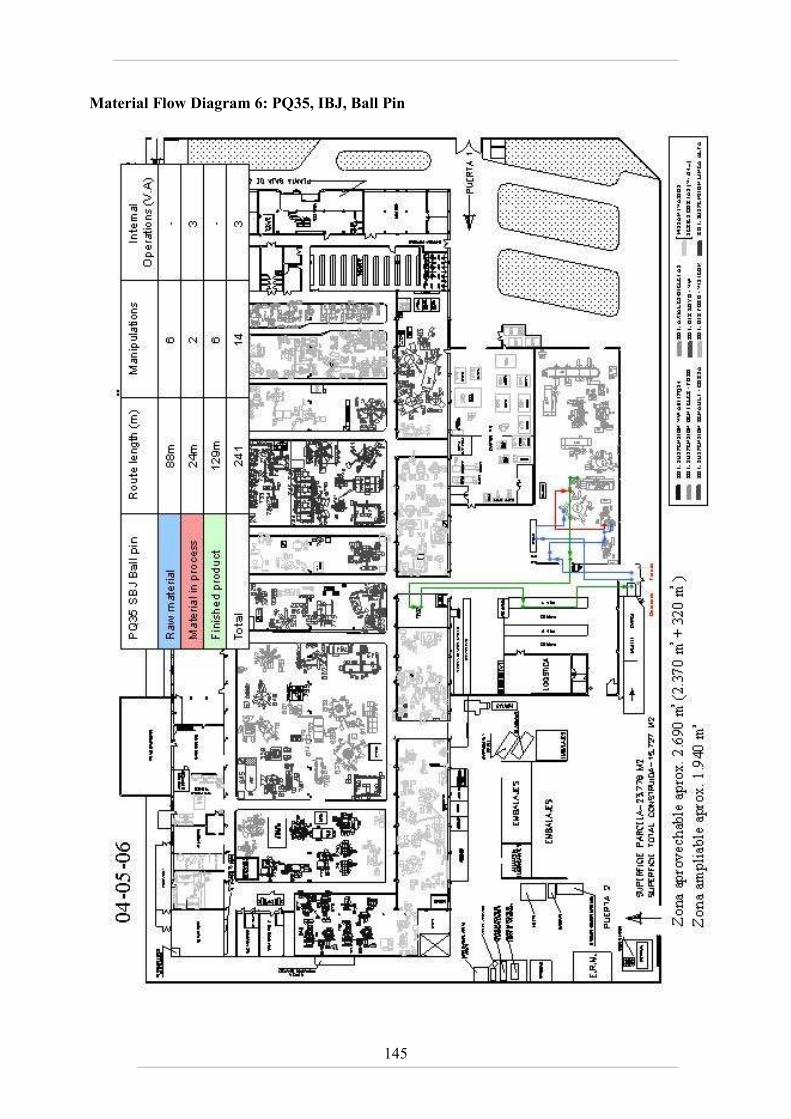
145
Material Flow Diagram 6: PQ35, IBJ, Ball Pin
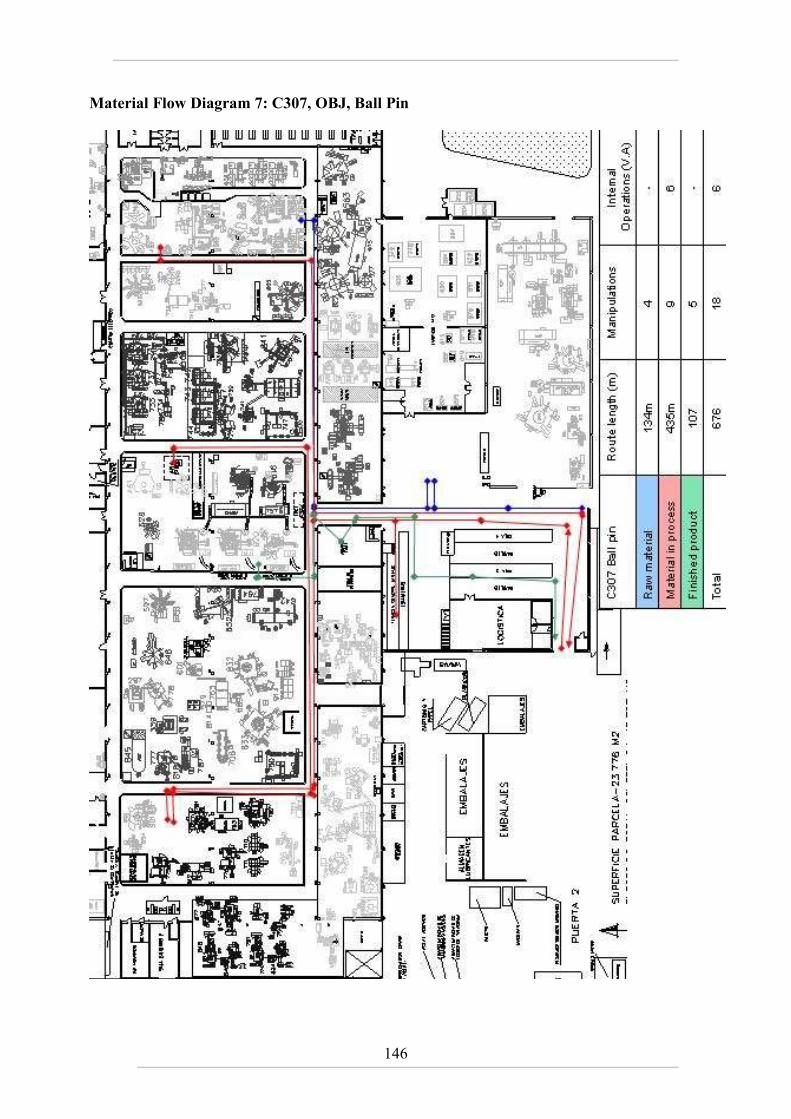
146
Material Flow Diagram 7: C307, OBJ, Ball Pin
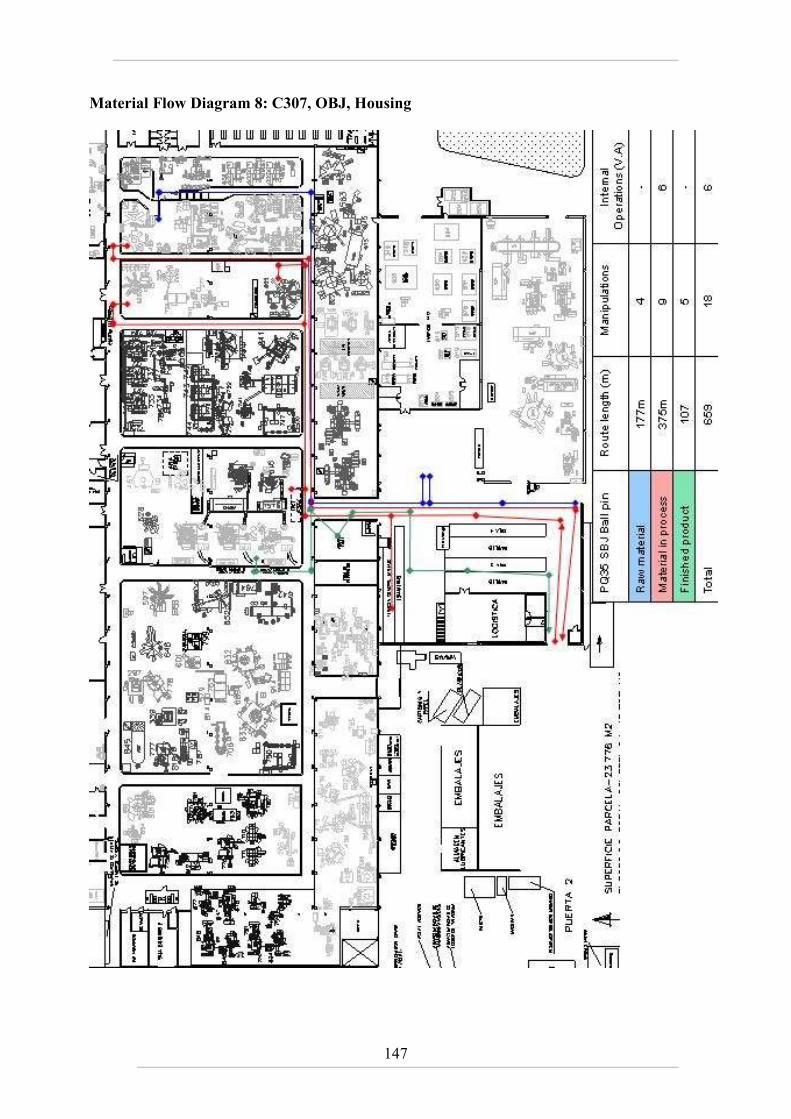
147
Material Flow Diagram 8: C307, OBJ, Housing
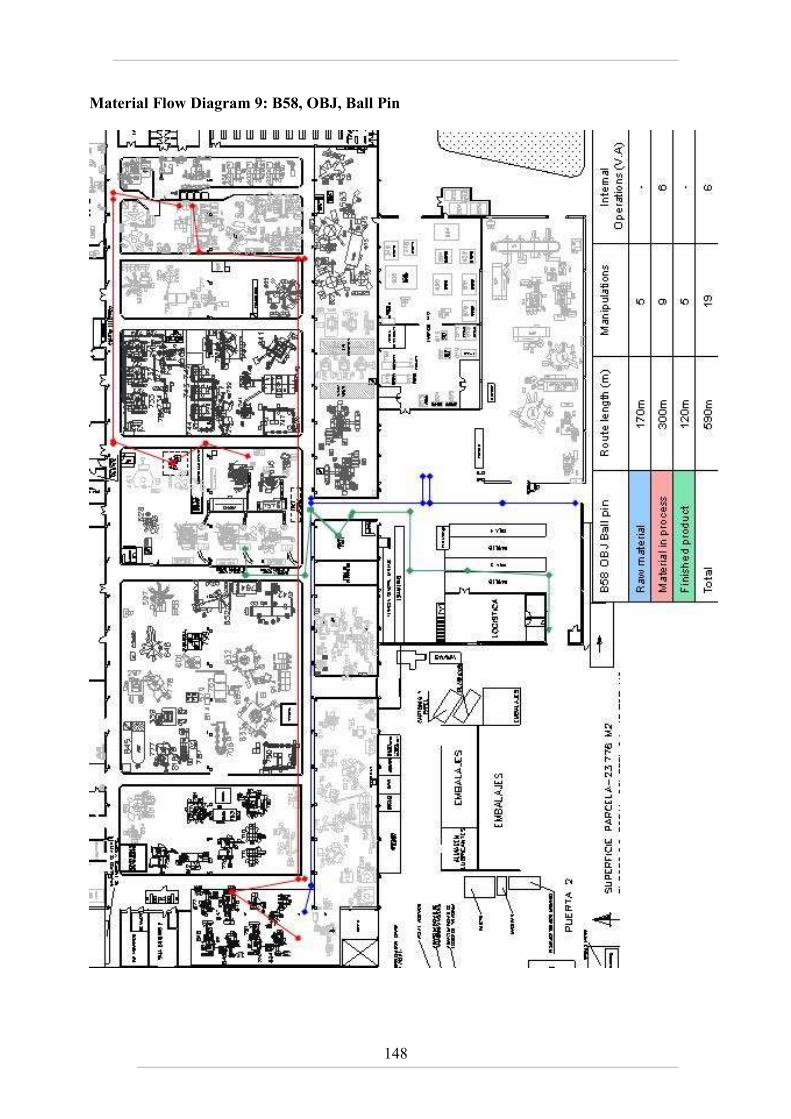
148
Material Flow Diagram 9: B58, OBJ, Ball Pin
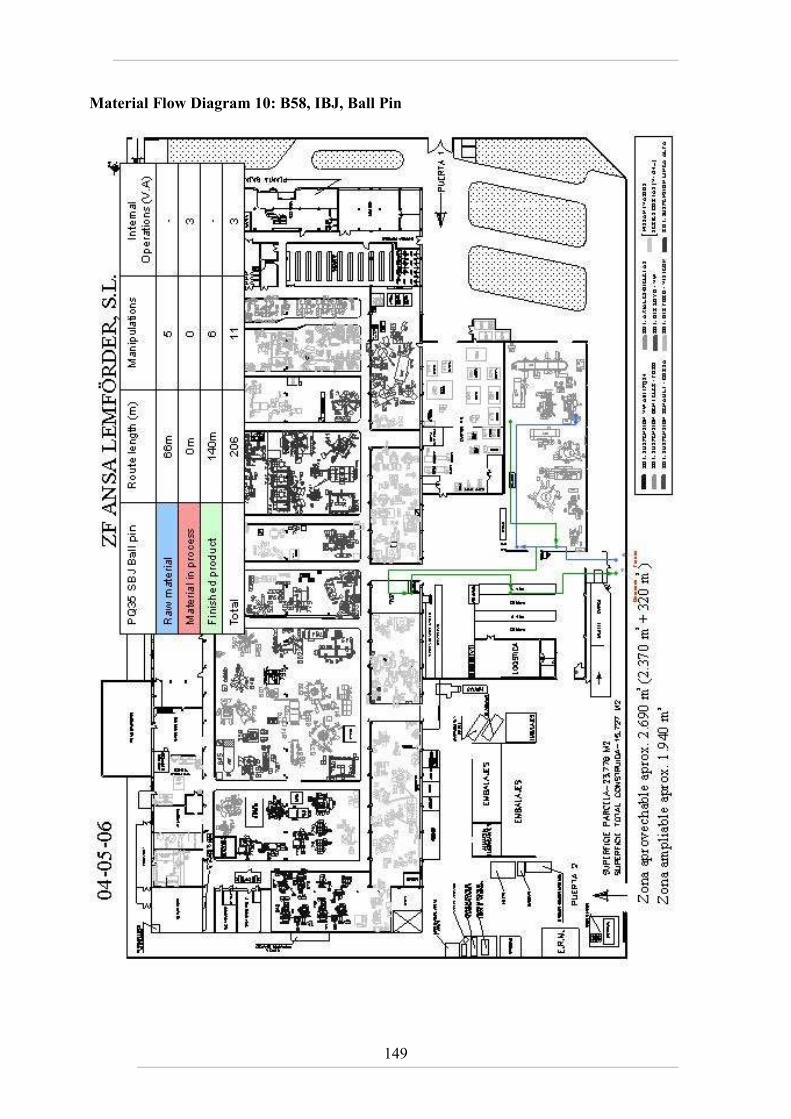
149
Material Flow Diagram 10: B58, IBJ, Ball Pin
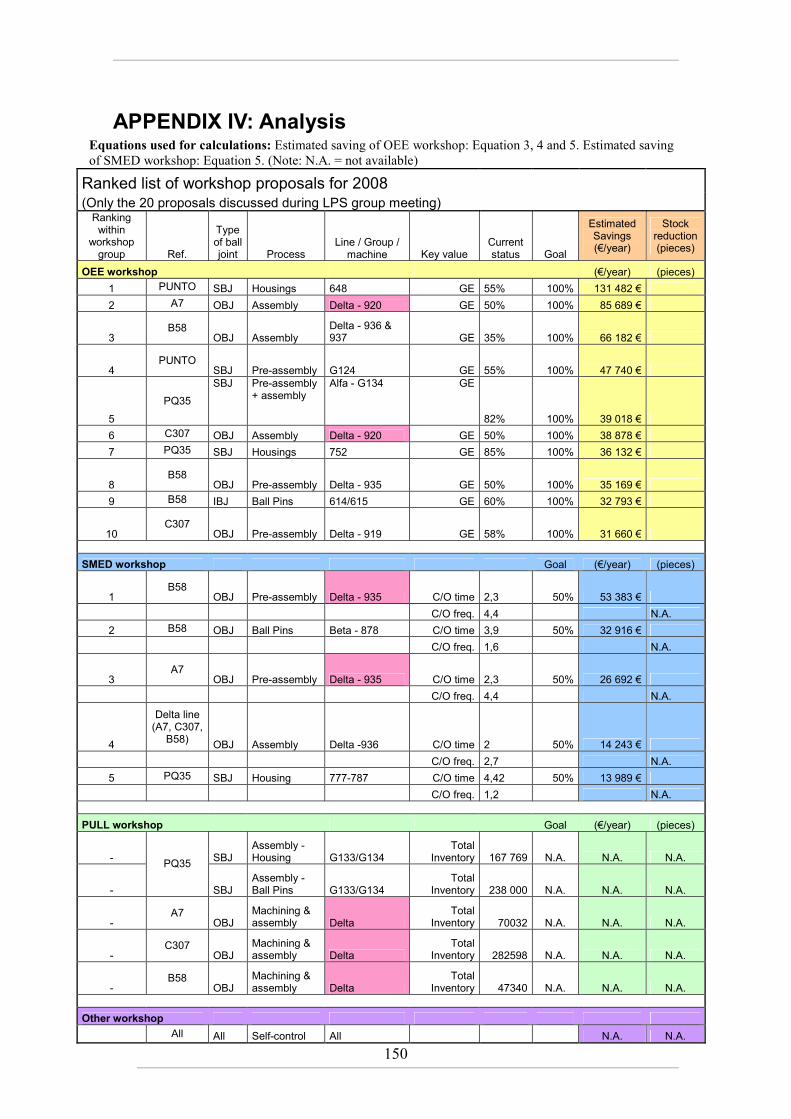
150
APPENDIX IV: Analysis Equations used for calculations: Estimated saving of OEE workshop: Equation 3, 4 and 5. Estimated saving of SMED workshop: Equation 5. (Note: N.A. = not available)
Ranked list of workshop proposals for 2008 (Only the 20 proposals discussed during LPS group meeting) Ranking within
workshop group Ref.
Type of ball joint Process
Line / Group / machine Key value
Current status Goal
Estimated Savings (€/year)
Stock reduction (pieces)
OEE workshop (€/year) (pieces)
1 PUNTO SBJ Housings 648 GE 55% 100% 131 482 €
2 A7 OBJ Assembly Delta - 920 GE 50% 100% 85 689 €
3 B58
OBJ Assembly Delta - 936 & 937 GE 35% 100% 66 182 €
4 PUNTO
SBJ Pre-assembly G124 GE 55% 100% 47 740 €
5
PQ35
SBJ Pre-assembly + assembly
Alfa - G134 GE
82% 100% 39 018 €
6 C307 OBJ Assembly Delta - 920 GE 50% 100% 38 878 €
7 PQ35 SBJ Housings 752 GE 85% 100% 36 132 €
8 B58
OBJ Pre-assembly Delta - 935 GE 50% 100% 35 169 €
9 B58 IBJ Ball Pins 614/615 GE 60% 100% 32 793 €
10 C307
OBJ Pre-assembly Delta - 919 GE 58% 100% 31 660 €
SMED workshop Goal (€/year) (pieces)
1 B58
OBJ Pre-assembly Delta - 935 C/O time 2,3 50% 53 383 €
C/O freq. 4,4 N.A.
2 B58 OBJ Ball Pins Beta - 878 C/O time 3,9 50% 32 916 €
C/O freq. 1,6 N.A.
3 A7
OBJ Pre-assembly Delta - 935 C/O time 2,3 50% 26 692 €
C/O freq. 4,4 N.A.
4
Delta line (A7, C307, B58)
OBJ Assembly Delta -936 C/O time 2 50% 14 243 €
C/O freq. 2,7 N.A.
5 PQ35 SBJ Housing 777-787 C/O time 4,42 50% 13 989 €
C/O freq. 1,2 N.A.
PULL workshop Goal (€/year) (pieces)
- SBJ Assembly -Housing G133/G134
Total Inventory 167 769 N.A. N.A. N.A.
-
PQ35
SBJ Assembly - Ball Pins G133/G134
Total Inventory 238 000 N.A. N.A. N.A.
- A7
OBJ Machining & assembly Delta
Total Inventory 70032 N.A. N.A. N.A.
- C307
OBJ Machining & assembly Delta
Total Inventory 282598 N.A. N.A. N.A.
- B58
OBJ Machining & assembly Delta
Total Inventory 47340 N.A. N.A. N.A.
Other workshop
All All Self-control All N.A. N.A.
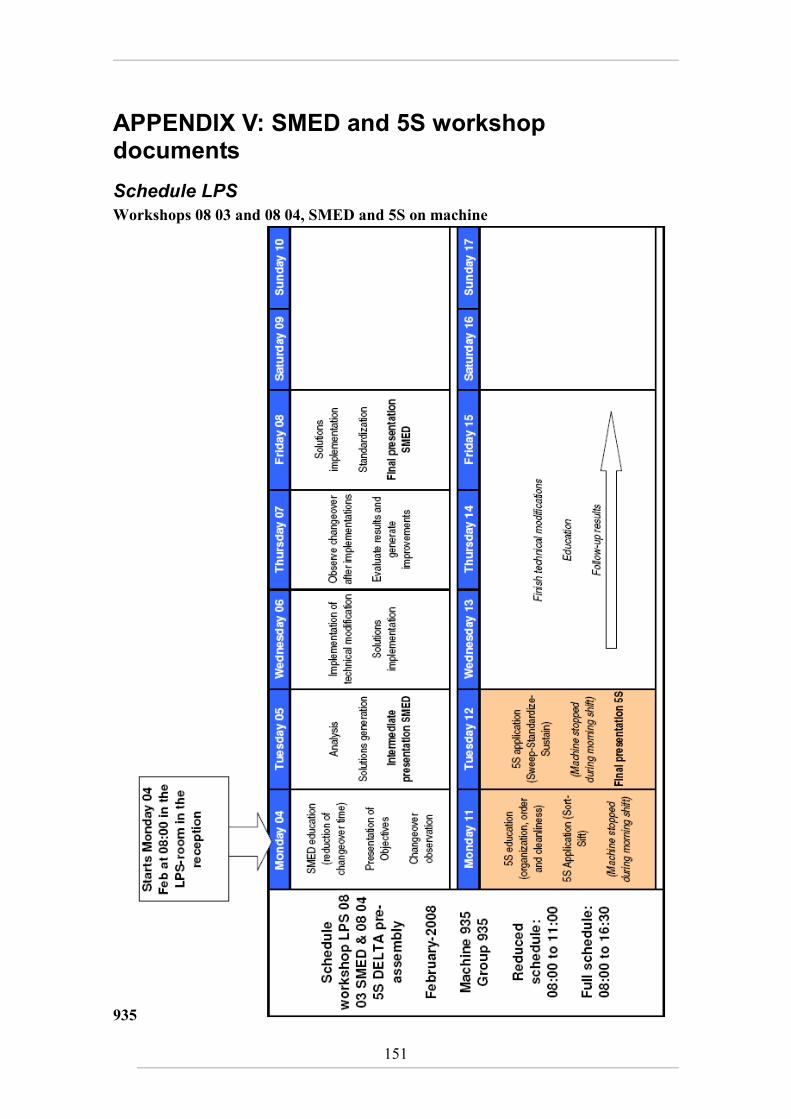
151
APPENDIX V: SMED and 5S workshop documents
Schedule LPS
Workshops 08 03 and 08 04, SMED and 5S on machine
935
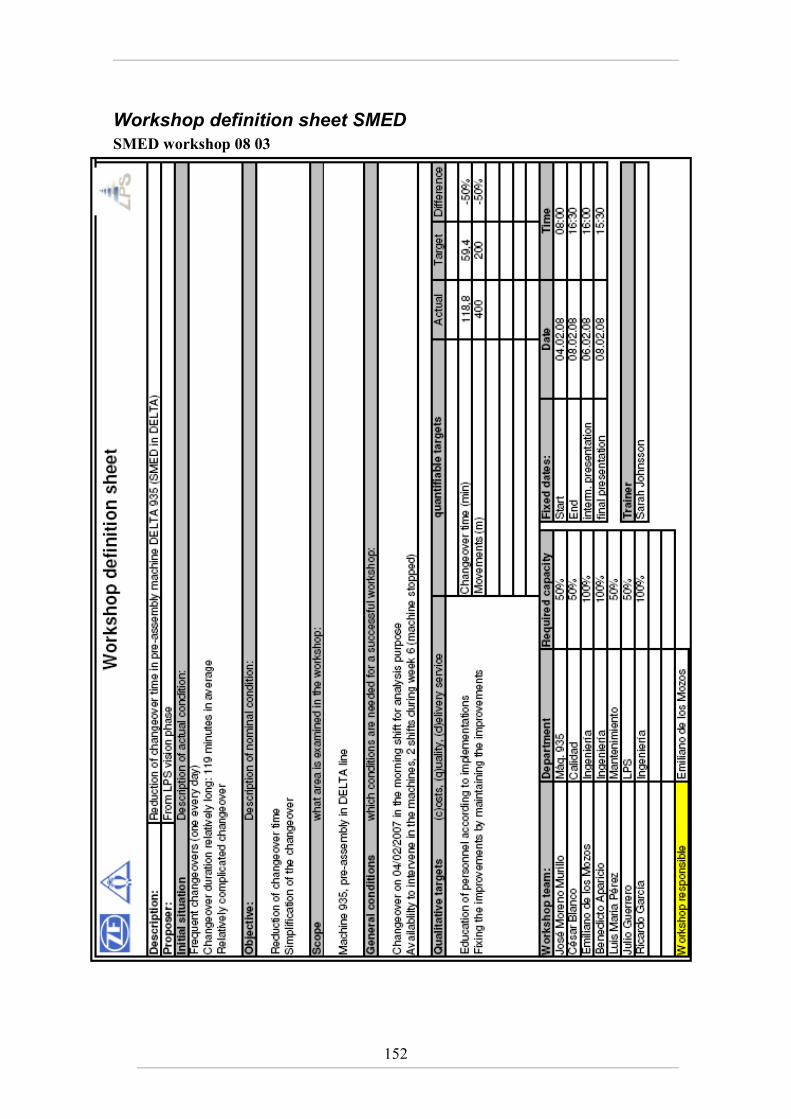
152
Workshop definition sheet SMED
SMED workshop 08 03
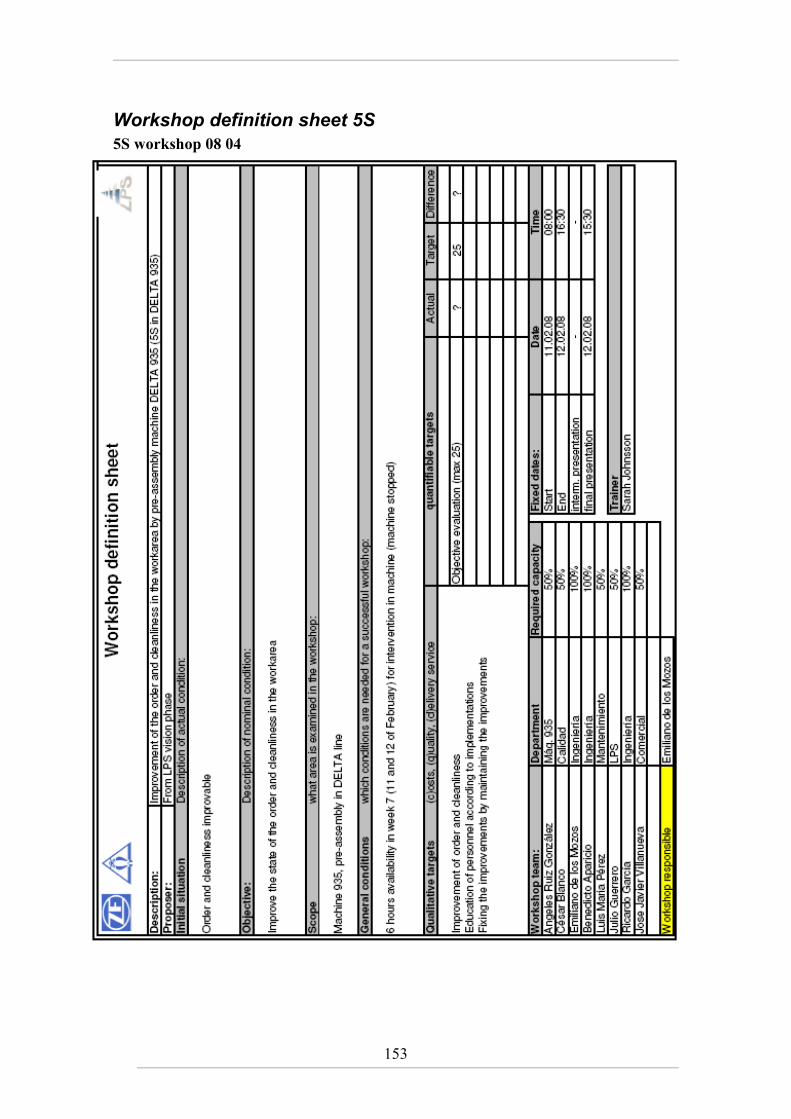
153
Workshop definition sheet 5S
5S workshop 08 04
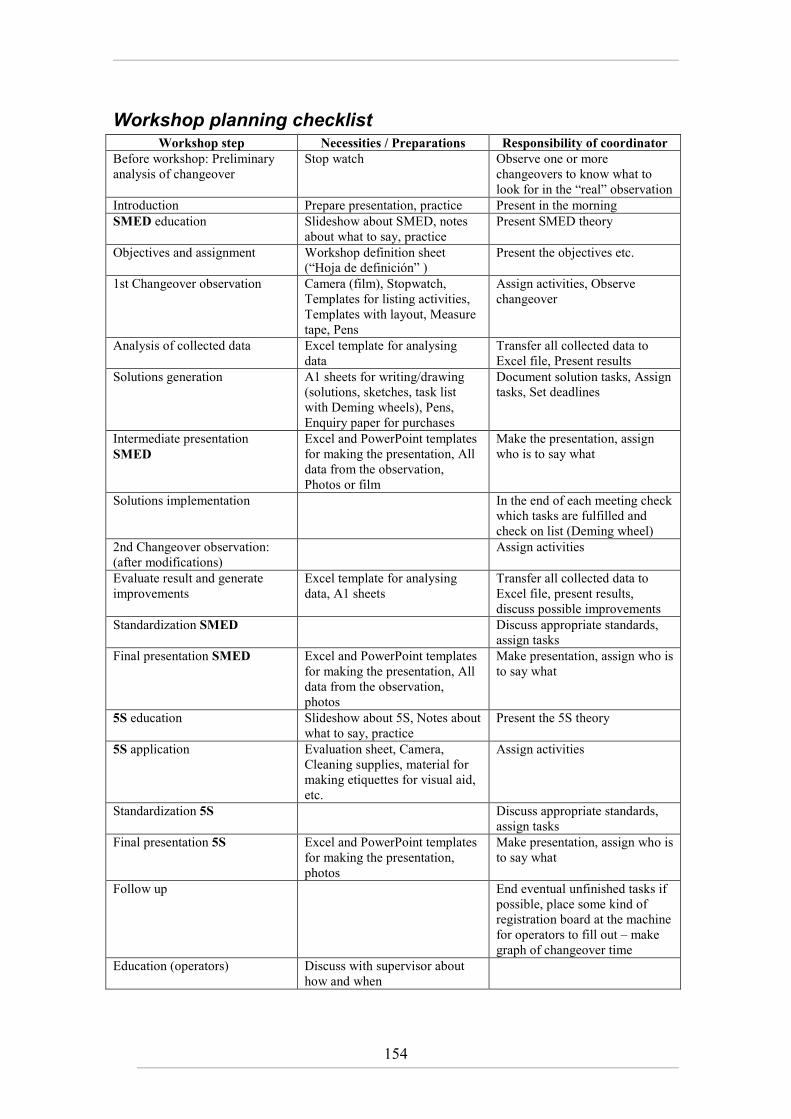
154
Workshop planning checklist Workshop step Necessities / Preparations Responsibility of coordinator
Before workshop: Preliminary analysis of changeover
Stop watch Observe one or more changeovers to know what to look for in the “real” observation
Introduction Prepare presentation, practice Present in the morning SMED education Slideshow about SMED, notes
about what to say, practice Present SMED theory
Objectives and assignment Workshop definition sheet (“Hoja de definición” )
Present the objectives etc.
1st Changeover observation Camera (film), Stopwatch, Templates for listing activities, Templates with layout, Measure tape, Pens
Assign activities, Observe changeover
Analysis of collected data Excel template for analysing data
Transfer all collected data to Excel file, Present results
Solutions generation A1 sheets for writing/drawing (solutions, sketches, task list with Deming wheels), Pens, Enquiry paper for purchases
Document solution tasks, Assign tasks, Set deadlines
Intermediate presentation SMED
Excel and PowerPoint templates for making the presentation, All data from the observation, Photos or film
Make the presentation, assign who is to say what
Solutions implementation In the end of each meeting check which tasks are fulfilled and check on list (Deming wheel)
2nd Changeover observation: (after modifications)
Assign activities
Evaluate result and generate improvements
Excel template for analysing data, A1 sheets
Transfer all collected data to Excel file, present results, discuss possible improvements
Standardization SMED Discuss appropriate standards, assign tasks
Final presentation SMED
Excel and PowerPoint templates for making the presentation, All data from the observation, photos
Make presentation, assign who is to say what
5S education
Slideshow about 5S, Notes about what to say, practice
Present the 5S theory
5S application Evaluation sheet, Camera, Cleaning supplies, material for making etiquettes for visual aid, etc.
Assign activities
Standardization 5S Discuss appropriate standards, assign tasks
Final presentation 5S
Excel and PowerPoint templates for making the presentation, photos
Make presentation, assign who is to say what
Follow up End eventual unfinished tasks if possible, place some kind of registration board at the machine for operators to fill out – make graph of changeover time
Education (operators) Discuss with supervisor about how and when
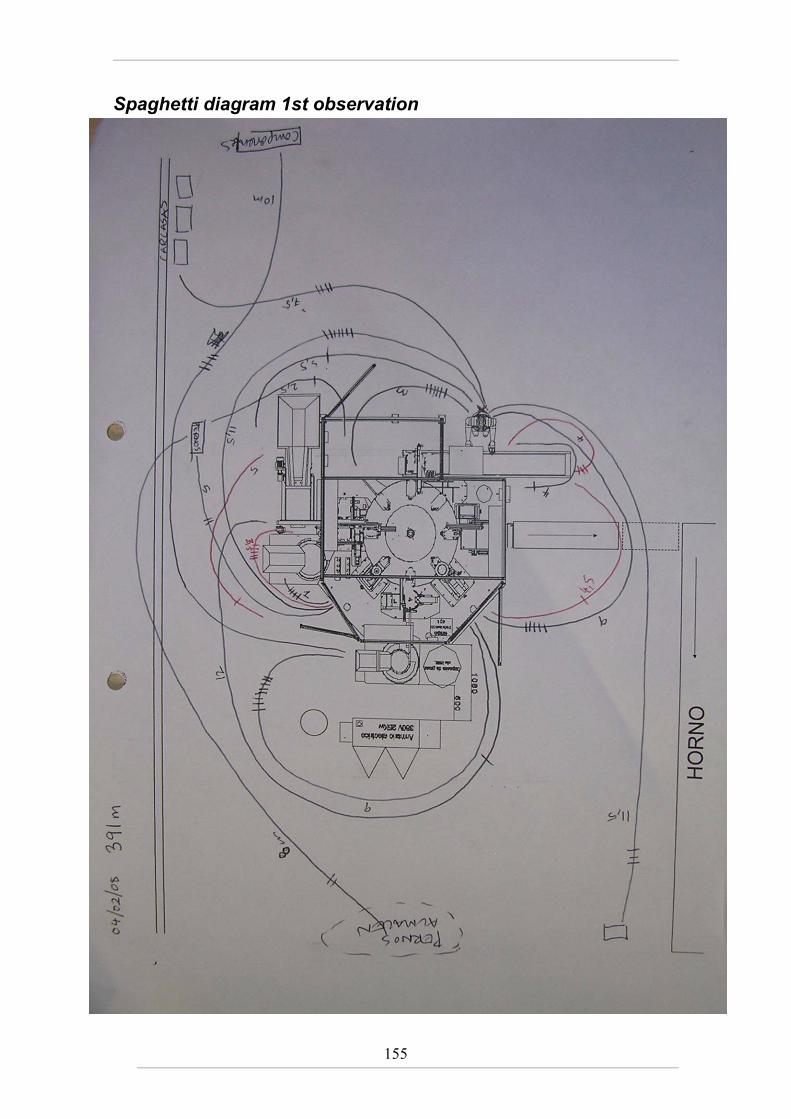
155
Spaghetti diagram 1st observation
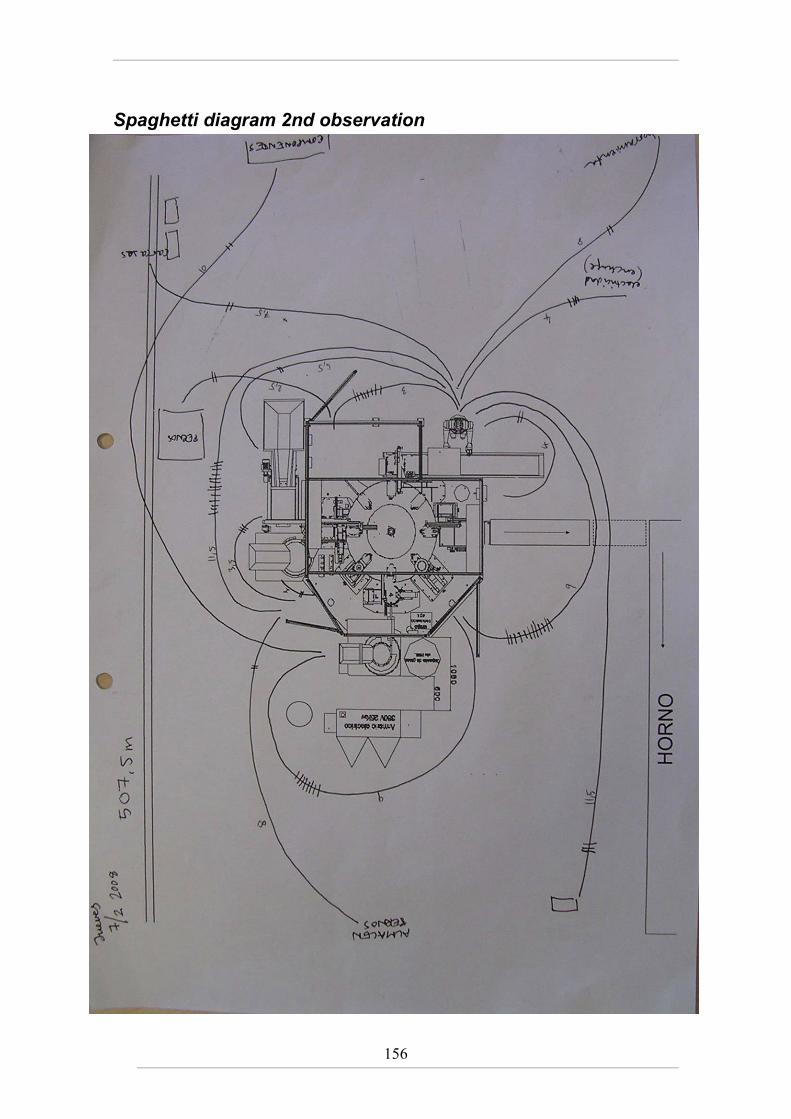
156
Spaghetti diagram 2nd observation
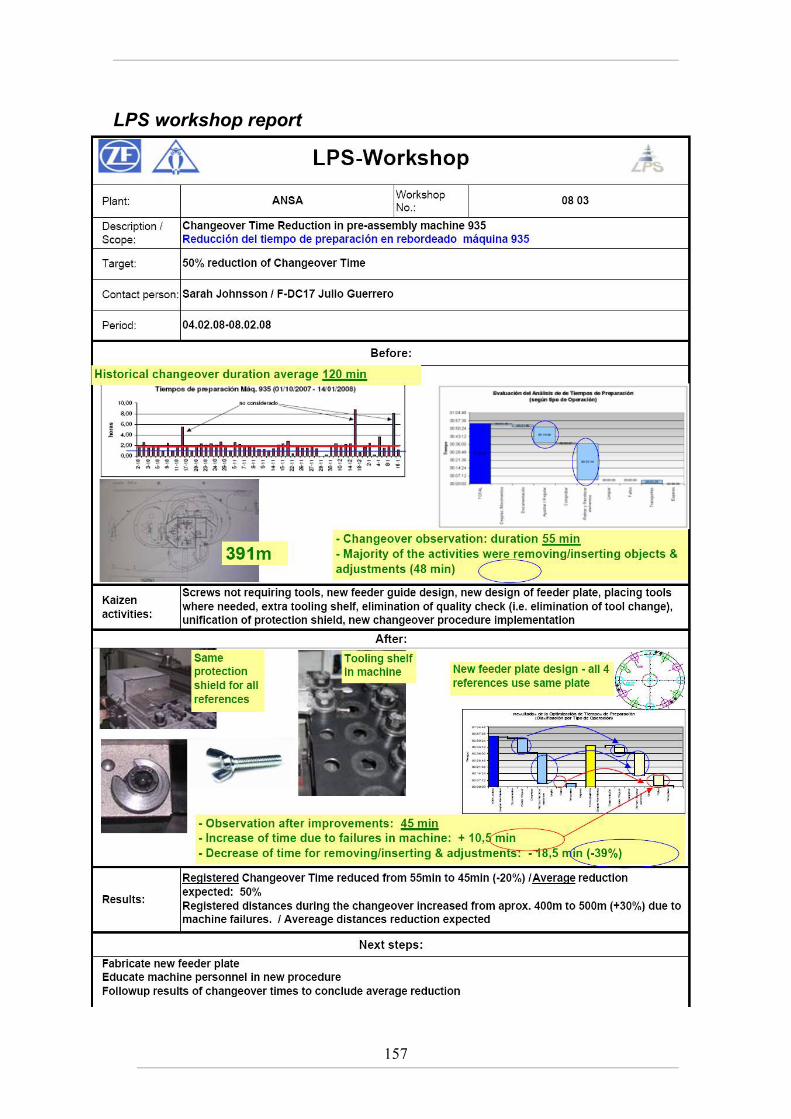
157
LPS workshop report
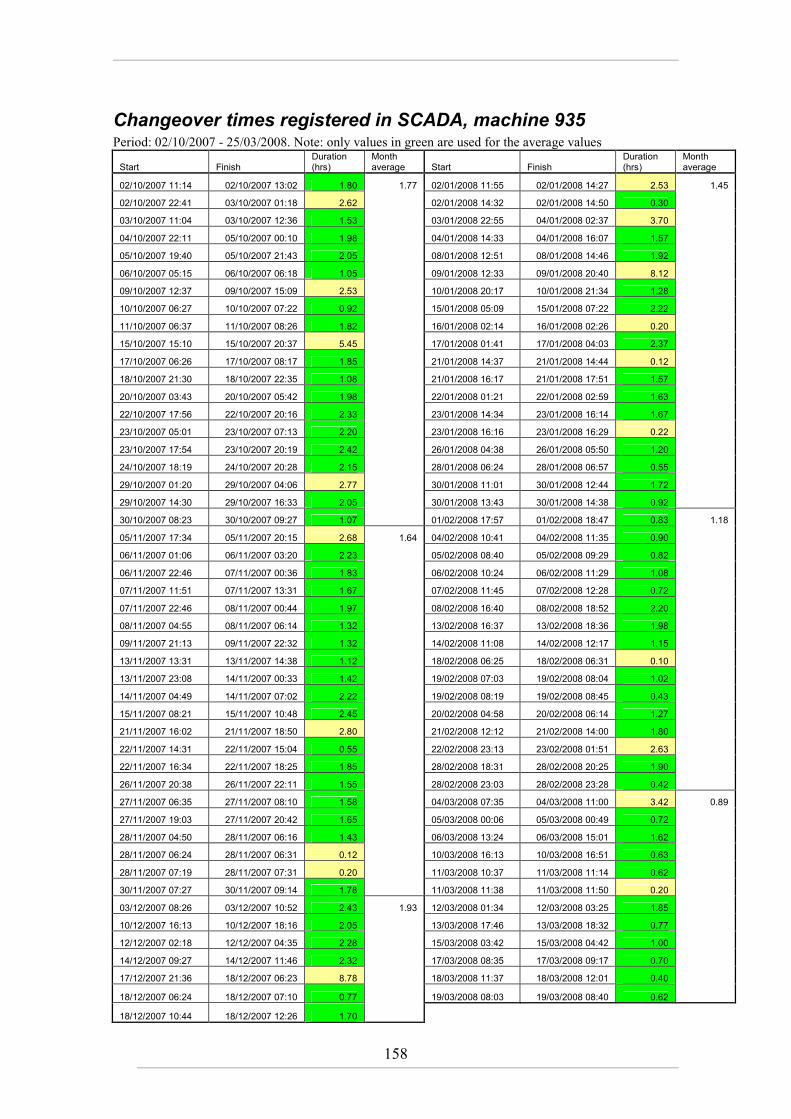
158
Changeover times registered in SCADA, machine 935 Period: 02/10/2007 - 25/03/2008. Note: only values in green are used for the average values
Start Finish Duration (hrs)
Month average Start Finish
Duration (hrs)
Month average
02/10/2007 11:14 02/10/2007 13:02 1.80 1.77 02/01/2008 11:55 02/01/2008 14:27 2.53 1.45
02/10/2007 22:41 03/10/2007 01:18 2.62 02/01/2008 14:32 02/01/2008 14:50 0.30
03/10/2007 11:04 03/10/2007 12:36 1.53 03/01/2008 22:55 04/01/2008 02:37 3.70
04/10/2007 22:11 05/10/2007 00:10 1.98 04/01/2008 14:33 04/01/2008 16:07 1.57
05/10/2007 19:40 05/10/2007 21:43 2.05 08/01/2008 12:51 08/01/2008 14:46 1.92
06/10/2007 05:15 06/10/2007 06:18 1.05 09/01/2008 12:33 09/01/2008 20:40 8.12
09/10/2007 12:37 09/10/2007 15:09 2.53 10/01/2008 20:17 10/01/2008 21:34 1.28
10/10/2007 06:27 10/10/2007 07:22 0.92 15/01/2008 05:09 15/01/2008 07:22 2.22
11/10/2007 06:37 11/10/2007 08:26 1.82 16/01/2008 02:14 16/01/2008 02:26 0.20
15/10/2007 15:10 15/10/2007 20:37 5.45 17/01/2008 01:41 17/01/2008 04:03 2.37
17/10/2007 06:26 17/10/2007 08:17 1.85 21/01/2008 14:37 21/01/2008 14:44 0.12
18/10/2007 21:30 18/10/2007 22:35 1.08 21/01/2008 16:17 21/01/2008 17:51 1.57
20/10/2007 03:43 20/10/2007 05:42 1.98 22/01/2008 01:21 22/01/2008 02:59 1.63
22/10/2007 17:56 22/10/2007 20:16 2.33 23/01/2008 14:34 23/01/2008 16:14 1.67
23/10/2007 05:01 23/10/2007 07:13 2.20 23/01/2008 16:16 23/01/2008 16:29 0.22
23/10/2007 17:54 23/10/2007 20:19 2.42 26/01/2008 04:38 26/01/2008 05:50 1.20
24/10/2007 18:19 24/10/2007 20:28 2.15 28/01/2008 06:24 28/01/2008 06:57 0.55
29/10/2007 01:20 29/10/2007 04:06 2.77 30/01/2008 11:01 30/01/2008 12:44 1.72
29/10/2007 14:30 29/10/2007 16:33 2.05 30/01/2008 13:43 30/01/2008 14:38 0.92
30/10/2007 08:23 30/10/2007 09:27 1.07 01/02/2008 17:57 01/02/2008 18:47 0.83 1.18
05/11/2007 17:34 05/11/2007 20:15 2.68 1.64 04/02/2008 10:41 04/02/2008 11:35 0.90
06/11/2007 01:06 06/11/2007 03:20 2.23 05/02/2008 08:40 05/02/2008 09:29 0.82
06/11/2007 22:46 07/11/2007 00:36 1.83 06/02/2008 10:24 06/02/2008 11:29 1.08
07/11/2007 11:51 07/11/2007 13:31 1.67 07/02/2008 11:45 07/02/2008 12:28 0.72
07/11/2007 22:46 08/11/2007 00:44 1.97 08/02/2008 16:40 08/02/2008 18:52 2.20
08/11/2007 04:55 08/11/2007 06:14 1.32 13/02/2008 16:37 13/02/2008 18:36 1.98
09/11/2007 21:13 09/11/2007 22:32 1.32 14/02/2008 11:08 14/02/2008 12:17 1.15
13/11/2007 13:31 13/11/2007 14:38 1.12 18/02/2008 06:25 18/02/2008 06:31 0.10
13/11/2007 23:08 14/11/2007 00:33 1.42 19/02/2008 07:03 19/02/2008 08:04 1.02
14/11/2007 04:49 14/11/2007 07:02 2.22 19/02/2008 08:19 19/02/2008 08:45 0.43
15/11/2007 08:21 15/11/2007 10:48 2.45 20/02/2008 04:58 20/02/2008 06:14 1.27
21/11/2007 16:02 21/11/2007 18:50 2.80 21/02/2008 12:12 21/02/2008 14:00 1.80
22/11/2007 14:31 22/11/2007 15:04 0.55 22/02/2008 23:13 23/02/2008 01:51 2.63
22/11/2007 16:34 22/11/2007 18:25 1.85 28/02/2008 18:31 28/02/2008 20:25 1.90
26/11/2007 20:38 26/11/2007 22:11 1.55 28/02/2008 23:03 28/02/2008 23:28 0.42
27/11/2007 06:35 27/11/2007 08:10 1.58 04/03/2008 07:35 04/03/2008 11:00 3.42 0.89
27/11/2007 19:03 27/11/2007 20:42 1.65 05/03/2008 00:06 05/03/2008 00:49 0.72
28/11/2007 04:50 28/11/2007 06:16 1.43 06/03/2008 13:24 06/03/2008 15:01 1.62
28/11/2007 06:24 28/11/2007 06:31 0.12 10/03/2008 16:13 10/03/2008 16:51 0.63
28/11/2007 07:19 28/11/2007 07:31 0.20 11/03/2008 10:37 11/03/2008 11:14 0.62
30/11/2007 07:27 30/11/2007 09:14 1.78 11/03/2008 11:38 11/03/2008 11:50 0.20
03/12/2007 08:26 03/12/2007 10:52 2.43 1.93 12/03/2008 01:34 12/03/2008 03:25 1.85
10/12/2007 16:13 10/12/2007 18:16 2.05 13/03/2008 17:46 13/03/2008 18:32 0.77
12/12/2007 02:18 12/12/2007 04:35 2.28 15/03/2008 03:42 15/03/2008 04:42 1.00
14/12/2007 09:27 14/12/2007 11:46 2.32 17/03/2008 08:35 17/03/2008 09:17 0.70
17/12/2007 21:36 18/12/2007 06:23 8.78 18/03/2008 11:37 18/03/2008 12:01 0.40
18/12/2007 06:24 18/12/2007 07:10 0.77 19/03/2008 08:03 19/03/2008 08:40 0.62
18/12/2007 10:44 18/12/2007 12:26 1.70
159
APPENDIX VI: Web reference printouts
Validity
“ 2. The quality of being well-founded on fact, or established on sound principles, and thoroughly applicable to the case or circumstances; soundness and strength (of argument, proof, authority, etc.). a. In the phrase of...validity.” http://dictionary.oed.com.focus.lib.kth.se/cgi/entry/50274591?single=1&query_type=word&queryword=validity&first=1&max_to_show=10
Reliability
“ 2. Statistics. The extent to which a measurement made repeatedly in identical circumstances will yield concordant results.” http://dictionary.oed.com.focus.lib.kth.se/cgi/entry/50202002?single=1&query_type=word&queryword=reliability&first=1&max_to_show=10
Batch
“5. transf. A quantity produced at one operation, e.g. a brewing; a lot. arch.” http://dictionary.oed.com.focus.lib.kth.se/cgi/entry/50018304?query_type=word&queryword=batch&first=1&max_to_show=10&sort_type=alpha&result_place=3&search_id=W7RW-twsuYn-6991&hilite=50018304
SCADA
“SCADA is the acronym for Supervisory Control And Data Acquisition. In Europe, SCADA refers to a large-scale, distributed measurement and control system, while in the rest of the world SCADA may describe systems of any size or geographical distribution. SCADA systems are typically used to perform data collection and control at the supervisory level. Some systems are called SCADA despite only performing data acquisition and not control. The supervisory control system is a system that is placed on top of a real-time control system to control a process that is external to the SCADA system (i.e. a computer, by itself, is not a SCADA system even though it controls its own power consumption and cooling). This implies that the system is not critical to control the process in real time, as there is a separate or integrated real-time automated control system that can respond quickly enough to compensate for process changes within the time constants of the process. The process can be industrial, infrastructure or facility based as described below:
• Industrial processes include those of manufacturing, production, power generation, fabrication, and refining, and may run in continuous, batch, repetitive, or discrete modes.
• Infrastructure processes may be public or private, and include water treatment and distribution, wastewater collection and treatment, oil and gas pipelines, electrical power transmission and distribution, and large communication systems.
• Facility processes occur both in public facilities and private ones, including buildings, airports, ships, and space stations. They monitor and control HVAC, access, and energy consumption.”
http://en.wikipedia.org/wiki/SCADA
160
SAP
“SAP was founded in 1972 as Systemanalyse und Programmentwicklung[2] by five former IBM engineers in Mannheim, Baden-Württemberg (Dietmar Hopp, Hans-Werner Hector, Hasso Plattner, Klaus Tschira, and Claus Wellenreuther).[3] The acronym was later changed to stand for Systeme, Anwendungen und Produkte in der Datenverarbeitung ("Systems, Applications and Products in Data Processing").” “SAP ERP is one of five major enterprise applications in SAP's Business Suite. The other four applications are:
• customer relationship management (CRM) - helps companies acquire and retain customers, gain deep marketing and customer insight, and align organization on customer-focused strategies
• product lifecycle management (PLM) - helps manufacturers with a single source of all product-related information necessary for collaborating with business partners and supporting product lines
• supply chain management (SCM) - helps companies enhance operational flexibility across global enterprises and provide real-time visibility for customers and suppliers
• supplier relationship management (SRM) - customers can collaborate closely with suppliers and integrate sourcing processes with applications throughout the enterprise to enhance transparency and lower costs “
http://en.wikipedia.org/wiki/SAP_AG
Lean Manufacturing
“Lean manufacturing is the production of goods using less of everything compared to traditional mass production: less waste, human effort, manufacturing space, investment in tools, inventory, and engineering time to develop a new product. Lean manufacturing is a generic process management philosophy derived mostly from the War Manpower Commission which led to the Toyota Production System (TPS)[1] and also from other sources. It is renowned for its focus on reduction of the original Toyota 'seven wastes' in order to improve overall customer value but has some key new perspectives on how to do this. Lean is often linked with Six Sigma because of that methodology's emphasis on reduction of process variation (or its converse smoothness) and Toyota's combined usage (with the TPS). Toyota's steady growth from a small player to the most valuable and the biggest car company in the world has focused attention upon how it has achieved this.” http://en.wikipedia.org/wiki/Lean_manufacturing
SMED
“Single Minute Exchange of Die (SMED) is one of the many lean production methods for reducing waste in a manufacturing process. It provides a rapid and efficient way of converting a manufacturing process from running the current product to running the next product. This rapid changeover is key to reducing production lot sizes and thereby improving flow (Mura) which is a 'Lean' aim. It is also often referred to as Quick Changeover (QCO). Performing faster change-overs is important in manufacturing, or any process, because they make low cost flexible operations possible.
161
The phrase "single minute" does not mean that all changeovers and startups should take only one minute, but that they should take less than 10 minutes (in other words, "single digit minute"). “ http://en.wikipedia.org/wiki/Single_Minute_Exchange_of_Die
ZF web
“ZF is a leading worldwide automotive supplier for Driveline and Chassis Technology. The company operates 120 plants located in 25 countries and has nearly 58,000 employees including around 23,000 working at foreign locations. ZF estimated revenues in 2007 totaled EUR 12.6 billion. ZF ranks among the 15 biggest automotive suppliers worldwide. ZF develops and produces products serving the mobility of human beings and goods. Innovations in Driveline and Chassis Technol-ogy provide increased driving dynamics, safety, comfort, and econ-omy as well as lower fuel consumption and emissions in the vehi-cles of the customers: By land, by sea, and in the air. ZF’s main priority is to meet its customers’ needs by using leading technology, quality, and service; this is the key to strengthening the international market position. In addition to the benefits of com-ponent expertise, the customer profits from the Group’s system know-how. ZF is a decentralized organization with divisions and business units. They are responsible for worldwide products, markets, and results and are run as profit centers. These operational entities are governed by strategic and financial objectives. ZF plays an active role in society and is continuously engaged in a dialog with the public and its employees. The company promotes employees based on qualification, performance, work ethics, and mobility. The company assumes social and societal responsibility. Environmental protection is a professed corporate objective.” http://www.zf.com/content/en/import/zf_konzern/startseite/unternehmen/Unternehmen.html
Arkansas State University webpage
Section 3: Supply Chain Design Chapter 11 Handout: Toyota Production System (TPS) and Lean Manufacturing (3.2 MB)
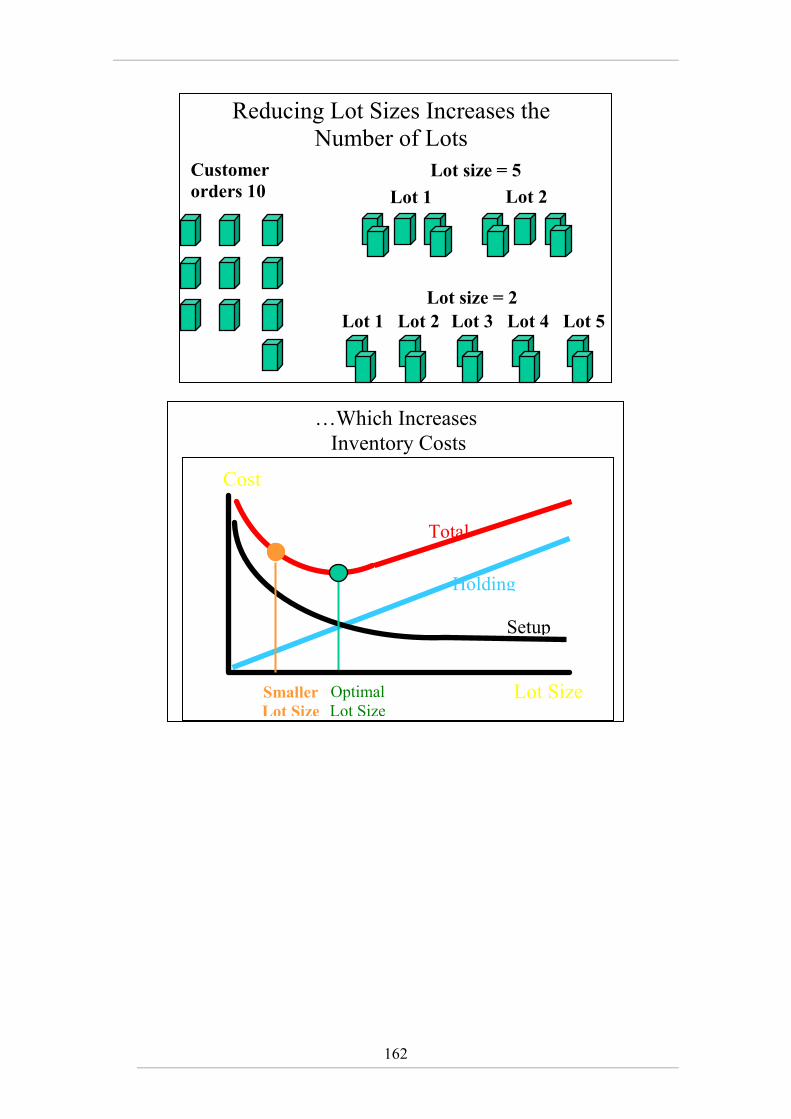
162
Customer
orders 10
Lot size = 5
Lot 1 Lot 2
Lot size = 2
Lot 1 Lot 2 Lot 3 Lot 4 Lot 5
Reducing Lot Sizes Increases the Number of Lots
…Which Increases Inventory Costs
Lot Size
Cost
Holding
Total
Setup
Optimal Lot Size
Smaller
Lot Size
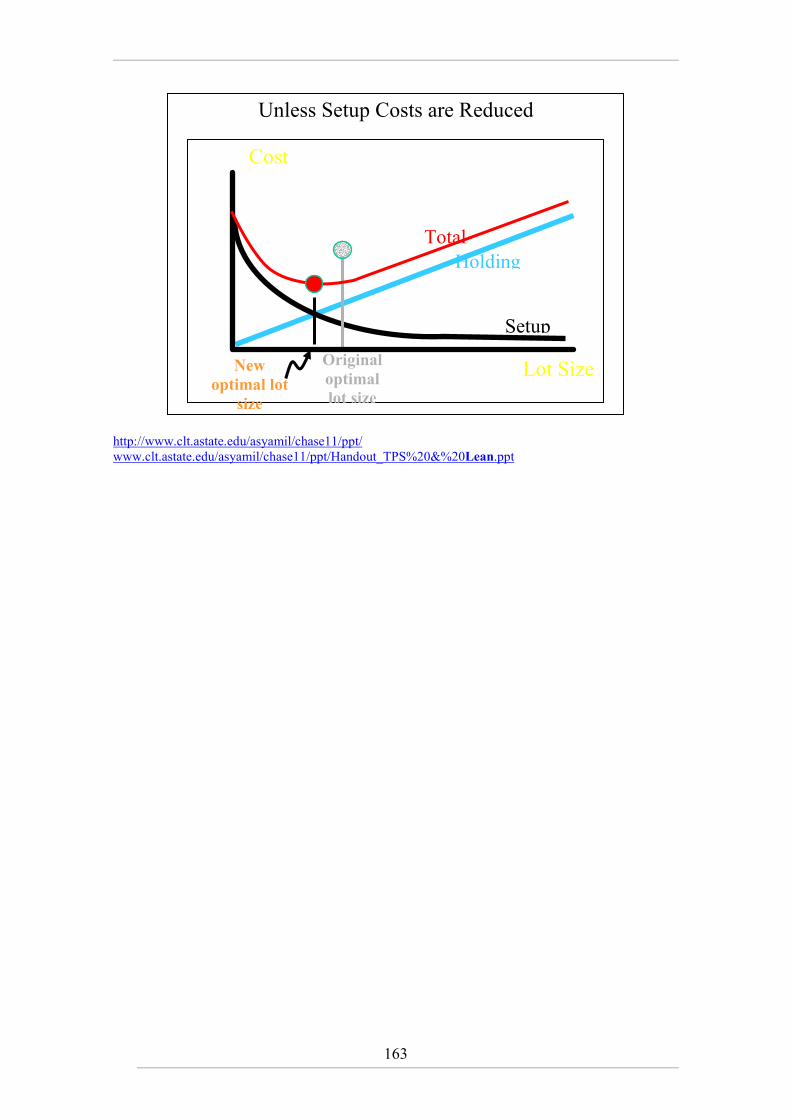
163
http://www.clt.astate.edu/asyamil/chase11/ppt/ www.clt.astate.edu/asyamil/chase11/ppt/Handout_TPS%20&%20Lean.ppt
Unless Setup Costs are Reduced
Lot Size
Cost
Holding Total
Setup
Original
optimal
lot size
New
optimal lot
size


![[Lean sigma] SMED&VSM](https://static.fdocuments.net/doc/165x107/55b36dcbbb61ebb11d8b4634/lean-sigma-smedvsm.jpg)


![[Lean Sigma] SMED /Chuyển đổi nhanh V2 (Khóa 1)](https://static.fdocuments.net/doc/165x107/55ac74cb1a28ab98278b47c9/lean-sigma-smed-chuyen-doi-nhanh-v2-khoa-1.jpg)