Lean Mindsets and Behaviors
128
Lean Mindsets & Behaviors Creating a High-Performance Climate for Sustained Transformation AMEChicago2012 October 15, 2012 Mike Osterling & Karen Martin
-
Upload
karen-martin -
Category
Business
-
view
4.203 -
download
2
Transcript of Lean Mindsets and Behaviors

Lean Mindsets & BehaviorsCreating a High-Performance Climate for
Sustained Transformation
AMEChicago2012October 15, 2012
Mike Osterling & Karen Martin
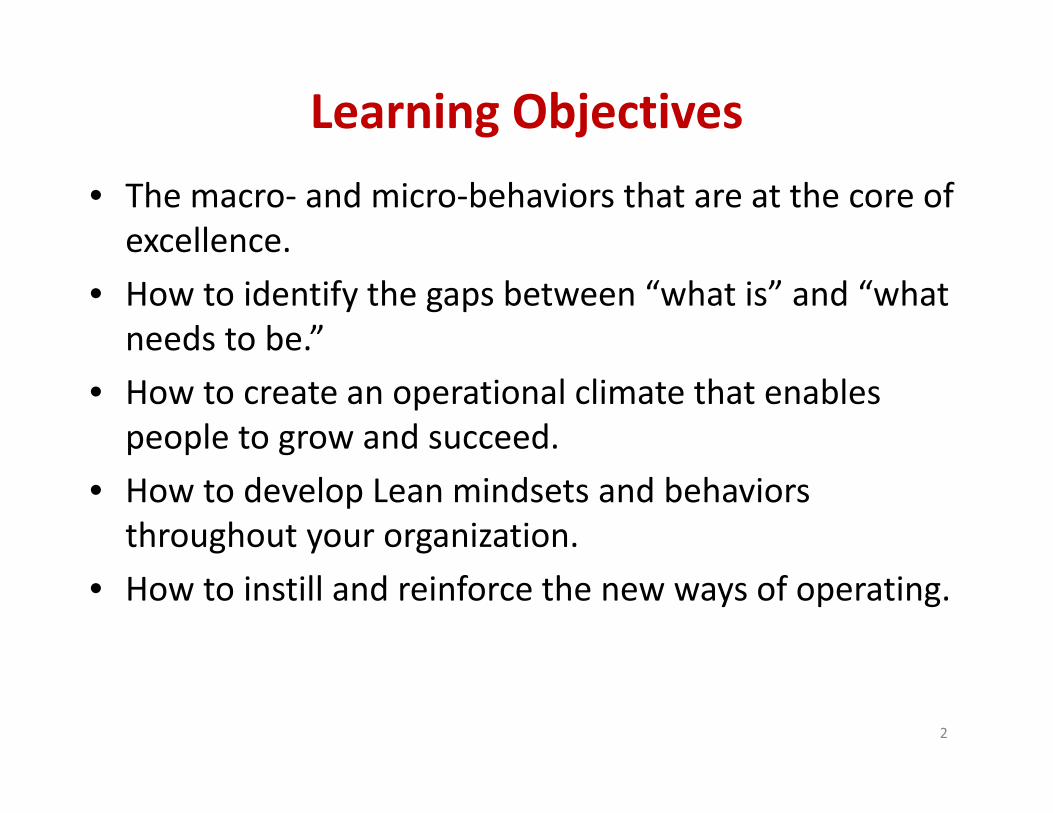
Learning Objectives• The macro‐ and micro‐behaviors that are at the core of excellence.
• How to identify the gaps between “what is” and “what needs to be.”
• How to create an operational climate that enables people to grow and succeed.
• How to develop Lean mindsets and behaviors throughout your organization.
• How to instill and reinforce the new ways of operating.
2

Success with Improvement
0%
10%
20%
30%
40%
50%
60%
70%
2001 – The Economist
Temporary LastingNone
17%
63%
20%
3

…A Decade Later
2010 – Accenture
0%
10%
20%
30%
40%
50%
60%
70%
80%
Minimal financial impact
Needs re‐evaluation, restart or complete
makeover
“Mixed” to “disappointing”
results
33%
58%69%
4

98,000 lives lost
Improvement Goal:Reduce by 50% in 5 years.
To Err is HumanInstitute of Medicine, 1999
5

6

Something Is Terribly Wrong…
7
2005
2010
2011
Progress has been slow.
Journal of the American Medical Association
180,000 Medicare patients die annually from medical errors.Office of the Inspector
General
33% hospitalized patients are harmed; 7% result in permanent
injury or death.Health Affairs
1999
Up to 98,000 people die from medical
errors.To Error is Human, Institute of Medicine

8
We need to
improvehow we improve.

Self‐inflicted
9

10
A Chaos‐Cracked Foundation Can’t Support Excellence

Mindsets & Behaviors that Reduce
Chaos
Problem Solving
Continuous Im
provement
Innovation
Agility
ResilienceBusiness Results
11

Engagement
Clarity
Focus
Discipline
12
13
“Effectiveness is a habit.”
— Peter Drucker

Group Discussion
1. Clarity
2. Focus
3. Discipline
4. Engagement
14

Group Activity ‐ Behavioral Gaps
• Part 1 – Rate your organization (company, facility, department, etc.). 2 minutes– Which of the four behaviors is it weakest in?
• Part 2 –Move to the appropriate corner for your weakest org behavior. 15 minutes– Give examples of the lack of that behavior– Which metric(s) do they affect (hard impact)?– How do they affect customers, employees and/or suppliers (soft impact)?
– Select one example & its impact to share with the full group.
• Part 3 – Report out. 10 minutes
15

Activity: Behavioral GapsHard Costs Soft Costs
Lack of Clarity
Lack of Focus
Lack of Discipline
Lack of Engagement
16

Problem Solving
Continuous Im
provement
Innovation
Agility
Resilience
Business Results
17

18

Junk Words* (10 mins)
• The line at Starbucks is long. _________________
• That car is expensive. ______________________
• That would be a long commute. ______________
* Conceptualized by Sammy Obara, Toyota by Toyota19

Seek Unbridled Clarity Around…
1. The direction your organization is heading in.2. Who your customers truly are and what needs
they have.3. What value you deliver.4. How specifically you deliver and support the
delivery of value.5. Who delivers and supports the delivery of
value.6. How you’re performing.7. The language you use.
20
21
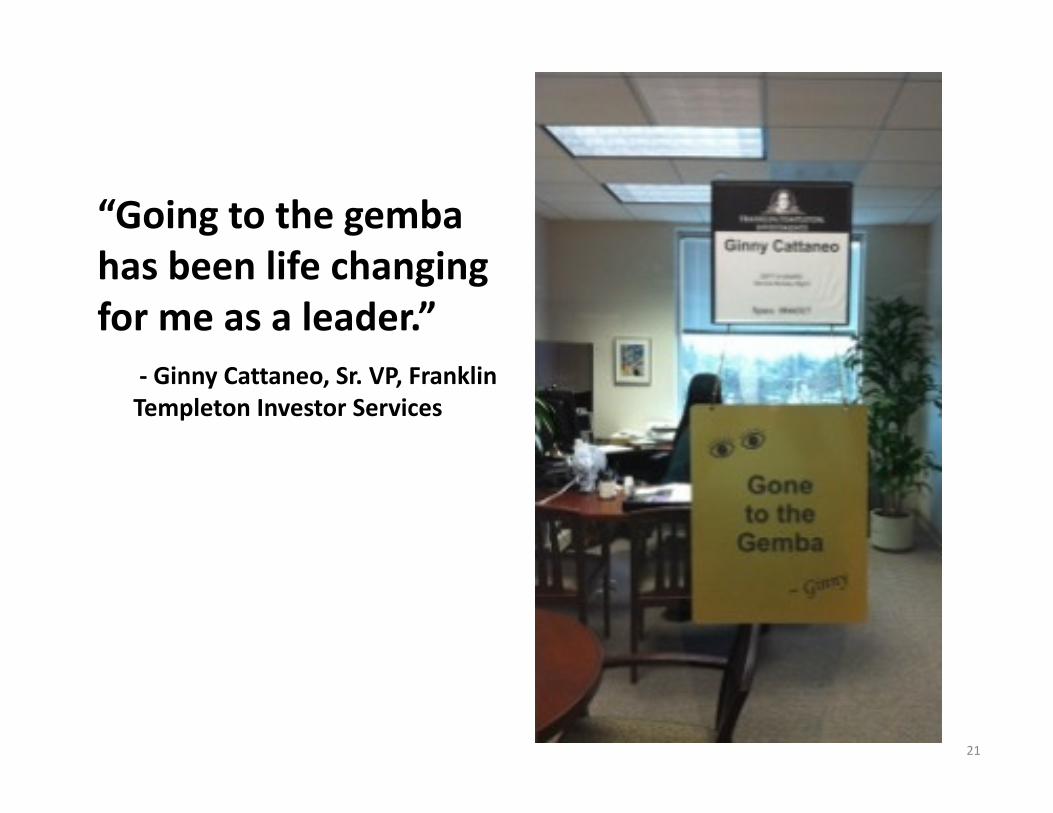
“Going to the gemba has been life changing for me as a leader.”
‐ Ginny Cattaneo, Sr. VP, FranklinTempleton Investor Services

Lean Management System
22
Team Leader Standard Work
Supervisor Standard Work
Value Stream Manager Standard Work
Plant Manager Standard Work
Standardized Processes

TruthTruth
TruthTruth
TruthTruth
TruthTruth
Truth23

Problem Solving
Continuous Im
provement
Innovation
Agility
Resilience
Business Results
24

Distraction Kills
25

Focus Needs1. Priorities – What are you striving for? What’s
important to accomplish THIS year?– Products– Processes– Marketplace– Margins– People
2. Meetings – What’s the purpose of the meeting?
26

Booz & Company Findings
0%
10%
20%
30%
40%
50%
60%
70%
80%
90%
No writtenpriorities
Conflictingpriorities
Competingdemands
82%
64%
49%
27

There is no such thing as multitasking.*
* For cognitive tasks.
28

The Myth of Multi‐tasking
• It’s not possible to do two conscious activities at once.
• You are “switch‐tasking.”• David Meyer – University of Michigan
– Engineers switched between projects 5‐8 times per day
– Each switch added 20 minutes of process time– If switch only 5x per day, adds 1.7 hrs per day or 407 hours (10 weeks) of process time per engineer
– In company w/ 15 engineers = 3 FTEs* worth of labor.
29
* FTE = Full Time Equivalent

A Key to Apple’s Success?
30
“…saying no to 1,000 things to make sure we don’t get on the wrong track or try to do too much. We’re always thinking about new markets we could enter, but it’s only by saying no that you can concentrate on the things that are really important.”
— Steve Jobs

Round 1Task 1: Lack of focus causes chaos
Task 2: 1 2 3 4 5 6 7 8 9 10 11 12 13 14 15 16 17 18 19 20 21 22
31
Round 1 – Letter, number, letter, number: L, 1, A, 2, C, 3, etc.
_________________________________________________
_________________________________________________

Round 2
Task 1: Lack of focus causes chaos
Task 2: 1 2 3 4 5 6 7 8 9 10 11 12 13 14 15 16 17 18 19 20 21 22
32
Round 2 – full sentence, followed by numbers 1‐22.
_________________________________________________
_________________________________________________
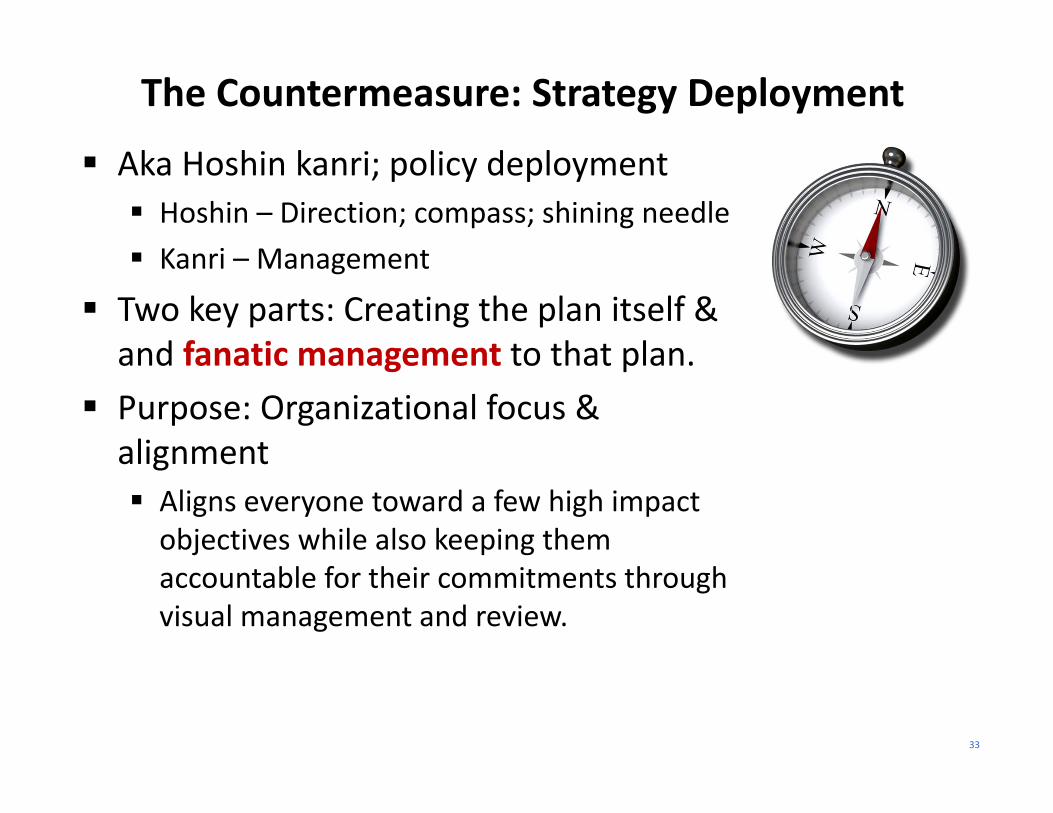
The Countermeasure: Strategy Deployment
Aka Hoshin kanri; policy deployment Hoshin – Direction; compass; shining needle Kanri – Management
Two key parts: Creating the plan itself & and fanatic management to that plan.
Purpose: Organizational focus & alignment Aligns everyone toward a few high impact objectives while also keeping them accountable for their commitments through visual management and review.
33

Strategy Deployment Key Feature: Catchball
34
Executive Team
What?How?Who?When?
Senior Mgmt
What?How?Who?When?
Middle Mgmt
What?How?Who?When?
FrontlinesWhat?How?Who?When?

84.886.3
90.693.0
95.2
105.9
80.0
87.0
94.0
101.0
108.0
115.0
FY '06 FY '07 FY '08 FY '09 FY '10 YTD '11
Productivity (Pounds Produced / Hr Worked)
PactivImplements
Strategy Deployment
35
Improve Productivity through Greater Focus

Activity: Achieving Focus List Potential Projects
36
Project / Priority
Lean Mindsets & BehaviorsAchieving Focus: Project Prioritization

“Hoshin‐Lite” Annual Work Plan
PRE ‐ Gain clarity around overarching business needs.
1. List everything you could do (and that you are doing and you plan to do).
2. Categorize into:– Must‐do, can’t fail– Maybe– Eliminate– Delay (next fiscal year)
3. Decide what you will do; gain consensus.4. Prioritize and create plan.
POST ‐Manage plan via weekly updates (may be able to reduce to monthly reviews – but be careful!).
37

Achieving FocusCategorize project list
38
Project / Priority Must Do Eliminate Delay Maybe
Project A XProject B XProject C XProject D XProject E XProject F XProject G XProject H XProject I X
Lean Mindsets & BehaviorsAchieving Focus: Project Prioritization

39
To create new ideas is a gift, but to choose wisely is a skill.
‐ Ryan Morgan

Achieving FocusMove “Maybe’s” into Other Categories
40
Project / Priority Must Do Eliminate Delay Maybe
Project A XProject B XProject C XProject D XProject E XProject F XProject G XProject H XProject I X
Lean Mindsets & BehaviorsAchieving Focus: Project Prioritization

41
Must do
Eliminate
Maybe
Delay
1. List what you could do on 3x6” post‐its (active or planned initiatives, projects & improvement activities). Gain consensus.
2. Categorize them (place post‐it on appropriate page. Gain consensus.
3. Decide what you will do. (Move “maybe’s” onto one of the other three pages.) Gain consensus.
Label Four Flip Chart Pages & Hang on Wall

42
Must do
Eliminate
Maybe
Delay
Step 4Prioritize must‐do’s; Create Plan

PACE Improvement Prioritization Grid
Low HighAnticipated Benefit
Ease
of
Imp
lem
enta
tion
Difficult
Easy
20
7
513 4
23
1
228
9
2
10
16
11
6
12
14
19
15
173 21
18
43

Achieving FocusPrioritize Must‐Do’s
Low HighAnticipated Benefit
Ease of Implem
entatio
nDifficult
Easy
44

Annual Improvement Plan
45
Jan Feb Mar Apr May Jun Jul Aug Sep Oct Nov Dec
Integrate DHR Begin MS‐1Ops
MS‐2 Acct
CompleteBrad P
Complete New Travel Program
Roll‐outBegin Complete Scott R Fred S
Roll‐out Tablets to Installation
Begin & Complete
Brad P
Complete 360 Roll‐out
Begin Complete Justin C Steve R
Lisa D, Marina,SM, Tech,Hal, Doug
Create Line‐item P.O.s
Begin Complete Lisa B Mark C
Refinance credit facil ity
Begin Scott R
Complete ADP Roll‐out
Begin Complete Gary O
Develop & Roll‐out Handheld 2.2
Begin MS‐1Clean Code
MS‐2Pilot
MS‐3Go l ive
Not complete until 2013
Steve C TBD
Complete GPS Roll‐out
Begin Complete Steve C RDs Cons., HR, Fleet
Complete "River" (One Soft) Roll‐out
Begin Complete Lisa B
Develop Safety Program
Begin Complete Gary O
Tactical Owner
Others
Company ABCPriorities
FY 2012 FY 2013Priority Exec Owner

46
X
# Action Item Owner Deliverable Jan Feb Mar Apr May Jun Jul Aug Sep Oct Nov Dec
1
2
3
4
5
6
7
8
9
10
11
12
13
14
15
16
17
18
19
20
Status(Red, Yellow, Green)
Core work team: Input/Review needed by:
Annual Improvement Plan
TimelineRelationship to Annual Business Goal(s):
Due Date 2012
= Original Plan = Complete
Tier 1 Priority:
Tier 2 Priority:
Measurable Objective(s):
% Complete
Date Created:
Next Review:
Executive Owner:
Tactical Owner:
Background/Scope:
47
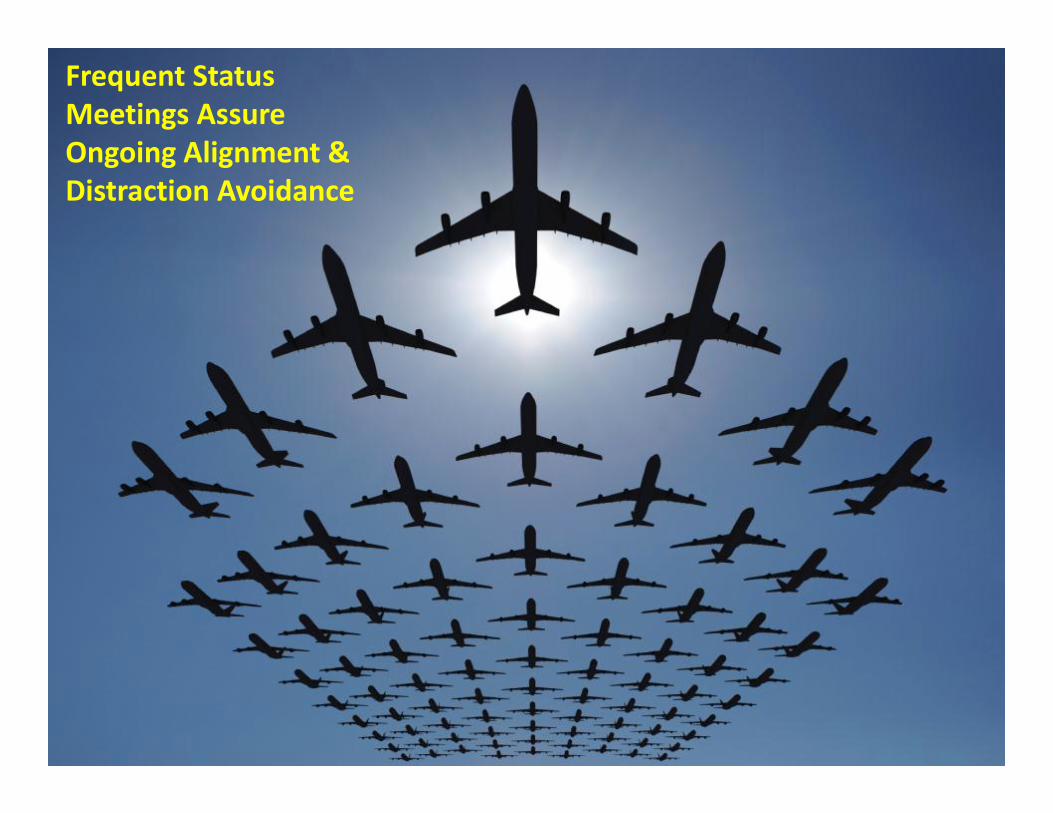
Frequent Status Meetings Assure Ongoing Alignment & Distraction Avoidance

Sporting Goods ManufacturerProduct Launches Per Year
48
0
10
20
30
40
50
60
70
80
Pre‐Focus Post‐Focus
73
24
No additional resources; higher quality products launched

Rockwell Automation
49
0
5
10
15
20
25
Pre‐Focus Post‐Focus
ProjectsStarted
ProjectsCompleted
3
12 12
20

Avoiding the Shiny Ball Syndrome (Organizational ADD) Requires…
50
• Clarity – about what really matters & organizational direction.
• Consensus – about how best to get there.
• Courage – to actively choose to “not do” or “not do now.”
• Commitment – to stick with the plan.
From The Outstanding Organization, Karen Martin

Problem Solving
Continuous Im
provement
Innovation
Agility
Resilience
Business Results
51

52
Greatness results fromDisciplined people engaged in disciplined
thinking that leads to disciplined
action.
— Jim Collins, Good to Great
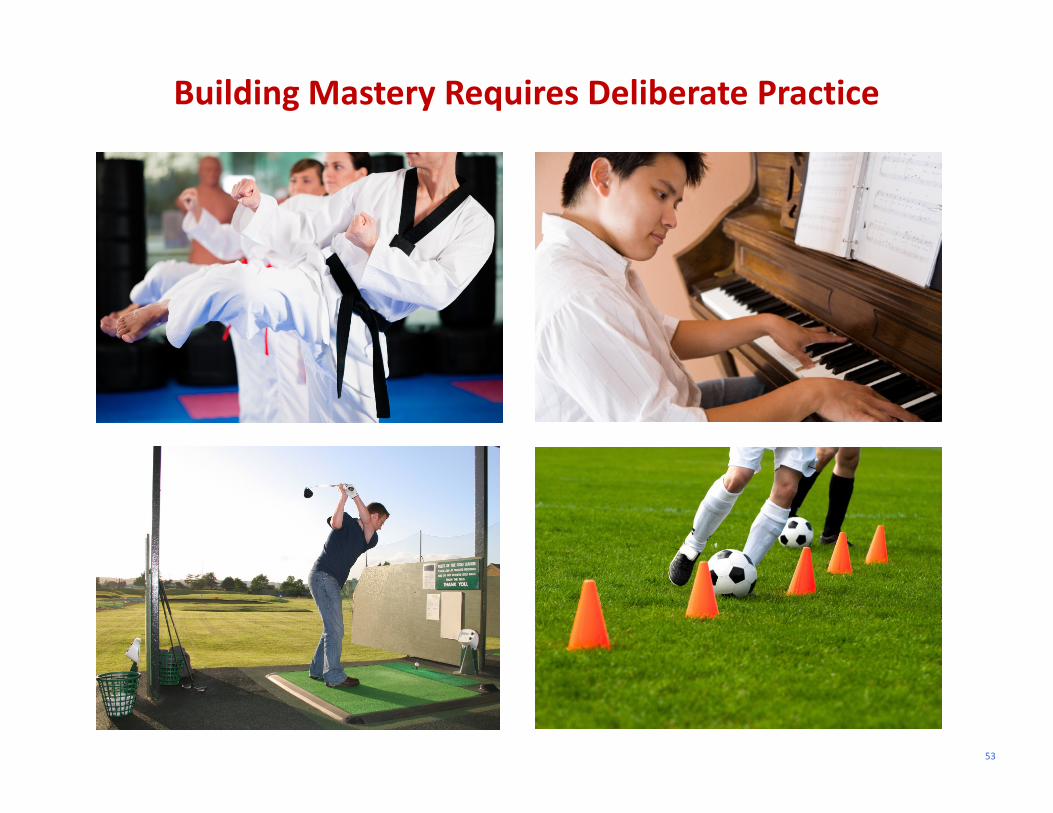
Building Mastery Requires Deliberate Practice
53

How much deliberate practice?
10,000 hours(10 Years)
Tied deliberate practice to myelin development
54

Practice vs. Performance
0%
10%
20%
30%
40%
50%
60%
70%
80%
90%
100%
Athletes Businesses
TrainPerform
55
Train90%
Train1%
Perform 99%
Perform 10%
Jim Loehr & Tony Schwartz, The Power of Full Engagement

Building Mastery
56© 2012 Karen Martin & Associates, LLC

57
MASTERY

Discipline is Needed…
• Planning• Decision making• Executing• Problem Solving & Improving• Managing processes
58

59
“It takes a different kind of thinking to solve a problem than the kind of thinking
that produced the problem.”
—Albert Einstein
60
“Most people spend more time and
energy going around problems
than in trying to solve them.”— Henry Ford

61
The Scientific Method for Problem Solving and Improving

62
Detailed Steps
1. Define and break down the problem.
2. Grasp the current condition.
3. Set a target condition.
4. Conduct root cause & gap analysis.
5. Identify potential countermeasures.
6. Develop & test countermeasure(s)
7. Refine and finalize countermeasure(s).
8. Implement countermeasure(s).
StudyEvaluate Results
9. Measure process performance.
10. Refine, standardize, & stabilize the process.
11. Monitor process performance.
12. Reflect & share learning.
Adjust
Do
Clarifying the PDSA Cycle
PlanDevelop
Hypothesis
Conduct Experiment
Refine Standardize Stabilize
Phase
Continuous Improvement
New Problem
50‐80% of the total time

Developing PDSA Capabilities
• A3 Management
• Kaizen Events
• Daily Kaizen
63
Complex
Simple

Group Discussion
• How many of you are familiar with A3 Management?
• How many of you have a disciplined A3 development program across your organization (including coach development)?
• If it’s a good idea, why aren’t more organizations doing it?
• What can you do about it?
64

Discipline is Needed…
• Planning• Decision making• Executing• Problem Solving & Improving• Managing Processes
65

Every key process…
Clearly documented
2‐5 Key Performance Indicators
Continually monitored & improved
66

67
How are you performing?
Gray – Highest industry quality scoresPurple – Median industry quality scoresBlue – Our quality scores

Value Stream Maps: Gaining Clarity around Process Performance

Activity PT LT %C&A Activity PT LT %C&A Activity PT LT %C&A Activity PT LT
Approve PO 15 240 100% Fax PO to Account Manager 5 20 100%
Notify customer when they can expect delivery
15 300 95%
Review and approve PO; send
to Order Entry 5 240 100%
Enter order into SAP 10 240
Step # ? 986
Finance / Credit
Function / Department
LT UnitsHours Worked per Day
37,500Paul Dampier
Occurrences per Year
Current State Metrics-Based Process Map
26-Nov-078
Sam Parks
Date Mapped Michael Prichard
Order FulfillmentProcess NameSpecific Conditions Domestic orders through sales force
PT Units Process Details
Mary TownsendSean MichaelsRyan AustinDianne O'Shea
7
Mapping Team
Order Entry
Account Manager
Sales Rep
Customer
Seconds
Minutes
Hours
Days
Seconds
Minutes
Hours
Days
Processes MUST be Clearly Documented, Monitored & Improved
69

70
We need to shift our focus from
managing peopleto managing processes.

71
Non‐standard Processes Yield Inconsistent Results
PeopleStandardized Processes
R3R2
R4
R1
PeopleInconsistentResults
InconsistentProcesses
Standard Processes Yield Predictable Results
DesiredResults

Process Ownership:Working On The Business
• All processes MUST have a process owner.– Closer than farther from the work.– Recognized as having the authority to lead improvement.
• Accountable for process performance.– Frequent measurement and review.– Lead/organize cross‐functional problem solving.
72

Don’t Look Away. Ever.
73

74
Before improving a process, understand –
really understand –how it is being performed
today.

75
Traditional Mapping Method:Process Flow Chart
How long does the process take? How well is the process performing?
Where are the problems?

76
October 2012
The Genesis of MBPM
August 2008
Second Edition

77
What is Metrics‐Based Process Mapping (MBPM)?
• A visual process analysis tool, which integrates:– Functional orientation of traditional swim lane process maps
– Key Lean metrics:• Lead Time• Process Time• Quality (Percent Complete and Accurate)

Metrics‐Based Process Mapping (MBPM)

79
Why Create an MBPM?
• To map admin / office processes• Understand the steps, disconnects, waste, and delays – at a micro level
• Measure process performance in terms of:– Time (lead time and process time)– Quality
• Visualizes the steps and flow• Use as standard work for training and process monitoring
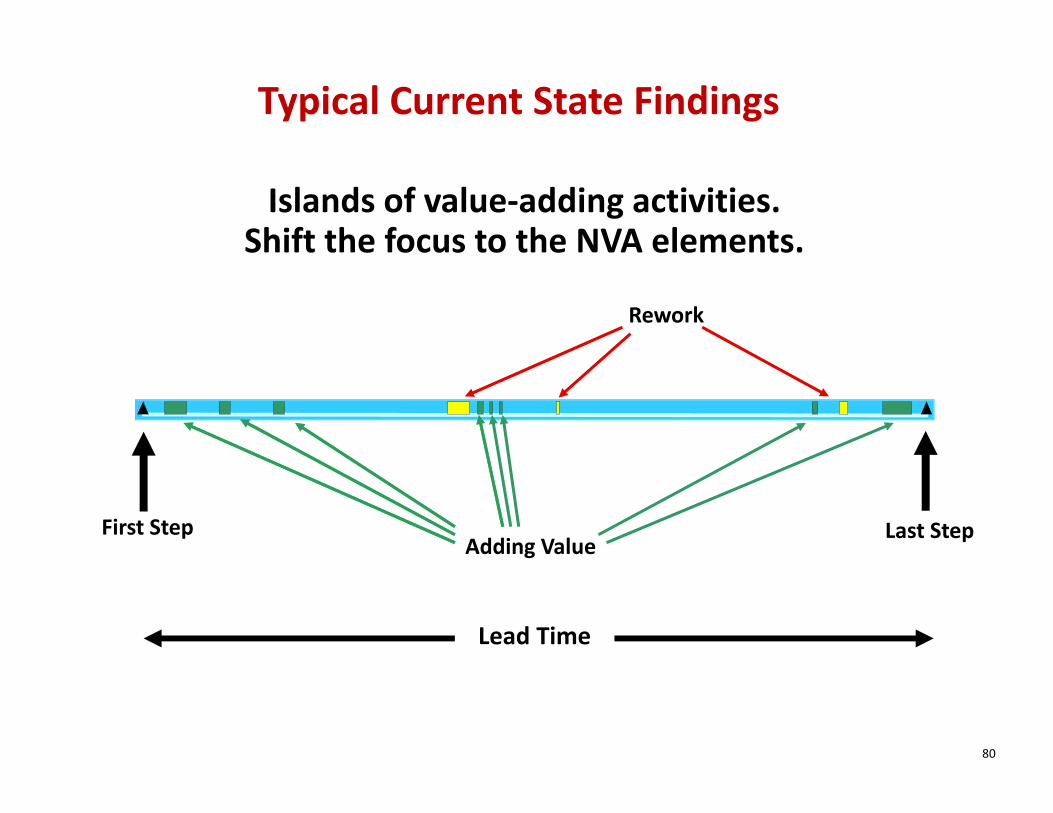
80
Islands of value‐adding activities.Shift the focus to the NVA elements.
Adding Value
Rework
First Step Last Step
Typical Current State Findings
Lead Time

81
MBPM Results
Process Before After % Improvement
New Hire Logistics LT = 25.75 days LT = 17.5 days 32%
Purchase Requisition LT = 21 days LT = 8 days 62%
Sales Order Change PT = 2.7 hours PT = 1.3 hours 52%
Supplies replenishment 17 steps 11 steps 35%
Product Demo %C&A = 2% %C&A = 20% 900%

82
MBPM – Getting Started• Define a clear scope – narrow and deep
– Define the first and last steps for the process to be improved– Lay out the specific conditions for the process to be mapped
Briefing Dates/Times
12 13 24 35 4
51 62 73 84 95 10
12 13 24 35 4
1234 Date: Date:
Executive Sponsor
Contact Information
Possible Obstacles
Signature:Date:
FacilitatorValue Stream Champion
FunctionPotential Deliverables On-Call Support
Improvement Goals & Measurable Objectives
FunctionImprovement Drivers / Current State Issues Mapping Team
Logistics Coordinator
Required Briefing Attendees
Boundaries & Limitations
FS Implementation Timeframe
Metrics-Based Process Mapping CharterImprovement Scope Leadership Mapping Schedule
Start/End Times
Trigger
Specific Conditions
Customer Demand
Last StepFirst Step
Executive Sponsor
Process Owner
Date(s)
Mapping Team Lead
Name
Facilitator
Food Provided
Location
Signature: Signature:
Approvals
Name
Process NameValue Stream

Scope: Refining the Focus
Order Fulfillment
Domestic
Units
Consumables
Service Parts
Warranty
Non‐Warranty
International
Units
Consumables
Service Parts
Warranty
Non‐Warranty
83

84
MBPM – Getting Started (continued)
• Select the team (most effective within a kaizen event)– Highly cross‐functional – workers, upstream suppliers, downstream customers, outside eyes, etc.
• Those who currently do the job– No more than 10 individuals– Don’t avoid the “difficult” people– Include “outside eyes” if possible
• Use a skilled, objective facilitator• Have a room with (long) wall space for 36” wide butcher paper
• Map on consecutive days

85
Steps in Creating the Current State MBPM
1. Label the map (process, date, team or facilitator)2. List the functions involved3. Document all activities / steps4. Review the map for completeness5. Number the activities6. Add activity‐specific information (metrics, etc.)7. Determine the timeline critical path8. Create the timeline9. Calculate the summary metrics10. Identify value‐adding (VA) and necessary non‐value‐adding
(N) activities

86
Documenting the Current StateStep 1 – Label the map in the upper right hand corner.– Include process name, conditions mapped, date, and facilitator name and/or team members.

Document the Current State
Step 2 – Label the swim lanes with the functions involved.– Include external functions, if appropriate (e.g. customers, suppliers/contractors, etc.)
– Sequence in which functions are listed is not important
87

88
Document the Current State
Step 3 – Document all activities/steps on 3” x 6” post‐its. Don’t include metrics yet!– Use verb/noun format; clear and concise– Include function.– Separate tasks that have different quality outputs or timeframes; combine tasks otherwise.
– Place post‐its in appropriate swim lane, sequentially.

89
Activity (Verb / Noun) Function that
performs the task
Document Each Activity
Best to use 3 x 6” Post‐its

Step1
Step2
Ticking clock 90
Concurrent Activities

91
Document the Current State
Step 4 – Review map for completeness (someone other than the facilitator)
– Walk through the map, reading aloud.– Verify sequence– Add missing steps and barriers to flow (“flow‐
stoppers”) if any.

Document the Current State
Step 5 ‐ Number the activities– Number the activities sequentially from left to right.– For parallel (concurrent) activities, add “A,” “B,” etc.
• Example: Step 8A, Step 8B, etc.
– Don’t number the post‐its until the map is “final.”
92

93
Document the Current State
Step 6 – Add activity‐specific information– LT – Lead time– PT – Process time– %C&A – Percent Complete & Accurate– Number of people who perform the work– Barriers to flow
• Batches• Equipment downtime• Shared resources, etc.

94
Key Metrics: Time• Process time (PT)
– The time it takes to actually perform the work to complete one item, if it could be worked on uninterrupted.
• Lead time (LT)– The elapsed time from when work is available to be worked on until it’s completed and made available to the next person or department in the process

95
Key Metrics: Quality
• %Complete and Accurate (%C&A)–% of the time the downstream customer can perform task without having to “CAC”:• Correct information or material that was supplied
• Add missing information that should have been supplied
• Clarify information provided that should have been clear

96
# Staff (if relevant)
Barriers to flow (if relevant)
Additional Information
% Complete & Accurate
PTLT
Add Activity‐Specific Information
97
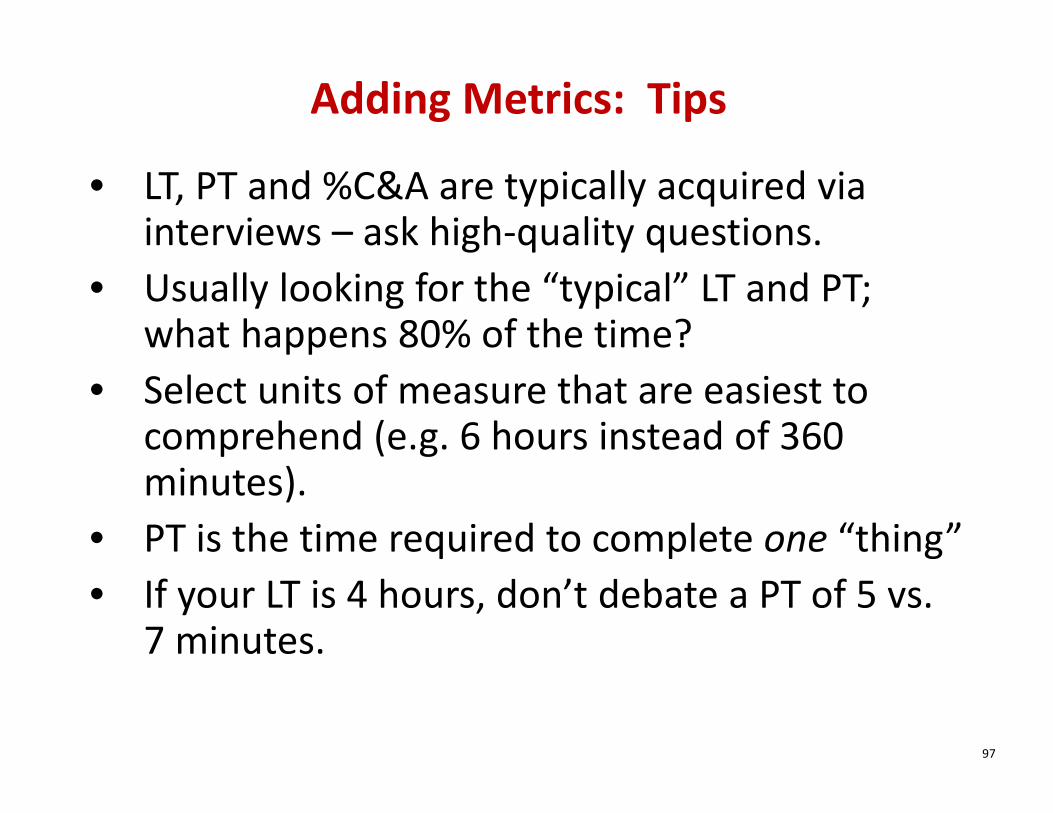
Adding Metrics: Tips
• LT, PT and %C&A are typically acquired via interviews – ask high‐quality questions.
• Usually looking for the “typical” LT and PT; what happens 80% of the time?
• Select units of measure that are easiest to comprehend (e.g. 6 hours instead of 360 minutes).
• PT is the time required to complete one “thing”• If your LT is 4 hours, don’t debate a PT of 5 vs.
7 minutes.

98
• May be OK to group the LT for a series of activities performed by the same function (rather than each individual step).
• Place %C&A value on the post‐it of the source step.– If %C&A issues are identified by multiple downstream customers, record each of the %C&As on the Post‐it of the source step (can also indicate on the Post‐it which step reported the problem).
– 0% C&A is not uncommon
Adding Metrics: Tips (continued)

99
Barriers to Flow
• Look at the process from “the thing’s” perspective
• Identify issues that prevent one‐piece‐flow of the work– Batching / periodic processing– Rework– Bottlenecks– Handoffs– Inventory– Setup / changeover– Physical layout

Document the Current State
Step 7 – Determine the “timeline critical path” of the process– For parallel activities:
• Don’t include “dead end activities”– Steps / path which don’t move the process forward (e.g. filing a document)
• If both paths are required to move forward, select the path with the longest total lead time
100

Timeline Critical Path
Critical Path
101

102
Document the Current StateStep 8 – Create the timeline
– Bring down the PT & LT from the critical path steps.
Timeline

103
Document the Current State
Step 9 ‐ Calculate Summary Metrics– Critical Path PT– Critical Path LT– Activity Ratio (AR)– Rolled Percent Complete and Accurate
(R%C&A)– Total PT– Labor Requirements– Number of Activities

104
Summary Metrics: Time
• Timeline Critical Path PT– Quantifies how much of the response time (LT) is spent actually working on the “thing”
• Timeline Critical Path LT– Measures speed of delivery to customer & an indicator of cash flow
• Activity Ratio (AR)– The percentage of time work is being done to the patient/item/data passing through the process
– AR = (Σ PT ÷ Σ LT) × 100– 100 – AR = Idle time

105
Summary Metrics: Quality
• Rolled Percent Complete and Accurate (R%C&A) = –%C&A × %C&A × %C&A × … –Out of 100 occurrences, the number of times the data/material/people pass through the entire process with no rework required (expressed as a percentage).

106
• Total PT– Sum of all activities, not just critical path– Factor in determining labor requirements
• # FTEs* Required (Total Labor Effort)
Summary Metrics: Labor Requirements
Total PT (in hrs) X # occurrences/year# FTEs Required Available work hrs/year
=
* FTE = Full‐time Equivalent(2 half time employees = 1 FTE)

Summary Metrics: Labor Effort
• Total PT– Sum of all activities, not just timeline
• Labor Effort
107
Total PT (in hrs) x # occurrences/year# FTEs*
Available work hrs/year/employee**=
* FTE = Full‐time Equivalent (2 half time employees = 1 FTE)** Available work hrs/year = 2,080 ‐ paid holidays and vacations
Freed Capacity
= Current State FTEs – Future State FTEs
Total PT (in hrs) x # occurrences/yearTime =

108
Documenting the Current State
Step 10 – Identify Value‐adding (VA) &Necessary Non‐value‐adding (N) activities
– Use small post‐its in different colors to differentiate VA and N
– Monitor time allowed for debate– Unlabelled activities = waste

Value‐adding activity
Necessary non‐value‐adding activities

110
Metrics‐Based Process Mapping (MBPM)
Simulation
Order Fulfillment Process:Demand = 2,500 orders per year
Available work hours per employee per year = 1,800

111
1. Label the map in upper right corner.• Process name, date, facilitator and/or team members
2. List the functions involved in left column.3. Document all activities/steps. No metrics yet!
• Verb/noun; concise language; include function as well.
4. Review the map for completeness.5. Number the activities. One number per column; concurrent activities are labeled A, B, C, etc.
6. Add activity‐specific metrics (PT, LT, %C&A). (We are not considering number of workers and barriers to flow in this simulation.)
Create the Current State MBPMPhase I

112
Create the Current State MBPMPhase II
7. Define the critical timeline path.• Longest LT unless “dead‐end” step; use colored marker
8. Create the timeline.9. Calculate the summary metrics
• CP PT Sum, CP LT Sum, AR, R%C&A, Total PT, Labor Required
10. Identify the VA and necessary NVA activities• Use small colored post‐it labeled with “VA” and “N.”
11. Circle the step‐specific metrics that indicate the greatest opportunity for improvement.
• Use red marker.• Long LTs, low %C&As, high PTs, low step‐specific ARs

Metric Current StateProjected
Future StateProjected % Improvement
Timeline Critical Path PTTimeline Critical Path LTActivity Ratio
Rolled %C&A
Total Process TimeFreed capacity
Document Summary Metrics

Future State Design• Goals
– Reduce overall LT & PT– Improve quality (increase RFPY)– Increase % activity– Improve LT, PT, and %C&A at individual steps
• May need to perform root cause analysis before determining countermeasures to realize the future state
• Mapping steps– Clean sheet or modify current state map– Same steps as current state– Calculate projected metrics
114

Future State Design Considerations
• Eliminate steps / handoffs• Combine steps• Create parallel paths• Alter task sequencing and/or
timing• Implement pull• Reduce / eliminate batches• Improve quality• Create an organized, visual
workplace• Reduce changeover
• Eliminate motion & transportation
• Standardize work• Eliminate unnecessary
approvals / authorizations• Stop performing non‐value
adding (NVA) tasks• Co‐locate functions based
on flow; create cells (teams of cross‐functional staff)
• Balance work to meet takttime requirements
115

Problem Solving
Continuous Im
provement
Innovation
Agility
Resilience
Business Results
116

117
Energy Crisis: Widespread Disengagement

Engagement Drivers: The Three C’s
118
Connection
ControlCreativity

Engagement Drivers
• Connection ‐ to mission, annual goals, immediate supervisor, people within the organization, customers.
• Control – heavy involvement in decisions that influence their work life.
• Creativity – Full use of talents, capacities, potentialities, and skills
119

It’s disrespectful to…1. Not engage employees in work design and
improvement.2. First blame people instead of systems and processes.3. Not help employees develop skills.4. Not coach employees through problem solving – on an
ongoing basis.5. Have poorly designed processes which inhibit
performance.6. Fail to create and clearly communicate organizational
goals and priorities.7. Lack honesty and omit relevant information.
120

Group Activity – Driving Engagement
• Three groups:– Connection– Control– Creativity
• Each group: – Identify activities and practices within your organization that engage or disengage employees in that area.
• Report out
121

Activity: Engage or Disengage?Engage Disengage
Connection
Control
Creativity
122

123
Reducing Self‐Inflicted Chaos: Where Should You Start?

Places to Start…1. Develop an intolerance for ambiguity.2. Prioritize your work; reduce the number of
active projects at once.3. Ban electronic devices from meetings.4. Adopt a problem‐solving methodology and
deploy it broadly; get a coach!5. Document, standardize and improve all major
processes with significant involvement of the workers themselves.
6. Identify process owners and KPIs for each.
124

Group Activity – Closing the Gap• Go back to your “weakest corner” (Clarity, Focus, Discipline or Engagement)– List the lean practices/methods/tools that can be used to improve your organizations’ behaviors
– Report out to the class• Next, look at your “self‐assessment” notecard, select one of your organization’s weakest areas, and begin creating a plan for how to start moving the needle (what’s the problem, what are potential root causes, what are potential countermeasures, who needs to be involved, etc.)
125

Discipline
126
As Outstanding as They Come…

Karen Martin, Principal7770 Regents Road #635San Diego, CA 92122
858.677.6799
[email protected]: @karenmartinopex
Subscribe: www.ksmartin.com/subscribe127
Mike Osterling, President4320 Woodland DriveLa Mesa, CA 91941
619.572.3632

Our Books
128Contributing Author
October 2012
Just released