Leading Strategic Change - Breaking Through the Brain Barrier
225
-
Upload
mypopohead -
Category
Documents
-
view
116 -
download
11
Transcript of Leading Strategic Change - Breaking Through the Brain Barrier


Praise for LEADING STRATEGIC CHANGE
“PROVOCATIVE, PRACTICAL, POWERFUL!”
Stephen R. CoveyAuthor of The 7 Habits of Highly Effective People
“For any executive this is an excellent roadmap for leading strategicchange!”
J. W. Marriott, Jr.Chairman and CEO, Marriott International, Inc.
“Few things add greater value than effectively leading strategic change.Few books show you how to do it better than this one.”
David UlrichAuthor of The HR Scorecard and named BusinessWeek’s #1 Business
Guru
“Leading Strategic Change is a must-read guidebook for leaders in anybusiness organization. Black and Gregersen not only identify commonbarriers to success, they also provide a framework for breaking old hab-its, mapping new paths, and setting a course for effective change.”
Kevin RollinsVice Chairman of the Board and COO, Dell Computer Corporation
“Before cracking the cover on Leading Strategic Change, I couldn’t imag-ine how another book on change could deliver anything new to a CEO.Surprise! I was astonished by how rapidly Black and Gregersen brokethrough my brain barrier. They deliver a fascinating perspective andpractical toolkit to deliver faster strategic change in our growing, globalcompany.”
Thomas GrimmCEO and President, Sam’s Club, and Executive Vice President, Wal-Mart
“Black and Gregersen debunk the myth that organizations change bychanging the organization. They understand the real dynamics a leadermust manage to convert the hearts and minds of people in a complexorganization to a new direction. If you are trying to shake things up andmake lasting change, this is the book you must read.”
Gary L. CrittendenCFO, American Express

“Finally a book on change that gets it right. Organizations don’t change.People change. Black and Gregersen give the reader extremely practicaltools to make real change happen.”
Jack ZengerVice Chairman of Provant and co-author of The Extraordinary Leader
“I have been provoked to look at my business in a different light by theconcepts developed by Black and Gregersen. The ‘brain barriers’ thatthey describe are a very real threat to any business that hopes to com-pete in this fast changing environment.”
James H. NuckolsCEO, The Sporting News
“This book broke my own brain barrier, asking me to think differentlyabout ideas and processes that I'd become too comfortable with. It's asignificant contribution to the field of organizational change and willundoubtedly help us be more successful with change. And I love themaps—they provoke my intellect and imagination.”
Margaret J. WheatleyAuthor of Leadership and the New Science and Turning to One Another
“A significant barrier to any major change or innovation managementprocess is in transparently defining the past and desired future state,then connecting the move from former to latter in an inspirational way.Leading Strategic Change offers novel framing and straightforward step-back, targeted thinking that can streamline and turbocharge the chal-lenging change progress.”
David N. DiGiulioVice President, Research & Development, Procter & Gamble
“Leading successful strategic change is one of the biggest and mostimportant challenges executives face today. Black and Gregersen offer apractical set of concepts and tools to meet that challenge.”
Sue LeeSenior Vice President Human Resources & Communications, Suncor
Energy Inc.
“I found this book special in several ways. It is not the usual descriptionof the stages of change. Instead, it describes the process of change inhuman terms—the way people really experience it. They go beneath andlook at the assumptions (mind maps) that hold people back from beingable to change.”
Jean BroomSenior Vice President, Human Resources, Itochu International, Inc.

“Talk about change has far outstripped leaders’ ability to successfullylead it. Black and Gregersen push the change leaders to explore howthey think about or ‘map’ the world in which we live. These mapsbecome either a critical barrier or an asset to their ability to lead change.The authors also provide a challenging self-examination for the seriousleader to assess his or her ability to create long-lasting and effectivechange. Thoughtful leaders will give this a very thoughtful read.”
Ralph ChristensenSenior Vice President, Human Resources, Hallmark Cards, Inc.
“Strategic change happens one person at a time. Black and Gregersenbring this statement to life by supplying critical insight combined withessential tools for helping individuals negotiate their way through orga-nizational change.”
Tyler BolliManager, Human Resources, Kohler Company
“This book presents a refreshing new way to think about leading changein organizations. Black and Gregersen redraw our maps of the changeprocess in a compelling and practical way that gets right to the heart ofmaking real change possible.”
Marion ShumwayOrganization Development Manager, Intel Corporation
“Insightful handbook packed full of valuable wisdom for unlocking thepower of mental maps in any organization’s change efforts.”
Dave KinardDirector of Organizational Effectiveness, Eli Lilly and Company
“What a pleasure to find a book on change focused on ‘leading’ ratherthan ‘managing’ change. Leaders create change; they don't react to it.This book addresses the crux of that leadership issue by focusing on peo-ple, where the real change must occur.”
Richard D. HanksCEO, BlueStep, Inc.
“Too often in the trenches of organizational life, we deceive ourselves bybelieving that if we get the boxes in an organization chart or the big sys-tems behind the boxes just right, then organizations change. Black andGregersen artfully uncover this deception by revealing a new, eye-open-ing approach to change that can help any leader of change become muchstronger and better at it.”
Mark HamberlinSenior Finance Manager, Cisco Systems Inc.

About Leading Strategic Change
Today, virtually every organization faces massive change. Unfortunately, change is extraordinarily difficult and most attempts to initiate and implement change fail. In Leading Strategic Change, J. Stewart Black and Hal B. Gregersen identify the core problem: changing the “mental maps” inside each of our heads.
Just as actual maps guide people’s footsteps, mental maps guide daily behavior. Successful strategic change for the organization is all about changing individuals first, because they are the organization.
To change organizations, you must break through the brain barrier. Perhaps Yogi Berra described it best when he claimed, “Ninety percent of baseball is mental. The other fifty percent is physical.” So, too, in business.
Leading Strategic Change systematically shows how to make the most important change of all: “redrawing” individuals’ mental maps with new destinations and paths. Black and Gregersen identify the brain barriers that keep strategic change from success: failure to see, failure to move, and failure to finish.
Overcoming the failure to seeWhy organizations miss obvious market transformations—and what to do about it
Breaking through the failure to moveWhy people fail to change—even when they see the need—and how to break through this barrier
Conquering the failure to finish Why change “stalls out” and how to maintain the momentum
Anticipating change Creating the capability to anticipate change, move when needed, and finish in the future without “being told”

LEADINGStrategic
CHANGE

In an increasingly competitive world, it is qualityof thinking that gives an edge—an idea that opens newdoors, a technique that solves a problem, or an insight
that simply helps make sense of it all.
We work with leading authors in the various arenasof business and finance to bring cutting-edge thinking
and best learning practice to a global market.
It is our goal to create world-class print publications and electronic products that give readers
knowledge and understanding which can then beapplied, whether studying or at work.
To find out more about our businessproducts, you can visit us at www.ft-ph.com

LEADINGStrategic
CHANGEBreaking Through the
BRAIN BARRIER
J. STEWART BLACKHAL B. GREGERSEN

Library of Congress Cataloging-in-Publication Data
Editorial/production supervision: Patti GuerrieriExecutive editor: Tim MooreEditorial assistant: Allyson KlossDevelopment editor: Russ HallMarketing manager: Alexis R. Heydt-LongManufacturing buyer: Maura ZaldivarCover design director: Jerry VottaCover design: Talar BoorujyArt director: Gail Cocker-BoguszInterior design: Meg Van Arsdale
© 2003 Pearson Education, Inc.Publishing as Financial Times Prentice Hall Upper Saddle River, New Jersey 07458
Financial Times Prentice Hall books are widely used by corporations and government agencies for training, marketing, and resale.
For information regarding corporate and government bulk discounts please contact: Corporate and Government Sales (800) 382-3419 or [email protected] write: Prentice Hall PTR, Corporate Sales Dept., One Lake Street, Upper Saddle River, NJ 07458.
Company and product names mentioned herein are the trademarks or registered trademarks of their respective owners.
All rights reserved. No part of this book may be reproduced, in any form or by any means, without permission in writing from the publisher.
Printed in the United States of America
Printing
ISBN 0-13-130319-8
Pearson Education LTD.Pearson Education Australia PTY, LimitedPearson Education Singapore, Pte. Ltd.Pearson Education North Asia Ltd.Pearson Education Canada, Ltd.Pearson Educación de Mexico, S.A. de C.V.Pearson Education—JapanPearson Education Malaysia, Pte. Ltd.
Fourth
FINANCIAL TIMES PRENTICE HALL BOOKS
For more information, please go to www.ft-ph.com
Dr. Judith M. Bardwick, PhDSeeking the Calm in the Storm: Managing Chaos in Your Business Life
Thomas L. Barton, William G. Shenkir, and Paul L. Walker Making Enterprise Risk Management Pay Off: How Leading Companies Implement Risk Management
Michael BaschCustomerCulture: How FedEx and Other Great Companies Put the Customer First Every Day
J. Stewart Black and Hal B. GregersenLeading Strategic Change: Breaking Through the Brain Barrier
Deirdre BreakenridgeCyberbranding: Brand Building in the Digital Economy
William C. Byham, Audrey B. Smith, and Matthew J. PaeseGrow Your Own Leaders: How to Identify, Develop, and Retain Leadership Talent
Jonathan Cagan and Craig M. VogelCreating Breakthrough Products: Innovation from Product Planning to Program Approval
Subir ChowdhuryThe Talent Era: Achieving a High Return on Talent
Sherry CooperRide the Wave: Taking Control in a Turbulent Financial Age
James W. Cortada21st Century Business: Managing and Working in the New Digital Economy
James W. CortadaMaking the Information Society: Experience, Consequences, and Possibilities
Aswath DamodaranThe Dark Side of Valuation: Valuing Old Tech, New Tech, and New Economy Companies
Henry A. Davis and William W. SihlerFinancial Turnarounds: Preserving Enterprise Value

Sarv Devaraj and Rajiv KohliThe IT Payoff: Measuring the Business Value of Information Technology Investments
Jaime Ellertson and Charles W. OgilvieFrontiers of Financial Services: Turning Customer Interactions Into Profits
Nicholas D. EvansBusiness Agility: Strategies for Gaining Competitive Advantage through Mobile Business Solutions
Kenneth R. Ferris and Barbara S. Pécherot PetittValuation: Avoiding the Winner’s Curse
David Gladstone and Laura GladstoneVenture Capital Handbook: An Entrepreneur’s Guide to Raising Venture Capital, Revised and Updated
David R. HendersonThe Joy of Freedom: An Economist’s Odyssey
Philip Jenks and Stephen Eckett, EditorsThe Global-Investor Book of Investing Rules: Invaluable Advice from 150 Master Investors
Thomas Kern, Mary Cecelia Lacity, and Leslie P. WillcocksNetsourcing: Renting Business Applications and Services Over a Network
Al Lieberman, with Patricia EsgateThe Entertainment Marketing Revolution: Bringing the Moguls, the Media, and the Magic to the World
Frederick C. Militello, Jr., and Michael D. SchwalbergLeverage Competencies: What Financial Executives Need to Lead
D. Quinn MillsBuy, Lie, and Sell High: How Investors Lost Out on Enron and the Internet Bubble
Dale NeefE-procurement: From Strategy to Implementation
John R. NofsingerInvestment Blunders (of the Rich and Famous)…And What You Can Learn From Them

John R. NofsingerInvestment Madness: How Psychology Affects Your Investing…And What to Do About It
Tom OsentonCustomer Share Marketing: How the World’s Great Marketers Unlock Profits from Customer Loyalty
W. Alan Randolph and Barry Z. PosnerCheckered Flag Projects: 10 Rules for Creating and Managing Projects that Win, Second Edition
Stephen P. RobbinsThe Truth About Managing People…And Nothing but the Truth
Jeff Saperstein and Daniel RouachCreating Regional Wealth in the Innovation Economy: Models, Perspectives, and Best Practices
Eric G. Stephan and Wayne R. PacePowerful Leadership: How to Unleash the Potential in Others and Simplify Your Own Life
Jonathan WightSaving Adam Smith: A Tale of Wealth, Transformation, and Virtue
Yoram J. Wind and Vijay Mahajan, with Robert GuntherConvergence Marketing: Strategies for Reaching the New Hybrid Consumer


xiii
CONTENTS
Foreword xvii
Acknowledgments xxi
About the Authors xxiii
CHAPTER 1 The Challenge of Leading Strategic Change 1
The Crux of the Challenge 5
Simplify and Apply 8
The Fundamentals of Change 10
CHAPTER 2 Brain Barrier #1: Failure to See 17
Blinded by the Light 20
Overcoming the First Brain Barrier 43
CHAPTER 3 The Keys to Seeing: Contrast and Confrontation 45
Contrast 46
C O N T E N T S xiv
Confrontation 47
Pulling It All Together 58
CHAPTER 4 Brain Barrier #2: Failure to Move 63
Smart People don’t Try New Tricks 66
Overcoming the Second Brain Barrier 74
CHAPTER 5 The Keys to Moving: Destinations, Resources, and Rewards 75
Believing 76
Pulling It All Together 86
CHAPTER 6 Brain Barrier #3: Failure to Finish 89
Getting Tired 91
Getting Lost 99
Overcoming The Final Brain Barrier 103
CHAPTER 7 The Keys to Finishing: Champions and Charting 105
Providing Champions 106
Charting Progress 109
Pulling It All Together 110
CHAPTER 8 Breakthrough Innovation and Growth 113
Conceiving 114
Believing 122
Achieving 126
Summary 134

CONTENTS xv
CHAPTER 9 Leading Strategic Change Toolkit: Conceiving 135
Individual Change 137
Conceiving Tools 139
Contrast and Confrontation 146
CHAPTER 10 Leading Strategic Change Toolkit: Believing 153
Destinations 154
Resources 157
Rewards 161
Summary 163
CHAPTER 11 Leading Strategic Change Toolkit: Achieving 165
Champions 166
Charting 169
Summary 174
CHAPTER 12 Getting Ahead of the Change Curve 177
Crisis Change 181
Reactive Change 182
Anticipatory Change 183
Final Thoughts 186
Index 189


xvii
Foreword
Theories are predictive statements of what causes what, and why.
Many managers view themselves as practical men and women
and don’t view their actions as being guided by theory. But every
plan that a manager makes and every action that a manager takes
are, in fact, predicated on some theory in his or her mind—a
belief that certain events or actions will result in particular out-
comes. “If we cut price, more people will buy more” is an action
predicated on a theory. “If I give her a performance-based finan-
cial incentive, she will work harder and more productively” is
another. “If I out source this subsystem to a supplier that does the
job more cost-effectively than we can do it in-house, we’ll be
more competitive” is a third. These theories serve as mental
maps guiding the everyday actions managers take.
Too often, though, managers aren’t even aware of these powerful
mental maps—beliefs about cause and effect—that they employ
when making plans and taking actions. Still, the maps are there,
somewhere in the managers’ minds. Like it or not, every man-
ager is, therefore, a theory-driven manager.
Most theories that managers use were formulated through expe-
rience—and because members of management teams experience
many things in common, they end up employing similar theo-
ries, consciously or unconsciously, as they make decisions.
Edgar Schein, Massachusetts Institute of Technology’s noted

F o r e w o r d xviii
scholar of organizations, has shown how these shared theories
develop and come to comprise an organization’s culture.1 He
notes that, in the earliest days of every organization’s history,
there came a point when a group of people had to get something
done. Confronted with that task, they put their heads together
and figured out how they would approach the challenge. If their
efforts failed, then the next time that task arose, they would be
inclined to devise another way to get the job done. If that
method proved successful, then the next time the task arose, the
group would be inclined to use the same method to get the job
done. If that method proved successful again when the same task
arose, they would be even more likely to address the task with
the same approach when it arose again, and so on.
Ultimately, if a group of people have successfully worked
together in particular ways to address recurrent tasks again and
again, they come simply to assume that this is the way they
should do things. When this happens—when people begin adopt-
ing ways of working by assumption, rather than by explicit
debate and decision—that process becomes part of the organiza-
tion’s culture. This is what an organization’s culture is: ways of
getting things done that a group of people have used so success-
fully for so long that they simply come to assume that doing
things the same way is the only way to get the needed result. As
a consequence, the more successful the organization is, the
stronger will this unconscious consensus about cause and effect
become. Another way to put it is that, because theories are state-
ments of what causes what and why, an organization’s culture is
actually a collection of theories in use. These theories provide
valuable guidance to managers as they make plans and take
actions, because they build on what individuals in the organiza-
tion have learned from their collective experience. In fact, orga-
1. *Schein, Edgar, Organizational Culture and Leadership, 2d. SanFrancisco: Jossey-Bass Publishers, 1997.

Foreword xix
nizations with strong cultures or theories in use become in many
ways self-managing, because managers in disparate parts of the
company can be trusted to make decisions autonomously that
are consistent with what the company has learned will work.
All of this is good, of course, except when things change. Then
the widely shared maps that managers have unconsciously used
to predict what events and actions will produce the needed
results may no longer hold true. This is why I’m delighted that
Stewart and Hal have written this book. In its pages, they
present methods for discovering the implicit theories in-use that
managers have learned to trust in the course of building success-
ful companies—theories that must be understood explicitly
before new ones can be adopted in times of change.
No panaceas address any or all of the problems of management
completely. I certainly hope that no one who reads this book has
bought it to find an easy answer to the problems of managing
change. But I do believe that when a talented group of managers
can share a common language and a common way to frame the
origin of the problems they face, they can do remarkable things.
And I believe that Leading Strategic Change delivers essential
methods that managers can employ to encourage these vital
efforts.
Clayton M. Christensen
Robert & Jane Cizik Professor of Business Administration
Harvard Business School


xxi
Acknowledgments
Over twenty years ago, J. Bonner Ritchie rewrote the maps in
each of our minds. As students, he confronted us with unsettling
contrasts to our worldviews. Bonner had a level of inquisitive-
ness and love of learning greater than either of us had ever expe-
rienced before. He was a champion of change whether as a
student at the University of California, Berkeley, an officer for
the U.S. Army, a faculty member and civil rights activist at the
University of Michigan Business School, a business consultant to
African American catfish farmers, a chairperson of the Utah
State Liquor Commission, or currently as a tireless advocate of
peace and prosperity for children around the world.
Bonner also infused us with a conviction about the power of
maps and metaphors, and instilled an understanding of how
looking at the world through maps or metaphors can help us see
the things more clearly. For the gift of maps and the insight of
metaphor, we thank Bonner.
Along with Bonner, many other colleagues such as Jean Broom,
Gordon Finch, Mark Hamberlin, Allen Morrison, Mark Menden-
hall, Gary Oddou, Paul McKinnon, Lee Perry, Lyman Porter, Kurt
Sandholtz, Marion Shumway, Greg Stewart, Pat Stocker, Dave
Ulrich, and Dave Whetten have helped shape our maps about the
challenges and opportunities of change. In addition, thousands
of executive education participants as well as graduate students

A c k n o w l e d g m e n t s xxii
at the University of Michigan, Brigham Young University, Dart-
mouth College, Helsinki School of Economics, Penn State Uni-
versity, and Thunderbird have engaged in learning with us as we
worked over the years to sharpen our understanding of mental
maps and their decisive impacts on change initiatives.
On the home front, our respective parents played pivotal roles in
not only forming our maps of the world, but also teaching us how
to create new maps. We are grateful for the gifts of inquiry that
parents passed on. We also thank each of our children—Jared,
Nathaniel, Kendra, Ian, and Devyn Black as well as Matt, Ryan,
and Amber Gregersen—for enduring our quirky mental maps for
years and working overtime to rewrite and update some of the
tired and well-worn ones that needed changing. Finally, we dedi-
cate this book to our wives—Tanya Black and Ann Gregersen.
We are ever grateful for the map of life that we share individually
with each of them.
J. Stewart Black
Hal B. Gregersen

xxiii
About the Authors
J. Stewart Black, Ph.D. is a professor of business administration
at the University of Michigan. An internationally recognized
scholar on change and transformation, he is a frequent keynote
speaker at conferences around the world and company func-
tions. He is regularly sought out to help leading companies glo-
bally with strategic change initiatives and the development of
their senior leaders and high potential managers. Dr. Black has
served on the faculties of the Amos Tuck School of Business
Administration at Dartmouth College and the University of Cali-
fornia, Irvine. He is the author of eight other books and nearly
100 articles and case studies that have been widely used in both
university classrooms and corporate boardrooms.
Hal B. Gregersen is the Donald L. Staheli Professor of Global
Leadership in the Marriott School at Brigham Young University
and taught previously at Dartmouth College, Pennsylvania State
University, and the Turku School of Economics in Finland as a
Fulbright Fellow. Dr. Gregersen is a frequent keynote conference
speaker on leading strategic change and an executive education
contributor in companies (Cemex, IBM, Intel, LG Group, Lock-
heed Martin, Marriott, and Nokia) and universities (University of
Michigan, Helsinki School of Economics, Tufts University, Thun-
derbird, and University of Western Ontario) around the world.
As author of seven books and over 60 articles in publications like

A b o u t t h e A u t h o r s xxiv
the Harvard Business Review and Sloan Management Review,
Dr. Gregersen is a globally respected scholar on how firms find
and build executive leaders capable of conceiving and achieving
worldwide change. He has appeared on programs such as CNNfn
and his cutting-edge research on global leadership has been cited
in numerous publications such as BusinessWeek, Fortune, and
The Wall Street Journal.

1
CH
AP
TE
R 1 The Challenge of Leading Strategic Change

L e a d i n g S t r a t e g i c C h a n g e2
With over a hundred books on leading strategic change
to choose from, why read this one? The answer is simple. Most
other books on change have it backward. They take an “organi-
zation in” approach; in other words, they outline all the organi-
zational levers you should pull to change the company so that
individual change will follow. Our experience and research com-
mands the opposite conclusion. Lasting success lies in changing
individuals first; then the organization follows. An organization
changes only as far or as fast as its collective individuals change.
Consequently, instead of an “organization in” approach, we take
an “individual out” approach. To repeat—to strategically change
your organization, you must first change individuals.
Unlocking individual change starts and ends with the mental
maps people carry in their heads—how they see the organization
and their jobs. Just as actual maps guide the steps people take on
a hike through the Himalayas, mental maps direct people’s
behavior in daily organizational life. And if leaders cannot
change individual’s mental maps, they will not change the desti-
nations people pursue or the paths they take to get there. As a
result, successful strategic change requires a focus on individuals
and redrawing their mental maps. If what is in people’s heads is
not remapped, if you cannot break through this “brain barrier,”
their hearts and hands have nothing new to follow. As a result,
leading strategic change requires becoming an effective mental
cartographer, or Map Maker.
Perfecting this capability is probably one of the most profitable
things you can do for your career and for your company. In our
research, just over 80% of companies listed leading change as
one of the top five core leadership competencies for the future.
Perhaps more importantly, 85% felt that this competency was
not as strong as was needed within their high-potential leaders.
In a nutshell, when it comes to leading strategic change, demand
is high (and growing), and supply is short.

Chapter 1 • The Challenge of Leading Strategic Change 3
To understand why a shortage of capable leaders of change per-
sists, we need to consider only a few factors. First, change has
never been easy. For example, consider this quote written 500
years ago by Niccolo Machiavelli:
There is nothing more difficult to carry out, nor more
doubtful of success, nor more dangerous to handle than to
initiate a new order of things. For the reformer has enemies
in all those who profit by the old order, and only lukewarm
defenders by all those who could profit by the new order.
This lukewarmness arises from the incredulity of mankind
who do not truly believe in anything new until they have
had actual experience with it.
Clearly, resistance to change is not a modern concept. In fact,
resistance to change seems to have endured through the ages, in
part because humans are biologically hard-wired to resist
change. Yes, that’s right. We are programmed not to change.
Although plants may evolve and survive through random varia-
tion and natural selection, people do not. We do not generate
random variations in behavior and let nature take its course—
selecting and deselecting those who fit and do not fit the envi-
ronment. We are wired to resist random change and, thereby,
avoid random deselection. We are wired to survive, so we hang
on to what has worked in the past.
This map-hugging dynamic happened to Hal a few years ago,
when he was teaching in the Amos Tuck School of Business at
Dartmouth College. Even though Hal lived only about a mile
from work and had several possible ways to get there, he had
quickly settled in on a habitual driving route that took him to
work quickest. One cold winter morning, though, Hal had driven
about halfway to work when he confronted a detour barricade
and sign. Construction workers were laying new pipe under the
road, so Hal had to turn around, backtrack halfway home, and
follow a detour route to work. At the end of the workday, Hal

L e a d i n g S t r a t e g i c C h a n g e4
started his short drive home. But again, he took his “usual” route
and ended up stuck at the detour sign once more. He backed up
(just like he did in the morning) and ultimately rerouted himself
home. The next day, Hal woke up and hurried off to work and—
you guessed it—Hal’s a slow learner. He took his “usual” route
again and ended up staring once more at the detour sign. Like
the day before, he turned around, backtracked, followed the
detour route, and made it to work. Finally, on the afternoon of
the second day, Hal started to alter his mental map of how to
drive home and actually rerouted himself before running into the
detour sign.
Unfortunately, modern times conspire against this ancient bio-
logical code of hanging on ferociously to what works until unde-
niable evidence mounts against our map that it no longer fits the
environment. For example, the rate and magnitude of required
change has grown exponentially. We now talk about 90-day years
(i.e., Internet years, which are almost as short as dog years.)
Pundits pull out charts that show the half-life of products drop-
ping in half. In fact, many of us face change of such enormous
scope, size, and complexity that it is nearly overwhelming:
� transforming a business unit that succeeded for years by
focusing on technological prowess to a unit that must now
focus on customer service,
� leading an organization from domestic competition to the
global battlefield,
� accelerating growth by focusing not just on building things
but on all the services that go with after-sales support,
� changing the culture from one of considered deliberations to
a fast, first-mover approach,
� redesigning jobs to incorporate new technology that we
hardly understand, or
� something else just as daunting.

Chapter 1 • The Challenge of Leading Strategic Change 5
Bottom line, the pace, size, and complexity of change are greater
than ever before. Consequently, the costs of changing late are
not just inconvenient but often catastrophic.
We don’t need to look far to see the consequences of not meeting
this challenge. Xerox, Lucent, and Kmart in the United States,
De Beers in Europe, and Mitsubishi in Japan are just a few exam-
ples of companies that faltered, brought in new leaders to cham-
pion change, and still failed to recover. Beyond these visible
company examples are literally thousands of invisible individual
examples—middle-level leaders whose seemingly fast-track
careers derailed when a change initiative they were leading
crashed and burned.
Although likely frustrating, the fact of the matter is that, no mat-
ter how good we have been at leading change in the past, the
future will demand even more of us—especially because people
are programmed to resist any effort to redraw their mental maps
and walk in new paths. The mental terrain of their brains poses a
significant set of barriers that we must break through to meet the
increasing demands of leading strategic change.
The Crux of the ChallengeThis brings us to the crux of the challenge. Clearly, change has
always been and remains difficult. Unless we can dig beneath the
surface and expose the fundamentals of why this is so, we have
no hope or prayer of meeting these ever-escalating demands on
leaders of change.
To better understand these fundamentals, we might take a page
from the fundamentals of flight. Breaking the bonds of earth and
soaring above the clouds has never been easy. Gravity has been a
natural, fundamental force in keeping us down from the begin-
ning. Flight requires thrust, lift, and aerodynamics. We must

L e a d i n g S t r a t e g i c C h a n g e6
master these key factors to overcome gravity and break through
the barriers of resistance.
Take a moment to study the picture in Exhibit 1-1. This incredi-
ble photo captures an F/A-18 Hornet fighter jet hitting Mach I,
the speed of sound.
When approaching Mach I, powerful but usually invisible sound
waves bunch tighter and tighter together, forming a massive wall
of energy that tries to buffet and shake the plane right out of the
sky. Without sufficient thrust, lift, and proper aerodynamic
design, disaster is inevitable as this sound barrier combines with
the forces of gravity to crush the plane and bring it crashing back
to earth. Lucky for the pilot of this plane, the designer possessed
an in-depth understanding of these fundamentals to achieve
breakthrough, letting her punch through the sound barrier as
though it were a puff of smoke.
Change in organizations follows the same path. The faster a
leader tries to force change, the more shock waves of resistance
compact together, forming a massive barrier to success. Instead
of a sound barrier though, leaders confront a “brain barrier”
EXHIBIT 1-1F/A-18 Hornet jet breaking through the sound barrier. (Photo John Gay/©AFP/CORBIS)

Chapter 1 • The Challenge of Leading Strategic Change 7
composed of preexisting and successful mental maps. These
incredibly powerful maps determine how people see the world of
work, guiding their daily steps and behaviors. Indeed, our heads
are chock full of such maps, and just as the court jester shown in
Exhibit 1-2, the maps in our head—far more than the eyes on
our face—frame our personal views of the world.
The power of these mental maps surprised our colleague several
years ago. He was hired as a consultant to help transform a meat-
packing factory from an authoritarian top-down management
system to a high-involvement, participative one. After three days
of intensive training focused on the opportunities, challenges,
and everyday logistics associated with self-managed work teams,
a burly 300-pound butcher stood up in the back of the room,
slammed a meat cleaver into the table, and demanded in no
uncertain terms that he still had “a right to have a manager tell
me what to do and when to do it.” Clearly, this butcher’s maps of
his world at work had not budged an inch. And for significant
EXHIBIT 1-2The court jester’s mental map. (Fools Map of the World, c. 1590, reference [shelfmark] Douce Portfolio 142 (92) Bodleian Library, University of Oxford.)

L e a d i n g S t r a t e g i c C h a n g e8
organizational change to take hold of peoples’ hearts and hands
in this meat-packing plant—or anywhere else, for that matter—
Map Makers of change must comprehend, break through, and
ultimately redraw individual mental maps, one by one, person by
person, again and again.
The challenge of remapping mental terrain brings us to the criti-
cal barriers that prevent sustainable strategic change. What are
the natural gravitational forces that suppress change and build
brain barriers to breakthroughs? The answer lies in three ques-
tions that capture the essence of failed change. And if we can
understand why change fails (which it most often does), we can
figure out what the necessary thrust, lift, and aerodynamics are
for pulling off breakthrough change.
� Why, when opportunities or threats stare people in the face,
do people fail to see the need to change?
� Even when people see the need, why do they often still fail
to move?
� Even when people move, why do they fail to finish—not
going far or fast enough?
If we can grasp why people fail to see, move, and finish, and if we
can break through these three barriers, we can deliver strategic
change. This book reveals not only how mental maps create
these three barriers, but how mental maps also generate the key
to breaking through them.
Simplify and ApplyAs we explain brain barriers and how to break through them, we
try to follow an important principle reflected in the following
quote attributed to Albert Einstein: “We should make things as
simple as possible, but no simpler.” In our view, the eight mis-

Chapter 1 • The Challenge of Leading Strategic Change 9
takes, twelve steps, and so on offered by others about change are
often correct in direction but overly complicated in reality. But
wait—we just got through arguing that today’s changes are bigger
and more complicated than the past and that changes in the
future are likely only to get more daunting. Why would simplify-
ing change help us lead ever more complex changes? There are
two reasons.
First, something is practical only if we can remember and recall
it. No matter how comprehensive a model, framework, theory, or
idea, if we cannot remember and recall it when application is
demanded, it ends up making very little practical difference. If
change in today’s organizations is more prevalent, fast, unex-
pected, and complex than ever before, it is equally critical for us
to act when change is necessary. Whatever tools of change we
hope to use well must be remembered, recalled, and applied.
However, long history and scientific evidence teaches us that
humans are limited when it comes to remembering and recalling
models, frameworks, or even strings of numbers that are too long
or complicated. For example, ever wonder why most phone
numbers around the world contain only seven digits or less? It is
because 80% of the population can remember seven digits, but
that percentage drops dramatically as you add digits. In fact, you
need to add only three additional digits to those seven, and the
percentage of people who can remember them (ten digits versus
seven) drops from 80% to only about 2%. If a change strategy
sounds great on paper but can’t be remembered by people in the
field, it really isn’t worth anything. For this reason, we take a
very pragmatic approach in proposing a framework for leading
change. We offer a framework that can be remembered, recalled,
and—most importantly—applied.
Second, we argue for simplification because achieving 80% of the
desired results rapidly is much better than never attaining 100%.
If 80% quickly is your target, then 20% of the factors are the key.

L e a d i n g S t r a t e g i c C h a n g e10
For example, we commonly see cases in which 20% of a firm’s
customers account for 80% of sales (known as the 80/20 princi-
ple). In sports, we see many situations where 80% of the team’s
points come from 20% of its players. And although a firm cannot
ignore its other customers or a team its full roster of players,
both organizations get the best bang for their buck by focusing
on the critical core—the fundamentals. For this reason, we focus
on the most critical elements of change.
One of the most important differences about Leading Strategic
Change is that we keep the concepts simple and focus on the
fundamentals. We have found through our work with a variety of
firms that if you get the change fundamentals right—the critical
20%—the rest comes more easily. Conversely, you can spend
truckloads of time on all the fancy frills of change, and ignored
fundamentals will steal success away.
In fact, breakthrough change requires a complete mastery of the
fundamentals. Just as mastering the fundamentals of gravity and
friction allowed designers to narrow the nose and sweep back the
wings on planes for pilots to break the sound barrier, mastering
change fundamentals delivers the key to breaking through pow-
erful and persistent mental resistance barriers.
The Fundamentals of Change
What are the fundamental dynamics of leading strategic change?
The diagram in Exhibit 1-3 attempts to capture this process, and
subsequent short sections describe these dynamics relative to
each stage of the matrix. And as we mentioned, real mastery of
these concepts will come as subsequent chapters walk you
through these dynamics in much greater detail.

Chapter 1 • The Challenge of Leading Strategic Change 11
Virtually every major change has its roots in success (Stage 1). In
almost every case, the need for change is born of past success—of
doing the right thing and doing it well. The more right it is and the
better it has been done, the more likely that it has a long rather
than short history. For example, IBM did the right thing (making
mainframe computers) and did it well. It did it better than anyone
else for nearly 50 years. Xerox was so closely tied to the invention
and commercialization of copying that the company name
became a verb (“Please Xerox this document for me.”)
Change starts with a history of doing the right thing and doing it
very well, but then something happens: The environment shifts,
and the right thing becomes the wrong thing. A new competitor
comes on the scene with equal quality but significantly lower
price, or a new technology renders past standards of product
Right Thing Wrong Thing
DoneWell
DonePoorly
Stage 1 Stage 2
Stage 3
EXHIBIT 1-3Strategic change matrix.

L e a d i n g S t r a t e g i c C h a n g e12
reliability obsolete, or government regulations disallow previous
business practices, or customers change their preferences, or a
million and one other shifts.
As a consequence of the shift, what was once right is now wrong
(an initial shift from Stage 1 to Stage 2). And the really frustrat-
ing thing is that, although the old right thing is now wrong, we
still do it well. In IBM’s case, computing power soared while cost
remained constant; and servers, minicomputers, and even desk-
top computers began to replace the role of some mainframes.
Just making big boxes was no longer the right thing, but IBM
continued doing it so well. People’s hearts and souls, their self-
worth and image were tied up in years and years of making “big
iron” (mainframes in IBM’s vernacular). This persistent desire to
travel along old, familiar and successful paths of the past is why
the first stage of change often results in no change.
However, after enough pain, blood, or at least red ink, we start
the second stage of change by finally recognizing that the old
right thing is now the wrong thing—we finally see the light. We
then begin to envision what the new right thing might be. Over
time, the new right thing becomes clear.
But, in almost every case, because the new right thing is new, we
are usually not very good at it at first. Initially, we end up doing
the new right thing quite poorly. This challenge forms the third
and frustrating stage of change.
For example, not long after Lou Gerstner took over as CEO at
IBM, people inside the company finally saw that just “selling
boxes” would not work and that providing integrated solutions
was critical to their future success. However, neither IBM nor its
employees was good at making money from providing integrated
solutions at first. Although analysts today tout the importance of
“solutions” in IBM’s revenue and profit growth, we quickly forget
that, back in the early 1990s as IBM initiated this strategic

Chapter 1 • The Challenge of Leading Strategic Change 13
change, the “integrated solution units” (ISUs, as they were
called) were losing money, not making it.
Hopefully, after a time, we master the new right thing and start
to do it well (a move from Stage 3 back to Stage 1). At this point,
the sun shines again, and we bask in the warmth of its rays. Life
is good. (Well, that is until the new right thing once again
becomes the wrong thing.) IBM eventually did become proficient
at providing integrated solutions. In fact, the service business
was the largest revenue and profit growth engine for IBM during
the late 1990s.
The fundamental process or cycle of change is just that simple.
This is the 20% that captures 80% of the picture of strategic
change:
� Stage 1: Do the right thing and do it well.
� Stage 2: Discover that the right thing is now the wrong thing.
� Stage 3: Do the new right thing, but do it poorly at first.
� Stage 4: Eventually do the new right thing well.
Anyone can understand, remember, and recall this framework. If
the process is so simple why do a majority of change initiatives
fail? The answer lies in the power of the three barriers we men-
tioned earlier. The failure to see keeps the change process from
even getting started. Even when started, the failure to move
keeps us from entering the path of the new right thing. Even if
we start and move, the failure to finish keeps us from doing the
new right thing and doing it well.
With this overall map, we have designed the rest of the book to
help you master the challenge of leading strategic change. We
dive into the dynamics that drive behavior in each step of our
change framework, explore the power of mental maps that can
often divert us from successful change, and show how to break
through these brain barriers.

L e a d i n g S t r a t e g i c C h a n g e14
In Chapter 2, we examine the first remapping challenge. We
investigate why—even when a threat or opportunity is visible—
we fail to see it. Clearly, if we fail to see threats or opportunities,
we will not make needed changes. In response to this challenge,
Chapter 3 details how we can break through this barrier and
help others actually see the need to change.
We explore the second barrier to change in Chapter 4. We exam-
ine why even when we see, we often fail to move. Although it
sounds illogical that we would fail to move if we saw a threat or
opportunity, there is ample evidence that failure to move is quite
common. Effective change must overcome this powerful mental
barrier, and Chapter 5 delivers the keys to overcoming it as we
help people actually move once they see the need to change.
The third and final barrier to change consumes Chapter 6. We
explore why, even when people move, they often fail to finish—by
not moving far or fast enough. Although recognizing the need for
change is the thrust that gets us going and moving down the new
path lifts us off the ground, if the momentum cannot be main-
tained, the initial upward lift needed to fly is overpowered by the
constant downward pull of gravity. We have seen and studied
many cases in which change projects attained initial liftoff, only
to falter and crash shortly after clearing the runway. Chapter 7
provides a simple but effective framework for overcoming this
challenge and provides the specifics on how to break through this
barrier and help people finish a major change initiative.
In Chapter 8, we apply these fundamental principles of change to
a central challenge faced by most organizations today. Specifi-
cally, we examine how you can lead change in your organization
for greater revenue and profit growth.
The next three chapters of Leading Strategic Change (Chapters
9, 10, and 11) provide the glue to ensure that all this sticks—
sticks together and sticks to you, the reader. This glue is essen-
tially a tool kit for you to lead change in your organization. Not

Chapter 1 • The Challenge of Leading Strategic Change 15
only can this tool kit guide your change leadership, but it can
also channel your efforts in training, educating, and empowering
others to meet this challenge, as well.
The final chapter (Chapter 12) is perhaps the most important of
all. Even though strategic change by its nature takes time to
achieve and needs some endurance to produce results, holding
on to whatever the strategic change has defined as the new right
thing too long will only plunge the company into all the problems
that led to the current strategic change in the first place. Conse-
quently, in the final chapter we talk about how to get ahead of
the change curve—how to master anticipatory change rather
than always being subjected to reactionary or crisis change.


17
CH
AP
TE
R 2 Brain Barrier #1: Failure to See

L e a d i n g S t r a t e g i c C h a n g e18
Just imagine that the sun is shining, its rays shimmering
off the ocean waves as they lazily break on a smooth, sandy
beach. A friendly breeze occasionally rustles the palm trees. You
are on the beach because you’ve done it the old-fashioned way—
you’ve earned it. You’ve worked hard; you’ve been smart. You’ve
come up with new technology. You’ve made your company one
of the most recognized in the world. You’ve pioneered what
would turn out to be one of the hottest management concepts of
the late twentieth century—6 Sigma.1 You are touted in the
press as one of the most admired companies. You are the market
leader in what is expected to be one of the largest consumer
market products ever—the mobile phone. When it was unveiled,
your StarTac phone was the coolest phone to own. You are
Motorola.
You are doing the right thing and doing it well. This was the case
for Motorola from the late 1980s and into the early 1990s. Its
analog phones were the phones to own.
But then the environment shifted—radically. First, a new digital
technology for mobile phones came along. However, at first it
was not clear how superior the sound would be. In addition, the
new digital technology would require new and expensive infra-
structure. On top of that, most of Motorola’s other U.S. competi-
tors did not seem as though they would make a quick move to
the new technology. The one competitor committed to the new
technology was some small little company in frozen Finland, a
country with a total population of less than that of Manhattan
during the day. Besides, no one was really sure how to pro-
1. *6 Sigma is a highly disciplined approach to developing and deliveringnearly perfect products and services to customers. The core of 6 Sigmafocuses on identifying defects in a production process and eliminatingthem to get as close as possible to zero defects.

Chapter 2 • Brain Barrier #1 19
nounce the company’s name—Nokia. Was it No´-kia (with the
emphasis on the “No”) or No-kia´ (with the emphasis on the
“kia”)? And what does a company that has been in the forest
products business for over 100 years and excels at making rub-
ber boots for fishermen know about high tech? So what if Nokia
went with this new digital phone? So what if countries in Europe
adopted this new digital standard? Any of those individual coun-
tries, such as Germany or France, paled in comparison to the
market size of the United States.
The result? Motorola’s first reaction was to deny that this new
technology or competitor was anything to worry about.
But then Nokia’s revenue increased fourfold, from $2.1 billion in
1993 to $8.7 billion in 1997. All of Europe adopted a common
digital standard that allowed people to use their mobile phones
virtually anywhere in the region. This convenience drove even
greater demand. In the meantime, the fragmented standards of
the United States meant that one phone would not necessarily
work in every state.
What did Motorola do? Oddly enough, it put even more invest-
ment and effort into its analog phones. It did what it knew how
to do—what it was good at—and it did it even more intensely
than before.
Well, we all know what happened. Motorola’s share of global
mobile phones dropped from about 35% to just under 15% by
end of 2000. Nokia, virtually unknown in the United States in
the early 1990s (or most of the rest of the world, for that mat-
ter) has become one of the top 5 recognized brands in the world
just after GE and before Intel. In 2000, nearly 70% of all mobile
phone handset profits went to Nokia, with a market share of
around 35%. That’s right: Nokia’s “profit share” was double its
“market share.”

L e a d i n g S t r a t e g i c C h a n g e20
Blinded by the Light
Clearly, if you do not see a truck racing toward you, you are
unlikely to jump out of the way. Likewise, if you do not realize
that you are standing on a treasure of gold, you are unlikely to
bend down and pick it up. It is no brilliant observation to say
that if people fail to see the need for change (whether threat or
opportunity driving it), they will not change.
Everybody knows this. This is why in virtually any book on
change there is a section on “creating the need for change.” Yes,
a felt need for change is required. However, the fact that people
fail to see the need or fail to be convinced of the need is compel-
ling evidence that “creating the need for change” is easier said
than done. Part of the reason for this is that, by jumping straight
to “establish a sense of urgency,” we skip over one of the most
important questions that provides the necessary insight to help
us actually create the need for change.
The question is, Why don’t people see the truck or the treasure?
Why don’t they see the need for change? In almost every case,
the need is not invisible. If it were invisible, we could hardly
blame ourselves or someone else for not seeing the need. But in
most cases, the need for change is visible; it is right there in
front of us.
For a moment, let’s return to the Motorola example. (By the way,
we do not mean to pick on Motorola. It has lots of company with
other firms that have missed a significant threat or opportunity,
such as AT&T, Black & Decker, Caterpillar, IBM, Kmart, Lucent,
Merrill Lynch, and Xerox.) Still, although Motorola is not the
only firm to miss an important threat or opportunity, the threats
and opportunities that Motorola faced were hardly invisible. Yet
Motorola still did not see, recognize, or acknowledge them until
it was absolutely incontrovertible. Instead, Motorola first denied

Chapter 2 • Brain Barrier #1 21
the threat, then worked harder at what it knew how to do well,
as illustrated in Exhibit 2-1
So why do we deny? When we see evidence that a strategy,
structure, technology, or product was right in the past but now is
wrong, why do we ignore and deny the evidence? To understand
the first gravitational force that keeps us from changing, we must
come to grips with good answers to these questions.
We deny because we are blinded—blinded by the light of what
we already see. To understand what this means, it is important
to keep in mind that changes are almost always required in the
context of a history, and it is usually a history of success. That
history of success creates mental maps in us—maps just as real
as those guiding us in the physical world. They tell us where to
go and how to get there. For example, consider the map in
Exhibit 2-2.
Right Thing Wrong Thing
DoneWell
DonePoorly
Reaction #2Do even more of what you know (the old right thing)
Reaction #1Deny the new reality
EXHIBIT 2-1Strategic change matrix: Failure to see.

22
EXHI
BIT
2-2
Islan
d of C
alifor
nia m
ap.

Chapter 2 • Brain Barrier #1 23
This is a map of the island of California. When they first see it,
many people think it is a futuristic map of California after a huge
earthquake—what Californians refer to as the “big one to come.”
The map is actually quite an old one.
For centuries, Europeans were captivated by legends of distant
islands with unimaginable wealth. In 1541, Hernán Cortés and a
group of adventurers set sail from Spain to discover such an
island. Cortés sailed across the Atlantic, portaged through Mex-
ico, then set sail again up the Strait of California, more com-
monly known today as the Gulf of Baja. Eventually, his
provisions ran low, his crew grew nervous, and he was forced to
turn back. To understand this better, it may be helpful to
remember that the Gulf of Baja is more nearly 1,000 miles long,
or over 1,600 kilometers.
For Cortés, failure was unacceptable, so with a little wishful
thinking, he created a success. To the east and west, land was in
view; to the north and south, water. Cortés reached a conclusion
that seemed perfectly logical: He was in search of an island, and
an island he had found—La Isla de California. Cortés returned
to Spain and reported to the king and queen exactly what they
wanted to hear (and what he wanted to believe): California is
an island.
Shortly after Cortés’s discovery, another expedition was sent to
confirm his claim. This one traveled far up along the Pacific
coast, past present-day San Francisco. This overly ambitious
expedition also ran low on supplies, and by the time they
reached the Mendocino River on northern California’s coast, the
crew was stricken with scurvy. With no inclination to dispute
Cortés and no absolute evidence that he was wrong, they con-
cluded that the river was really a strait separating the northern
part of the island of California from the rest of the continent.
This cartographic myth persisted throughout Europe for over
two centuries. Just imagine if you had this map and landed in

L e a d i n g S t r a t e g i c C h a n g e24
what is present-day eastern Texas along the Gulf of Mexico. Your
objective was to travel overland and reach the island of Califor-
nia. What would you need to take with you? Boats, of course.
You would have to haul boats across what are present-day Texas,
New Mexico, and the deserts of Arizona, only to discover that
California was not an island. In fact, several expeditions pro-
vided clear proof that California was not an island, but it was not
until 1745 (200 years after the original map of the island of Cali-
fornia was created) that a royal proclamation from Spain finally
declared “California is not an island.”
Why did it take so long for this map to change? Once the belief
that California was an island had been established, reports from
later explorers were filtered to fit the existing map; anything con-
tradictory was labeled as false or impossible. From all the king
knew, the map worked quite well. Why should he throw it away?
Similarly, for Motorola, analog phones had worked quite well for
a long time. Why should it throw the map away?
Lest we create the impression that only U.S. firms are blinded by
the light, let’s take a look at one of Nokia’s neighbors—IKEA.
IKEA is not only one of the largest firms in Sweden, but one of
the largest retail furniture companies in the world today.
The mission of IKEA is to create a better everyday life for as
many people as possible by making beautiful, functional items
for consumers’ homes at the lowest possible price. It launched
its first catalog in Sweden in 1951. Since then, it has expanded
into 22 countries across Europe, North America, Southeast Asia,
and Australia. In 2000, it had sales of nearly $9 billion. In sync
with its philosophy and mission, its competitive strategy is based
on a value proposition of moderate- to good-quality Scandina-
vian design furniture at incredibly low prices. This strategy
works well around the world for most of the products that IKEA
offers, such as curtains or dinnerware. However, successful IKEA

Chapter 2 • Brain Barrier #1 25
strategic map failed miserably for some items, specifically beds
and sheets, when it expanded into the United States.
When IKEA began its U.S. operations, it shipped low-priced,
moderate-quality, metric-sized beds and bedding to all of its U.S.
stores. It advertised how wonderful the beds were—especially at
a full two meters in length! IKEA expected the same great suc-
cess in the U.S. that it had enjoyed in Europe. Unfortunately,
sales did not go well at first. What was IKEA’s response? It
increased its advertising. Maybe people didn’t know what great
metric-sized beds IKEA had to offer. More advertising would
surely bring customers into the stores and send merchandise fly-
ing off the showroom floor.
How did beds and bedding sell in the United States after that?
They quickly became category failures, filling up entire ware-
houses. Local store and regional managers tried to communicate
to corporate headquarters in Sweden that metric-sized beds and
bedding would not sell in the United States—despite the fact that
they were priced lower than the king, queen, full, and twin-sized
bedding found in competitors’ furniture stores.
How did IKEA’s senior managers, who were seven time zones
away at corporate headquarters, respond to this local dilemma?
“Be more creative. Pull the customers into your store. Any good
retailer can sell metric-sized bedding; that’s the solution to your
inventory problems.” Anders Dahlvig, CEO of IKEA, is quoted as
saying, “Whether we are in China, Russia, Manhattan, or Lon-
don, people buy the same things. We don’t adapt to local mar-
kets.”2 So, despite local and regional U.S. managers’ constant
attempts to convince headquarters otherwise, their bosses in
Sweden clung to their strategic map for over two years. Finally,
2. *Nicholas George, “One Furniture Store Fits All” Financial Times,February 8, 2001, p. 11.

L e a d i n g S t r a t e g i c C h a n g e26
the bursting warehouses won, metric-sized beds and bedding
were reluctantly discontinued in the U.S. market, and manage-
ment declared that metric was not king; king was king; queen
was king; twin was king in the U.S. market.
Why did IKEA persist in following its strategic map of metric as
king? Because it had worked so well in the past, and IKEA was
good at it. Company leaders could not see an alternative map
because their vision was full of the successful and working map
they already had.
This is a critical point. If people were blank slates, it would be
much easier to put new maps in place when organizations
attempt to shift strategic directions. But people are not blank
slates. Consequently, one of the first keys to effective change is
recognizing that people have existing mental maps, and they
have them for only one reason—they have worked and they con-
tinue to work well! It is not that “an old dog can’t learn new
tricks.” Rather it is that an old dog has a devil of a time unlearn-
ing old tricks.
Until we recognize that people’s vision for the need for change is
blocked by existing mental maps that argue for past success and
against future change, we will continue to fail in breaking
through the first brain barrier of change. We must recognize that
people have strong existing mental maps, and we must know
what those maps are. Without this understanding, it is almost
impossible to overcome people’s failure to see.
Successful but Mistaken Maps
As important as this is, it is also critical to understand that, even
when using successful maps, people often use mistaken maps.
For example, even though the Island of California worked for a
while, it was nonetheless inaccurate and full of mistakes. Thus,
even when a map has worked well in the past, the seeds of its

Chapter 2 • Brain Barrier #1 27
future failure may lie in that fact that it is inaccurate and mis-
taken in the first place! This is important because people often
believe that if their map works, it must be correct. Consequently,
one key to leading strategic change effectively is to recognize
and help others see that a map’s past success does not necessar-
ily correspond to its correctness.
Interestingly, we have found that these mental mapping mistakes
have direct corollaries to common mistakes made with physical
maps of the real world. By examining actual maps and their
errors, we have gained a much better understanding of the types
of mistaken mental maps that people regularly use.
Distorted Maps. Many successful maps have distortions in them
that eventually emerge and lead the followers of the map from
success to failure. Distorted maps have a tendency to exaggerate
some elements of the terrain while diminishing others. This typ-
ically reflects the psychological process—found even in cartogra-
phy—of inflating what you know and deflating what you do not.
From a mental map perspective, the extreme state is one in
which you believe that what you know is everything and what
you do not know is nothing.
How do distorted maps look in actual cartography? Consider the
map in Exhibit 2-3.
This is how the United States looks to someone from Boston. As
you can see, Cape Cod is of significant size and substance in the
Bostonian’s mind. On the other hand, although Florida exists, it
is quite small in comparison. Likewise, the Northeast in particu-
lar and the East in general are much larger than the humble (but
no longer an island) California.
Just in case we have any Bostonian readers who are not quite
sure what is wrong with this picture, we have also added a map
that more accurately portrays the relative dimensions and sizes
of the places in question in Exhibit 2-4.

28
EXHI
BIT
2-3
A Bos
tonian
’s vie
w of
the U
nited
Stat
es.

Chapter 2 • Brain Barrier #1 29
As a point of interest, this type of distortion is common to us all.
Asked to draw a map of their neighborhood, people invariably
draw their street and house much larger than they are in propor-
tion to the overall neighborhood that they map out.
Although this type of mistaken map is intriguing, the key ques-
tion is, How does it apply to the business world? The first impor-
tant implication is that, although a distorted map may be
mistaken, it works as long as one does not venture outside of the
known area. The distorted map of the United States is not a
problem and works well—as long as you stay in New England.
Venture off to Florida and use this map to calculate driving time,
and the results will not be positive.
The second important implication is that the distorted map leads
you to stay within the exaggerated area. Why would you want to
leave Boston or New England? After all, based on the map, it
looks as though there really is not much else out there. Conse-
quently, using this mistaken map would quite likely cause you to
EXHIBIT 2-4A more accurate view of the United States.

L e a d i n g S t r a t e g i c C h a n g e30
stay “at home.” Ironically, staying at home increases the map’s
success. The more you use it to get around at home, the more
successful experiences you will have, and the more convinced
you will be that you should hang on to this map. Following the
distorted map actually keeps you from encountering evidence of
the map’s inaccuracies and mistakes!
It is relatively easy to find business examples of these same
dynamics that result from relying on a mistaken, distorted map.
One of the more interesting examples is the Kellogg’s company.
Located in Battle Creek, Michigan, Kellogg’s has dominated the
breakfast table of Americans (especially children) for decades.
Kellogg’s had a mental map of the world that exaggerated what it
knew (breakfast cereal in the United States) and deflated what it
did not know (other food products for the rest of the world). As a
consequence, Kellogg’s view of its existing and new products, as
well as existing and new markets, looked like Exhibit 2-5.
ExistingMarkets
Breakfast Cerealin the USA
Existing ProductsNew
Products
NewMarkets
EXHIBIT 2-5Kellogg’s world map of products and markets.

Chapter 2 • Brain Barrier #1 31
Just as a Bostonian’s exaggerated view of the size of Cape Cod,
Kellogg’s greatly inflated the size of breakfast cereal in the United
States, compared with the rest of the picture. For nearly 40
years, this strategic map worked just fine at Kellogg’s. As a mat-
ter of fact, given how small the rest of the world seemed, based
on this map, why should Kellogg’s venture far from home, in
terms of either products or markets? The prize looked just too
small to worry about. So it didn’t; it stayed at home within the
safe boundaries of its map.
What happens, though, when the home market begins to shift?
What happens when people eat breakfast less at the table and
more on the run? What happens if generic makers of cereal
increase their quality until they begin to rival Kellogg’s but offer
prices that are 20–30% below Kellogg’s? What do you do if you’re
an executive at Kellogg’s? At first, you deny. It is just a tempo-
rary blip, and if it is more than temporary, it is confined to a
small segment of the market.
What do you do when you see sales start to flag and flatten, and
you simply cannot deny the shifts? What do you do when you
can deny the shift no longer? You do what you know how to do.
You increase trade promotions (i.e., money for retailers to push
your product). This is exactly what Kellogg’s did, but unfortu-
nately, it did not increase sales much, and it actually hurt the
company’s earnings.
Based on this distorted mental map of the world, would you
explore new products? Look at how small that space is. The
answer is that you wouldn’t, and Kellogg’s didn’t. The company
did not introduce a single new brand between 1983 and 1991.
Even though it successfully introduced Pop-Tarts in 1964, it did
not introduce a single new snack-food success until 27 years
later, when it launched Nutri-Grain cereal bars.
What about new markets? With this distorted mental map,
would you aggressively explore new markets? Again, look at how

L e a d i n g S t r a t e g i c C h a n g e32
small that space is. In talking with executives at Kellogg’s, several
pointed out that they were “into” international markets in a big
way during the 1980s and 1990s. The company was operating in
roughly 30 different countries. But if you measured revenues and
profits and not just countries in which Kellogg’s operated, the
strategic, financial, and marketing emphases were completely in
harmony with the distorted mental map. The vast majority of
efforts and returns were focused on the home market. From this
case example of Kellogg’s, let’s review several key points.
First, just because a map works does not mean that it accurately
reflects all the terrain. Breakfast cereal in the United States was
not nearly as large as it seemed to Kellogg’s executives in the
context of the global breakfast-food territory.
Second, as long as the terrain in focus doesn’t change and you
don’t venture outside the exaggerated area of focus, the map
(mistaken as it may be) continues to work fairly well. The
longer it works, the more convinced you become that it is,
indeed, correct.
Third, even when signs start to emerge that the map is not work-
ing as well today as in the past, its distorted nature creates a log-
ical incentive to stay at home. After all, if the noncereal and non-
U.S. parts of the map are as small as they appear, they are not
really worth venturing into.
Fourth, even as evidence starts to mount that the terrain has
shifted and the map is just plain wrong, there are great pressures
to respond to shifts by doing what you know how to do—rather
than venturing into unknown territories or paths. Like Kellogg’s,
you flood the market with sales promotions, rather than make
serious attempts to launch new products or conquer new lands.
Until Kellogg’s changed its strategic map maker (new CEO, Car-
los Gutierrez), no threat or opportunity was seen because
Kellogg’s was so blinded by the light of what it already saw. Later

Chapter 2 • Brain Barrier #1 33
in the book, we will continue the Kellogg’s story and show how it
has tried to change the strategic map in executives’ heads to
grow the company.
Central Position Maps. Another common mistaken map is what we
might call central position maps. In the world of actual maps,
this is the tendency to put yourself (and your country) in the
center and have everything else revolve around you.
If you want to do something fun the next time you are in a for-
eign country, go into a map store and take a look at a world map
produced by publishers in that country. Invariably, the map will
place that particular country in the center of the world. This ten-
dency has a long history. Perhaps it is best illustrated with an old
map of the Central or Middle Kingdom—China. The two Chinese
characters that constitute the name China literally mean “cen-
tral or middle kingdom.” As the map in Exhibit 2-6 illustrates,
China saw herself at the center of the world then, as well as now.
We might think of IKEA as having also viewed the world this way.
As its CEO pointed out, “We don’t adapt to local markets.” It is
not the case that IKEA saw Sweden or even Scandinavia as dis-
tortedly large and the rest of the world as small. Indeed, it had an
accurate map of the size of different furniture markets in the
world. Still, IKEA saw itself and its metric measurements as the
center of the world. Everything else revolved around it.
As we have already stated, you get a centered map established
and accepted only if it works. Metric measures worked for IKEA.
For example, IKEA effectively sold metric chairs all around the
world, including in the United States. No one in the United
States cared (or even knew) that most chairs IKEA sold were .78
meters from the floor to the seat. The more this metric map
works, the more you begin to believe that the world revolves
around you. With metrics at the center of the universe and with
literally billions of dollars of success behind it, why would execu-

L e a d i n g S t r a t e g i c C h a n g e34
tives at IKEA not resist changing this strategic map? Of course
they would resist, and they did.
We need to be careful, however, in providing so many large com-
pany examples that we create the impression that only big orga-
nizations are subject to these mistakes. These dynamics are just
as true for individuals. In the case of central position maps, we
also see individuals making this mistake all the time. For exam-
ple, we knew of a manager sent on an international assignment
who had “speak up” at the center of his mental map of interper-
sonal effectiveness. He explained that “speak up” was the phrase
he used (and that the company used) to describe in shorthand
EXHIBIT 2-6Ancient China as the center of the world.

Chapter 2 • Brain Barrier #1 35
the belief that the best way to make decisions, resolve conflicts,
and communicate in general was to speak up, to say what you
mean and mean what you say. This, he explained, included
silence. If you weren’t saying anything, it meant that you had
nothing to say.
This manager was sent to Thailand. Unfortunately, most of his
Thai workers did not share this same mental map of effective
interpersonal relations. They were often silent when they, in
fact, had things to say. Specifically, they were often silent when
they disagreed with this individual. They even said yes when
they really meant no. It did not take this manager long to dis-
cover that people said nothing when they had something to say
because later their actions did not follow what he thought their
silence meant. As these types of experiences began to pile up, he
concluded that the Thais did not say what they meant and did
not mean what they said.
Using his mental map with “speak up” at the center, he quickly
formed interpretations of Thai workers and their behavior. He
told us, “These Thais do not say what they mean and I can’t trust
them to mean what they say. I’m afraid that many of them are
just dishonest, weak, and two-faced. With employees like this,
I’m not sure we can be successful in this country.” He was right.
The company had difficulty being successful. However, the firm’s
struggles were not because of its Thai employees, but rather
because of its country manager.
Given his interpretation of the Thai employees, the country
manager’s course of action was to send some key employees to a
training program on speaking up. He pushed what he knew.
Interestingly, the more the employees learned about speaking up
from the training program, the more they resisted it because
they did not think it would work with their Thai subordinates,
and they did not want to try and fail.

L e a d i n g S t r a t e g i c C h a n g e36
Speaking up for this country manager in Thailand, like metric
for IKEA, was at the center of his map. Things in the past had
successfully revolved around this center. The common elements
in these situations are that, when the map begins to fail, whether
it is for Motorola, IKEA, or an individual manager, the first reac-
tion is to deny the failure, and the second reaction is to try
harder by doing even more of what you know how to do best.
Strip Maps. A third type of mistaken map is what we call a strip
map. A strip map has a restricted or narrow view of the terrain
and a fixed sequence for getting from one place to another. Like
the other mistaken maps, this one has been with us for a very
long time. The strip map in Exhibit 2-7 shows how to get from
London to Rome. As you can see, there is a fixed sequence of
going from one monastery to the next and a rather narrow view
of the path.
Strip maps get established because particular sequences and a
narrow path have been shown to work in the past. When we
show this old strip map to people, they often laugh. “How could
anyone follow such a narrow map?” they ask. When drawn out
on paper, strip maps do look rather narrow. How can people fall
into the strip-mapping mistake? It is actually quite easy.
Although the narrowness of a strip map is obvious when it is
drawn out on paper, that narrowness is often missed when the
map is seen in our mind’s eye. Why? The answer lies in the suc-
cess of the map. If we follow the strip map sequence, stay within
the narrow parameters, and succeed in reaching our desired des-
tination, why would we necessarily think about alternative
sequences or other paths off the beaten track to the left or the
right? The answer is that we don’t. Who has time to argue with
success? The sequence worked, so let’s not think too much
about other alternatives and, instead, simply use the map again.
Consider Barnes & Noble for example. CEO, Lennie Riggio, got
his start in selling books when he dropped out of New York Uni-

37
EXHIBIT 2-7The road from London to Rome.

L e a d i n g S t r a t e g i c C h a n g e38
versity in 1965 and opened SBX (Student Book Exchange). By
1971, he owned five SBX college bookstores. That year, he
bought a struggling book shop in Manhattan called Barnes &
Noble. In 1979, he bought Marboro Books, which had six stores.
At this point, the strip map was being established and reinforced.
The mental strip map looked something like this: To sell more
books, own more brick-and-mortar book shops.
The strip map was further reinforced as more brick-and-mortar
bookstores were built. As Riggio built more stores, he also made
them bigger. Whereas many of his early bookstores carried
20,000 titles, the newly constructed bookstores carried twice
that number. The strip map was further established and rein-
forced: To get to the destination of more sales, buy or build more
brick-and-mortar stores and make them bigger.
The entrenchment of this map solidified when, in 1986, Riggio,
using junk bonds and his company, Barnes & Noble (37 total
bookstores), bought B. Dalton (over 800 total bookstores). The
combination gave Barnes & Noble nearly 850 bookstores, most
of them twice the size of the original Barnes & Noble store in
Manhattan. In fact, with the acquisition of B. Dalton came not
only many larger bookstores, but a few “mega” bookstores, as
well. These mega stores carried over 100,000 titles.
Unlike nearly all of its regular big bookstores, which were in
shopping malls, the mega bookstores were so big that they were
built as separate, stand-alone businesses. Inside these brick-and-
mortar shops, Riggio added couches, coffee bars, music CDs, and
free copies of the New York Times Book Review. Barnes & Noble
built scores and scores of these mega bookstores throughout the
1990s. In fact, Barnes & Noble built 95 mega stores in 1995 alone.
By 1995, the strip map was firmly entrenched and reinforced by
millions of dollars of success: To sell more books, you need to
have (build or buy) more and bigger brick-and-mortar book-
stores. In fact, the map was so successful that even though the
U.S. book market grew by less than 1% per year during the

Chapter 2 • Brain Barrier #1 39
1990s, Barnes & Noble’s market share increased from 7% to over
15% during the same time period. This increased share came
largely from small, independent bookstores. By July 1998, Bar-
nes & Noble’s stock price hit an all-time high of $48, which rep-
resented a 220% increase over its price just two years earlier.
Barnes & Noble’s strip map (Exhibit 2-8) looked brilliant.
MEGABookstore
BIGBookstore
Bookstore
EXHIBIT 2-8Barnes & Noble’s strip map of market success.

L e a d i n g S t r a t e g i c C h a n g e40
What happened? In July 1995, Jeff Bezos, CEO of Amazon.com,
decided to follow a different map to selling books. Rather than
restrict customers to only 100,000 titles, he would make over a
million titles available to them. And rather than have bricks and
mortar, customers could click in their orders. For three years,
Barnes & Noble totally dismissed Amazon.com. However, when
after three years’ time, Amazon.com had 8.4 million registered
customers and Barnes & Noble had just 1.7 million, shareholders
of Barnes & Noble took notice. Many sold their Barnes & Noble
stock, and the price tumbled by nearly 50%.
But you may be thinking, “Wait a minute. Look at what has hap-
pened to Amazon.com. Its stock price has crashed, and dot-coms
are now dot-bombs.” This is true. However, just as we were irra-
tionally exuberant about the future of Amazon.com, we run the
risk of being irrationally pessimistic about the future of online
book sales. We should not confuse Amazon.com’s big spending to
add everything from CDs to garden tools and the resulting losses
as evidence that online book sales will disappear along with
Amazon.com’s stock price. Online book sales continue to grow
and cannibalize book sales from other brick-and-mortar sources.
If e-books take off, and we then are able both to order and
receive books via the Internet, many predict that online book
sales will rival brick-and-mortar-based book sales.
But let’s not get sidetracked. The main point is that the strip map
of obtaining more sales through more and bigger stores was so
entrenched in Barnes & Noble that it took a massive loss in mar-
ket value before the grip of the mental map and its inherent
restriction were changed. In fairness, once recognized in 1998,
Lennie Riggio did create Barnesandnoble.com. Unfortunately, at
that point, he was playing a serious game of catch-up. By that
point, Amazon.com had a 75% percent market share of all online
book purchases.
In summary, several key insights grow out of our strip map dis-
cussion. First, like all mental maps, strip maps get retained only

Chapter 2 • Brain Barrier #1 41
if they work. A certain sequence of steps and narrowness of terri-
tory gets incorporated into a strip map only if it works. Second,
as long as you don’t venture outside the narrow map, a strip map
will likely continue to work. Third, only after a new sequence is
proven to work or after a different route to the desired destina-
tion is shown to be successful is the old sequence challenged.
Unfortunately, by that point, a successful strip map (even if mis-
taken), like all mental maps, is extremely difficult to change and
breaking through this brain barrier is as likely as hitting Mach 1
in a Cessna.
Upright Maps. Whether a mental map is correct or mistaken, the
longer it works, the harder it is to change. In a sense, all mental
maps successful enough to be retained take on a final character-
istic that we see in the world of cartography, as well as in busi-
ness. This is the tendency to believe that the only way to see the
map is the way it has been seen. This is important enough to
bear repeating: We mistakenly think that the only way to see a
map is the way it has been seen. For example, consider the map
in Exhibit 2-9. When they first see this map, most people
instantly think that it is upside down. After all, Australia is not
“up over,” it is “down under.”
But consider for a moment that you were an alien traveling from
a far-off galaxy and you stop your spacecraft by the moon to look
at our world. Would north necessarily be up? In zero gravity,
isn’t it just as reasonable for Australia to be up over as down
under? The logical answer is of course, yes. However, when we
show this map to people around the world, we invariably find
them tilting their heads to one side until the world starts to look
right side up again—with the exception of Australians, who think
it looks quite right just the way it is.
It is important to note here that, unlike the previous three exam-
ples, the traditional right-side-up map is not mistaken and is, in
fact, accurate and correct. However, its accuracy and correct-

42
SO
UT
H
AT
LA
NT
IC
OC
EA
N
Ch
uk
chi
Sea
SO
UT
HE
RN
O
CE
AN
IN
DI
AN
OC
EA
N
OC
EA
N
AR
CT
IC
OC
EA
N
NO
RT
H
PA
CI
FI
C
OC
EA
N
SO
UT
H
PA
CI
FI
C
O
CE
AN
Ba
re
nt
s
Se
a
Pech
orsk
oye
Mor
e
Nor
weg
ian
Sea
La
pte
v Se
a
Kar
a Se
a
Ba
y o
f
Ben
ga
l
Nor
th
Sea
Ioni
anSe
a
Bay
of
Bis
cay
Bla
ck S
ea
Aeg
ean
Ara
lSe
a
R e d
Gul
f of
Gui
nea
Ara
bia
n
Se
a
Bis
mar
ckSe
a
Ar a
f ur a
Sea
Sou
th
Ch
ina
Sea
Sea
Solo
mon
S
ea
Ta
sm
an
Se
a Co
r al
Se
a
Tim
or S
ea
Gre
at A
ustr
alia
nB
ight
Cel
ebes
Sea
Bas
sSt
rait
Sea
of
Okh
otsk
Sea
ofJa
pan
East
Chi
na
Sea
Be
rin
g S
ea
Ea
st S
iber
ian
Sea
Bering S
trait
Foxe
Bas
in
Hu
ds
on
Ba
y
Gu
lf o
f
Ala
ska
Be
au
fort
Se
aB
aff
in
Ba
y
Gu
lf o
f
Mex
ico
Ca
rib
bea
n S
ea
Bel
lin
gsh
ause
n S
ea
Sco
t ia
Se
a
Dr a
ke P
assa
ge
GulfofBothnia
Me
di t
er r
an
ea
nS
ea
CaspianSea
S e a
Gulf o
f Om
an
ER
ITREA
MozambiqueChannel
Java
Davis Strait
Vis
coun
t M
elvi
lleSo
und
Am
unds
en G
ulf
Gulfof Boothia
Strait
Nares
La
br
ad
or
Se
a
Arc
tic C
ircle
AT
LA
NT
IC
NO
RT
H
Sea
KurilIsla
nds
McC
lure
Stra
it
Hud
son
Stra
it
Whi
teSe
a
Torr
esSt
rait
Novos
ibirs
kiye
Ost
rova
Sakhalin
Baltic
Sea
Cap
eH
orn
We
dd
el l
Se
a
Den
mar
kSt
rait
Gul
fofA
den
Sarg
ass
oSe
a
Severnaya Zemlya
(Eas
t Se
a)
Trop
ic o
f Can
cer
Equ
ator
Trop
ic o
f Cap
ricor
n
Ant
arct
ic C
ircle
RU
SS
IA
N
F
ED
ER
AT
IO
N
IN
DI
A
CH
IN
A
AU
ST
RA
LI
A
OF
A
ME
RI
CA
BR
AZ
IL
CA
NA
DA
GR
EE
NL
AN
D
UN
IT
ED
S
TA
TE
S
U.
S.
A.
Ala
sk
a
HA
WA
II
INTERNATIONAL DATE LINE
AN
TA
RC
TI
CA
SA
UD
I
AL
GE
RIA
LIB
YA
MA
LI
SU
DA
N
EG
YP
T
CH
AD
NIG
ER
ETH
IOPI
A
DEM
OC
RATI
CRE
PUBL
ICO
FC
ON
GO
KA
ZA
KH
ST
AN
MO
NG
OL
IA
IRA
QIR
AN
IN
DO
NE
SI
A
BO
LIV
I A
ME
XIC
O
SWEDEN
NORWAY
PAKIS
TAN
ARGENTINA
AR
AB
IA
JAP
AN
SOM
ALIA
YEM
EN
AN
GO
LA
KEN
YA
NIG
ER
IA
ZA
MB
IA
TAN
ZAN
IA
FRA
NC
ESP
AIN
UN
ITED
KIN
GD
OM
BEL
ARU
SP
OLA
ND
UK
RA
IN
E
TU
RK
EY
ICEL
AN
D
TU
VA
LU
SO
LO
MO
NIS
LA
ND
S
FIJ I
VA
NU
AT
U
KIR
IBA
TI
SA
MO
A
MIC
RO
NE
SIA
NA
UR
U
MA
RS
HA
LL
ISL
AN
DS
MA
LAY
SIA
PH
ILIP
PIN
ES
N
EW
ZE
ALA
ND
TO
NG
A
ECU
AD
OR
RE
PU
BLI
CO
FS
OU
TH
AFR
I CA
CO
LOM
BIA
VEN
EZU
ELA
I TA
L
Y
M
ORO
C
CO
FINLAND
OMA
N
MOZAMBIQUE
MADAGASCAR
GHANA
BENINTOGO
SENEG
AL
PERU
FRE
NC
HP
OL
YN
ES
I A
CHILEN
EW
CA
LE
DO
NIA
GREENLAND
DJIB
OU
TI
LIBE
RIA
CO
TED
’IVO
IRE
THE
GA
MB
IAG
UIN
EA-B
ISSA
U
CA
BIN
DA SA
O T
OM
E&
PRI
NC
IPE
MA
URI
TIU
S
BURU
ND
I
RWAN
DA
CO
MO
ROS
MA
LAW
I
SEY
CH
ELLE
S
QAT
AR
KUW
AIT
UN
ITED
ARA
BEM
IRAT
ES BAH
RAIN
ISRA
EL
ROM
AN
IA
REPU
BLIC
MA
C.
SWIT
ZERL
AN
D
SLO
VAKI
AB
ELG
IUM
LUX
.
SLO
VEN
IA
MO
LDO
VA
ALBA
NIA
MAL
TA
BOSN
IAH
ERZ.
CRO
ATIA
LEBA
NO
NC
YPR
US
AN
DO
RRA
NET
HER
LAN
DS
ESTO
NIA
LITH
UAN
IALA
TVIA
DEN
MA
RK
GEO
RGIA
ARM
ENIA
AZER
BAIJA
N
SOU
THK
ORE
A
NO
RTH
KO
REA
TAIW
AN
THAI
LAN
D
LAO
S
BAN
GLA
-D
ESH
MYA
NM
AR
NE
PA
LBH
UTA
N
KYR
GYZ
STA
N
TAJIK
ISTA
N
MA
LDIV
ESSI
NG
APO
RE
CAM
BOD
IA
BRU
NEI
FREN
CH
GU
IAN
A
EL S
ALV
AD
OR
GU
ATEM
ALA
ST L
UC
IA
HO
ND
URA
SB
ELIZ
E
PAN
AM
AC
OST
A R
ICA
NIC
ARA
GU
AB
ARB
AD
OS
GRE
NA
DA
TRIN
IDA
D &
TO
BA
GO
THE
BA
HA
MA
S
DO
MIN
ICA
ST V
INC
ENT
& T
HE
GRE
NA
DIN
ES
DO
MIN
ICA
NRE
PUBL
IC
Pue
rtoR
ico
AN
TIG
UA
&B
ARB
UD
AJA
MA
ICA
CU
BA
HA
ITI
ST. K
ITTS
AN
D N
EVIS
BER
MU
DA
CA
PEV
ERD
E
PAP
UA
NEW
GU
INEA
SRI
LAN
KA
SYR
IA
IREL
AN
D
PORT
UG
AL
MA
URI
TAN
IA
BURK
INA
FASO
GU
INEA
CEN
TRAL
AFR
ICAN
REPU
BLIC
GA
BON
BOTS
WA
NA
ZIM
BABW
EN
AM
IBIA
CAM
EROON
CONGO
UG
AN
DA
JORD
AN
BULG
ARIA H
UN
GA
RYA
UST
RIA
RUS
FED
.
AFG
HANIST
AN
TURK
MEN
ISTA
N
UZBEKIS
TAN
URU
GU
AY
PARA
GU
AY
GUYANA
GR
EEC
E
NO
RTH
ERN
MA
RIA
NA
S
EQU
ATO
RIAL
GU
INEA
GER
MA
NY
Am
azon
Ea
ste
r Is
Nile
Lake
Vic
tori
a
SWA
ZILA
ND
LESO
THO
Rive
r
Cha
tham
Is
CZE
CH
YUGOSLA
V
TUNISIA
SIER
RALE
ON
E
SURINAME
EAST
TIM
OR
S. G
eorg
ia
Fal
klan
d Is
Sou
th O
rkne
y Is
(U.K
.)
(U.K
.)
(U.K
.)
Gal
apag
os Is
(Ecu
ador
)
(U.S
.A.)
(Fr.)
Ba f f
i nI s
l an d
Isla
nd
s
Vic
tori
a
Ale
uti
an
Isla
nd
s
Novaya
Fra
nz J
osef
Land
Sv
alb
ard
(Nor
way
)Honsh
u
Ho
kkai
do
Isla
nd
Ba
nk
sIs
lan
d
Me
lvill
e I
sla
nd
De
von
Isl
an
d
Qu
ee
n
Eli
za
be
th
P a r ry
I sl a
nd
s
Iles
de K
ergu
elen
(Fr.)
Hea
rd Is
(Aus
t.)
Ile A
mst
erda
m(F
r.)
Ile S
t Pau
l(F
r.)
Iles
Cro
zet
(Fr.)
Prin
ce E
dwar
d Is
(S.A
.)
Bou
veto
ya(N
or.)
Sou
thS
andw
ich
Is(U
.K.)
St H
elen
a(U
.K.)
Asc
ensi
on Is
(U.K
.)
Zemlya
Can
ary
Is(S
pain
)
K
yushu
Shi
koku
Mindanao
Bo
rne
oS
ulaw
esi
I ria
nJa
ya Mol
ucca
Ja
va
Tim
or
S u ma t r
a
Chr
istm
as Is
(Aus
t.)
Coc
os (
Kee
ling)
Is(A
ust.)
Ha
wa
i ia
nI s
l a
nd s
Cha
gos
Arc
hipe
lago
(B.I.
O.T
.)
(Chi
le)
NorthIsla
nd
South
Island
Ta
s
man ia
Cap
eof
Goo
dH
op
e
Ba
li
(NZ
)
Ell
es
me
re
Isla
nd
Dha
kaH
onol
ulu
Car
acas
Ber
n
New
Del
hi
Osl
o
Rey
kjav
ik
Hel
sink
i
Sto
ckho
lm
Rig
a
Mos
cow
Talli
nn
Ber
lin Cop
enha
gen
Viln
ius
Kie
v
Min
sk
War
saw
Am
ster
dam
Bud
apes
tB
ratis
lava
Vie
nna
Pra
gue
Sko
pje
Tira
na
Ath
ens
Sof
iaB
ucha
rest
Zagr
eb
Sar
ajev
oBe
lgra
de
Rom
e
Ljub
ljana
Par
is
Mad
rid
Lisb
on
Dub
linLo
ndon
Tash
kent
Alm
aty
Bru
ssel
s
Bis
hkek
Dus
hanb
eA
shga
bat
Tehr
an
Kar
achi
Kab
ulB
eiru
tD
amas
cus
Bag
hdad
Yere
van
Ista
nbul
Bak
uT
’bili
si
Ank
araJe
rusa
lem
Cai
ro
Al M
anam
ah
Kuw
ait
Am
man
Riy
adh
Mus
cat
Abu
Dha
bi
Ad
Daw
hah
Sal
alah
Thi
mph
u
Kat
hman
du
Toky
o
Sri
Jaye
war
dene
pura
Kot
te
Han
oiPhn
omP
enh
Ban
gkok
Yan
gon
(Ran
goon
)
Ban
dar
Ser
iB
egaw
an
Jaka
rta
Kua
laLu
mpu
r
Via
ngch
an
Sha
ngha
i
Por
tM
ores
by
Man
ila
Seo
ul
Ula
n B
ator
Bei
jing
P’y
ongy
ang
Taip
ei
Syd
ney
Mel
bour
ne
Ade
laid
e
Per
th
Bris
bane
Can
berr
a
Hob
art
Wel
lingt
on
Auc
klan
d
Dar
win
Suv
a
Nou
mea
Hon
iara
Nas
sau
Phi
lade
lphi
a
Asu
ncio
n
Bue
nos
Aire
sS
antia
go
Bog
ota
Qui
to
Lim
a
Rio
de
Jane
iro
Cay
enne
Par
amar
ibo
Geo
rget
own
Bra
silia
Mon
tevi
deo
Bel
mop
an
San
Sal
vado
r
Gua
tem
ala
Mex
ico
Hav
ana
Pan
ama
San
Jos
eM
anag
ua
Tegu
ciga
lpa
Por
t of S
pain
San
Jua
nSan
to D
omin
goP
ort-a
u-P
rince
Kin
gsto
n
Chi
cago
New
Yor
k
Los
Ang
eles
Dal
las
New
Orle
ans
Was
hing
ton
Den
ver
Mon
trea
l
Anc
hora
ge
Van
couv
er
Otta
wa
Libr
evill
e
Tuni
s
Add
isA
baba
Kha
rtou
mA
smar
a
Dar
es
Sal
aam
Kam
pala
Mog
adis
hu
Luan
da
Kin
shas
aB
ujum
bura K
igal
i
Gab
oron
eW
indh
oek
Har
are Lu
saka
Moc
ambi
que
Lilo
ngw
e
Map
uto
Por
t Lou
isA
ntan
anar
ivo
Ndj
amen
a
Ban
guiBra
zzav
ille La
gos
Mal
abo
Yaou
nde
Mon
rovi
aYa
mou
-ss
oukr
oLo
me
Por
to-
Nov
o
Acc
ra
Con
akry
Fre
etow
n
Oua
gado
ugou
Dak
ar
Nou
akch
ott
Bam
akoB
issa
u
Nia
mev
Cas
abla
nca
Rab
at
Ban
jul
Trip
oli
Alg
iers
Djib
outi
Chi
sina
u
Luxe
mbo
urg
Mon
aco
Val
letta
Nai
robi
Vic
toria
Pra
ia
Mal
e
Ho
Chi
Min
h C
ity
Kol
onia
Yar
en
Nuk
a ’a
lofa
Api
a
Min
neap
olis
Cle
vela
ndB
osto
n
Sal
t Lak
eC
ity
Sea
ttle
Por
tland
San
Die
goP
hoen
ixE
l Pas
oA
tlant
a
Mia
mi
Sap
poro
She
nyan
g
Gua
ngzh
ou
Cai
rns
Alic
e S
prin
gs
Kol
kata
Mum
bai
Nov
osib
irsk
St P
eter
sbur
g
Gla
sgow
Che
nnai
Sao
Pau
lo
Sal
vado
r
Med
ellin
Aca
pulc
o
Mon
terr
eyGua
dala
jara
Vic
toria
Cal
gary
Edm
onto
n
V IET NAM
Suc
re
Que
bec
Nuu
k
Las
Veg
as
June
au
Fai
rban
ks
Win
nipe
g
St J
ohn’
s
Hal
ifax
Mur
man
sk
Ber
gen
Vol
gogr
ad
Kaz
an’
Che
lyab
insk
Yeka
terin
burg
Om
sk
Mag
adan
Vla
divo
stok
Osa
kaF
ukuo
kaIs
lam
abad
Per
m’
Ufa
Cap
e To
wn
Har
bin
Che
ngdu
Ral
eigh
Bis
mar
ck
Yello
wkn
ife
Nom
e
Chu
rchi
ll
Irku
tsk
Ula
n-U
de
Chi
ta
Kha
baro
vsk
Okh
otsk
Yak
utsk
Uru
mqi
Sur
abay
a
Med
an
Dun
edin
Chr
istc
hurc
h
Rec
ife
Por
to A
legr
e
Bel
ém
Mar
acai
bo
Gua
yaqu
il
Cal
i
Cor
doba
For
tale
za
Hou
ston
Mez
en’
Vor
kuta
Nor
dvik
Pev
ek
Pro
vide
niya
Cho
kurd
akh
Pet
ropa
vlov
sk-
Kam
chat
skiy
Tiks
i
Whi
teho
rse
Rep
ulse
Bay
Sac
hsH
arbo
ur
Iqal
uit
Las
Pal
mas
Ban
galo
re
Hyd
erab
ad Laho
re
Ust
’ Pen
zhin
o
Ole
nek
Dav
ao Zam
boan
ga
Pal
emba
ng
Toro
nto
Fuz
hou
Gui
yang
Lanz
hou
Xi’a
n
Jina
n
Kao
hsiu
ng
San
aa
Mor
oni
San
Fra
ncis
co
The
Hag
ue
Bel
fast
Ha
wa
ii
Por
t-V
ila
Hon
gK
ong
Dur
ban P
reto
ria
Rive
r
Nic
osia
Mas
eru
Mba
bane
Dod
oma
Abu
ja
Ast
ana
Dili
Cap
ital
Cit
y, T
ow
n
Hem
a M
aps
Pty
Ltd
Ph:
+61
7 3
340
0000
Fax
: +61
7 3
340
0099
Web
: ww
w.h
emam
aps.
com
Em
ail:
man
ager
@he
mam
aps.
com
.au
Hem
a M
aps
NZ
Lim
ited
Ph:
+64
9 2
73 6
459
Fax
: +64
9 2
73 6
479
Em
ail:
sale
s.he
ma@
clea
r.net
.nz
© C
opyr
ight
Hem
a M
aps
Pty
Ltd
200
2
LE
GE
ND
200
2040
6080
100
120
140
160
180
160
140
120
100
8060
40
200
2040
6080
100
120
140
160
180
160
140
120
100
8060
40
60 40 20 0 20 40 60 80
60 40 20 0 20 40 60 80
EXHIBIT 2-9An Australian view of the world. (Map courtesy of www.hemamaps.com.au)

Chapter 2 • Brain Barrier #1 43
ness are no guarantee that it will continue to work as the only
way to get things done. We will come back to this at the end of
the book, when we talk about practical things you can do to
reduce the chances that you get stuck in holding on to maps that
need to change.
Still, the important thing to keep in mind is that, if we see a map
a certain way often enough, we end up believing that it is the
only way for it to be seen. The longer we see the world as con-
sisting mostly of breakfast cereal in the United States, the easier
it is to believe that is the only way to see the world. The longer
we see metric-measured beds as the center of the world, the eas-
ier it is to see metric beds as the only beds. The longer we see
bigger brick-and-mortar bookstores as the path to greater sales,
the easier it is to see them as the only path. Given enough time
and exposure to any map, it becomes the “right” map. As a
result, we diminish our capacity to see the world any other way.
Overcoming the First Brain Barrier
Our main points in this chapter are straightforward. First, to fly,
we have to understand the power of gravity. The first gravita-
tional force relative to change is that which keeps people from
seeing impending threats and opportunities. We have tried to
illustrate that people do not see even obvious threats and oppor-
tunities because they are blinded by the light of what they
already see—the mental maps that have worked for them in the
past. Second, we pointed out that even when people have con-
structed successful mental maps, those maps are quite often
flawed. Just as in actual cartography, people create successful
but distorted maps, centrally positioned maps, or strip maps.
The longer these mistaken maps work (or the longer we believe
they work), the more difficult they are to change. Unless we

L e a d i n g S t r a t e g i c C h a n g e44
understand the general nature of these mental mapping mis-
takes, it can be difficult to overcome them. Unless we overcome
the power of mental maps, we have little hope of generating
enough lift to get our change project off the ground.

45
CH
AP
TE
R 3 The Keys to Seeing: Contrast and Confrontation

L e a d i n g S t r a t e g i c C h a n g e46
If people are blinded, how can you help them see? How
can you help people see what they have a hard time seeing? How
can you avoid getting yourself trapped in past mental maps? You
can’t just say, “See!” If people could see the shifts and needed
changes, they would. The solution has two parts—contrast and
confrontation.
Both come from simple facts that we know about actual vision.
To see physical objects, we need some contrast in shape, light,
and color. We also see best when those objects are directly in
front of us, rather than off to the side in our peripheral vision.
Even though, in the context of individual and organizational
change, we are not talking about seeing physical objects, the two
factors that help us see physical objects apply to seeing new
business realities just as well.
ContrastAs we mentioned, contrast is one of the key means by which the
human eye distinguishes different objects. When combined, dif-
ferences in shape, brightness, and color give us contrast. The let-
ters on this page stand out because of the contrast of black
against white. It is such a simple notion that we generally take it
for granted. But notice how the contrast lessens as you look at
the circles in Exhibit 3-1 from left to right.
EXHIBIT 3-1Circles of contrast.

Chapter 3 • The Keys to Seeing 47
In this simple example, the different levels of contrast are easy to
see. In complex organizational settings, there are so many things
to look at that people can selectively focus on elements from the
past and present that are similar, rather than different. In effect,
they can choose to ignore key contrasts and thereby avoid look-
ing at why what worked in the past might not work in the future.
This brings us to the second part of the answer to overcoming
the failure to see—confrontation.
Confrontation
Precisely because the organizational and business realities we
face are complex, people can ignore or literally be blind to the
“obvious” differences between the past and present. This is why
they fail to see the reasons that strategies, structures, cultural
values, processes, technologies, etc. must change. The fact that
most people do not easily see these contrasts is clear and compel-
ling evidence that people cannot be left on their own to visualize
them. Just as we “forced” you to see the contrasts among the cir-
cles on the previous page, leaders have to confront their people
with the key contrasts between the past, present, and future.
Combining Contrast and Confrontation
The matrix in Exhibit 3-2 helps to illustrate why both contrast
and confrontation are necessary to overcome the first gravita-
tional force—the failure to see.
If there is low contrast (for example, the nearly white circle on
the white page) and low confrontation (for example, if you could
just skip the previous page on which we presented the contrast-
ing circles), your change efforts are likely to end up in the gar-

L e a d i n g S t r a t e g i c C h a n g e48
bage can—wasting time, money, and energy. With low contrast
and confrontation, people will not see a need for change and,
consequently, won’t change.
If contrast is high, however, and confrontation is low, it is like a
passing parade. People will “ooh” and “ah” at the difference, but
when the parade passes, they will go back to what they were
doing before.
If confrontation is high but contrast is low, it is like an old shoe.
It sits there confronting you every day, but it is still the same old
shoe. It looks and smells no different each day.
The key to overcoming the failure to see is creating both high
contrast and high confrontation. Unfortunately, this is much
easier said than done. Even when leaders attempt to create both
high contrast and confrontation, we frequently observe two com-
mon mistakes.
High
Low
Parade
Old ShoeGarbage Can
Contrast
BREAKTHROUGH
HighLow
Confrontation
EXHIBIT 3-2Breaking through the sight barrier.

Chapter 3 • The Keys to Seeing 49
Mistake #1: The Comprehensiveness Mistake. In creating high con-
trast, one of the first mistakes many leaders make is what we call
the comprehensiveness mistake. The mistake happens as lead-
ers try to illustrate the contrasts between yesterday and tomor-
row but end up making the illustration too complex and
comprehensive. When presented with a complex picture of the
past and present (or future), the complexity actually allows
employees to focus on what they want. Because people are pro-
grammed to hang on to what has worked, they are likely to use
that freedom to focus on similarities in the picture, rather than
differences. Why? Similarities reinforce past mental maps,
whereas differences may threaten them. Presenting too complex
a picture also allows people to zero in on the “not so important”
contrasts, rather than the critical one. Either way, people are
free to conclude, “Things are not really that different.” And if
things are not really that different, then little need exists for
them to think or behave differently. The important thing to keep
in mind is that the more complex the picture presented is, the
more alternative specific points there will be on which people
can choose to focus. This, in turn, increases the chances that
they will select the wrong targets for guiding their actions.
What causes leaders to make this common mistake? In some
cases, the cause of this comprehensiveness mistake is that lead-
ers know that reality is complex, and they do not want to appear
to be simple-minded. Consequently, they list and discuss “a
variety of factors contributing to our need to change.” At one
level, this is quite understandable and sensible. Yet in our expe-
rience, the true cause of this mistake is less admirable. In most
cases, the mistake has less to do with a desire to “reflect the
complex reality of the current business environment” and more
to do with leaders’ inability or unwillingness to identify the core
of the issue. Rather than take the time and energy to identify
the core 20% that accounts for 80% of the problems, they fall for
an easier approach of simply listing all the factors. The time and
brainpower required to create a long list of factors is not nearly

L e a d i n g S t r a t e g i c C h a n g e50
that required to determine which factors on that long list are
the most influential. This is why calling this the comprehensive-
ness mistake is too polite; we probably ought to call it the laun-
dry list mistake.
Mistake #2: The “I Get It” Mistake. Even if we as leaders are suc-
cessful at avoiding the first mistake (the comprehensiveness mis-
take), there is a second pitfall we all too often see people fall
into—the “I get it” mistake. The mistake is simple. It is present-
ing the contrast once and only once. In other words, as the
leader, you recognize the need for change, so you present it to
others one time and expect them to understand it instantly.
After all, you understand it, so why shouldn’t they?
When we say “you,” we mean everybody. No one seems to be
totally immune from making this mistake. So why do we make
this mistake? The answer lies in giving ourselves too much
credit. After we spend time trying to understand a problem and
the light bulb in our head finally turns on, we give ourselves too
much credit and forget how much time and effort it took to “get
it.” This happens in part because once we get it, we get it. The
neural pathways in our brain among the various components of
the problem and solution are established. They are there. Once
we understand it, we do not have to do anything to understand it
again. The neural pathways are paved, and we can make the con-
nections at high speeds. It is there; we see it instantaneously. In
fact, we often think, “This was so obvious. Why didn’t I see it
from the start?” It is as though once the light goes on, it turns off
our memory of how we got there and how much time and effort
it took.
Consequently, we think that if we mention it once to someone,
they will get it, too. The new strategic vision is so obvious, how
many times should we need to repeat it? During consulting
engagements, we have heard leaders on many occasions ask us

Chapter 3 • The Keys to Seeing 51
something similar to the following: “Didn’t they hear me? I
explained all this in my presentation the other day. Are they
brain dead?” Although this may seem harsh, we can’t even print
the harsher statements. But the key point is that all of us give
ourselves too much credit and forget how many times we had to
look at a problem, how many different angles we had to explore,
and how long we had to think about it before we finally under-
stood it. Because we forget the process of understanding it, we
end up thinking that saying it once to others is more than
enough for them.
Creating High Contrast
With these two common mistakes in mind, we can now turn our
attention to specific means of creating high and compelling con-
trast—the first of our two-part solution. Given the tendency to
try to paint pictures that are too complicated and comprehen-
sive, effective contrast requires leaders to focus on the core 20%.
As we have already pointed out, reality in its entirety is complex.
Left completely in its complexity, the important contrasts are
hard to see. Consequently, leaders have to simplify and focus on
the key differences. The key is identifying the key differences.
Making the judgments as to what are and what are not core con-
trasts is what leaders get paid for.
Imagine for a moment that you work for the leading signal pro-
cessing firm, QuadQ, Inc.,1 whose products primarily ship to the
health care industry. Scientific researchers and hospital
researchers use your products in diagnostic tests and cellular
and blood chemical analysis. QuadQ’s analog technology has
been at the leading edge for years. Then a shift occurs in the
1. *QuadQ, Inc. is a fictitious name but represents a real but disguisedsituation.

L e a d i n g S t r a t e g i c C h a n g e52
market. First, digital signal processing emerges as a competing
technological platform. When it first emerges, however, it seems
unable to rival your analog technology. Second, the nature of
customers begins to shift. Diagnostics and analyses are done
increasingly in clinics and by technicians, not in research labs
by MDs and PhDs. Third, there is a trend to coordinate separate
tests and analyses into integrated systems. The emerging “buzz
phrase” in your industry becomes “providing solutions, not
boxes, to customers.”
As signs of these shifts first emerge, many of the scientists within
your firm resist the signals that the environment is changing.
They work harder at coming up with customized analog solu-
tions for customers. Over a year or two, it becomes increasingly
clear to you that digital signal processing is the superior technol-
ogy in general and specifically for integrating your products into
larger solutions. It also becomes more evident to you that digital
is the way to go for simplifying the use of your product so that
less sophisticated customers can operate the equipment.
How do you create a compelling contrast sufficient to shake your
employees free from their entrenched mental maps? First, you
have to cut to the core. What are the core contrasts between the
past and the future? Clearly, QuadQ exists in a very complex
environment, but allowing too much of that complexity to creep
in can kill the needed contrast.
Although QuadQ’s environment is full of complexity, five key
contrasts exist: technology, strategy, customers, competencies,
and relationships (Exhibit 3-3). Keep in mind that, as simple as
this seems, it still requires people to remember 10 things (i.e.,
five categories by two descriptions). This is important when you
recall, as we previously mentioned, that although most people
can remember seven things, only about 2% remember ten. You
create the following matrix to highlight the core contrast.

Chapter 3 • The Keys to Seeing 53
The second thing you do is ratchet up contrast by enhancing the
conceptual distance between the descriptions. You know that the
reality may not be quite so black and white, but you also know
that the greater the contrast, the easier it is for employees to see
difference and recognize the acute need for change.
In addition to focusing on the core contrasts, you also take a
page from what we know in general about vision and memory.
Research has clearly demonstrated that the better you create
images in people’s minds, the more clearly they can recall associ-
ated messages. Although the above matrix appeals to your cere-
bral nature, you realize the need for something else—something
more visual. In response, you create a very simple picture that
contrasts the old and the new, as shown in Exhibit 3-4.
Using these images, you explain that in the past, individual, bril-
liant scientists created leading-edge analog boxes that very
sophisticated customers used. That was the old map. The new
map calls for gearing products toward increasingly less sophisti-
cated customers and away from doctors and research scientists.
With the new map, QuadQ will create more integrated, digital
EXHIBIT 3-3 QuadQ’s Changing Environment
Issue Old New
Technology Analog Digital
Strategy Make leading-edge boxes Provide leading-edge
solutions
Customers Hospital and research
centers. Sophisticated
doctors and scientists
Clinics and labs.
Significantly less
sophisticated technicians
Key Personal
Competencies
Scientific and technical
brilliance
Teamwork
Departmental
Relations
Autonomous and
independent
Collaborative and
cooperative

L e a d i n g S t r a t e g i c C h a n g e54
solutions, rather than boxes. Finally, instead of relying on indi-
vidual brilliance among QuadQ scientists, the future will require
cross-functional teams composed of technology, marketing, and
manufacturing people to design and produce the new solutions.
To summarize, you have three steps for creating high contrast:
1. Focus on the core 20% of what is different.
2. Enhance (even slightly exaggerate) the simple descriptions
between the old and new.
3. Create visual images, or pictures, of the old and new so that
the contrast is understood as more than mere words.
Creating Confrontation
Clearly, pointing out contrasts between the old and new is a crit-
ical first step to change. However, to avoid the “I get it” mistake,
Old Map
New Map
Individual Design Process Analog, stand-alone boxes Sophisticated Users
Unsophisticated Users Digital, integrated solutions Team Design Process
EXHIBIT 3-4QuadQ‘s strategic contrast maps.

Chapter 3 • The Keys to Seeing 55
pointing these contrasts out just once is not enough. Twice is not
enough. To ensure a high level of confrontation, you will likely
have to present the contrasts repeatedly so employees don’t view
them as “one-time passing parades” that they can simply wait
out. For example, remember the Australian map of the world
from Chapter 2? Let’s look at it one more time.
When viewing the map this time (if you’re not Australian), did a
small voice inside your head still say, “That’s upside down”? If so,
consider yourself quite normal. Now imagine how much exposure
to this map it would take to get rid of that voice in your head—to
completely eliminate it. That’s why repetition becomes so impor-
tant when trying to change mental maps. But just how many rep-
etitions are enough as you try to initiate change at work?
Unfortunately, we know of no scientific studies that answer this
question. From our observations and conversations with sea-
soned executives, though, employees need to hear the contrast
message clearly at least five or six times to ensure that they get it.
Repetition is a powerful, but certainly not the only, means of
ensuring high confrontation. An additional means is employing
what we call inescapable experiences. An inescapable experi-
ence has two dimensions. The first is (get ready for this) that it is
inescapable. By this we mean that it is hard for the individual to
mentally sidestep or ignore the experience or to physically walk
away from the experience. Second, the experience must be
(again get ready for this revelation) experiential. This may sound
redundant, but the experience cannot be just mental. It needs to
actively involve as many of the senses as possible: touch, smell,
sight, sound, taste. We know from a wide body of scientific litera-
ture that the more senses involved and the deeper their involve-
ment, the higher will be the impact of an experience—more is
learned, and more is retained.
Let’s return to QuadQ, Inc. As the CEO, you did a good job of
creating contrast, but you must also ensure effective confronta-

L e a d i n g S t r a t e g i c C h a n g e56
tion. The message must be repeated—probably more often than
you think necessary. In addition, you must create some inescap-
able experiences. How can you do this? You might borrow a page
from the CEO of Samsung Electronics.
Samsung is a giant conglomerate in Korea, and Samsung Electron-
ics is one of its key companies. Samsung Electronics is, by most
accounts, the leading consumer electronics company in Korea. It
has the largest market share and a premiere quality image. It was
used to operating in a certain way. Yet its operations and sales in
the United States were not going well at all. The CEO was con-
vinced that Samsung had to operate differently in that market
than at home, but the message was just not getting through to his
top managers in Korea. So the CEO created an inescapable expe-
rience. He put nearly 100 of the most senior executives on a
plane, and off they went to visit stores in the United States.
The contrasts were stark. Rather than being sold in small shops
as in Korea, electronics were sold in large stores in the United
States. Rather than getting prime merchandising space as they
did in Korea, Samsung products were in the bargain bin, back
behind leaders such as Sony, and even behind second-tier mak-
ers, such as GE. Samsung executives saw where their products
were displayed, rubbed their fingers across the dust on the prod-
ucts, heard customers talk excitedly about competitors’ product
features as they shopped, and tasted the envy in their mouths for
the position of market leaders such as Sony. Samsung was king
at home but not in the royal court in the United States.
Samsung executives could not escape the experience. It was
repeated essentially a dozen times as the group went from store
to store. They could not sidestep the experience because they
were physically put in the center of it. As a consequence, the
contrast finally had a deep impact.
As the CEO of QuadQ, you should do something similar. You
must create an inescapable experience. Simply talking about the

Chapter 3 • The Keys to Seeing 57
contrasts, even repeatedly, is not enough. What can you do?
Let’s take a look at the Samsung example for insights.
First, the primary objective of an inescapable experience is put-
ting people directly in front of the most important and forceful
aspects of the contrast. As a consequence, you must decide what
you want the experience to focus on. Just as there is the danger
of diluting the impact of contrast by allowing too much complex-
ity, so too can you dilute the impact of the confronting experi-
ence by making it too complex and unfocused. In the case of
Samsung, what was a core contrast that hit the executives right
between the eyes? It was the treatment of the product. To exag-
gerate, in Korea, Samsung’s products are held respectfully in
gloved hands when presented to consumers. In the United
States, they’re casually tossed into bargain bins with a sign above
reading “Clearance Sale!”
What is the key contrast that can hit QuadQ employees, espe-
cially the scientists, right between the eyes? Customers. QuadQ
scientists are used to interacting with other PhD scientists wear-
ing lab coats. QuadQ scientists are used to creating sophisti-
cated solutions for other lab coat-type customers. What would
happen, though, if you confronted your PhD scientists with a
new technician-type customer holding only an associate’s
degree, sporting purple hair, and wearing a nose ring? Then
what would happen if you sat that less formally educated cus-
tomer down to run diagnostics on your old analog products, and
your PhD research scientists were forced to listen to the cus-
tomer’s severe complaints about the products? The contrast—if
done with enough new-generation customers over a long enough
period of time—would be compelling and inescapable. The
resulting shock is precisely what your people need for you to
have a prayer of overcoming the strength of their old analog
map that has dominated the strategic path of success in your
firm for the last 40 years.

L e a d i n g S t r a t e g i c C h a n g e58
To summarize, two steps create high-impact confrontation.
1. Repeat the messages of the old and new maps over and
over and over again.
2. Create high-impact, inescapable confrontations.
a) Focus the experience on what you think are the core contrasts. Do not dilute it with too much complexity.
b) Make sure that the experience involves as many of the senses as possible. There are few effective substitutes for live, fully engaged action.
c) Physically ensure that people cannot easily avoid the experience but must take the brunt of it right between the eyes.
Pulling It All TogetherContrast and confrontation—these two keys break through the
first brain barrier and conquer the failure to see. Although we
may not have said it explicitly, you no doubt have sensed that
changing entrenched mental maps requires a serious shock to
the system. In closing, let us make that point clear and unmis-
takable. The longer a given mental map has been in place and
the more successful it has been, the greater will be the shock
needed to break free from it.
As evidence of this, consider some personal, managerial maps,
rather than organizational maps. Most managers grow up in a
given country and culture, be that Germany, Australia, Japan, or
India. They develop managerial maps of how to communicate,
motivate, correct, praise, confront, and direct people success-
fully. This generally works fine until, as a senior leader in most
companies today, you must interact effectively with people
across multiple countries and cultures—i.e., global leadership.
Recently, we conducted a study along with a colleague, Allen

Chapter 3 • The Keys to Seeing 59
Morrison, looking at what experiences helped people develop
global leadership capabilities. When we asked over 130 senior
executives from 55 different companies across Europe, North
America, and Asia what the most important and influential expe-
rience was in helping them develop global leadership capabili-
ties, 80% gave the exact same answer. Given the diversity of
these executives (different nationalities, job histories, industries,
etc.), this is amazingly high agreement. Eight of ten executives
said an international assignment was the most influential career
experience they had. Why?
The following example provides the answer. Not long ago, we,
along with our colleague Allen Morrison, were on a trip to Japan
for an international management conference. Because one of our
trio, Stewart Black, had lived and worked in Japan before, he
decided to take the other two to a traditional Japanese restaurant
for dinner. Being the interculturally sensitive guy that he is, he
gave the other two a “briefing” about the restaurant and proper
etiquette before going in. He explained that most traditional Japa-
nese restaurants have a similar entry. It consists of a thin wood
and glass sliding door with an entry area on the other side. The
runners at the bottom of the door, along which it slides, are made
of wood and typically not recessed; consequently, he warned the
other two that they would need to step carefully over them as
they entered the restaurant. He then mentioned that they would
be in a small alcove called a genkan and that they would remove
their shoes before stepping up into the restaurant proper.
Once they found what looked like a nice, traditional restaurant,
Stewart opened the sliding door and carefully stepped inside.
Allen, who is about the same height as Stewart, followed, also
being sure to step over the door runner. The next thing anyone
knew, there was a thunderous crash at the entry that reverber-
ated throughout the entire restaurant. Everyone inside turned to
see what had happened; some customers thought an earthquake

L e a d i n g S t r a t e g i c C h a n g e60
had started. As everyone looked to the restaurant entry, they
saw Hal staggering in the doorway with a trickle of blood running
down his forehead. Hal, on seeing his two colleagues negotiate
the entry so easily, had tried to step quickly through the door.
However, Hal, who is just over 6’5”, smashed his head on the top
of the door frame. The impact nearly knocked Hal out.
The most interesting part of this story is that the next day, when
the trio went to another traditional Japanese restaurant, the
exact same thing happened. Now Hal had twin bumps on his
head. It wasn’t until the third time that Hal remembered to duck
as he entered. It took getting smacked hard in the head—twice—
for Hal to rearrange his mental map about what it takes for him
to enter a traditional Japanese restaurant successfully.
Most of us are like Hal. It takes getting smacked hard in the head,
probably more than once, before we are ready to rearrange what
is in our heads—our mental maps. Hard knocks to the head are
not always pleasant—in fact, they hurt—but they are necessary.
International assignments, unlike short trips, almost always
result in some serious smacks to the head. We are confronted on
a daily basis with managerial situations in which our old maps do
not work. Because we cannot easily hide out in our hotel rooms
for three years, we eventually smack our heads—hard and usu-
ally repeatedly. This head smacking is what caused the global
leaders we interviewed to change their managerial mental maps.
And this is why eight of ten touted an international assignment
as the most important developmental experience in their careers
and their development as global leaders.
The point is not that everyone should go on an international
assignment (though if you want to be a global leader, you may
need to). Rather, the point is to illustrate that a smack in the
head with contrast and confrontation is often needed to dislodge
entrenched mental maps. These smacks are what help us see

Chapter 3 • The Keys to Seeing 61
that our mental maps have limits and to deal with shifts in the
environment; we must stretch and rearrange our maps—as pain-
ful as that might be.


63
CH
AP
TE
R 4 Brain Barrier #2: Failure to Move

L e a d i n g S t r a t e g i c C h a n g e64
In the previous chapter, we voted you in as CEO of
QuadQ, Inc., the signal processing firm. We now want to return
you to that role. Recall that your products primarily go to the
health care industry, and in the past, they were used by scien-
tific and hospital researchers in diagnostic tests, as well as cellu-
lar and blood chemical analysis. Your analog technology has
defined the leading edge for years. However, the leading-edge
technology has shifted from analog to digital, the market from
sophisticated customers to technicians, and products from
stand-alone boxes to integrated solutions.
Finally, after two separate task forces are formed and indepen-
dently craft the conclusions mentioned above, most technical
and scientific personnel in your firm capitulate. They throw
their arms up and exclaim, “Digital signal processors are the
future.” Their old mental maps of how the world works are bro-
ken. Your matrix, your pictures, and even your customer experi-
ence all produced their intended effect. You even polished your
vision speech:
Folks, we are facing a brave new world. Technology is shift-
ing from analog to digital signal processing. Our strategy and
competitive advantage have always been and will remain our
leading-edge technology. We must embrace this new technol-
ogy. In addition, our customers are shifting from hospitals,
sophisticated doctors, and research scientists to clinics and
technicians. With this shift in customers, our products must
become more “user friendly” and simpler to operate. Fur-
thermore, we cannot afford simply to make boxes. We must
provide more integrated solutions. To accomplish this, we
must work more in teams. We need R&D, engineering, mar-
keting, and sales to work in cross-functional teams so that
we fully incorporate changing customer needs into the
design of our products from the start. In addition, speed to
market will be critical to our future success, which will

Chapter 4 • Brain Barrier #2 65
require greater coordination and cooperation across various
departments. Simpler, speedier solutions! This is the vision!
You hired a consultant. (Oops, that may be a mistake. Hope you
hired the right one.) You followed this book’s advice (good
move), and you communicated, communicated, and communi-
cated the vision—the new map. You sent out e-mails; you made a
couple of short videos for broadcast during lunches in the com-
pany dining room; you made several PowerPoint presentations
to different groups and departments. You kept your message con-
sistent and concise.
Now you sit back and wait to see what you view as the inevitable
change within your company. You wait and you wait and you
wait. Nothing changes; no one moves. What’s going on?
You’re perplexed. If they see that the old right thing is now wrong
and that digital signal processing is the future, why aren’t they
moving in that direction? You just don’t get it. After all, you read
the first few chapters of this book and followed our advice. You
broke through the first brain barrier. People see that the old right
things are now wrong. Why aren’t they moving?
People now not only see that the old right thing is wrong, but
they also have a clear idea of what the new right thing is, right?
You have made the vision clear. Oddly, you begin to feel as
though the clearer you make the vision and the more you repeat
it, the more resistance to movement you begin to feel.
This illustrates the continued gravitational force against change
and the second brain barrier—failure to move. For most people
we talk with, the first brain barrier makes more intuitive sense
than the second. Most people understand quite easily that if
people don’t see the need for change, they are unlikely to
change. But if people begin to see the need for change, why
would they fail to move? After all, not jumping out of the way of
a truck heading right for you because you didn’t see it is one

L e a d i n g S t r a t e g i c C h a n g e66
thing. But failing to move after you see the truck bearing down
on you is quite another. Are people who see but still fail to move
just plain dumb?
Smart People don’t Try New TricksIn our experience, people who fail to move even after they see
the need are smart, not dumb. To understand clearly why they
fail to move even when they see the need and why this is smart,
not dumb, we need to break the second barrier into two parts.
The first part involves the distinction between seeing that the old
right thing is now wrong and seeing the new right thing. The first
does not necessarily lead to the second. That is, just because
someone finally capitulates and admits that the old right thing is
wrong does not mean that they see the new right thing. Because
of this, people will fail to move if the new right thing is not clear.
Consider Xerox. It has had a history of doing the right thing well.
Early in its history, it focused on making copiers for businesses.
They were big and expensive, and they made the company tons
of money. Unfortunately for Xerox, the environment shifted. The
right thing ended up being the wrong thing. For example, Canon
came along and introduced the personal copier for a price that
was one-tenth the cost of Xerox’s low-end machines. At first,
Xerox denied the shift in the market until it was almost too late.
Xerox viewed personal copiers as a novelty item instead of a seri-
ous business line. Early on, the company even refused to leverage
a personal copier created by its joint venture in Japan with Fuji
(FujiXerox). Finally, Xerox responded and regained a respectable
position in the personal copier segment. Yet in the mid-1990s,
Xerox once again faced the challenge of strategic change.
To tackle this transformation, Rick Thoman—a key player in
IBM’s dramatic turnaround—was brought onboard to lead the

Chapter 4 • Brain Barrier #2 67
transformation. When he came to Xerox, he laid out a principal
vision that was quite similar to the vision that successfully trans-
formed IBM in the early 1990s—a new strategic map that pro-
pelled IBM’s stock price from nearly $40 to $200 (split adjusted).
IBM’s vision demanded solutions (not just boxes) for customers
through global ISUs (industry solution units). The fundamental
notion at IBM was that customer solutions within a given indus-
try would be more similar than solutions across industries. In
other words, a solution for Citigroup would be more similar to a
solution for Bank of Tokyo-Mitsubishi than a solution for Exxon-
Mobil. IBM determined that firms’ needs within a given industry
(such as banks) were more similar to each other than they were
to firms in other industries.
IBM’s strategy and structure were designed not just to make
sense, but also to make money. The view was that if IBM could
utilize 50–70% of a solution it had created for Citigroup for Bank
of Tokyo-Mitsubishi as well, it could extract significant margins.
After all, Citigroup would have already paid full price for the
solution IBM developed for it. IBM would then charge Bank of
Tokyo-Mitsubishi full price, but in one sense, part of the solution
for Bank of Tokyo-Mitsubishi would have already paid for. In
many ways, the new strategy and structure worked wonderfully,
and as we mentioned earlier “services” became a major source of
IBM’s revenue and profit growth during the mid- to late1990s.
As the new CEO, Thoman delivered a similar vision to Xerox.
Customers needed document solutions, not just copiers. Cus-
tomers grouped by industry would have more similar needs and,
therefore, require more similar solutions than customers
grouped by geography (territories) as in the past. This consti-
tuted the new strategic map for a new Xerox.
However, the mental maps for many Xerox employees were radi-
cally different. Xerox sales and service organizations had been
organized largely by geographic territory. As a consequence,

L e a d i n g S t r a t e g i c C h a n g e68
Xerox sales people knew customers within their sales territory
well, regardless of what industry they were in. Yet, as deteriorat-
ing financial results mounted and Xerox stock price dropped into
a near free fall, evidence piled up that the old way was just not
right anymore. Thus, the old “geographic sales” and “copiers”
strategic maps began to crumble, making way for a new “docu-
ment solutions” map.
Still, people within Xerox failed to change. Why? Why did people
fail to move when it became crystal clear that what used to work
in the past didn’t work at all in the present? As we already men-
tioned, remember that, even if we see that the old right thing no
longer works, we still don’t move if the new map with its destina-
tion and path is not clear. After all, how reasonable is it to ven-
ture out into the dark and unknown just because it feels a bit
uncomfortable where you are sitting today? And as strange as it
may seem, even if we cannot deny that the old right thing is now
wrong, when lacking a new right direction, we often simply
intensify our efforts at doing what we do know.
Terrific. But Rick Thoman did deliver his new vision for Xerox. He
presented the vision, strategy, and new structure clearly and
repeatedly to Xerox employees. Yet in this case (and many others
that we have witnessed), people still failed to move. In fact, people
so dramatically failed to move at Xerox that Thoman was forced
out of the company less than two years after assuming the helm.
To understand in the real case of Xerox and in the fictional case
of QuadQ, let’s take a minute to recap. First, we pointed out that,
even when people see that the old right thing is now wrong, they
fail to move if they do not see the new right thing. This makes
sense and is one reason why everyone talks about “articulating
the new vision.” However, in the case of Xerox as well as QuadQ,
the new vision was not only articulated but repeated. So why,
even when people finally acknowledge the need for change and
see the new direction, do people often still fail to move.

Chapter 4 • Brain Barrier #2 69
Of the two parts, the second is clearly the most perplexing. After
all, it is one thing for people to fail to move if they recognize the
need but are not given a new direction to march in, but it is quite
another for people to fail to move even after the new vision is
clearly presented and understood.
But the most perplexing and paradoxical thing we have consis-
tently observed is that quite often the clearer the new vision, the
more immobilized employees become. How can this be? We just
argued in the previous two chapters that leaders must create in
people a recognized need for change, then show them the new
direction. How can it be that often—actually, all too often—the
clearer the vision and new strategic map, the more immobilized
people become?
Our experience tells us that this happens because people are
smart. So how can not moving be smart, even when it is clear
that the old right thing is now wrong and the new right thing is
brilliantly illuminated? It is smart because people recognize that
there are two sides to the story. The first side focuses on the
“right thing” and the “wrong thing.” The second emphasizes
“doing it well” and “doing it poorly” (see Exhibit 4-1).
People recognize that they cannot go directly from doing the
wrong thing well to doing the new right thing well. They under-
stand that they will go from doing the wrong thing well to doing
the right thing poorly. Given this brilliant insight, imagine from
their perspective how silly a leader shouting for change might
seem. Essentially, from their perspective, the leader is saying,
“Follow me and you will do the right thing and you will do it
poorly!” How appealing is that? Yet even if the leader has no
intention of communicating this message, people know that is
exactly what is going to happen. They are so smart that, even if
you don’t see it or even if you try to hide it, they are not fooled.
No one expects to be instantly great at something they have not
done before. This is part of the reason that we don’t take up new

L e a d i n g S t r a t e g i c C h a n g e70
languages, sports, musical instruments, and so on with greater
frequency. Most of us do not like to be bad at something, espe-
cially if we are already good at something else.
That is why, for most people, going from being competent to
incompetent is a very unappealing proposition. Ironically, this is
also why the clearer the vision of the new right thing, the more
immobilized people often become. The clearer the new vision,
the easier it is for people to see all the specific ways in which
they will be incompetent and look stupid—ways that they will do
the right thing and do it horribly.
For example, let’s once again return to the case in which you are
the CEO of our signal processing company, QuadQ, Inc. At first,
the company’s performance began to deteriorate because people
were trapped in old mental maps of success. As evidence
mounted and you provided the needed contrast and confronta-
Right Thing Wrong Thing
DoneWell
DonePoorly
Old right thing becomes wrong
Can’t instantly be good at the new right thing
EXHIBIT 4-1Strategic change matrix: Breaking through the movement barrier.

Chapter 4 • Brain Barrier #2 71
tion, employees began to see that the old right thing was not
right any more. Even with this recognition, though, they failed to
move at first because they could not see what new direction to
move in—the future vision was not clear. This makes sense. No
one wants to take a walk in the dark. Then you clearly illumi-
nated the future vision and map. Yet the more clarity you added,
the easier it was for people to see and anticipate (because they
are smart) what they were going to soon be terrible at.
Consider the scientists and engineers in the firm who had made
their careers in analog technology. As the digital future became
clearer, so did their visions of their future incompetence. As
readers with backgrounds or exposure to these two disciplines
know, moving from analog to digital as a scientist or engineer is
not an overnight process. In many ways, it is like having learned
Chinese, then being told to pick up Greek over a long weekend.
Yes, both are languages, and having learned one, you may have
developed some general language-learning capabilities, but
learning Greek from a Chinese base is almost like starting over.
In fact, the clearer the differences between the Chinese you
know and the Greek that you do not, the easier it is for you to
anticipate how difficult it will be to learn Greek and how bad you
will be at speaking it. You can easily imagine how many mistakes
of grammar, pronunciation, usage, and so on you will make. You
can see a movie in your mind’s eye about how stupid you will
look. The clearer the images of how dumb you will look making
these mistakes, the less you want to move toward learning
Greek. Back at QuadQ, the more the scientists and engineers
saw that digital signal processors were the future, the more they
saw how bad they were going to be and how incompetent they
were going to look.
The same dynamic applies to many other aspects of the new
vision. Your scientists and engineers had made their careers
through technical brilliance as star individuals. In fact, knowl-
edge or understanding of “inferior” areas in the past, such as

L e a d i n g S t r a t e g i c C h a n g e72
marketing, was definitely a negative—not a positive. (By the
way, your QuadQ scientists didn’t even dignify areas such as
marketing or sales by calling them disciplines; they were func-
tions, not disciplines.) If working in cross-functional teams was
required for success in the future, some cross-functional under-
standing would also be required. What did these scientists know
about working in cross-functional teams? What did they even
know about working on technical teams that tried to deliver inte-
grated solutions? Nothing. How good at teams in general, and in
cross-functional teams in particular, were they going to be? Ter-
rible. The scientists and engineers could see this. The clearer
you made the vision, the more you repeated it, the easier it was
for your scientists to see how bad they would be. What did they
do? They resisted. Why? Because after a life devoted to being
brilliant, they did not want to look stupid.
The same dynamic was true at Xerox. The clearer the vision
about solutions and ISUs, the easier it was for sales people to see
how bad they were going to be. After all, what did they know
about delivering solutions? Nothing. What did they know about
working in industry-focused teams? Nothing. Consequently, how
good at it were they likely to be? Terrible. Because they were
smart, not dumb, they did not want to look or feel stupid. Add to
this mix a culture in which mistakes were often punished and
learning was rarely rewarded, and you must wonder who would
want to venture off into the land of certain incompetence and
probable punishment when they could stay in the home country
of demonstrated capabilities and peer respect? No one.
Some might argue that the vision, strategy, and structure that
Thoman brought to Xerox were wrong for the company, that
Thoman inappropriately just took what he knew and what had
worked at IBM and forced it on Xerox. Perhaps. It is hard to
know for sure. Many thought the vision, strategy, and structure
that Gerstner (with Thoman’s help) implemented at IBM were
wrong until they began to work. Perhaps those who thought the

Chapter 4 • Brain Barrier #2 73
vision, strategy, and structure that Thoman brought to Xerox
were wrong would be singing a different tune if they had deliv-
ered results. Our main point is that the vision might have
worked, had Xerox employees actually seen a path from doing
the right thing poorly to doing it well. In other words, many pre-
ferred to be competent at the wrong thing than incompetent at
the right thing. As long as they saw a future filled with doing the
right thing poorly, most employees were not inclined to move.
Our point is that movement was unlikely until employees plainly
saw a promising path to the promised land.
Although the details of creating a “promising path” is a key focus
of Chapter 5, the point we want to stress here is that people fail
to move even when they see the need because most will do just
about anything to avoid doing the new right thing and doing it
poorly. Not only do people need to see the new direction or desti-
nation, they must see and—more importantly—believe in a path
to take them from doing the right thing poorly to doing it well.
Without this prospect, many people prefer competence at the
wrong thing to incompetence at the right one.
As mentioned earlier, most change books and change consult-
ants harp on the need to provide a vision of the future—a new
direction or destination. We agree. Most of us are not too keen on
venturing out into the dark, especially if there is a safe light still
on where we are. On this point, we are reminded of the old joke
about a man who lost his ring. He searches madly for it, and
along comes a stranger asking, “What did you lose?” “My ring,”
he replies. “Where did you lose it?” asks the passerby. “Way over
there,” the man frantically answers. “Then why are you looking
here?” queries the intended helper. “Because this is where the
light is,” replies the hopeless searcher. In organizations, people
also stay where the light is, even when they recognize that it is
the wrong place. People often stick to what they are good at,
even when they see that it has become irrelevant.

L e a d i n g S t r a t e g i c C h a n g e74
Overcoming the Second Brain Barrier
To summarize, two keys make it possible to overcome gravity
and break through the second brain barrier to change. First,
even after we have helped people see that the old right thing is
now wrong and we have painted a picture of the new right thing,
that new map must have a clear destination or vision. The map
must answer the question, Where are we going? Yet this is not
enough. In fact, the clearer the answer to where we are going, in
many cases the greater will be the resistance to getting there
because people can now see how bad they will be at doing the
new right thing. Consequently, along with illuminating the new
right thing, we must create a belief in people that new Strategic
map includes a promising path that will guide them through
doing the right thing poorly to doing it very well.
It is this part of the second brain barrier that, in our experience,
receives far too little attention but is really responsible for most
resistance to change. Even if people see the new right thing, they
must also see a way to travel from doing the right thing poorly to
doing it well. How to paint inspiring and illuminating new
visions, as well as promising paths to the promised land, fills the
next chapter.
75
CH
AP
TE
R 5 The Keys to Moving: Destinations, Resources, and Rewards

L e a d i n g S t r a t e g i c C h a n g e76
When we last left you as CEO of QuadQ, you had suc-
cessfully created sufficient contrast and confrontation for people
to see that the old strategic map was just plain wrong, and you
had painted a clear picture of the new destination. However, the
clearer you made the vision, the more QuadQ’s people resisted
moving to make the change. After reading the previous chapter,
you now understand why. Your people know that traveling to the
new destination will require that they stop doing the wrong
thing quite competently and start doing the right thing quite
incompetently. Now they must not only see the new destination,
but you must help them believe in a path that will take them
from doing the right thing poorly to doing it well. Without this
fundamental belief in a path and their individual abilities to fol-
low it, your people will refuse to move—despite an obvious and
compelling destination.
BelievingHelping others to gain this belief requires three straightforward
steps:
1. Make sure others see the destination or target clearly.
2. Give them the skills, resources, and tools (the gear) to
reach the destination.
3. Deliver valuable rewards along the journey.
These steps emerge from one of the most tested and validated
theories in human psychology and management—expectancy
theory. Although we do not want to waste your time with the
detailed ins and outs of the theory, we mention it for two rea-
sons. First, what we present is not just our thoughts or opinions
but is supported by scores of published research studies. Second,
although we generated many ideas for this book, we do not want

Chapter 5 • The Keys to Moving 77
credit where it is not due. As PhD students, we studied under
one of the principal architects of expectancy theory. Put simply,
we know that expectancy theory is not our idea; yet it has pow-
erful application in overcoming the second gravitational force
and barrier to change—failure to move.
Step 1: Destination
Just imagine how motivated you are to shoot at an unclear target
or take off after a fuzzy destination. If the destination is not
clear, what is the chance of arriving there? If the chance of arriv-
ing is low, how high is your motivation to try? The answers to
these questions are obvious. If the direction and destination are
not clear, your motivation to move forward is nil. As a conse-
quence, it is no surprise that over 100 research studies have con-
firmed this.
What may surprise you is how often leaders think the new right
thing is crystal clear but subordinates report that both the direc-
tion and the destination are like a fog. If it is so critical (and
obvious) that they must be clear, why do leaders fail to make
them clear? Once again, are we brain dead or what? Our expla-
nation reverts to the “I get it” mistake. Precisely because we see
where we’re headed clearly, we think everyone else sees it as
clearly. What we must keep in mind is that seeing the destina-
tion clearly as leaders means absolutely nothing to followers.
The only thing that matters, the only thing that motivates our
employees, is whether they see it clearly.
Consequently, Step 1 is all about checking how clearly others see
where they are going. This assumes that we have tried to clarify
the destination. (And making that clear to ourselves as the lead-
ers of change is Step 0. If we haven’t done that, it’s time to start
over with Remedial Leadership 101—defining the destination.)
L e a d i n g S t r a t e g i c C h a n g e78
How do you do Step 1? How do you check to see how clearly oth-
ers see the new direction? You can’t use people’s resistance to
move as an indicator. As we have explained, people might not
move because where they need to go is not clear, but, ironically,
they might also resist moving because the destination is in fact
very clear. Consequently, people’s failure to move really gives
you no insight as to whether or not they see the destination
clearly. What, then, can you do? How can you determine
whether the destination looks clear or fuzzy to others?
The easiest way is to ask people to do what you have already
done. Here’s what we mean. As a leader, you have already pro-
duced verbal and visual images of the old and new strategic map.
Ask your people directly and indirectly to describe (or literally
draw) each key element of the new map. If they can’t do it, the
strategic map and its key components are not clear; people don’t
know where they are going.
If they can draw or articulate the old and new maps, take one
more step for travel insurance. Ask them what the new destina-
tion will require from them in terms of personal capabilities. If
the old map involved walking along the beach and the new one
requires trekking up a mountain, anyone who sees the difference
will surely recognize the need for boots on the mountain trek,
whereas bare feet might have been perfectly fine for the beach.
For example, the CEO of a large energy company laid out a new
strategic map that demanded a shift from independent and
autonomous business units to more interdependent and coordi-
nated units. If her vision was clear enough, company executives
should be able to communicate back to the CEO a solid grasp of
how all the firm’s value chain activities fit together and the
importance of effective conflict-resolution skills as required
capabilities for following the new strategic map successfully. If
the CEO’s direct reports can’t see some of these key capabilities
on their own, odds are that the target is not yet clear enough.

Chapter 5 • The Keys to Moving 79
Unlike the university professor who requires students simply to
regurgitate what they have heard, checking for understanding
pushes us to see whether others see the new map clearly enough
that they can describe it. If their description of the destination is
close enough to what’s in your mind, you can feel reasonably
comfortable that the direction and destination are adequately
clear to them.
For complete comfort though, people should not only describe
the destination, but should also speculate about its possible
implications. The point here is not to test whether the implica-
tions they see are identical to yours. Instead, the point is to
check and see whether others can see clearly enough where they
are going for them to perceive reasonable implications of the
next steps to take along the path of change.
Step 2: Resources
Once the destination is clear in employees’ minds, the key ques-
tion then becomes whether people believe they have what it
takes to walk the path and reach the promised-land. Scaling a
tall peak sounds great, unless you don’t believe you have the
necessary gear (ropes, boots, harnesses, etc.), the required skills,
or the mandated physical strength. Quite simply, if people
believe they really can walk the path and reach the destination,
they are much more motivated to try. If they do not believe, they
will not try. But once again, what idiot leader among us would
ask employees to scale a mountain for which they have neither
the necessary gear nor capabilities? By definition, if we give
them a mountain to climb, we believe they have what it takes to
make it.
Similar to Step 1, the key to Step 2 lies in realizing that our
assessments do not matter. In the final analysis, it is what
employees believe that counts. If they do not believe, they will

L e a d i n g S t r a t e g i c C h a n g e80
not try (or at least will not try very hard or for very long). If they
do believe, they will persist. Although we as leaders must make
our assessments as to what the required tools and capabilities
are, the real challenge centers on determining whether employ-
ees believe they possess what it takes and helping them to
believe if they do not.
A brief personal example is valuable here. Several years ago,
Stewart managed a consulting firm in Japan. In that position,
one of Stewart’s responsibilities was a new product launch. He
made the destination clear to the salesmen. They all clearly saw
the sales target. Stewart then put together a compelling reward
package. Salesmen saw the target clearly and wanted the prom-
ised rewards, yet the launch went nowhere—no sales prospects
emerged.
Why? In some private conversations after work, Stewart was told
that none of the salesmen had mentioned the new product to a
single client. Generally, no mention of the new product produces
no sales prospects. Why wasn’t the product mentioned? Because
the salesmen were adept at their jobs, they imagined how a sales
call might go—what they would say, what a client might ask, how
they would answer, etc. In so doing, they all saw that clients
might ask a few questions for which they did not have answers.
That would be embarrassing—which was unacceptable in a Japa-
nese context. To avoid potential embarrassment, the salesmen
simply avoided the situation by not mentioning the new product.
What was missing? The destination was clear. The rewards were
motivating. The salesmen had the selling capabilities. The
resource they lacked was a bit of knowledge required to answer
some tough questions. Stewart thought they had this knowledge.
(To be honest, he thought he had provided it in the sales meet-
ing—clearly a victim of the “I get it” trap.) Stewart did not check
to see that the salesmen believed they had the knowledge. All it
took was their believing that they did not have the resource (i.e.,
knowledge that would answer certain customer questions), and

Chapter 5 • The Keys to Moving 81
they didn’t even attempt to make the trip down this new product
path, despite it being clear and highly rewarded.
How do you determine whether people who believe in the path
also believe that they can follow it with success? Clearly, the first
step requires a determination of what the critical resources are. If
the future path to company success is integrated customer solu-
tions, for example, you must determine what core capabilities are
required to walk that path successfully. If integrated solutions
demand effective cross-functional teamwork, people must believe
they have those capabilities. Keep in mind that the clearer the
path, the easier it is for people to see what is required to walk it
successfully and, therefore, the easier it is to decide whether they
have or lack the gear or capabilities to follow the path. If they
don’t believe they possess them, they stay put.
The first move down the path regarding resources is determining
what you believe are the resources required to arrive at the new
destination. The next move is assessing whether employees
believe they have the required resources (skills, knowledge, tools,
manpower, etc.). The third move is providing any missing required
resources, including building capabilities in your people—if they
do not currently have them. This may take substantial training,
education, experience, mentoring, coaching, or any number of
other techniques to generate the essential capabilities for master-
ing the new right things required in your change initiative.
In summary, regarding resources, employees essentially ask the
question, If I try, can I do it? If the answer is no (no matter how
clear the target), people will fail to move. They need to believe
they have the right resources—the skills, knowledge, hardware,
software, tools, manpower, capabilities, etc.—to do make the trek.
Step 3: Rewards
Step 1 ensured that the destination is clear in employees’ minds,
and Step 2 formed a belief in employees that they had the

L e a d i n g S t r a t e g i c C h a n g e82
resources to walk the path and reach the promised-land. Now
Step 3 relies on the most overused and, as a result, the most
familiar aspect of getting people to move—reward. All of us know
the power of rewards in motivating and moving people. In any
change initiative, employees will believe in the path that leads
from doing the right thing poorly to doing it well in part if they
believe that walking the path will be rewarding.
When we think of reward, many of us think of money. No ques-
tion, money can motivate employees. However, it is not the only
motivating reward, and it is not nearly as powerful as we often
suppose. To put money in its proper place as a reward, we must
appreciate two important things.
First, money often represents a means to something else that
people care about. Money buys a new car when the old one
breaks down. Money also buys a new car that can boost one’s
ego. Money buys a college education for a child. Money buys a
vacation to take a break from earning more money. For many
people, money is a necessary means to what they truly value—
security, ego, status, friendship, health, fun. However, as we dis-
cover what people really care about, we may also identify alter-
native means (instead of money) to fulfill those needs. For
example, employees who are driven by status may find a visible
assignment much more rewarding than money. For people who
really value fun, a company party may deliver the goods. The
point is that many things matter much more to people than
money, and money is often just a means to what really matters
to them, anyway. If we can identify what others truly desire, we
may well take a different (and often more direct) route to help
them fulfill it.
The second thing to keep in mind about money is that its effects
are often much less powerful than we believe. For example, a
yearly bonus (if it is large enough) can be a very powerful incen-

Chapter 5 • The Keys to Moving 83
tive for most people. Yet if the daily reinforcement employees
receive from peers and leaders contradicts the incentive scheme
underlying the yearly bonus, which reward will exert more
power? You may find it surprising, but research has clearly
established that, in most cases, the immediate and repeated
reinforcements people receive are much more powerful than
once-yearly bonuses. The point here is not to abolish annual
bonuses but simply to recognize that bonuses paid out more fre-
quently, along with daily praise, recognition, compliments, and
so on, are much more compelling reinforcements than once-
yearly experiences.
How do you figure out what people really value? Do you just go
up to them and ask, “Hey, what do you really value? Tell me so
that I can put it in place and make sure that you believe in this
new destination and actually start moving?” Of course you don’t.
Although we think we have a framework to help you investigate
what people value, there is no shortcut or “one-minute” solution
here. People are not human vending machines with personal val-
ues prominently displayed for any prospective bidder inserting
the right coins and pushing the right buttons. Instead, to dis-
cover what others deeply value and care about demands signifi-
cant time and sincere effort. Period.
People can value almost anything. If you used the process of
elimination, it might take decades to eliminate all the secondary
and tertiary values and zero in on a person’s core values. If you
want to come in out of the cold to understand others’ motiva-
tion, consider the ARCTIC approach (achievement, relations,
conceptual/thinking, improvement, and control).
The ARCTIC approach encompasses major categories of values
(some scholars call them needs) that people exhibit from a moti-
vational perspective. Each one has two related sub-dimensions,
as summarized in the following:

L e a d i n g S t r a t e g i c C h a n g e84
Achievement.
� Accomplishment: The need to meet or beat goals, to do bet-
ter in the future than one has done in the past.
� Competition: The need to compare one’s performance with
that of others and do better than others do.
Relations.
� Approval: The need to be appreciated and recognized by
others.
� Belonging: The need to feel a part of and accepted by the
group.
Conceptual/Thinking.
� Problem Solving: The need to confront problems and create
answers.
� Coordination: The need to relate pieces and integrate them
into a whole.
Improvement.
� Growth: The need to feel continued improvement and
growth as a person, not just improved results.
� Exploration: The need to move into unknown territory for
discovery.
Control.
� Competence: The need to feel personally capable and com-
petent.
� Influence: The need to influence others’ opinions and
actions.
Although we may all exhibit these needs or values to some
extent or another, research clearly demonstrates, and no doubt
Chapter 5 • The Keys to Moving 85
your own personal experience verifies, that the strength of these
needs varies from person to person. Why they vary is the subject
of countless books and debates. That question is really not rele-
vant here. What is important is that if we want to move people to
a new destination, we must ensure that the prize for following
the new path is motivating to each individual.
Consider just one short sentence uttered by Stewart and see
whether you can zero in on what motivates him. As the 2002
Winter Olympics approached, Stewart commented, “Well at least
I can still out-ski both my older boys [ages 19 and 14].” Using
the ARCTIC framework, what motivates Stewart? If you look
back through the list, one item jumps out more than the oth-
ers—achievement and, in particular, competition. The point
here is that listening carefully to others provides a constant
stream of clues as to what they really care about and, therefore,
what you can use to really motivate them.
For some, the motivating prize is an opportunity to explore. For
others, highlighting exploration would simply paralyze them
with fear, and instead, we might stress the personal growth
opportunities that a new path presents. The key is listening and
identifying the most powerful motivators for a given individual.
Astute readers who face large-scale change initiatives will no
doubt be thinking, “This is all well and good, but I have hun-
dreds of people I need to get moving. I can’t afford to get to
know them all and provide customized, individual rewards.”
Moving many people at once is a challenge, but our point is that
if you cannot get individuals moving, the masses won’t, either.
The trick is to cascade this individualization of understanding
and reward customization down the organization. You learn
what your people really value and customize the prizes you pass
out for following the path to change. Then your direct delegates
do the same and customize rewards for their people, and so on
down the line.

L e a d i n g S t r a t e g i c C h a n g e86
By the way, the higher you are in your organization, being able
to motivate individuals actually becomes even more important
in making change happen. Here’s why. Typically, the higher we
ascend in the organizational hierarchy, the more convinced we
often become of our power and authority. After all, as CEOs or
senior executives, when we call people, they get right back to
us; people change calendars to meet our schedule; when we
shout “Jump!” people ask “How high?” on the way up. However,
keep in mind that the higher you go up the organization, the
more people outnumber you down the organization. No matter
what you declare to shareholders or the media about a marvel-
ous new strategic initiative, if all those people below you don’t
move individually, the entire organization doesn’t move, either,
and then you are left with unfulfilled promises and disappointed
shareholders.
Pulling It All Together
Successfully getting people to move encompasses several key
points. First, people fail to see the need for change because the
mental maps already in their heads blind them. If you can’t
change these maps, change goes nowhere. However, even if you
get people to recognize that what was once right is now wrong,
they still may not move. In other words, although overcoming
the initial force of gravity and breaking through the first barrier
to change is necessary, it is not sufficient. Change initiatives can
and often do fail because people fail to move, even when they see
the need. And they fail to move because they do not see or
believe in (1) the new path, (2) their ability to walk it, or (3) the
rewarding outcomes of the journey and destination. Conse-
quently, they prefer sticking with competence at doing the
wrong thing in lieu of incompetence at doing the right one.

Chapter 5 • The Keys to Moving 87
For people to really get moving, they must clearly see in their
own minds—not yours—where they are going. They must
believe they have the required resources to walk the path and
reach the promised-land. And they must believe that outcomes
they value will result from following the path outlined by the
new map and reaching the destination. The key thing to remem-
ber here is that their belief that all three components are in
place counts—not yours. If they don’t see it and believe it, noth-
ing else really matters.
We wish this were the end of the story, but it isn’t, quite yet. In
the next chapter we examine why, despite seeing and believing,
many people still fail to finish the task of change.


89
CH
AP
TE
R 6 Brain Barrier #3: Failure to Finish

L e a d i n g S t r a t e g i c C h a n g e90
Returning to our flight metaphor, at this point, you have
pushed the throttle forward, and your hundred-ton strategic
change project begins to lumber down the runway. You build up
speed until you reach the point where people recognize that the
old right thing is now wrong. You continue to build momentum
until you pass the critical point where you need more runway to
stop than to take off. People now see what the new right thing is.
You celebrate a little; you have overcome the initial gravitational
forces and broken through the first barrier of change.
As you continue down the runway, your airspeed climbs until
you reach that magical point of “rotation,” where the plane’s
speed is sufficient to pull back on the wheel and lift the nose up.
Then the friction and noise of the tires on the tarmac disappear
as you break free from the earth. Now people not only see the
new right thing, but they believe in the path that will enable
them to go from doing the new right thing poorly to doing it well.
You celebrate a bit more; you have broken through the second
barrier of change. You are airborne.
Given all the energy it takes to get off the ground, it should be
smooth flying from here, right? By some rules of fairness, it
should be, but anyone with any experience in leading strategic
change knows that some of the toughest aspects of change are
yet to come. Like a plane, where dashing down the runway and
then lifting off are necessary for flight, all it takes is a bit of a
throttle back on the power, and the plane will come crashing
back to the ground. Despite breaking the bonds of earth, gravity
still exerts its invisible power, waiting for the opportunity to pull
flights of fancy back into its crushing embrace.
Thus, even after overcoming the initial force of gravity and
breaking through the first two barriers of change—i.e., failure to
see and failure to move—the third brain barrier remains: the
failure to finish. This force silently, patiently, and persistently
waits for any opportunity to demonstrate its ruining power. Con-

Chapter 6 • Brain Barrier #3 91
sequently, successful change must also overcome the third bar-
rier of failure to finish—not going far or fast enough.
Whether the focus of the transformation is on quality, innovation,
customer service, speed, or globalization, the full impact and ben-
efits of the “organizational” change cannot be realized until the
majority of “individuals” change. Quite simply, new transforma-
tional strategies do not make a difference until people think and
act differently. Historically, as we have already pointed out, people
do not change easily or quickly. When you have an organizational
change that involves thousands of individuals, it is impossible to
implement the change overnight; instead, it takes months and
months, if not years. It takes time for the desired changes to ripple
through the organization. As a consequence of this time lag, there
is a significant risk that people will get tired and lost during the
interim. These are the two principal forces that hold organizations
back from moving fast enough or going far enough in their
change—people getting tired and people getting lost.
Getting TiredPeople get tired because organizational transformation is funda-
mentally not about transforming the organization; it is about
transforming the people who work in it. Certain aspects of the
organization—its strategy, structure, or systems—can and often
need to be transformed. However, have you ever seen a transfor-
mational strategy make a long-term difference when the individ-
uals in the company did not have to transform their thinking and
behavior? Have you ever seen a new structure work when the
people in that structure did not change their thoughts and
actions? The answer is no. The “rubber” of change meets the
“road” of results in people’s behaviors. If the people themselves
don’t change, the wheels spin, and the strategic initiative gets
zero traction.

L e a d i n g S t r a t e g i c C h a n g e92
For example, an airline can decide that its new strategy and cul-
ture will focus on putting the customer first, as British Airlines
(BA) did a few years ago. BA even implemented a program called
Customer 1st. BA can create a new mission statement; it can put
out a thousand press releases; it can put up a million Customer
1st banners in airports all around the world; but customers expe-
rience and respond to the change only when ticket agents, reser-
vation agents, flight attendants, ground personnel, etc. actually
put the customer first. Until then, it is all just corporate peacock
feathers.
This is not to say that organizational elements, such as incen-
tives or information systems, do not have an impact on people
and their behaviors. Clearly, they can and do. For example, peo-
ple act on the information they have, so information systems
matter because of the type, quality, and speed of information
they deliver to people. The point is not to say that systems do
not matter. Rather, in the final analysis, what really matters in
organizational transformations is the change in people’s behav-
iors and how systems either enhance or detract from that.
Unfortunately, too often this simple fundamental is forgotten, or
at least temporarily lost, in the system focus of the moment. In
one sense, this is understandable. How can a senior executive
reach out and change 100,000 employees? How can a depart-
ment manager reach out and transform even 40 people? It is
hard to conceive of changing individuals, so we naturally reach
out and try to pull one or two organizational levers, which we
hope in turn will change the individuals. We reach out for the
incentive lever or the organizational structure lever. We do this
for a good reason. These levers do have an impact on people.
Unfortunately, far too often their impact is less than we imagine
or hope.
Over the last 50 years, research has consistently demonstrated
that, to employees, organizational elements such as strategy,
Chapter 6 • Brain Barrier #3 93
structure, or even compensation and incentive systems are
abstract and remote. In contrast, the example they see in their
bosses, the reinforcement they get from their peers, or the pun-
ishment they get from customers is much closer—it is “proxi-
mate,” in academic speak. Research further demonstrates that
proximate factors drive people’s behaviors significantly more
than do distant factors.
This is one of the reasons why transformation levers such as
“reorganization” do not produce the results most executives
hope for. This disappointment and our inability to see the limita-
tions of new organizational charts in transforming people are
partly why we see reorganization after reorganization. In many
firms, it looks as though executives never graduated from the
childhood game of musical chairs. These executives seem to
have forgotten (or perhaps never really understood) that a new
organizational chart has an impact only when individual people
on the charts behave differently. If the boxes and reporting lines
change but the attitudes and behaviors remain, so do the results.
But just to make sure that there is no misunderstanding, let us
say again that changing strategies, structures, or systems is
important to transformations. However, they are not the trans-
formation. At best, they are catalysts and facilitators. The prob-
lem is that, in too many cases, executives view these valuable
means as the ends. Once the strategy, structure, or system is
changed, they think the job is done and that “the rest will natu-
rally happen.” Nothing could be further from the truth. The crux
of success or, in other words, the key to overcoming the failure
to finish, lies in changing a large number of individuals, not in
pulling organizational levers.
Unfortunately, changing individuals is not easy, especially if the
change required is dramatic. Gravity is a powerful opponent.
Consider that a plane flying across the Atlantic Ocean will burn
one-third of its fuel just taking off and getting to cruise altitude.

L e a d i n g S t r a t e g i c C h a n g e94
Changing people is no different. Tremendous energy and effort
are required to get people to change.
As we discussed earlier in the book, people are programmed to
survive and, as a consequence, naturally stick with what has
worked, what has proven successful. Most people do not walk by
faith. Most people wisely live by the philosophy of seeing is
believing. If they did not, they would follow any wild, unproven,
idiotic idea that came along. In fact, many employees believe
that to be what is wrong with senior managers. Employees call it
management by best seller. Too many managers simply grab
onto the latest best-selling idea without really knowing whether
it will work.
Employees are wise to walk in the proven paths of successful
maps. In that wisdom, they resist changes based on whims; they
believe in and stick with what they have seen work with their
own eyes. The gravity and pull of their previous ways of thinking
and behaving exert a constant and massive force. In contrast, to
employees, a new destination and path seem to require letting go
of gravity, floating in the air, and walking by faith. For most, faith
is not an easy concept. As evidence, just ask any clergy, priest,
pastor, monk, or rabbi. Trying to get at least some people to
change from “seeing is believing” to “believing is seeing” is hard
work. A mission statement does not do it. A new organizational
chart will not cut it. Faith is not about words or boxes and lines.
Faith is about trust.
Employees ask themselves, “Do I trust the promised outcomes?
Do I trust my own ability to behave in new ways and achieve the
desired results? Do I trust that if I put in all this time and effort
to walk this path, the rug will not be yanked out from under me,
and a new strategy, structure, and system will be announced just
as I’m getting the hang of things?”
If you are trying to get employees to think and behave differ-
ently, their willingness initially to walk by faith is a function of

Chapter 6 • Brain Barrier #3 95
how much they trust you. If they trust you, they will venture
forth. If they do not, they will not.
Although this is true, it is beginning to sound a bit philosophical,
so let’s bring it down to a concrete and practical level. Consider
the case of an airline gate agent, Sam, working for Your Average
Airline (YAA). As the name implies, YAA is not bad but is not
particularly good at customer service. However, the new CEO
has announced that YAA plans to win the competitive battle by
putting the customer first. He even names the new strategy and
change program Customer 1st. (The CEO did this, of course,
after making sure that BA had not trademarked the phrase.)
Sam listens to the CEO’s presentation about why treating cus-
tomers badly destroys loyalty and hurts organizational perfor-
mance. Sam pays careful attention to the arguments about why
putting the customer first will differentiate YAA and lead custom-
ers to fly YAA more often. He even listens closely enough to see
that with more loyal customers and higher occupancy (load fac-
tors in the CEO’s lingo), the company will make more money,
and as a consequence, Sam will have a more secure and brighter
future. Sam begins to accept the new map and destination—the
land of Customer 1st. He begins to alter his mental terrain.
YAA’s new CEO, being brighter than most, presents a clear pic-
ture not only for why putting the customer first is a great idea,
but also for how Sam can achieve it. He is provided the required
resources. Sam is given training about how to handle customer
complaints at the gate and how to speak in a tone that comes
across more pleasantly to customers. The path to the land of
Customer 1st begins to come into clearer focus. Sam begins to
see not only the destination, but also the path that could lead
there. Why doesn’t Sam at this point just take off running down
the path without a moment’s reflection in his rearview mirror?
Sam, like all workers, is smart. He does not act on simple blind
faith. Instead, he acts on what he believes will give him the best

L e a d i n g S t r a t e g i c C h a n g e96
return for his investment. He almost unconsciously makes com-
parisons between the ratio of effort and reward of the old with
the anticipated effort/reward ratio of the new.
In the past, it took little effort for Sam to put the customer sec-
ond, third, or even tenth. In fact, it was quite easy not to be cus-
tomer-centric (one of the other key buzzwords used in the
Customer 1st training program Sam attended). Up to this point,
Sam has had little trouble being Sam-centric.
For example, a customer recently came running up to the gate,
completely out of breath, but still shouting, “I need to get on that
plane.” The plane was still at the gate, but the final passenger
count was completed, and the door was about to be closed. Sam
was tired and didn’t feel like being particularly pleasant. It took
little effort to say in a fairly unsympathetic tone, “I’m sorry,
boarding is closed.” The customer challenged, “What do you
mean, closed? I’m late because of a stupid mechanical problem
on one of your other flights. Besides, I can see the plane. It’s still
at the gate.” Without any effort, Sam replied, “As I said, boarding
is closed.” It also didn’t take much effort to tune out the passen-
ger’s ravings that followed. Sam simply walked away. Sam’s effort
and investment were low.
What about the benefits—the return on his investment? Surely
Sam could not have liked the ranting and ravings of the irate cus-
tomer. True, he did not. However, the ranting and raving were
not all that negative for Sam, partly because Sam had become
quite skilled at tuning them out over time. What were the posi-
tive rewards of being Sam-centric, rather than customer-cen-
tric? Power and control. The customer did not get on the plane
for one simple reason—because Sam said so. In Sam’s book, that
was not a bad outcome at all. In fact, it felt pretty good. For one
brief moment, Sam had the destiny (or at least the destination)
of the customer in his hands. When it came to looking for a good
effort/outcome ratio, Sam did not have to walk by faith. He knew

Chapter 6 • Brain Barrier #3 97
from experience that what he already had was good. One ounce
of effort (I’m sorry, boarding is closed)—three pounds of reward
(I control your life).
Now consider the same situation but with the new customer ori-
entation. Assuming that the customer arrives late enough that it
is not within Sam’s authority to get him on the plane, Sam still
has to turn down the customer. However, the new Customer 1st
strategy asks him to put much more effort into both the words
and tone he uses. The customer still shouts, “I need to get on
that plane.” Sam still has to say, “I’m sorry, but boarding is
closed.” But this time he also has to work hard to convey a tone
of understanding and sympathy. The customer still challenges,
“What do you mean closed? I’m late because of a stupid mechan-
ical problem on one of your other flights. Besides, I can see the
plane. It’s still at the gate.” Now the new investments required by
the new strategic map start to pile up. Sam has to think into the
customer’s situation and convey even greater sympathy. Sam has
to think, “I can understand this customer’s frustration. Anyone
would be frustrated in his shoes.”
Still, sympathy alone is not enough. The new organizational
transformation requires more. Whereas before, Sam could have
just tuned out the customer, now he must put significantly more
effort into solving the customer’s problem. To do this well, Sam
needs to know what other flights on YAA will get the customer to
his destination and what flights on alternative airlines might also
work. In the same instant that Sam must process this informa-
tion, he also needs to say something such as, “I can imagine how
frustrating the situation is, and I will do whatever I can to help
you get to San Diego. We have another flight in 90 minutes that I
think I can get you on. I may even be able to upgrade you.”
For all his extra investment of attitude and energy, what does
Sam get? At first, he is not sure. The first time he tries this new
approach, he has to walk by the faith he puts in the trainer’s or

L e a d i n g S t r a t e g i c C h a n g e98
his boss’s promise. Sam is hoping for the smile and “thank you”
that had been promised, but what does he get? The first time he
tries this new approach, he gets a customer who fires back, “I
don’t care about an upgrade or leaving later, I need to get on that
plane. What part of that plane don’t you understand?”
At this point, Sam is tempted to retaliate, but instead, he exer-
cises even more faith in the new destination and path, saying, “I
appreciate your frustration, but as I said, I can get you on our
next flight to San Diego.” Eventually, the customer relents and
agrees to go on a later flight. He even manages a “thank you”
before stomping off.
Unconsciously, Sam compares the return on investment ratios
(ROIs) of the old and the new. The old way: not much effort and
a nice reward of feeling powerful. The new way: lots of effort and
not that much reward. Should Sam continue to have faith that
the rewards will improve, that customers will smile and thank
him over time? Should he continue to believe that eventually
their smiles and thanks will translate into better performance for
the company and a more secure and rewarding future for him?
Unfortunately, Sam is alone in his thoughts. There was no one
else at the gate during the encounter—no boss, no peer. No one
was around to say, “Nice job.” No one was there to encourage
him to have faith and hang in there.
Repeat this one scene over and over again, and it is easy to see
why Sam gets tired (Exhibit 6-1). If Sam gets tired, it is easy to
see how the gravitational pull of Sam’s old mental map could
overpower the initial momentum of the new. Multiply Sam by
several hundred other similar gate agents, and it is easy to see
why the new Customer 1st strategy might not transform the
organization or its results.
In sum, change efforts fail to finish because people get tired.
They get tired in an absolute sense because change requires

Chapter 6 • Brain Barrier #3 99
energy and effort. The more substantial the change, the more
energy and effort must be expended in targeting change in indi-
vidual employees. More important than the absolute level of
energy required is the tiredness that comes from the effort of
walking a new path that seems to provide an inferior ROI to an
individual employee. Employees get tired of walking by the vapor
of faith when the concreteness of the past has worked and would
continue to work just fine, from their perspective.
Getting Lost
Because major transformations of people and organizations are
long journeys, people not only get tired along the way, they can
also get lost—very lost. Over the long transformational journey,
they lose track of where they started, where they are, and where
that places them in relation to where they thought they wanted
to be and go. Once all this uncertainty sets in and employees feel
lost, pressing ahead is not very compelling.
To understand this, we need only return to Sam, our gate agent.
When we last left Sam, he was getting tired. It took lots of extra
Sam
EXHIBIT 6-1Failure to finish: Getting tired.

L e a d i n g S t r a t e g i c C h a n g e100
effort to put customers first. In many cases, that extra effort was
not yielding extra benefits. Fortunately for YAA, Sam was willing
to walk a bit more by faith than the average person. Sam knows
from past experiences that seeing usually is believing, but some-
times believing is seeing. He knows that sometimes, you see
something only after you first believe in it. He trusts you—his
boss—which makes it easier to have faith in the future. Conse-
quently, he persists in his Customer 1st efforts. He gets some
encouragement from you, and he pays special attention to
peers, who also seem to be trying. Sam tries to ignore those col-
leagues who have only bad things to say about the whole Cus-
tomer 1st notion.
Six months go by. Sam has been working on being more sympa-
thetic, using the phrases he was taught, and solving customer
problems more efficiently and effectively. He feels as though he
has made some progress, but how much? He is not sure. “What
about the rest of the organization?” he wonders. “Are they work-
ing as hard as I am?” In his immediate work group, Sam knows
that he is in the minority. Most of the others are not really taking
this Customer 1st thing all that seriously. “Is his work group typ-
ical, or are most of the other groups moving down the path? Has
any of his effort made any difference to customers? Have the col-
lective efforts made any difference? Are load factors up? Are
customer satisfaction levels up?” Sam just doesn’t know where
things stand. He is starting to feel lost (Exhibit 6-2), in which
case, why should he keep moving forward?
As Sam’s questions suggest, he is concerned both about his per-
sonal position and that of the company. He wants to know how
far he has come personally. He has a sense that he has made
progress, but he is not sure how much distance he has covered
and how much more remains. He also wants to know how far the
company has come. Sam does not want to be the only one who is
putting in all this extra effort. He knows that many of the per-

Chapter 6 • Brain Barrier #3 101
sonal benefits (a more secure future) depend on organizational
benefits (better financial performance) and that he alone cannot
bring about the desired organizational results. If others are not
doing what he is doing, if others have not made the progress he
has made, Sam has no hope of seeing the benefits in which he
has believed and trusted.
Unfortunately, in YAA no baseline measure was ever taken of
customer satisfaction with Sam’s behavior. Neither Sam nor you
(his boss) really know how unhappy or happy customers were
with Sam before the new strategy got underway. Perhaps more
unfortunately still is that no measure has been taken since. Sam
feels like fewer customers stomp away unhappy and more cus-
tomers smile and thank him, but the changes have been so small
over so many days that the difference is hard to see.
At the corporate level of YAA, though, there were some baseline
measures. For example, corporate had measures of complaints
per thousand customers before the transformation. In fact, rank-
Sam
EXHIBIT 6-2Failure to finish: Feeling lost.

L e a d i n g S t r a t e g i c C h a n g e102
ing as one of the worst airlines on this measure was a key driver
for the strategic change. Since implementing the change, com-
pany executives have tracked customer complaints per thousand
over the last several months. They also have been able to track
the level of repeat business from frequent fliers as one important
measure of customer satisfaction. Finally, senior management
even had an outside consulting firm conduct some customer sat-
isfaction surveys early in the program, as well as more recently.
Not surprisingly, the results were mixed. YAA was making
progress. The number of complaints per thousand was down sig-
nificantly. YAA had moved from last to fifth best on this measure.
However, customer satisfaction was actually down. The consult-
ants explained that this was largely a function of raised expecta-
tions. Before the transformation, YAA customers had little
reason to expect good treatment. With the launch of Customer
1st and the resulting media attention, customers’ expectations
went up. Although YAA employees behaviors toward customers
improved, they did not improve as fast as expectations, and as a
consequence, customer satisfaction scores actually dropped.
Executives of YAA worried that disseminating this and other
information presented too many risks. What if competitors
acquired this privileged information? What if employees got dis-
heartened by the drop in customer scores and were too unso-
phisticated to appreciate the explanation? What if someone
leaked this information to the media? These and a hundred
other questions like them kept YAA’s executives from letting any-
one know how things were actually going.
As Sam’s boss, you’ve heard rumors about how things are going,
but no one has shared any concrete numbers with you. When
Sam asks about progress, you can say only that you have not
heard anything official. When Sam asks about his progress, what
do you say? You tried telling him that he is doing fine, but he did
not seem satisfied and wanted to know what specifically was

Chapter 6 • Brain Barrier #3 103
going well and what he should work on. Your comment “just
keep up the good work” did not put a smile on Sam’s face.
Is it little wonder that Sam is not only a bit tired, but is feeling
lost, as well? If this were a physical trek through the wilderness,
how long would we expect Sam to keep going if he was unsure of
where he was, the progress he had made, or how much farther it
was to where he wanted to go?
Even after getting employees to see that the old right thing is
now wrong and to recognize what the new right thing is, and
even after getting them to believe in the path that will take them
from doing the new right thing poorly to doing it well, change
efforts often falter. They falter because people get tired and lost
and, therefore, fail to finish. They do not go far or fast enough.
Those at the controls fail to apply the right power and thrust
after takeoff, and gravity is there to pull the flight of fancy crash-
ing back to earth.
Overcoming The Final Brain BarrierThe next chapter, Chapter 7, outlines the keys to overcoming
this third and final brain barrier. Without this knowledge—even
though a change project has broken through the barriers of see-
ing and believing—there is little hope of achieving a lasting
change.
Once Chapter 7 has laid out these key steps, Chapter 8 walks
back through the principles and applies them to the challenge of
changing to greater growth. With the model firmly in place and
integrated with the challenge of growth, Chapters 9, 10, and 11
provide a pragmatic toolkit for leading strategic change.


105
CH
AP
TE
R 7 The Keys to Finishing: Champions and Charting

L e a d i n g S t r a t e g i c C h a n g e106
Given all the time and energy it takes to overcome the
first two brain barriers and get people to see and believe, it is
sometimes heartbreaking to see all that success go down in
flames because of a failure to finish. As we explained in the last
chapter, failure to finish is primarily a function of people getting
tired or getting lost. These are what keep people from moving
fast or far enough to achieve success. The keys to achieving suc-
cess in this final stage of change are champions and charting.
Providing ChampionsRemember how tired Sam, our gate agent with YAA, got even
after he saw and believed in the Customer 1st change? He planted
the seed of Customer 1st in his behavior, but like all seeds, it did
not sprout immediately or grow into full bloom overnight. It
needed consistent care and nurturing. Like a seed, it needed the
most attention when it was young. Sam’s first few experiments
with the new Customer 1st behavior were the most critical. That
is when the seed was the most vulnerable. Deny it a bit of water
just after it is planted, and it has a good chance of dying.
YAA was lucky to get Sam to try the experiment, given that the
rewards were by no means assured. Where was the champion to
help nurture, water, and feed this new seed? It would be just
plain dumb to expect Sam to play champion to himself. Without
a champion, Sam will tire, slow down his attempts to change,
and likely quit far short of the goal.
The point of coming back to this example is that, normally when
we talk about “change champions,” audiences and readers alike
almost always think we’re talking about high people in powerful
positions. This again is Remedial Leadership 101. Of course,
senior executives must be champions of large-scale organiza-
tional changes. Organizational transformation efforts that lack

Chapter 7 • The Keys to Finishing 107
committed executives will fail. However, we have interviewed
dozens of senior executives who have supported and “champi-
oned” change efforts that have fallen flat. The reason for refer-
ring back to our example of Sam is to illustrate that, without
champions close to the action, the champions in the executive
suite matter very little and on their own cannot bring about last-
ing change. The change champions we are talking about are on
the line—not in the executive suite.
Just imagine again for a moment Sam’s first experiment with
Customer 1st. Do you think that Sam is influenced by the fact
that the CEO is 110% a champion for the Customer 1st change
when the customer is yelling in Sam’s face, “What is it about that
plane that you don’t understand?” The answer is no. Sam does
not care at that moment about the CEO. Yet that moment with
the customer is the moment of truth. That moment when Sam
exercises some faith, plants the seed, and waits for the results is
when a champion is needed—not days before or after. That is the
place where the champion needs to be, not on the 27th floor in
the cherry wood-paneled executive suite. The champion is
needed next to the action when it happens—where the rubber
meets the road.
It is a given that senior executives support the change. Of
course, they need to voice their support repeatedly. However,
they need to manifest their support by ensuring that there are
champions of the change at the point and time in which the
early walks by faith occur. Unless the senior executives do this,
all their video, PowerPoint, broadband, radio, and closed-circuit
TV presentations are nothing more than tinkling cymbals of the
top brass.
For a large-scale change effort, it may not be practical or possible
to put in place the required number of champions (let alone
quality) to ensure that all the early walks of faith are supported
and reinforced, that all the early seeds that are planted are fed
L e a d i n g S t r a t e g i c C h a n g e108
and watered. In these cases, it is critical to identify and desig-
nate some early launch sites. They should be called launch sites,
not pilots or test cases, or anything else that can leave people
wondering about executive commitment to the change. These
early launch sites should be staffed with trained and motivated
champions who will be next to the action when it happens. Only
in this way can you have a chance to break the hold of the third
gravitational force of change and help employees avoid getting
tired, slowing down, and giving up too early.
These champions must know what to look for and what to rein-
force. They must know how to reinforce what they’re looking for.
Imagine again being Sam’s boss. What is it you are looking for?
Are you looking for results or efforts? Initially, you are looking
for efforts. Sam is not going to be good at something he has never
done before, so you have to encourage his efforts, not the results.
You have to stay close to the action at first so that you are in a
position to make a big deal out of the first successful result.
Unless you stay close to the action initially, the natural and
likely negative results can easily kill the desired behavior.
At first, Sam is not going to be good at Customer 1st, scientists at
QuadQ are not going to be good a working in cross-functional
teams, sales people at Xerox are not going to be good at docu-
ment solutions. The natural consequences that will follow these
initially less than stellar capabilities on average will be negative.
We don’t need 60 years of research (though it’s there) to tell us
that, if left uncompensated, these natural and negative conse-
quences will kill the desired, new behavior. The job of change
champions is to counteract this natural force. In summary, to do
this you need to (1) be close to the action, (2) look for the
desired efforts—not results, and (3) counteract the natural nega-
tive consequences with positive ones.
The determination of the right positive rewards for desired
efforts takes us right back to Chapter 5. There is no substitute

Chapter 7 • The Keys to Finishing 109
for knowing your people and understanding what types of
rewards they value. For some, it is simple praise; for others, it is
highlighting that they are doing better than other employees. As
we already said, there is no magic formula for determining which
types of rewards you should use to encourage early change
efforts—despite less than desired results. All we can offer is a
framework of rewards from which you can be reasonably sure
there are one or two that fit virtually any subordinate you have.
Only you can discover or know which one or two are the most
powerful for a given individual.
Charting ProgressAlthough making sure that Sam has a champion by his side when
he plants his first few Customer 1st seeds is critical (by the way
the person does not have to be Sam’s boss), it is not sufficient.
You will recall that, after several weeks and months, Sam began
to wonder how he was doing and how much progress the organi-
zation was making. Without this knowledge, he began to feel lost;
feeling lost, he had little incentive to keep going.
When it comes to measuring progress, it needs to be done both
at the executive suite and in the trenches. All the Sams of YAA
need to know how the organization is doing. Part of their reward
is tied to the organization’s performance. That performance—
the good, bad, and ugly—needs to be communicated. Without it,
Sam is left to imagine the worst. If he imagines that progress is
not being made, why should he keep going? In our experience, in
99 cases out of 100, the actual performance of the change effort,
no matter how bad, is not as bad as people can imagine if left to
their own devices. In the absence of information from on high,
employees will imagine something 100% of the time. This is a
critical point and worth repeating. People cannot and do not sus-
pend judgment and conclusions for long. Lacking any informa-

L e a d i n g S t r a t e g i c C h a n g e110
tion or conclusions from management, employees will form their
own. Normally, they assume that if things were good, they would
hear about it. Therefore, if they are not hearing anything, then
things must be bad, really bad. The key point here is that anyone
who believes that employees will over-interpret bad news and
who hopes that they will simply suspend conclusions in the face
of no news is mistaken and misguided.
Also, the worry that Sam and the others will not be smart or
sophisticated enough to understand such complicated issues as
why customer satisfaction went down even as Customer 1st
behaviors increased is also misguided. If Sam is smart and
sophisticated enough to understand why Customer 1st was the
new right way, how did he suddenly turn dumb? If he can get the
vision, he can understand the sidetracks.
In addition to organization-level measurement and communica-
tion of progress, achieving success also requires monitoring and
communicating at the individual level. Sure, Sam is concerned
about how the organization is doing, but he is equally and per-
haps more concerned about his own progress. His boss needs
either a reliable, intuitive, and informal means of measuring
progress or a structured and formal one. In either case, Sam
needs to know how much progress he has made. He needs to
know whether that level of progress fails to meet, adequately
meets, or exceeds expectations. He needs to know how much
farther there is to go. He needs advice, counsel, and help on how
to make further improvements. Without this “micro”-level moni-
toring and feedback, all the “macro”-level details in the world
may not keep Sam from getting lost and giving up.
Pulling It All TogetherTaken together, the model we have worked through maps
directly onto the framework we have used in outlining the barri-

Chapter 7 • The Keys to Finishing 111
ers to remapping change. Consequently, if you can remember
the barriers seeing, moving, and finishing, you can remember
the model for effectively remapping change. It is as simple as the
ABCs. However, rather than the ABCs of change, it is the CBAs of
change. The acronym stands for conceive, believe, and achieve.
As Exhibit 7-1 illustrates, these three stages in implementing
change successfully are designed to correspond with and over-
come the three gravitational forces or barriers of change. To
break through the first barrier, people must conceive the old
right thing as wrong and see the new right thing. To break
through the second brain barrier, people must believe in the
path that will take them from doing the new right thing poorly to
doing it well. Finally, to break through the third barrier, people
must achieve and know they have achieved the desired results.
Right Thing Wrong Thing
DoneWell
DonePoorly
Achieve
Conceive
Believe
EXHIBIT 7-1The CBAs of strategic change.

L e a d i n g S t r a t e g i c C h a n g e112
Failure to see is a function of entrenched, successful maps. The
more successful they are, the more blinding they are. It takes
high contrast and confrontation to break through and help
employees conceive that the old right way is now wrong and to
see the new vision. Heightening contrast and confrontation
requires focusing on the core differences, juxtaposing their
descriptions, repeating the message, and putting people in ines-
capable experiences to force the contrast.
Failure to move occurs because people are not motivated to go
from doing the wrong thing well to doing the right thing poorly. It
takes ensuring that the target is clear, that the capabilities and
tools are in place, and that rewards are provided in order for
employees to believe that they can go from doing the right thing
poorly to doing it well.
Finally, failure to finish happens because employees get tired
and lost and, therefore, do not go fast enough or far enough.
Achieving success requires champions in place to reinforce and
encourage the first few times the seeds of the change are planted
and to applaud the first few steps in their walk of faith. It
requires monitoring progress and communicating individual and
collective improvement.
In combination, conceiving, believing, and knowing what you are
achieving can overcome the force of gravity and allow you as a
leader to break through the three critical brain barriers and
redraw the maps in people’s heads to create lasting change.

113
CH
AP
TE
R 8 Breakthrough Innovation and Growth

L e a d i n g S t r a t e g i c C h a n g e114
So far we have broken down and covered the elements
of our change model separately. Although this helps highlight
and clarify the specific parts and steps, in reality they need to be
applied in an integrated fashion. To get a sense of how all the
pieces fit together, it is helpful to walk through the entire model
and all the principles focusing on a single organizational chal-
lenge. Although companies face a variety of challenges from
technology to globalization and everything in between, growth is
the one we find the most pressure for, both inside and outside
the company. Given the focus on shareholder value these days,
this is probably not surprising. Without growth to cash flow and
earnings, it is virtually impossible to sustain increased returns to
shareholders. Consequently, we thought it would be valuable to
illustrate further the principles of the CBA change model by
examining some cases of leading strategic change for growth.
Conceiving
Most firms we have worked with or studied, though certainly not
all, report that the biggest obstacle to greater growth is getting
employees (including senior executives) to see new opportuni-
ties—i.e., breaking through the first brain barrier. As we dis-
cussed at the outset of the book, people are blind to
opportunities because of the light already in their eyes. In almost
every case, the firm’s current low growth was preceded by a
period of higher growth. The longer the growth period of that
industry, product, market, or technology, the more established
the mental maps of where growth lies and what leads to it. The
key, then, is breaking out of these restrictive mental maps.
We have found that a key to success in helping people conceive
of new avenues of growth is to contrast their limited maps of
present business with expansive ones of the future. One simple

Chapter 8 • Breakthrough Innovation and Growth 115
tool we have used that works across different industries and
products is illustrated here.
First, we have those involved, whether they are senior execu-
tives or factory workers, talk about the existing products and
existing customers. We then place their basic descriptions of the
products and customers in a box such as the one in Exhibit 8-1.
We then place this box in a larger, two-dimensional matrix, illus-
trated in Exhibit 8-2.
Although this matrix is not our invention and is certainly not
new, we find it effective in helping people see that there is plenty
of growth “space” to go after. General Electric is now the classic
example of a company that has been primarily in low-growth
industries but has maintained superior growth by expanding out
of the existing product/existing customer box (see Exhibit 8-3).
For example, when Jack Welch took the helm of GE, less than
10% of its revenue came from outside the United States. One of
the ways GE enhanced its growth was to “move left”—to take its
existing products to new customers around the world. As growth
from expanding into this part of the matrix slowed, Mr. Welch
moved the company “down” by expanding into services that
leveraged existing customer relationships. For example, whereas
ExistingCustomers
ExistingProducts
EXHIBIT 8-1The way we are.

L e a d i n g S t r a t e g i c C h a n g e116
jet engine sales growth was in the single digits, moving into
engine maintenance and service represented a double-digit
growth opportunity.
Clearly, the lower left cell in the matrix is also an important ave-
nue of growth. In many cases, it is the one that grabs the head-
lines and has been referred to as “competitive white space.”
However, in all honesty, as sexy as it may seem, growth from new
products and new customers is the most challenging, not
because people simply cannot see the opportunities, but also
because the opportunities in this cell are generally created, not
simply observed. The key: If you cannot get people to see the full
matrix, you have little hope of breaking out of the existing-exist-
ing box.
Existing
New
ExistingNew
Products
Customers
EXHIBIT 8-2The ways we could be.

Chapter 8 • Breakthrough Innovation and Growth 117
As we discussed in Chapter 2, sometimes it is a matter of not just
presenting a new map but also of helping people see that their
old maps are not quite correct and perhaps even distorted. Ear-
lier in the book, we talked about Kellogg’s. For nearly 27 years,
new ideas were in short supply at Kellogg’s because of a mental
map in which the existing-existing cell (i.e., existing product—
cereal—and existing customer/market—United States) occupied
most of the conceptual space of the growth matrix. This is why
the existing-existing box also accounted for between 70% and
80% of Kellogg’s revenue. In this case, the needed contrast comes
by showing this distorted map against the more correct map to
demonstrate that the size of growth potential outside the exist-
ing-existing space (see Exhibit 8-4).
Existing
New
ExistingNew
Products
Customers
GE’s move intointernational markets
GE’s move into services
EXHIBIT 8-3GE’s growth initiatives.
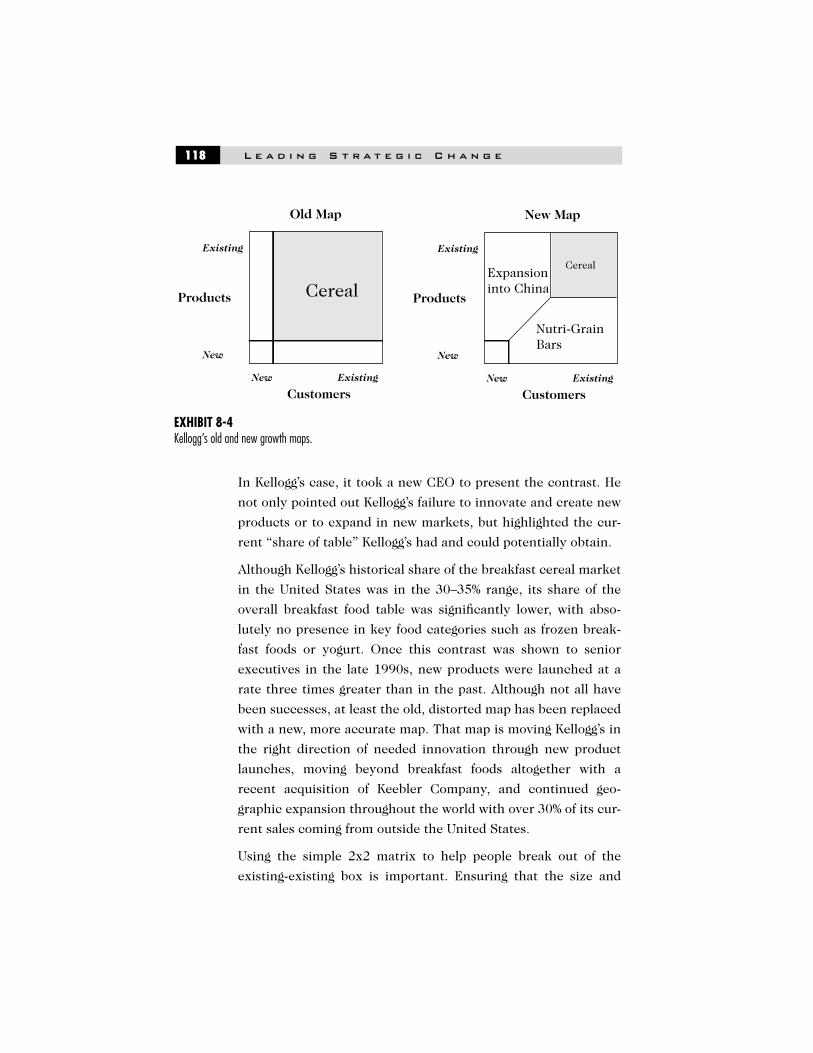
L e a d i n g S t r a t e g i c C h a n g e118
In Kellogg’s case, it took a new CEO to present the contrast. He
not only pointed out Kellogg’s failure to innovate and create new
products or to expand in new markets, but highlighted the cur-
rent “share of table” Kellogg’s had and could potentially obtain.
Although Kellogg’s historical share of the breakfast cereal market
in the United States was in the 30–35% range, its share of the
overall breakfast food table was significantly lower, with abso-
lutely no presence in key food categories such as frozen break-
fast foods or yogurt. Once this contrast was shown to senior
executives in the late 1990s, new products were launched at a
rate three times greater than in the past. Although not all have
been successes, at least the old, distorted map has been replaced
with a new, more accurate map. That map is moving Kellogg’s in
the right direction of needed innovation through new product
launches, moving beyond breakfast foods altogether with a
recent acquisition of Keebler Company, and continued geo-
graphic expansion throughout the world with over 30% of its cur-
rent sales coming from outside the United States.
Using the simple 2x2 matrix to help people break out of the
existing-existing box is important. Ensuring that the size and
Existing
New
ExistingNew
Products
Customers
Cereal
Old Map
Existing
New
ExistingNew
Products
Customers
Cereal
New Map
Expansioninto China
Nutri-GrainBars
EXHIBIT 8-4Kellogg’s old and new growth maps.
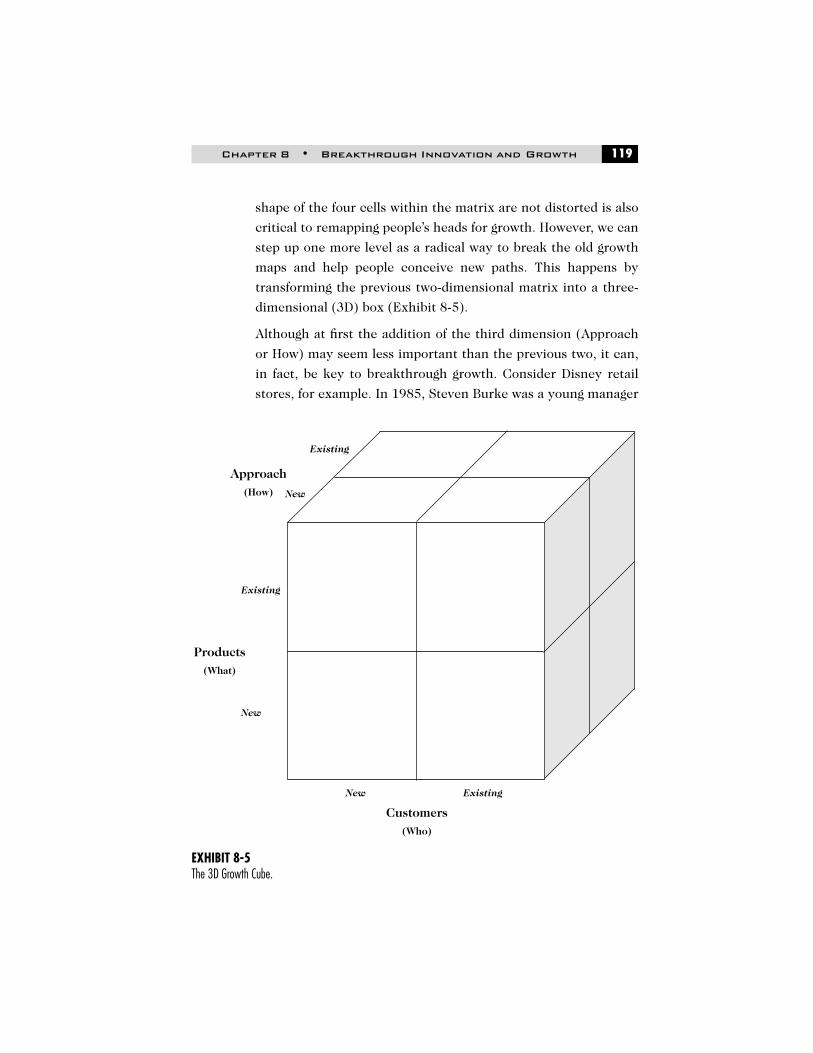
Chapter 8 • Breakthrough Innovation and Growth 119
shape of the four cells within the matrix are not distorted is also
critical to remapping people’s heads for growth. However, we can
step up one more level as a radical way to break the old growth
maps and help people conceive new paths. This happens by
transforming the previous two-dimensional matrix into a three-
dimensional (3D) box (Exhibit 8-5).
Although at first the addition of the third dimension (Approach
or How) may seem less important than the previous two, it can,
in fact, be key to breakthrough growth. Consider Disney retail
stores, for example. In 1985, Steven Burke was a young manager
Existing
New
ExistingNew
Products(What)
Customers(Who)
Approach(How)
Existing
New
EXHIBIT 8-5The 3D Growth Cube.

L e a d i n g S t r a t e g i c C h a n g e120
working in Disney’s consumer products division. It was a poor
cousin to the two main divisions of theme parks and film/televi-
sion, yet Steven was charged with growth. Much of Disney’s con-
sumer products revenue came from licensing Disney characters.
By the early 1980s, it seemed that every possible licensing angle
had been considered. Disney characters were in books, on
records, clothing, and lunch boxes, and in literally hundreds of
other product categories. How could growth be expanded?
The answer came not from expanding into new products or even
new customers, but in changing the way Disney got products to
customers—changing the how. Until that time, the most concen-
trated sales of Disney merchandise came from stores inside Dis-
ney theme parks. Through an employee suggestion contest, an
employee asked, Why do I have to go to the theme park and pay
the fairly expensive entry fee to buy this wide variety of Disney
merchandise? Why indeed?
From that simple question and idea came a billion-dollar busi-
ness. Today, the idea of Disney stores outside of Disney theme
parks seems obvious because of the pervasiveness of these
stores. However, at the time, it was a radical idea. Initially, Dis-
ney stores carried virtually the same products as were merchan-
dised in the theme parks, and the target customers were those
who already knew the merchandise from their visits to the parks.
In other words, initially, the growth came in the existing prod-
uct/existing customer/new approach cell. However, it did not
take long to expand out of that cell. Growth came from migrating
to the left (Exhibit 8-6). In other words, growth soon came from
selling existing products to not only existing customers but also
to people who had never visited a Disney theme park. The retail
stores then began to add products that were not carried in the
park stores. In three short years, sales went from zero to over
$500 million. Within five years, revenues were nearly $1 billion,
and profits were double that of comparable specialty retailers.

Chapter 8 • Breakthrough Innovation and Growth 121
Consider the case of Amazon.com. Once again, forget the crazy
prices people attached to the stock and look just at the business
model. Amazon.com started out selling existing books to existing
book buyers. At first, all it did was change the how. It allowed
people to buy books without having to leave home. This was new
and, for many people, more convenient. The book business for
Amazon.com went from nothing to $1 billion in sales in a few
short years. Yes, we all know that Amazon.com also lost more
than that during the same time period as it “invested” in the
Slow Growth Strategy
StrategyShift #3
New What
StrategyShift #1
New How
StrategyShift #2
New Who
EXHIBIT 8-6Disney Stores’ 3D growth map.

L e a d i n g S t r a t e g i c C h a n g e122
future, building better software and warehouses to ship products.
Given that the pipeline for ordering was “scalable” (a new
buzzword for an ancient concept called economies of scope),
Amazon.com expanded into music, video, and electronics. Then,
as we mentioned earlier in the book, it went a little crazy and
expanded into virtually everything else, from lawn furniture to
toys. Clearly, the market is going to force Amazon.com to focus
on profits, not just growing revenues, which hit nearly $3 billion
in 2000. Still, Amazon.com has grown (and some would argue
too much) because it exploited the third dimension of the
growth matrix—the how. It grew to a billion-dollar business pri-
marily by selling existing products to existing customers in a
new way. From there, it grew into a $3 billion business on its way
to destruction or glory by adding new products to its product list
and attracting new customers beyond book buyers.
Clearly, Amazon.com, like any other company, ultimately must
implement and manage its growth effectively. Perhaps Ama-
zon.com will not succeed at this challenge. Still, unless old men-
tal maps are cracked or maybe even shattered, the journey to
significant and new growth cannot begin. Amazon.com, GE, and
others have begun the journey. In our experience, the key to this
is confronting employees with a contrasting map that takes the
one-dimensional current business and explodes it into a 3D
framework of growth potential.
Believing
Once you get people to conceive of growth opportunities and
remap their mental terrain and how they see the potential uni-
verse of growth, not all is done. Hopefully, we have convinced
you by now that, although conceiving a new map is a critical first
step, it is only that—a first step. People still need to see and

Chapter 8 • Breakthrough Innovation and Growth 123
believe in a path that will take them from doing the new right
thing poorly to doing it well.
Federal Express has seen tremendous growth from its inception
in 1971. It has seen revenue increase by an average of 8% per
year over the last five years. Much of that growth can be directly
attributed to its hub-and-spoke business model that lets it collect
packages from almost anywhere in the United States and deliver
them almost anywhere the next day. In addition, its tracking
technology contributed significantly to growth. FedEx discov-
ered that customers loved the ability to track their packages
because it gave them peace of mind while their packages were in
transit and secure confirmation when packages were delivered.
Call centers were set up to receive customers’ inquiries about
the status of their packages. In short order, FedEx had 16 call
centers just within the United States.
By 1998, FedEx saw the Internet as a new means of growing its
business. It felt that if customers could check on the status of
their packaging at any time, day or night, without have to wait
on the phone when call centers were busy, customers would
have higher satisfaction and give FedEx even more of their busi-
ness. It would also help FedEx reduce costs by lowering the num-
ber of new call center representatives it had to hire and, thereby,
help grow earnings. By 1999, the company created a Web site
that customers could log into and find a package’s status by its
unique tracking number.
A somewhat unanticipated consequence of this move occurred
when customers phoned into the call centers; they increasingly
called with more sophisticated questions in general, along with
questions specifically about the Web site. The problem was that
call center reps had no access to the Web site and were trained
in very narrow specialties. Unable to answer questions about the
Web site, they would often pass customers along in a series of
call transfers to try to get the various questions answered. Not

L e a d i n g S t r a t e g i c C h a n g e124
surprisingly, this often resulted in dropped calls and in delays as
the customer waited for the next transfer. Neither result
delighted customers. Rather, both often infuriated them.
The challenge of changing the old mental map and moving down
a new path to greater growth and profits fell to Laurie Tucker.
Her first task was to help senior management see that, with the
advent of the Internet, the old call-center approach with special-
ized reps had now become the wrong thing, and a new vision
called OneCall must become the right one. To change senior
managers’ mental maps, Ms. Tucker and her staff created a short
video demonstration for the board. It showed a customer calling
in while looking at the Web site, posing a number of questions
while the call-center rep apologized because he could not see the
site. The stunning contrast hit the managers right between the
eyes. As a consequence, OneCall was approved. The vision of
OneCall was that a customer should be able in one call to get the
desired information and not be passed on to someone else.
The target to the employees became clear—answer all customer
inquiries to the customer’s satisfaction without having to trans-
fer the customer to someone else. Call center reps were initially
somewhat anxious about the OneCall vision. Reps had special-
ized knowledge and wondered how they could possibly answer
all questions a customer might ask. This was no idle question
because all of them knew from experience that customers were
increasingly asking complicated and difficult-to-answer ques-
tions. Furthermore, most had little or no experience with the
company’s Web site. Not only would reps need Web access, they
would also need training on how to use the company’s Web site
and how to walk people through it. In addition, for the OneCall
vision to work, call reps would have to be cross-trained in vari-
ous tasks so that customers would not get passed along in a frus-
trating series of handoffs. Not one employee was interested in
going from being competent to being incompetent. Without all

Chapter 8 • Breakthrough Innovation and Growth 125
the necessary resources in place, why would they bother trying
to walk the OneCall path?
Ms. Tucker and her team made sure that all the necessary
resources were provided so the call reps could make the journey.
Once call reps had the Web access and training to deliver the
OneCall vision, the challenge was getting reps to believe they
would be rewarded for walking the new path. Call reps were used
to being measured and rewarded on call-time objectives. In other
words, the more calls you handled in a day and, therefore, the
shorter you made each call, the better. Unfortunately, this con-
tradicted the vision of OneCall. The objective of OneCall was a
satisfied customer whose questions were all answered with one
call to one rep. As a consequence, the old call-time measures and
rewards had to be dropped. Reps were rewarded with bonuses
based on customer satisfaction, which included a variety of
dimensions, such as efficiency, accuracy, and friendliness. In
addition to money, FedEx had supervisors spend more time lis-
tening to call rep conversations so that they could praise reps
when they solved thorny, time-consuming customer inquiries.
As the destination was made clear, the resources put in place,
and a mixture of valued rewards presented to reps, they began to
believe in and walk the new OneCall path.
The results of achieving this level of belief were significant. In
fact, within a few short months, one of the early centers to
undergo the transformation generated $10 million in additional
sales from delighted customers. With 16 total call centers in the
United States alone, similar results at each center could have
important financial as well as customer-satisfaction results.
In FedEx’s case, whereas the customers and product essentially
remained unchanged, growth in revenues and earnings came
from changing the how. That change was largely due to the use of
new technology. Although the video presentation to top manage-
ment helped shatter the old map and make way for a new one,

L e a d i n g S t r a t e g i c C h a n g e126
that alone was not nearly enough. Unless the call reps were actu-
ally able to answer customers’ more complicated questions in
one call, the new map was no more valuable in growing revenue
and earnings than the paper it might have been printed on. The
key was getting call reps to believe in the new map and walk the
new path.
Achieving
Despite all the time, energy, and money it takes to break
through the seeing and moving brain barriers, you still have to
break through the failure-to-finish barrier. At the risk of repeat-
ing ourselves, this is the barrier that ends up getting the least
amount of thought, planning, and priority, and as a conse-
quence, this is the barrier that can crush change initiatives.
When this happens, it’s like watching a $25 million F-16 hit the
sound barrier and crumple like an aluminum can because some-
one forgot to sweep the wings back. When leaders fail to focus on
finishing, all the prior investment to break through the first two
barriers is totally wasted.
In many cases, when a change initiative crashes and burns
because of a failure to finish, executives fail to recognize the
problem as such. They mistakenly think the problem was at the
beginning; they conclude that the start was inadequate. As a con-
sequence, they cycle back and start another new change pro-
gram. They put even more time and energy into fancy slogans
and mottos. They roll out training or whatever resources are
deemed necessary on an accelerated basis. By this point, employ-
ees have grown skeptical of the likely results (not the goodness of
the change initiative, per se) and do not put their full faith and
support behind the program. Not surprisingly, the extra effort on
the front end results only in executives hitting their heads against

Chapter 8 • Breakthrough Innovation and Growth 127
the failure-to-finish wall sooner. Again, not recognizing the true
problem, executives retreat back to the beginning, and a vicious
cycle begins and accelerates with each round until the executives
are standing alone, banging their heads against the wall while
skeptical employees stand off to the side, watching.
Even for companies that do focus on breaking through the fail-
ure-to-finish barrier, one of the things they often fail to consider
is the spillover impact of their changes on customers and suppli-
ers. As if breaking through the failure-to-finish barrier inside the
company weren’t hard enough, often the changes you make also
require your customers and suppliers to make changes. If cus-
tomers and suppliers don’t also break through the failure-to-fin-
ish barrier, they may keep you from achieving the ultimate
growth potential of the change initiative.
Dell Computer provides an interesting example of a company
that has made significant changes within and has also worked to
change its customers and suppliers for growth in revenues and
cash flow. In doing so, it did not lose sight of breaking through
the failure-to-finish barrier. One of the more interesting and
recent examples is its OptiPlex plant.
The PC business has become so price-competitive that gross
margins have shrunk to 2%. Consequently, the only way to grow
revenue—and especially earnings—is to push costs down and
productivity up. With Compaq, Apple, and IBM averaging 50–90
days of finished goods inventory, Dell set the target for its newest
plant at zero! Yes, zero finished goods inventory. To make good
on this objective, the OptiPlex plant has no warehouse. The
plant was designed so that finished goods were shipped out of the
plant as they came off the assembly line. This was no small task,
given that, on average, more than 20,000 machines (PCs, serv-
ers, storage boxes, etc.) leave the plant each day!
Furthermore, whereas its competitors averaged several weeks of
component inventory, Dell set the goal of not two weeks or two

L e a d i n g S t r a t e g i c C h a n g e128
days, but two hours of components. To ensure this lean supply
system, each of the several receiving docks for different compo-
nents is roughly 100 square feet, about the size of a large closet.
This is also significant when you consider that the plant covers a
total of over 200,000 square feet (more than 23 football fields).
Putting in place the automated assembly equipment and soft-
ware was a significant task, but it has provided impressive bene-
fits. For example, productivity (units produced per person, per
hour) increased 160% in just the first year. Although Dell will not
reveal the specific return on investment figures for this plant, the
company noted that, in 1994, its average return on technological
investments was about 30%, whereas in 2000, its ROI was 300%.
Clearly impressive. However, without changing the way custom-
ers order boxes and changing how suppliers provide compo-
nents, the automated assembly would grind to a screeching halt.
This is the part of the change that is perhaps more interesting
and provides a different angle from which we can examine how
to overcome the failure to finish.
This new process starts with the customers. Without orders,
there are no products to assemble—either by hand labor or by a
“lights out” automated factory. In the past, most of Dell’s corpo-
rate customers had labor-intensive and slow ordering processes.
For example, for one customer when employees wanted to order
a computer, they had to fill out a requisition form by hand. If
they were not careful in reading the hard-to-understand policy
guidelines, they would often order a computer with a configura-
tion that was not “approved.” Back would come the requisition
from the purchasing department to be redone by hand. Even
when there was no mistake in the requisition, it would be sent
off to the employee’s boss, and probably the boss’s boss, for
approval. When the required approvals were obtained, the requi-
sition would be sent to purchasing. Once there, it would need to
be checked to ensure that the requisition specifications met the

Chapter 8 • Breakthrough Innovation and Growth 129
guidelines; then a purchase order would be issued. Even when
the process ran smoothly and there were no mistakes, it took, on
average, just over two weeks before a purchase order (PO) was
issued. It then took another four weeks for the PO to be pro-
cessed and a computer finally to show up from Dell. The total
time from when the employee put pen (or more sensibly, pencil,
with its handy eraser) to paper and a computer’s arrival was 36–
40 days.
Dell had to help the customer conceive of a better way. Dell’s
vision had several key components. First, Dell would create a
customized catalog for the company. This catalog would consist
of products and configurations pre-approved by the company. It
would even create pre-approved configurations for different lev-
els in the company. As a consequence, when ordering a com-
puter, an assistant manager could not inadvertently order a
computer with features that exceeded the guidelines for that
level of position. Once an employee had tapped in his or her
order on the custom Web page, a requisition was instantly cre-
ated and sent electronically to the employee’s boss. The boss
then had 24 hours to respond, or the request was sent to his or
her boss for immediate approval. When approved, a purchase
order would be created and sent to Dell. If the requisition was
instantly approved when received, the entire process from requi-
sition to when Dell started making the computer could be 60 sec-
onds! With approval of requisitions within 24 hours, instead of
the total order to delivery taking 36–40 days, it would now take
only 3–4 days.
However, this vision required significant changes for the cus-
tomer. First, control over the requisition had to be delegated to
employees and taken away from central purchasing. Second,
bosses had to respond quickly (within 24 hours) or have their
bosses know they had not. Third, purchasing departments had to
give up playing control cop of PO generation. Fourth, customers

L e a d i n g S t r a t e g i c C h a n g e130
had to install software that would link them so tightly to Dell that
Dell could see into and begin to recognize patterns in the cus-
tomers’ demand function.
Most customers did not catch the beauty of the vision on their
own. They all had entrenched maps, the most significant of
which was built on the premise that you never let your supplier
see your demand function. The operating premise was “You tell
suppliers what you need, not the reverse.” To help customers see
the need for this change, Dell had to work hard to help custom-
ers recognize the cost savings that could come from significantly
fewer people handling paper. Dell had to focus on the increased
accuracy that also came from fewer manual transcriptions of
requisitions to PO to orders to computers. It had to help custom-
ers see the productivity benefits of getting employees on their
computers in 3 versus 36 days. Ultimately, Dell had to help cus-
tomers see that these and other benefits were greater than the
monetary investments involved and the psychological and politi-
cal power pain of the change.
However, even when Dell was able to help customers see the
need for the change, it still had to help customers believe that
the change could be successful. Because most customers had a
well-established manual requisition and PO process, the first
obstacle to the transition from doing the right thing poorly to
doing it well was software. Each customer in most cases had its
own proprietary software for keeping track of requisitions, POs,
and deliveries. To make matters worse, customers often had dif-
ferent systems for each of these three major functions within
their organizations. Dell had to show customers that its software
from WebMethods was the resource they needed to integrate
effectively. Dell showed customers that because its software was
built on open and uniform Internet standards, it could effectively
interface with any customer’s internal systems.

Chapter 8 • Breakthrough Innovation and Growth 131
Even after customers took the plunge and made all the changes,
Dell made sure that customers did not get tired or lost and con-
sequently failed to finish. To ensure that customers did not get
tired, Dell had dedicated champions assigned to each customer.
Especially early on as the customer came on line with the sys-
tem, it was the champion’s job to provide encouragement to cus-
tomers. One of the key messages to customers was that their
efforts were putting them at the cutting edge and, as a conse-
quence, would leave their competitors in the dust. This appeal to
pride and sense of competition was quite motivating for custom-
ers and kept them fighting through the inevitable glitches and
problems of early trials.
Dell also made sure that customers did not feel lost. Dell moni-
tored the results of the change and charted progress. It made
sure that the results (good, bad, and ugly) were communicated
on a regular basis to customers. Dell reported measures of accu-
racy, order fulfillment time, and estimated cost savings. As the
customer saw the increase in these benefits, sponsors within the
customer could continue to fan the flames of motivation and
enthusiasm for the change, pushing it to the point where it was
well entrenched and clearly successful. For these efforts, cus-
tomers never got a chance to feel lost and give up. They knew
where they were and what progress they were making on a
monthly and sometimes weekly basis.
Dell’s efforts to get its own suppliers to change and embrace the
new vision were equally challenging. Although Dell had more
leverage over suppliers to get their buy-in to the vision, the criti-
cality of suppliers effectively and efficiently implementing the
change was no less daunting or important.
Suppliers had well-established mental maps that included fea-
tures such as efficiencies derived from economies of scale in
manufacturing and shipping. Suppliers were used to bidding on

L e a d i n g S t r a t e g i c C h a n g e132
and winning large orders from Dell, which they would then pro-
duce and ship in large volumes. Furthermore, because these sup-
pliers also had other customers, they had developed internal
processes for allocating product and prioritizing customers when
demand outstripped their internal capacity.
Dell’s vision for suppliers was nearly 180 degrees in the opposite
direction of these proven, well-used maps. Dell’s vision for sup-
pliers had several key points. First, Dell would download orders
every hour and generate a new manufacturing schedule every
two hours that would reflect changes in job runs and priorities,
as well as components available. Second, suppliers would need to
tie into Dell’s system so intimately that suppliers would have
only 15 minutes to confirm an order placed by Dell. Third, once
the order was confirmed, the supplier would then have 75 min-
utes to get the order to Dell’s factory. This meant that suppliers
would have to locate warehouses physically near the Dell factory
that they would supply. Dell’s vision required that suppliers keep
two weeks’ worth of inventory in these nearby miniwarehouses.
Although Dell was one of the biggest customers, if not the big-
gest, for many of these suppliers and was the fastest growing PC
manufacturer, many suppliers were reluctant to make the
required changes. Suppliers’ mental maps of the past did not
allow customers to see into their capacity, yet the nature of this
integrated system would allow just that. Dell cites the example of
experiencing an up-tick in demand for a specific component,
looking into its supply chain and finding that one supplier had
surplus capacity in one of its offshore factories, then requesting
that the supplier use that capacity to meet the increased
demand. To be clear, Dell did not ask the supplier whether or
how it could meet this up-tick in demand but told the supplier
that it could, as well as where and how.
Although Dell always had the bullet of “dropping” a supplier if
the supplier did not go along with this vision, Dell did not want to

Chapter 8 • Breakthrough Innovation and Growth 133
start what would become an intimate relationship with a shotgun
marriage proposal. Instead, Dell focused on helping suppliers see
the need for the new vision. By tying into the Dell system, suppli-
ers would increasingly have a stable future. It was costly for both
parties to become so intimately entwined and, therefore, equally
difficult to divorce. By focusing on real-time manufacturing
needs, both Dell and suppliers could reduce inventories. Dell’s
objective was to go from two weeks to two hours of component
inventory. Suppliers could, in turn, go from two months to two
weeks of finished component inventory for Dell.
Like customers, even if suppliers bought into the vision, they
still needed to believe in a path that could help them switch from
doing the right thing poorly to doing it well. In the case of suppli-
ers, it was once again software that was the key resource for this
path. Dell’s software supplier for this part of the vision was i2
Technologies. This software lets suppliers see moment-by-
moment demand within Dell for its products and lets Dell see
into suppliers’ capacity. Dell expected this to increase velocity
and save $150 million within the first five years, but it achieved
the savings within the first two years.
With such tight tolerances, any hiccup by any supplier can cause
serious damage to the overall system. With only a two-hour
inventory, most suppliers are delivering several times per day.
One missed delivery can shut down the factory.
Consequently, Dell could not afford for a supplier to get tired or
lost and, thereby, fail to finish. As with customers, Dell assigned
champions to every major supplier at the beginning to encourage
them each step of the way. These champions played the role of
both technical problem solver and, more importantly, emotional
cheerleader. To ensure that suppliers did not get lost, Dell moni-
tored delivery performance constantly. Dell provided both posi-
tive and negative feedback about progress. Dell sent out detailed
performance reports every month to suppliers to ensure that

L e a d i n g S t r a t e g i c C h a n g e134
suppliers knew exactly how they had done, compared with the
past, as well as where their performance placed them, relative to
other suppliers. If a shipment was late by even a few minutes,
Dell generated an instant written (electronic) reprimand. With
so much feedback, suppliers had little chance of getting lost.
SummaryClearly, there is much more involved in the examples we have
presented, and in any live cases you encounter, than we could
explore in this book. Growth is not the only area of significant
strategic change, but it is an important one. This chapter has not
attempted to provide a comprehensive discussion of all it takes
to grow revenues or profits. Rather, we simply wanted to illus-
trate that the three barriers and the three principles for breaking
through and remapping change can be successfully applied to
growth or any other critical challenge.
As we have stressed throughout this book, we are not trying to
provide a comprehensive discussion. Both research and practice
lead us to believe that, although exhaustiveness can make for
long and complete books, it makes for short-lived and unsuccess-
ful practice. People use what they remember. That is why we
have focused on the core 20% of change barriers and principles
that will get you 80% of the way to your desired result.

135
CH
AP
TE
R 9 Leading Strategic Change Toolkit: Conceiving

L e a d i n g S t r a t e g i c C h a n g e136
Collectively, the next four chapters provide the glue to
ensure that this all sticks—that it sticks together and that it
sticks to you, the reader. After all, if the ideas in Leading Strate-
gic Change do not get translated into real actions and success,
they offer little lasting value. This transition from the world of
principles to the world of practice is critical. The true test of this
book’s value and your ultimate value to your organization hinges
on what you personally put into practice.
When working with literally hundreds of managers over the past
decade, we have drawn two conclusions about successfully trans-
lating principles into practice. First, most people need a set of
useful tools that capture key elements of the principles. Second,
leaders add the greatest value to their company by teaching oth-
ers the principles and helping them put the principles into prac-
tice. Great leaders at great companies regularly engage in these
high-impact actions. For example, Andy Grove, Chairman of the
Board at Intel, was once asked how he found time as a senior
executive to train leaders at Intel’s supervisory development pro-
grams. His instant quip was, “Where can I get more leverage in
shaping the future of Intel?” Similarly, Larry Bossidy, CEO of
Honeywell and past protégé of Jack Welch at GE, contends,
“When you retire, you won’t remember what you did in the first
quarter of last year, or the third. You’ll remember how many peo-
ple you developed—how many you helped have a better career
because of your interest and dedication to their development.
When you’re confused about how you’re doing as a leader, find
out how the people you lead are doing. You’ll know the answer.”
For Grove and Bossidy, and any other CEO worth his or her pay,
providing the right tools and teaching others how to use them
play central roles in leading change.
Building on these two key leadership observations, these next
three chapters walk through the complete set of Leading Strate-
gic Change principles and provides proven tools that, if used,
can help you successfully break through brain barriers in your

Chapter 9 • Leading Strategic Change Toolkit 137
organization. These tools also provide excellent “teaching and
practice aids.” In other words, we have found these tools helpful
in conveying change principles to others (subordinates, peers,
and even superiors) and enhancing their ability to put the princi-
ples into practice. The final chapter applies the principles to the
most challenging change—anticipatory change.
Although these next three chapters focus on the change toolkit,
we all recognize that credibility with others demands that you
practice what you preach. Leading by example has endured as
one of the most effective leadership principles since time began.
If you want others to change, you need to demonstrate your own
willingness and ability to change. However, just because you lead
does not guarantee that others will follow. This is why we already
stated (but it’s worth repeating) that the most effective value-
adding leaders teach others what they know and how to do it.
Individual Change
We have presented this fundamental principle at the outset of
the book, but here it is one last time: Organizational change
begins by changing individuals—not the other way around. Even
the most ardent believers in organizational change have agreed
with us that, at a minimum, organizational change requires some
individual “early adopters.” Just as in the marketplace, a new
product almost never hits immediately. It takes early adopters to
get “traction” or momentum. Organizations are the same. If a
few individuals in the organization do not adopt the initiative
and change their behavior, pulling all the “organizational” levers
in the world will produce nothing but sore arms. Like a car, you
can change the engine or suspension design but those changes
matter only when the rubber hits the road. The changes can look
great on paper, but unless the engine redesign gives you greater

L e a d i n g S t r a t e g i c C h a n g e138
acceleration or the suspension modification gives you better
handling, neither makes a practical difference. Likewise, you can
design new corporate strategies, structures, information sys-
tems, or shared values, but their impact can materialize only
when individuals do something different than before. If changes
look great on paper but don’t get translated into different behav-
iors, the changes will not deliver lasting value to shareholders,
customers, or employees.
As overwhelming as changing 100,000 or 100 people might
seem, in the end, that is what must happen. Consequently, effec-
tive change champions must exist throughout the organization.
As researchers and consultants, we have rarely seen a ratio
greater than one change leader to 100 individuals result in signif-
icant, lasting strategic change. This track record emphasizes the
need to empower other change champions through example and
personal instruction.
By the way, we know that many organizations refer to teaching
others using terms or phrases such as knowledge transfer. We
also know that most everyone but professors hate the notion of
“teaching” or “instructing” others. However, whether in a book,
article, speech, or consulting engagement, we deliberately use
teach or instruct instead of knowledge transfer” or manage. We
find these less popular words more valuable for change because
terms such as knowledge transfer often invoke a passive, mech-
anistic map in people’s minds. Transferring knowledge quickly
and effectively does not happen by osmosis. To get as many peo-
ple as possible rapidly capable of strategic change, you must take
an active, direct role in teaching them the new principles, as well
as coaching them in their application and implementation
efforts.
With that introductory framework to this and the other remain-
ing chapters, we now focus on reviewing the principles and dis-
cussing the most effective tools around for helping people apply

Chapter 9 • Leading Strategic Change Toolkit 139
the principles. The three “toolkit” chapters are organized around
on our three-part approach to remapping change—CBA (con-
ceiving, believing, achieving).
Conceiving ToolsIf people don’t see the need to change, they will not change—
unless compelled. Although beating people into submission is
possible, it is expensive and results in open rebellions or at the
least a quiet return to old habits as soon as the beating stops.
Consequently, the most prevalent reason for failed change is the
first brain barrier—the failure to see.
Inquisitiveness
As discussed in the beginning of this book, we see the need for
change only when a contrast is clear. Like a truck far off in the
distance, distant opportunities and threats are very hard to see.
It is not until the truck blares its horn and nearly smacks into us
(or, for some of us, it actually takes getting run over) that we
finally notice our well-worn map that had guided us down quiet
neighborhood streets is no longer valid. It usually takes this sort
of dramatic, “high-impact” event for us to recognize that the
world has changed and we are no longer on a quiet country road
but, instead, standing in the middle of a busy expressway.
As common as this process is, there are exceptions. Some people
consistently see the truck coming long before it blares its horn,
but they are rare (at least in our research). Equally rare is that
moment when the rest of us actually see the threat or opportu-
nity long before it became incontrovertible. In either case (con-
sistent see-ers and infrequent sight-ers), we found a common
factor. These people sought out contrast. They actively ques-

L e a d i n g S t r a t e g i c C h a n g e140
tioned their current map. So why, if the current map was work-
ing well, did they go out looking for contrast? The common force
behind the quest was inquisitiveness.
We say “inquisitiveness” because what we observed in these peo-
ple was stronger than curiosity and more pragmatic than loving
to learn. Inquisitive people and those who experienced a tempo-
rary inquisitive spike simultaneously followed their current
maps, yet actively questioned their validity. By questioning their
mental maps, they purposefully sought out evidence, signs, and
signals that contrasted or even contradicted their current maps.
We have found it interesting that without the fuel of inquisitive-
ness (iQ), actively looking for contrasts such as alternative busi-
ness models, sales approaches, marketing messages, management
styles, or technologies is very exhausting. For low-iQ leaders,
searching for new solutions is as attractive as starting a transoce-
anic flight with only a few gallons of gas in the plane’s tank. With
only a few gallons in the tank, low-iQ leaders view taking the
flight as a significant drain on precious resources, and conse-
quently, they opt to stay on the ground. After all, why fix what
isn’t broken?
However, high-iQ leaders draw energy from the opportunity to
hear new ideas, see new models, visit new markets, etc. They
look forward to opportunities to examine issues from new and
different perspectives. It gets them up in the morning.
We could go on, but most need little convincing that a high dose
of inquisitiveness enhances a person’s willingness and ability to
change. However, there is a more pragmatic concern. As one
manager put it, “Fine, I get it. The more inquisitive your nature,
the easier it is for you to recognize and make changes. But can
you do anything about the natural level of your inquisitiveness
or, for that matter, anyone else’s?”

Chapter 9 • Leading Strategic Change Toolkit 141
The answer based on research is moderately encouraging. Yes,
you can enhance the level of inquisitiveness in you or others, but
not infinitely. Research suggests that much of our “natural”
inquisitiveness is set by genetics and early childhood experi-
ences (though it seems impossible to disentangle the two and say
with precision which, nature or nurture, is more responsible).
The questionnaire in Exhibit 9-1 provides a very general sense of
your (or others’) natural iQ level.
EXHIBIT 9-1 iQ Questionnaire
Your IQ Index
1. When confronted with things I don’t
understand, I am not satisfied until I figure
out the answers.
1 Strongly Disagree2 Disagree3 Somewhat Disagree4 Somewhat Agree5 Agree 6 Strongly Agree
2. Whenever I need energizing, I find
something new to learn about.
1 Strongly Disagree2 Disagree3 Somewhat Disagree4 Somewhat Agree5 Agree 6 Strongly Agree
3. Others describe me as a very inquisitive
person.
1 Strongly Disagree2 Disagree3 Somewhat Disagree4 Somewhat Agree5 Agree 6 Strongly Agree
4. Meeting and getting to know people with
unusual backgrounds is interesting and
enjoyable.
1 Strongly Disagree2 Disagree3 Somewhat Disagree4 Somewhat Agree5 Agree 6 Strongly Agree

142
5. Learning new things is more enjoyable
than making more money.
1 Strongly Disagree2 Disagree3 Somewhat Disagree4 Somewhat Agree5 Agree 6 Strongly Agree
6. I frequently enjoy trying new and novel
things.
1 Strongly Disagree2 Disagree3 Somewhat Disagree4 Somewhat Agree5 Agree 6 Strongly Agree
7. I learn something new every day. 1 Strongly Disagree2 Disagree3 Somewhat Disagree4 Somewhat Agree5 Agree 6 Strongly Agree
8. Compared to most people that I know, I
pursue new knowledge in my profession
much more actively.
1 Strongly Disagree2 Disagree3 Somewhat Disagree4 Somewhat Agree5 Agree 6 Strongly Agree
9. People say that I constantly examine
experiences and extract the lessons to be
learned.
1 Strongly Disagree2 Disagree3 Somewhat Disagree4 Somewhat Agree5 Agree 6 Strongly Agree
10. I actively seek out unfamiliar places and
opportunities to learn when traveling away
from home.
1 Strongly Disagree2 Disagree3 Somewhat Disagree4 Somewhat Agree5 Agree 6 Strongly Agree
EXHIBIT 9-1 iQ Questionnaire (continued)
Chapter 9 • Leading Strategic Change Toolkit 143
Scoring Your iQ Survey. Scoring your survey is relatively simple.
Add up the circled numbers for Questions 1–10. The highest pos-
sible score is 60. Your total iQ score was ______. Now check to
see where your score fits in the following inquisitiveness ratings.
60–50 World-class iQ leaders
49–35 Strong iQ leaders
34–20 Average iQ leaders
19–less Weak iQ leaders
An alternative to the questionnaire above is simply testing your-
self or others against the following true story from a high-iQ
leader’s life and judging what your reaction would be in the same
situation. J. Bonner Ritchie reflects world-class inquisitiveness.
We have seen it shine in his consulting, teaching, and personal
life. For example, several years ago, Bonner was driving with his
wife and children on a German autobahn. As he sped down the
road, he suddenly realized that he was headed away from his
intended destination. Those familiar with the autobahn in Ger-
many know that it can be many kilometers between exits and
“on ramps.” Rather than wait 15–20 minutes until the next exit,
then reenter the highway in the opposite (correct) direction,
Bonner considered a shorter route. What looked like a level,
grass median separated the lanes of traffic. Bonner thought that
if he looked carefully and waited for a break in oncoming traffic,
he could cross the grass median and head back in the right direc-
tion. Essentially, he was going to make what is commonly called
a “U Turn” in the United States. After looking carefully both
ways, he pulled onto the left shoulder near a median strip of
grass separating the highways. With everything clear, he drove
onto the grass to go over to the other side of the highway. Sud-
denly, the Volvo he was driving rolled over, leaving Bonner and
his family suspended upside down in a hidden gully. (The gully
was hidden because a long-bladed mowing machine had cut the
grass completely level between each side of the freeway.)

L e a d i n g S t r a t e g i c C h a n g e144
Imagine yourself stuck in this situation. There you are, suddenly
upside down; you and your family hanging suspended by seat-
belts. What are the first words that come out of your mouth?
When we question executives about this in person, many use
expletives that we won’t repeat.
As his family dangled, Bonner’s first words were not expletives or
even inquiries about whether everyone was okay or hurt.
Instead, his first words to family members were: “This is inter-
esting. What can we learn from this?” Regardless of your score
on the iQ survey in this chapter, if your first instinct in this type
of situation is to learn, you top out the inquisitive scale, as Bon-
ner does. He lives to learn and he learns to live. His enduring
attitude of almost boundless inquiry mirrors what we see over
and over in our work with effective change leaders.
The iQ survey and Bonner’s high-iQ leadership provide two
means for gauging your (or others’) level of inquisitiveness, but
we must still ask the pragmatic question of how to increase iQ.
First, how can you enhance inquisitiveness in yourself? Second,
how can you enhance the iQ of others?
Our suggestion for ratcheting up the iQ factor in yourself and
others is to reconfigure the whos, wheres, whats, whens, and
hows in your life. First, consider your everyday patterns and the
whos in your world. Who do you exercise with? Who do you ride
to work with? Who do you take breaks with? Who do you eat
lunch with? Who do you socialize with after work? Now consider
your wheres. Where do you take walks? Where do you eat lunch?
Where do you vacation? Where is the desk in your office? Next,
look at the whats. What do you read? What do you watch? What
do you hear? What do you eat? What do you play? What do you
wear? Don’t forget the whens. When do you wake up? When do
you devour pizza? When do you drive home from work? When
do you take long, hot baths? When do you reflect? How about
your hows? How do you brush your teeth? How do you fix your

Chapter 9 • Leading Strategic Change Toolkit 145
breakfast? How do you get to work? How do you make a sell?
How do you rejuvenate?
At this point, you might be asking yourself why you should care
about the whos, wheres, whats, whens, and hows of my life. Put
simply, Low-iQ leaders are creatures of habit; high-iQ leaders are
masters of innovation. If we want to boost our inquisitiveness, or
others’ for that matter, we must reconfigure personal routines.
During interviews around the world with several hundred high-
iQ leaders, we quickly discovered that living without ruts sharp-
ened their inquisitiveness. For example, one high-iQ leader
skilled in financial analysis lunched at least once a week with
people either outside of the finance group or outside the com-
pany (new whos). Another high-iQ leader challenged himself to
eating lunch at a different restaurant every day of the week for
three straight months—no small feat while living in a city popu-
lated by fewer than 300,000 people (new wheres). Frequently,
high-iQ leaders learned new skills at work or launched new hob-
bies at home; others experimented with new foods when travel-
ing in foreign countries; and one executive actually snacked on
dried dog food instead of potato chips to win a new client’s busi-
ness in the pet food industry (new whats). Some high-iQ leaders
changed their whens by taking Wednesdays off instead of Satur-
days or by meeting with customers in the morning instead of the
afternoon to catch a glimpse of different work flows. Finally,
high-iQ leaders challenged their hows by substituting new
approaches to old activities, such as delivering a message in per-
son instead of simply zipping off e-mails.
These examples of new whos, wheres, whats, whens, and hows
might seem trivial and at times bizarre, but regularly and con-
sciously upsetting personal routines engages us (and those
around us) in everyday learning. And transforming everyday sit-
uations into learning opportunities everyday is the fuel for
greater inquisitiveness in ourselves and others.

L e a d i n g S t r a t e g i c C h a n g e146
Contrast and Confrontation
Kenneth Chenault, CEO of American Express, recently declared,
“The role of a leader is to define reality.” We concur. Regardless
of whether inquisitiveness is high or low, if you recognize the
need for change, the real challenge then becomes how to create
enough contrast and confrontation so that others see the need.
As discussed earlier, one key to effective contrast is simplifica-
tion combined with a focus on the 20/80 principle first discussed
in Chapter 1. Although some people can do both in one step, we
have found a set of tools for a two-step process more effective
with a wider variety of people. The first step is designed to bring
into sharper focus what has changed—what the contrasts are.
The tool (Exhibit 9-2) is a simple set of questions that uncover
common core areas of essential contrast.
Clearly, the questions raised above are not the only relevant
ones, but our experience is that if people take the time to answer
these questions, it nudges their minds enough out of the trap of
current mental maps to begin exploring new alternatives. Once
people alter the mental terrain, various contrasts begin to
emerge. In fact, typically once the process starts rolling, lots of
contrasts become more visible. At this point in remapping
change, the objective is to generate as many potential contrasts
as possible for each core area listed in the tool (Exhibit 9-2) or
other areas you see as important to your business that we have
not mentioned.
The next step and task is boiling these contrasts down to the
critical few factors—the 20% that paints 80% of the contrast pic-
ture. Once you have selected these, you can create a simple
matrix (Exhibit 9-3) that will help others clearly see the most
important contrasts (just like you did as the CEO of QuadQ, ear-
lier in the book).

Chapter 9 • Leading Strategic Change Toolkit 147
If generating growth is the key driver for change, we can now
return to the 3D Growth Cube presented in Chapter 8 as a
means of creating a useful tool to highlight and enhance con-
trasts between past and future growth.
When working with clients, we focus on the shaded cells in the
3D Growth Cube—the areas delivering powerful breakthrough
EXHIBIT 9-2 Core Areas of Contrast
Core Area Key QuestionsCritical
Contrasts
Customers Are current customer preferences
changing?
Are our customers’ customers
changing?
Are new customers emerging?
Competition Are competitors changing their
value proposition to customers?
Are competitors gaining or losing
specific competitive advantages?
Are new competitors emerging?
Technology Are current technologies moving
ahead of us?
Are potential substitute
technologies on the horizon?
Are new technologies emerging?
Products and
Services
Are current product/service
offerings changing?
Is the value proposition (price/
offering) ratio changing?
Are new products emerging?
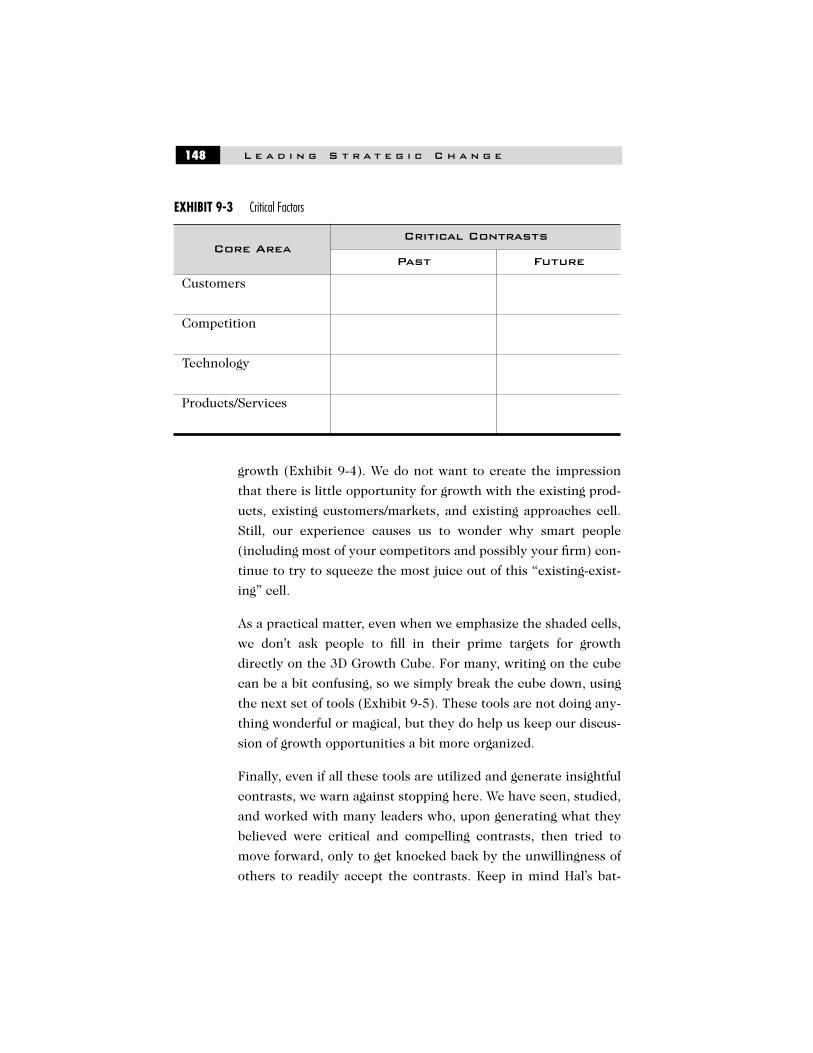
L e a d i n g S t r a t e g i c C h a n g e148
growth (Exhibit 9-4). We do not want to create the impression
that there is little opportunity for growth with the existing prod-
ucts, existing customers/markets, and existing approaches cell.
Still, our experience causes us to wonder why smart people
(including most of your competitors and possibly your firm) con-
tinue to try to squeeze the most juice out of this “existing-exist-
ing” cell.
As a practical matter, even when we emphasize the shaded cells,
we don’t ask people to fill in their prime targets for growth
directly on the 3D Growth Cube. For many, writing on the cube
can be a bit confusing, so we simply break the cube down, using
the next set of tools (Exhibit 9-5). These tools are not doing any-
thing wonderful or magical, but they do help us keep our discus-
sion of growth opportunities a bit more organized.
Finally, even if all these tools are utilized and generate insightful
contrasts, we warn against stopping here. We have seen, studied,
and worked with many leaders who, upon generating what they
believed were critical and compelling contrasts, then tried to
move forward, only to get knocked back by the unwillingness of
others to readily accept the contrasts. Keep in mind Hal’s bat-
EXHIBIT 9-3 Critical Factors
Core AreaCritical Contrasts
Past Future
Customers
Competition
Technology
Products/Services

Chapter 9 • Leading Strategic Change Toolkit 149
tered and bleeding head when he hit the door jams in Japan
again and again. We almost entitled this book “Head-Cracking
Change” because of how important inescapable experiences are
in changing people’s mental maps. But the editor felt that “Head-
Cracking Change” might have been a bit too graphic. Still, the
point remains. We are all like Hal; it takes more than an intellec-
tual confrontation with the contrast to shake loose deeply
entrenched mental maps.
Consequently, you can find a simple tool for breaking through
the brain barrier in Exhibit 9-6. We designed it for those leading
Existing
New
ExistingNew
What
Who
How
Existing
New
BREAKTHROUGHGrowth
Opportunity#3
BREAKTHROUGHGrowth
Opportunity#1
BREAKTHROUGHGrowth
Opportunity#2
EXHIBIT 9-4Prime targets for breakthrough growth.

150
EXHIBIT 9-5 Growth Opportunity Tools
Existing Products and Existing Customers/Markets
Growth Opportunity #1
New Approaches
1. Existing Product and Existing Customer/Market
Idea 1.
2. Existing Product and Existing Customer/Market
Idea 2.
3. Existing Product and Existing Customer/Market
Idea 3.
4. Existing Product and Existing Customer/Market
Idea 4.
Existing Customers/Markets
Growth Opportunity #2
NewProducts
NewApproaches
1. Existing Customer/Market Idea 1.
2. Existing Customer/Market Idea 2.
3. Existing Customer/Market Idea 3.
4. Existing Customer/Market Idea 4.
Existing Products
Growth Opportunity #3
New Customers/Markets
New Approaches
1. Existing Products Idea 1.
2. Existing Products Idea 2.
3. Existing Products Idea 3.
4. Existing Products Idea 4.

Chapter 9 • Leading Strategic Change Toolkit 151
the change. Its objective is to help you construct inescapable
experiences for each critical contrast that you have worked so
hard to identify. Again, from experience, it seems most effective
to examine potential confrontations by category. In other words,
we ask people to generate ideas on how to inescapably confront
each area of contrast.
You can gain two primary benefits from taking this sequential
approach to creating contrasts. First, even when you do a good
job zeroing in on critical contrasts, you can often end up with
too many to tackle all at once. Second, by examining potential
confrontations in sequence, we find it easier to spot possible
combinations.
For example, if we return to QuadQ, you may remember the idea
of bringing in one of the new end users (a technician with an
associates degree—not a PhD, sporting purple hair—not a lab
coat) to try out QuadQ’s old technology. Compared with old end
users of your products, this new technician’s obvious fumbling
with your unfriendly user interface creates an inescapable expe-
EXHIBIT 9-6 Tool for Breaking through the Brain Barrier
Core Area
Potentially High-Confrontation Experiences
(Sensory Engagement: Sight, Sound, Smell, Taste, Touch)
Customers
Competition
Technology
Products/Services

L e a d i n g S t r a t e g i c C h a n g e152
rience that highlights critical contrasts relative to both custom-
ers and technology.
From our experience, trying to identify from the outset high-
impact “two-for-one” or “three-for-one” experiences where you
can confront two or more critical contrasts through one experi-
ence is very hard to do. Although it may seem somewhat tedious,
you should find greater success if you explore potential high-
confrontation experiences in sequence, rather than all at once.
After working through the tools for identifying and highlighting
critical contrasts and generating high-confrontation experiences,
you are in a great position to help people really see the need for
change in your organization. Once they see the need (or alterna-
tively, conceive a new map), you have thrust—the power to take
off—but still need the next key, lift, for people to actually believe
they can travel to the new destination.

153
CH
AP
TE
R 10 Leading Strategic Change Toolkit: Believing

L e a d i n g S t r a t e g i c C h a n g e154
People must conceive the need for change, but this
alone is not sufficient. Simply recognizing that the old right thing
is now wrong is not enough. They must clearly envision the new
right thing and believe in a path that will take them from doing
the new right thing poorly to doing it well. Once they believe in
the path, you can get the lift needed to overcome their failure to
move. As discussed earlier, the three keys to lift and movement
are destinations, resources, and rewards. Next we want to review
these principles briefly and highlight some practical tools for
ensuring movement.
Destinations
People not only need to recognize that the old thing is now
wrong, but they must also see with clarity what the new right
thing is. Although this is a necessary step, it alone cannot deliver
movement to change. People also need to envision where they
are headed as they move forward; they must see the new prom-
ised land in their mind’s eye. It’s one thing to say, “In the past,
we practiced customer indifference, but in the future, we will put
customers first.” It is quite another to translate the promised
land of Customer 1st into clear targets that individuals can aim at
and actually hit.
This is why the key practical step in establishing effective targets
is translating the vision of the new right thing into concrete
behaviors. For example, if Customer 1st is the new vision, what
will that look like in terms of behavior? How would you recog-
nize Customer 1st behavior if you saw it? For example, in the
case of Sam, our airline gate agent, when a customer comes late
to the gate, one concrete behavior of the new Customer 1st
vision is empathizing with customer frustration at missing
flights. Another behavior is proactively working to help custom-

Chapter 10 • Leading Strategic Change Toolkit 155
ers get to their destinations. Only when targets are this concrete
and clear will Sam move forward.
A consistent exercise we engage managers in is clarifying the
new right thing in terms of concrete behaviors. The more com-
plex the vision in which the new right thing must be accom-
plished, the greater the need first to define the most common
situations that will create that complex change, then to describe
the concrete behaviors in those situations that support the new
vision. For example, in Sam’s case, one of the most common sit-
uations for making the vision of Customer 1st a reality happens
when someone arrives late to the gate. Another common situa-
tion occurs when flights are delayed or cancelled. The tool in
Exhibit 10-1 can help you define key situations in your change
initiative, then describe in detail the relevant desired behaviors.
This approach to change may seem detailed, but we have noticed
two important implications in our research and work with cli-
ents. First, without clear and concrete target behaviors, most
people will not move. So, although it may take a bit of time and
effort to detail the most common situations and describe the tar-
geted behaviors, the negative returns for not doing this, com-
pared with the positive returns for the time and effort for doing
it, make the decision to invest an easy one. Second, we have dis-
covered that if you focus on the 20% of situations—and related
target behaviors—that cover 80% of the new vision, the rest of
the less core situations and behaviors take care of themselves.
What do we mean that the rest take care of themselves? To illus-
trate, return to Sam our airline gate agent. For Sam, two situa-
tions—customers arriving late and delayed (or cancelled)
flights—are within the critical core 20% that account for 80% of
all customer service situations. By knowing what the targeted
behaviors are for these core situations, Sam can “fill in the
blanks” regarding Customer 1st behaviors for less common situa-
tions reasonably well on his own. That is, as Sam encounters the

L e a d i n g S t r a t e g i c C h a n g e156
EXHIBIT 10-1 Identifying Situations and Desired Response Behaviors
Common Situation Targeted Behavior
A. 1.
2.
3.
B. 1.
2.
3.
C. 1.
2.
3.
D. 1.
2.
3.

Chapter 10 • Leading Strategic Change Toolkit 157
other less common situations, he can reasonably extrapolate
from the identified core situations and make reasonably sound
judgments as to what the targeted behaviors should be. The
implication of this point is critical. If you take the time and
invest the resources to identify the core 20% of situations and
describe the related target behaviors, you will not need to make
the same resource investment in the remaining; you will have
equipped your people to do that job for you.
ResourcesNow your people should have a clear idea of the target. Part of
their “motivation to move” equation is solved. Next, you must
ensure that they believe they have the resources to make the
journey. Remember, we are talking about a wide variety of
resources—tools, knowledge, capabilities, etc.—to make change
happen. Movement requires that movers believe they have what
it takes. For example, people can have the sales capabilities but
lack product knowledge and, as a consequence, lack the motiva-
tion to move.
To support movement fully, we use the charts in Exhibit 10-2 to
help map out the full spectrum of required resources. These
charts also help you identify the necessary actions to supply
your people with needed resources so that they can individually
bridge the gap between what they have and what they need.

L e a d i n g S t r a t e g i c C h a n g e158
EXHIBIT 10-2 Required Resources Charts
Capabilities
Old New Gap Bridge
Small
Medium
Large
1.
2.
Small
Medium
Large
1.
2.
Small
Medium
Large
1.
2.
Small
Medium
Large
1.
2.
Small
Medium
Large
1.
2.
Small
Medium
Large
1.
2.

Chapter 10 • Leading Strategic Change Toolkit 159
EXHIBIT 10-2 Required Resources Charts (continued)
Knowledge
Old New Gap Bridge
Small
Medium
Large
1.
2.
Small
Medium
Large
1.
2.
Small
Medium
Large
1.
2.
Small
Medium
Large
1.
2.
Small
Medium
Large
1.
2.
Small
Medium
Large
1.
2.

L e a d i n g S t r a t e g i c C h a n g e160
EXHIBIT 10-2 Required Resources Charts (continued)
Other Resources
Old New Gap Bridge
Small
Medium
Large
1.
2.
Small
Medium
Large
1.
2.
Small
Medium
Large
1.
2.
Small
Medium
Large
1.
2.
Small
Medium
Large
1.
2.
Small
Medium
Large
1.
2.

Chapter 10 • Leading Strategic Change Toolkit 161
RewardsOnce people can see the targets clearly and believe they have
what it takes to hit the targets, the remaining key to movement
is instilling a belief that they will receive valued rewards along
the path to the desired change. As discussed before, most man-
agers need little help in using financial incentives to motivate
movement. However, financial incentives are expensive, and
they are not always completely within the control of those trying
to lead the change. In addition, many other, more readily avail-
able rewards are just as powerful and often more motivating than
traditional financial incentives.
Here we want to reiterate that, although everyone is likely moti-
vated to some extent by all of the following, they are not moti-
vated equally. This is why it is worth the time and effort to
consider key people who need to move or change and generate a
clear image of their most powerful motivators, as well as what
actions you can take to produce those motivators.
We use the tool in Exhibit 10-3 to help with this diagnosing and
planning process. We start by identifying the key individuals to
motivate and move. In every organization or subunit, we always
find key informal leaders and trend-setters. Quite often, if you
can get them moving, others follow. Next, we go through each of
the motivation areas and sub-areas on the chart to determine
which we believe to be the top three most powerful in motivating
that specific individual. Finally, for each of the top three areas,
we write out a few concrete actions that can be taken to moti-
vate the person. Again, although this tool represents a significant
investment of time and energy, the negative consequences of not
performing this step and the positive payoffs of spending the
time and effort make it one you can’t afford to skip.

L e a d i n g S t r a t e g i c C h a n g e162
EXHIBIT 10-3 Tool for Determining Motivation of Key Individuals
Key Individual: _____________________________
Area Sub-Area Top 3 Action
Achievement Accomplishment Yes
No
1.
2.
Competition Yes
No
1.
2.
Relations Approval Yes
No
1.
2.
Belonging Yes
No
1.
2.
Conceptual/
Thinking
Problem Solving Yes
No
1.
2.
Coordination Yes
No
1.
2.
Improvement Growth Yes
No
1.
2.
Exploration Yes
No
1.
2.
Control Competence Yes
No
1.
2.
Influence Yes
No
1.
2.

Chapter 10 • Leading Strategic Change Toolkit 163
SummaryWith clear destinations, required resources, and valued rewards,
you can break through the failure-to-move barrier. With that
breakthrough, you now must work to sustain the change and
achieve lasting results. Overcoming the final barrier to change—
failure to finish—may well be the most difficult.


165
CH
AP
TE
R 11 Leading Strategic Change Toolkit: Achieving

L e a d i n g S t r a t e g i c C h a n g e166
In many ways, failing to finish represents the saddest of
the three failures. It is disheartening to see so much time and
energy (to say nothing of money) funneled into a strategic
change, only to watch it go down the drain as people get tired
and become lost.
ChampionsPeople get tired primarily by doing the right thing poorly at first.
Virtually no one, and certainly not large groups of people,
become instantly proficient at following new maps, especially if
they are radically different from the past. Even when people are
motivated to try, they make mistakes. These mistakes or perfor-
mances at less than ideal levels of proficiency generate negative
consequences. People get worn out as they try to do the right
thing but fail to obtain the desired results.
This is why change champions are needed where the rubber
meets the road. Champions reinforce the desired behaviors, even
when the right efforts do not generate the desired results—at first.
To ensure that champions are in place to compensate for this ini-
tial gravitational inertia, we provide two straightforward tools.
The first tool (Exhibit 11-1) helps you make explicit three key
elements of championing:
1. Rubber-meets-the-road behaviors. It is absolutely critical
to identify in advance the “rubber-meets-the-road” behav-
iors necessary for the strategic change. What must be differ-
ent for the change to gain traction and produce an impact?
2. Likely negative consequences of initial poor proficiency. It
is helpful to identify in advance likely negative conse-
quences for less than ideal proficiency in following the new
map. At a minimum, champions need a clear idea of what

Chapter 11 • Leading Strategic Change Toolkit 167
these consequences will be. We have found that making
them explicit and explaining them to those making the
change is also helpful. This way, when people obtain undes-
ired consequences while trying to do the right thing, they
will not become as tired or discouraged.
3. Key champion actions. Finally, it is important to make
explicit what actions change champions should take when
people exhibit the right behaviors but do not get the
desired consequences. Without taking this third step, you
simply leave to chance—a roll of the dice—that change
champions will take the appropriate steps to compensate
for the downward drag or even change-breaking effects that
early negative consequences can generate.
We use the chart in Exhibit 11-1 to help change champions map
out these three key elements.
EXHIBIT 11-1 Key Elements of Championing Change
Rubber Meets the Road Behaviors
Likely Negative Consequences of Initial Poor
Proficiency
Key Champion Actions
1. 1.
2.
1.
2.
1. 1.
2.
1.
2.
1. 1.
2.
1.
2.
1. 1.
2.
1.
2.
1. 1.
2.
1.
2.
1. 1.
2.
1.
2.

L e a d i n g S t r a t e g i c C h a n g e168
Stopping here, however, assumes that champions capably pro-
vide the needed compensatory actions to balance negative con-
sequences. From our experience, this is not always the case. Just
as the new map is likely to require individuals to engage in new
behaviors, it is also likely to require new behaviors of change
champions in breaking through this segment of the failure-to-fin-
ish barrier. Therefore, simply but systematically assessing
required capabilities, current capabilities, resulting gaps, and
needed bridging actions is a must for breakthrough change. The
chart in Exhibit 11-2 will help you do this assessment.
EXHIBIT 11-2 Change Champion Assessment Tool
Champion Assessment
Required Capability
Current Capability
Gap Bridging Actions
Yes
No
1.
2.
Yes
No
1.
2.
Yes
No
1.
2.
Yes
No
1.
2.
Yes
No
1.
2.
Yes
No
1.
2.
Yes
No
1.
2.
Yes
No
1.
2.

Chapter 11 • Leading Strategic Change Toolkit 169
Using these two tools, you will gain a clear understanding of
where and why people will likely get tired, and you will have the
champions and actions in place to compensate for the sluggish-
ness. These tools will help you maintain change momentum
until improvements in proficiency can produce positive conse-
quences that naturally reinforce desired behaviors.
Charting
Unfortunately, even if champions are placed well and reward the
desired behaviors to compensate for the early negative conse-
quences to change, people can still become lost. They can lose
track of where they are, how much progress they have (or
haven’t) made, and how the change is going for others. To keep
people from feeling lost and giving up, charting and communicat-
ing progress play a pivotal role. As already discussed, these
actions must be done at both individual and group levels. The
appropriate group level may be a work group or an entire com-
pany. That decision depends largely on the nature of the change.
The larger the change and the more dramatic the strategic shift
for the company, the more information must be gathered at vari-
ous levels, including the company level, and communicated back
to people.
Except for the simplest of change initiatives, there are typically
dozens of measures of progress that we might look at, creating
hundreds of messages that then must be communicated to peo-
ple. To describe this challenge, we take examples from flying and
driving. Although confronted with potentially hundreds of cues,
effective pilots and drivers alike focus on a few instruments that
measure key elements. Consequently, these instruments are
usually easily seen in a “heads-up” display on a plane or in the
dashboard on a car. In airplanes, speed, altitude, and heading are

L e a d i n g S t r a t e g i c C h a n g e170
key elements to measure. Likewise, any change initiative must
include a limited number of key elements to monitor. You might
think of this as your heads-up display or “performance dash-
board” for change measurement, as shown in Exhibit 11-3.
There are five preparation steps to creating and monitoring your
performance dashboard:
1. Element to measure. First, you should identify what you
believe to be the key elements to measure (for example, atti-
tudes and/or actions). If we return to our gate agent, Sam,
customer complaints are clearly an important measure of
whether the Customer 1st initiative is working. Customer
satisfaction may also be an important element to measure.
2. Method of Measurement. It is also helps to establish how
the key element will be measured. For example, an airline
ChangeInitiative
CO
NC
EIV
ING
BELIEVING
AC
HIE
VIN
G
GROWTHNew MarketsNew CustomersNew Products
& Services
PERFORMANCE DASHBOARD
Early ChangeWarning
iQ Fuel
Contrast
Confrontation Champions
Charts
Communication
DestinationClarity
ResourceAcquisition Reward
Delivery
EXHIBIT 11-3Leading strategic change performance dashboard.

Chapter 11 • Leading Strategic Change Toolkit 171
might measure complaints based on the number of written
complaints received per 1,000 passengers. Customer satis-
faction might be measured via a survey given to a random
set of customers.
3. Measurement Interval. It’s important to establish how
often the measures will be taken. Some measures are more
difficult and costly to procure than others, and other out-
comes take longer to formulate. Therefore, measures are
useful only if taken with longer time intervals between
assessments.
4. Baseline Measurement. Once key elements and methods of
measurement are determined, establishing a baseline of
performance is critical before the change initiative gets
underway. Without a baseline, it is difficult to determine
how much progress is being made.
5. Target Results. Finally, establishing target performance
levels is also critical. Should Sam be shooting for less than
10 complaints per month or less than one? The chart in
Exhibit 11-4 can help you to capture these change mea-
surement issues.
EXHIBIT 11-4 Change Measurement Chart
Element to Measure
Method of Meas’mt.
Meas’mt. Interval
Baseline Meas’mt.
Target Results

L e a d i n g S t r a t e g i c C h a n g e172
When it comes to charting progress on these measures, there are
as many approaches as there are companies. As far as we know,
no research says definitively that one method of charting
progress is more effective than any other. We can say from our
experience that graphs have a stronger impact on people than
the mere numbers behind them and that charts showing
progress over time, relative to the final destination, help people
the most to avoid feeling lost. Exhibit 11-5 presents a sample
chart to illustrate these two points.
With the key elements of measure established, your next step is
determining the general communication plan. Entire books are
devoted to effective communication plans, so we won’t try to
reproduce all those ideas here. Rather, we will stick to the funda-
mentals that everyone knows but that are useful to review.
Any communication plan starts by determining who the infor-
mation receiver will be. In our experience, companies tend to
Base Line MeasurementTime 1 MeasurementTime 2 MeasurementTime 3 Measurement (Future)Target
Element 1 Element 2 Element 3 Element 4 Element 5
Tim
e 3
Mea
sure
men
t (F
utu
re)
Tim
e 3
Mea
sure
men
t (F
utu
re)
Tim
e 3
Mea
sure
men
t (F
utu
re)
Tim
e 3
Mea
sure
men
t (F
utu
re)
Tim
e 3
Mea
sure
men
t (F
utu
re)
Measu
remen
t Meth
ods, in U
nits
EXHIBIT 11-5Chart of change progress.

Chapter 11 • Leading Strategic Change Toolkit 173
error in the direction of sharing change progress with too few
people. Whenever we assess employees’ satisfaction with com-
munication, especially related to strategic change initiatives, we
have never found a situation where employees felt that too many
people were informed as to how things were progressing. In
almost every case, employees who were excluded from the com-
munication believed that they should have been included. We
are not suggesting that these employees were always right and
should have been included, but their feelings do illustrate how
much easier it is to error on the side of limiting the “who” of
communication plans too much than in expanding the recipient
list too far.
Next, the communication plan should determine what will be
shared. As mentioned earlier in the book, it’s best to share the
good, the bad, and even the ugly. To think that certain people
can help you bring about a needed change and to believe that
they are not mature enough to understand how the change is
really going communicates a double standard, loudly and clearly.
When is the third element to determine in a communication
plan. As already mentioned, we should take some measurements
more often than others. Consequently, in some cases, not every-
thing is communicated at the same time. In general, it’s a mis-
take to wait until everything is available before communicating
anything. People can easily feel lost while waiting for perfect
information; therefore, some information sooner is better than
all the information later.
Finally, in this age of various communication mediums, deciding
on how to communicate progress presents unique challenges.
Due to the range of options (e-mail, voice mail, “snail mail,”
video, face to face, presentations, etc.), you may need to choose
a different medium for different times or for different content.
For example, content such as declining customer satisfaction
scores after the launch of a Customer 1st program is probably

L e a d i n g S t r a t e g i c C h a n g e174
best communicated through more complex and rich mediums,
such as live presentations or videos, versus mass e-mails. Again,
this book’s purpose is not to outline all the details and nuances
to designing a communication plan but simply to reinforce that a
plan is necessary and that you should incorporate who, what,
when, and how into it. The chart in Exhibit 11-6 provides a place
to map out the basics of your change communication plan.
Summary
With the right champions in the right place—where the rubber
meets the road—and with the right heads-up display of core
measures, combined with a plan to communicate them, you
have created the key elements to break through the final brain
barrier—failure to finish. After breaking through the barriers of
EXHIBIT 11-6 Exhibit 11.6 Change Communication Plan
Communication Plan
Who What When How

Chapter 11 • Leading Strategic Change Toolkit 175
failure to see, failure to move, and failure to finish, then firmly
establishing a new map for the new destination, the only prob-
lem remaining for remapping change is guarding against our nat-
ural tendency to become trapped once again by the new map
that we have so faithfully followed.


177
CH
AP
TE
R 12 Getting Ahead of the Change Curve

L e a d i n g S t r a t e g i c C h a n g e178
Having touched on the final challenge of the timing of
change, let’s conclude with a direct assault on the issue. We are
compelled to do this because the payoff to you and your com-
pany can be significant. Three tactics to timing change—antici-
patory, reactive, and crisis—frame our options for the future.
Anticipatory change is just that—anticipating the need for
change. In other words, anticipatory change demands that we
look ahead to see in advance the signs that show change on the
horizon. This approach helps us to recognize early that the old
right map may soon become wrong. Then, based on this recogni-
tion, the challenge we face is trying to figure out in advance what
the new right map should be.
Reactive change is equally well titled. This approach revolves
around reacting to obvious signs and signals that change is
needed. These signs and signals surface from customers, com-
petitors, shareholders, employees, and other critical stakehold-
ers, indicating that we should change today or likely pay a
heavier price tomorrow.
Crisis change confronts a company when the signs and signals
have multiplied and intensified to the point of undeniability—
undeniable because, at this point, our competitors have already
begun to change, and we’re still sitting on the sidelines. When
signs and signals have been ignored too long, you can count on
the consequences showing up a firm’s financial performance. No
doubt you can remember dozens of companies that have faced
crisis change. For example, Nissan ignored the signals for so long
that a foreigner, Carlos Gohen, was brought in to manage the cri-
sis. With Kmart, the crisis has escalated so far that history is in
the making as Kmart competes for the biggest retail bankruptcy
record in U.S. history. At this point, it is not clear how many cri-
sis or turnaround change agents Kmart will need before return-
ing to its former glory—if it ever will.
We have found these three approaches to change quite useful
because they are intuitively straightforward. There is nothing

Chapter 12 • Getting Ahead of the Change Curve 179
hard to understand about the essential elements to each of them.
Yet some subtle, counter-intuitive issues still exist underneath
each approach. Let’s examine each in more detail.
Fundamentally, the more you drift down the slope from anticipa-
tory change to crisis change, the easier it is to get the change
going. For obvious reasons, to initiate anticipatory change when
the signs and signals indicating its need are far off in the distance
is the most difficult. As Andy Grove, Chairman of the Board at
Intel, recently confessed, “Half of our employees have only seen
record earnings, quarter after quarter. There’s a feeling of invul-
nerability, which is death.”
Once the signs and signals of change start showing up at your
door with frequency, they are harder to deny. Consequently,
reactive change is easier to get going than is anticipatory change.
The signs and signals may become so vast, severe, and incessant
that they become undeniable. Kicking off crisis change is the
easiest because the patient is almost ready to keel over, lying
sick and bleeding on the battlefield. These increasing difficulties
to initiating change are shown in Exhibit 12-1.
However, as we slide down the slippery slope of the change curve
from anticipation to crisis, the costs of change also grow (Exhibit
12-2). Anticipatory change is hard, but the costs are significantly
less in the long run, compared with cutting out half of the work
force, idling expensive plants, and damaging the reputation of
the firm in the eyes of customers, suppliers, and society.
If you were to superimpose Exhibit 12-1 on Exhibit 12-2, you
could see that the difficulty and costs of change along these three
approaches to change—anticipatory, reactive, and crisis—are
inversely related to each other. As difficulty of change increases,
costs of change decline. Conversely, as costs increase, difficulty
declines. To see why this is the case, let’s dig below the surface
on this powerful dynamic by starting with the last approach
first—crisis change.

180
AnticipatoryChange
ReactiveChange
CrisisChange
Most difficult to get going
Difficult to get going
Easiest to get going
EXHIBIT 12-1The difficulty of change.
AnticipatoryChange
ReactiveChange
CrisisChange
Most Costs
Moderate Costs
Least Costs
EXHIBIT 12-2The costs of change.

Chapter 12 • Getting Ahead of the Change Curve 181
Crisis Change
Most people we work with usually think crisis change is the
hardest of the three. After all, in the worst scenarios, company
survival is on the line. For example, we already outlined the cri-
sis Xerox faced when it brought in Rick Thoman from IBM, who
by all accounts was quite capable and successful in the past. Yet
Thoman lasted less than two years at the helm. Facing an even
deeper crisis and continued losses in the tens of millions of dol-
lars, Xerox brought in another new CEO to try to turn things
around.
How would you like to be the new CEO? Tough job, right? Yes
and no. Clearly, turning a company around is never simple, but in
terms of getting change going, crisis change is the easiest of the
three to lead. After all, when your credit ratings are downgraded
monthly, when losses mount daily, and when your stock price
falls hourly, how hard is it to convince people that the old map is
now wrong? Also, how precise do the dramatic measures that
must be taken need to be? For example, if labor costs are exces-
sive, how hard is it to cut a third of your work force? How much
precision does that really take? It may require a strong stomach,
but how not much skill is required to initiate the change?
As an analogy for this corporate situation, compare the worlds of
a battlefield medic and vascular surgeon. How much training
does a battlefield medic need, compared with a vascular sur-
geon? A battlefield medic’s training is measured in months,
whereas a vascular surgeon’s is measured in years. Why? Imag-
ine yourself on a battlefield where someone’s arm is shattered by
an explosion. Bullets are whizzing overhead. The enemy is
advancing. What do you do? You are clearly in a crisis. You can’t
take time to try to patch the arm back together carefully. No, you
put a tourniquet on the arm to stop the bleeding, and now! Per-
haps the soldier loses the arm. Maybe you have to cut off the arm

L e a d i n g S t r a t e g i c C h a n g e182
to save the person. If you do, there isn’t time for precision;
you’re in a crisis. Maybe you should have cut it off an inch higher
or lower than you did, but there’s no time to worry about that.
Indeed, if you had the time and were not in a crisis, as a vascular
surgeon, you could perform the seven-hour operation to restore
the torn muscles and reconnect the severed blood vessels.
Please don’t misunderstand us. We are not suggesting that any-
one can become a battlefield medic or that anyone can perform a
successful company turnaround. However, we are saying that the
inherent nature of crisis change makes it much easier to break
through the failure-to-see barrier, as well as the failure-to-move
barrier, in comparison with anticipatory change. After all, if you
don’t see or move when a crisis hits, you are as good as dead.
However, just as the battlefield crisis results in more blood, suf-
fering, and loss of life or limb, so, too, does crisis change. Crisis
change almost always costs money, shareholder value, customer
loyalty, and jobs—the livelihoods for often large numbers of
employees. Thus, although crisis change is the easiest of the
three to initiate, it is also the most costly for almost everyone
affected by it.
Reactive ChangeReactive change is probably the most common approach we see
in organizations. Reactive change is harder to get going than cri-
sis change because less evidence exists that the successful map
of the past is indeed wrong for the future. It is typically less
costly than crisis change because it usually happens before the
red ink flows freely and before the work force must be cut in half
for sheer survival. Take notice, though, we do not want to create
the impression that reactive change is bad, per se. The more
uncertain the signs and signals that the business environment is

Chapter 12 • Getting Ahead of the Change Curve 183
shifting, the more prudent it may be to wait and react. In fact, if
you have established a general level of change agility within your
organization, it may be much better to respond as a quick sec-
ond mover instead of a first mover. However, the junk pile of
derailed careers of leaders who were slow second movers is both
high and wide. While an ever-present great temptation looms for
firms to drift down the slippery slope from anticipatory to reac-
tive change, you must remember and count the very real costs
and consequences of failing to pull off anticipatory change.
Anticipatory Change
Everyone knows from experience that anticipatory change is
very hard—initially. Just as it is difficult to see physical objects
when they are far off in the distance, so, too, is it hard to help
people sense business threats or opportunities when they are
either on or sometimes over the sight horizon. Furthermore,
even if we do help others to see these distant threats or opportu-
nities, the farther away they are, the greater is the chance that
they can change course, and as a result, we will miss them as
time and distance slip by. We all know that being off by even a
small degree over a long time and great distance can easily lead
to missing a target by a wide margin. In fact, the longer the time
and distance we travel, the greater will be the magnitude of the
miss when off by only a degree or two at the start.
We all understand this dynamic, so most of us are nervous about
the time, energy, money, and other valuable investments
required for successful anticipatory change. With anticipatory
change, many feel a greater chance of missing the future target
and getting no good return on current investments. This ten-
dency is strongly reinforced if the current map that we follow not
only works well now but has worked well for quite some time.

L e a d i n g S t r a t e g i c C h a n g e184
This is no doubt a big reason why many executives avoid antici-
patory change. Of the three types of change, it is the most diffi-
cult to start and, as a result, the most difficult to finish.
Anticipatory change also presents the greatest potential benefits
and lowest costs to the firm—if executed correctly. You can also
accrue significant career benefits by mastering anticipatory
change. Because anticipatory change is difficult, the supply of
capable anticipatory change leaders is short. Career premiums
are always paid when demand outstrips supply. Because a short-
age of anticipatory change leaders continues, first-mover advan-
tages are real for organizations, and the potentially payoffs are
enormous.
This is especially true when the change involves long and steep
learning curves. You might be inclined to conclude just the oppo-
site. After all, long and steep learning curves (reflecting the sig-
nificant amount of learning required to do the new right thing
well) mean that the payoffs do not show up initially. However, it
is for precisely that reason that the sooner you get your com-
pany on the curve, the greater will be your firm’s advantage over
slower-to-change competitors. As Exhibit 12-3 and Exhibit 12-4
illustrate, for each equal interval of time during the learning pro-
cess, once you get into the “fat” part of the learning curve, the
greater becomes your advantage and the distance you put
between yourself and your competitors.
For example, consider the rivalry between Pepsi and Coke in
Vietnam (with its 80 million people). The learning curves for
manufacturing, distributing, and selling beverages in Vietnam
are long and steep. Understanding and mastering the nuances of
working effectively with a joint venture partner that was a
former state-owned enterprise alone are vast. Workers must be
hired and trained to focus not just on volume, but also on qual-
ity. Because the nature of the market is quite fractured, literally
dozens and dozens of relationships with distributors have to be

185
Year 1 Year 2 Year 3
Your Firm
Your Competitor
Seemingly small competitive advantage
EXHIBIT 12-3Moving fast and first up steep learning curves: Year 1.
Year 1 Year 2 Year 3
Your Firm
Your Competitor
Significant competitive advantage and distance
EXHIBIT 12-4Moving fast and first up steep learning curves: Year 2.

L e a d i n g S t r a t e g i c C h a n g e186
formed in order to get your product to the market. The retail
shops for distribution to the consumer market are so fragmented
that it takes literally thousands of relationships with “mom-and-
pop” shops just to get your product out in the south of Vietnam.
Now add to this challenge the learning curves of marketing and
advertising Pepsi products. What it takes to sell your product in
the United States will not necessarily get you the results you
want in Vietnam. Hundreds of differences and pitfalls are lurking
out there. For example, you must be careful that your slogan,
“Come alive with the new Pepsi generation,” does not get trans-
lated mistakenly as “Pepsi will bring your ancestors back from
the dead,” which actually happened in one of its ads that was
translated into Chinese.
Finally, do all the investments of anticipatory change associated
with going for growth in emerging markets deliver company
results immediately? No. Coke followed Pepsi into Vietnam only
a year or two later, and the distance between them initially
seemed small. However, when Pepsi entered into the fat part of
the learning curve, the benefits of its anticipatory change
became more evident. Today, Pepsi rules the economically
vibrant southern part of Vietnam. Coke is taking refuge in the
north. Who will ultimately win this competition? It is hard to
say, but Pepsi made the early anticipatory moves and continues
to enjoy the lead.
Final Thoughts
Let’s finish Leading Strategic Change with a few final thoughts.
First, even though we spent a good part of this chapter discuss-
ing anticipatory change, it is not the only approach to change.
Furthermore, none of us spends all of our time in the world of
anticipatory change. We may well slip unintentionally into reac-

Chapter 12 • Getting Ahead of the Change Curve 187
tive change or find ourselves thrust into a change crisis. To make
sure that there is no misunderstanding, the principles of Leading
Strategic Change work as well in reactive and crisis change set-
tings as they do for anticipatory change.
However, we concluded this final chapter with a discussion of
anticipatory change for a specific reason. Because anticipatory
change is the most difficult, that is where the supply of success-
ful change leaders is the smallest. Also, because anticipatory
change is where the potential payoffs are the biggest, that is
where demand for successful change leaders is the greatest.
From our extensive consulting work and research, the conclu-
sion is clear. Anticipatory change leaders are in great demand
and extremely short supply.
Demand outstripping supply is the most powerful reason for
mastering the art and science of remapping change. In this book,
we have shared some powerful principles of change that can help
you break through the brain barriers of failure to see, failure to
move, and failure to finish. In the previous three chapters, we
have supplied you with concrete, practical tools to become a
master mapmaker at work. The key to breaking through the
brain barriers to change lie not just in grasping the principles,
but also in applying them in practice.
To put these principles into practice, they must become per-
sonal. To help illustrate this, consider the following. Hal’s father
was one of those old-time dads who could fix anything. To do
this, he studied the principles of electricity, mechanics, fluids,
and construction. When it came time to fix a diesel engine, gaso-
line engine, or refrigerator motor, he was a master at putting the
principles into practice. His shop was full of almost every tool
you could imagine—and some you couldn’t. The ones you
couldn’t imagine were those he created himself. Because he
understood what needed to be fixed and how to fix it well, when
the right tool wasn’t commercially available, he made it. Simi-

L e a d i n g S t r a t e g i c C h a n g e188
larly to Hal’s father, we hope not only that you can master these
principles and practices for breaking through the change barri-
ers, but also that you can create unique tools for the specific
demands faced in your change initiatives.
To finish our journey, then, let’s go back to the beginning. Strate-
gic change starts from the inside out. We change individuals by
remapping minds so they can conceive, believe, and achieve a
new destination. By changing individuals, we change organiza-
tions. That’s our core conviction, reflected in the Leading Stra-
tegic Change principles. As a leader in today’s highly
unpredictable business terrain, you now have the tools to
become an even more accomplished mental cartographer—a
Master Map Maker in a world full of change.

189
Index
Page numbers in italics refer to illustrations.
Numerics3D growth cube, 119, 119, 121, 147–48,
1496 Sigma, 18
AAccomplishment, 84Achievement, 84, 111, 111–12, 162Achieving change, 165–75Achieving growth, 126–34Amazon.com, 40, 121–22American Express, 146Anticipatory change, 178, 179, 180,
183–87Approval, 84ARCTIC approach, 83–85, 161, 162AT&T, 20Australia, map of, 41, 42, 55
BBarnes & Noble, 36, 38, 39, 40Barriers. See Brain barriersBaseline measures, 101–2Behaviors, changes in, 91–94, 106,
155–57, 166–69
Believing, 76–86, 111, 111–12Believing in change, 153–63Believing in growth, 122–26“Believing is seeing”, 94, 100Belonging, 84Bezos, Jeff, 40Black & Decker, 20Black, Stewart, 59, 80Bossidy, Larry, 136Boston, map of, 27, 28Brain barriers, 2, 6–8
breaking, 13–15keys to finishing, 105–12,
126–27, 131–33, 166–75keys to moving, 70, 75–86,
103, 153–63keys to seeing, 45–61, 48,
139–52tools for, 151, 151–52
failure to finish, 89–103, 105–12, 133
failure to move, 63–74, 76–77, 85–86, 112, 133, 153–63
failure to see, 17–44, 112, 131, 139–52
Burke, Steven, 119–20
CCalifornia, map of, 22, 23–24Canon, 66

I n d e x 190
Caterpillar, 20CBAs of change, 111, 111, 139Central position maps, 33–36Champions, actions of, 167–68Champions of change, 106–9, 133–34,
166–69, 167, 168Change. See also Strategic change
achieving, 165–75in behaviors, 91–94, 106, 155–57,
166–69believing in, 153–63CBAs of, 111, 111, 139champions of, 106–9, 133–34,
166–69, 167, 168conceiving, 135–52contrast, 52–53, 53costs of, 180, 182difficulty of, 179, 180, 181–84effort, 95–99fundamentals of, 10–15individuals, 2, 85–86, 91–94, 137–
38, 188learning curves, 184, 185need for, 20, 26, 139, 146, 152, 154organizational change, 2, 85–86,
91–94, 137–38, 188rate of, 3–4resistance to, 3, 6, 65, 74, 78, 85–
86, 91of routine, 144–45stages of, 13, 111, 111timing of, 177–88
anticipatory tactics, 178, 179, 180, 187–87
crisis tactics, 178, 179, 180, 180–82, 187
reactive tactics, 178, 179, 180, 182–83, 186–87
toolkit for, 137, 139tools for, 187–88
Charting progress, 109–10, 133–34, 169–74, 172
Chenault, Kenneth, 146China, map of, 33, 34Coca-Cola, 184, 186
Communication plan, 109–10, 172–74, 174
Competence, 70, 73, 84Competition, 84Complexities, 49, 51, 52Comprehensiveness mistake, 49–50Conceiving change, 135–52Conceiving growth, 114–22Conceptual thinking, 84, 111, 111–12,
162Confrontation, 47–58
contrast and, 47–51, 48, 58, 146–52
creating, 54–58levels of, 47–48, 55steps for, 58
Contrast, 46–47circles of, 46, 46–47confrontation and, 47–51, 48, 58,
146–52core areas of, 51–53, 53, 146–47,
147, 155–57creating, 51–54critical factors, 148, 148, 151–52levels of, 47–48, 52–53, 53, 55new maps, 53–54, 54, 124–26old maps, 53–54, 54, 139–40past and present, 47, 49seeking, 140
Control, 84, 162Coordination, 84Core contrasts, 51–53, 53, 146–47, 147,
155–57Cortés, Hernán, 23Crisis change, 178, 179, 180, 181–82,
187Critical contrast, 148, 148, 151–52Cross-functional teams, 72Customers, existing, 115, 115–20, 116,
117, 118, 150
DDahlvig, Anders, 25Defining situations, 155–57, 156Dell Computer, 127–34

Index 191
Denial, 20–21, 31Destination, seeing clearly
movement, 76–81, 154–61strategic change, 188
Differences, 49Disney stores, 119–20, 121Distorted maps, 27–33, 117Distortion, problems with, 27, 29–30
EEconomies of scale, 131Economies of scope, 122Effort, and rewards, 95–99, 108Existing customers/products, 115, 115–
20, 116, 117, 118, 150Expectancy theory, 76–77Exploration, 84
FFailure to finish, 89–103
breaking through, 103, 126–27, 131–33, 166–75
getting lost, 99–103keys to finishing, 105–12tiredness, 91–99, 99
Failure to move, 63–74breaking through, 70, 74, 112,
131–33, 153–63expectancy theory, 76–77keys to moving, 75–86rewards and, 85–86
Failure to see, 17–44breaking through, 47–48, 48, 58,
112, 131–33, 139–52keys to seeing, 45–61matrix, 21mental maps, 26
Faith, 95–100Federal Express, 123–26Finishing, keys to, 105–12, 133–34,
166–75Frameworks, 9–10, 13Fuji, 66
GGE, 19, 115, 136Gerstner, Lou, 12, 72Global leadership capabilities, 58–59Gohen, Carlos, 178Gregersen, Hal, 3–4, 60, 149, 187–88Grove, Andy, 136, 179Growth, 84, 113–34
3D cube, 119, 119, 121, 147–48, 149
achieving, 126–34believing, 122–26conceiving, 114–22cube model, 121maps for, 118, 118–19tools for, 148, 150
Gutierrez, Carlos, 32
HHabit, creatures of, 145Head smacking, 60–61, 149Heads-up display, 169–70High-iQ leaders, 140, 145Honeywell, 136
IIBM, 11, 12–13, 20, 66–68, 72, 181Identifying situations, 155–57, 156“I get it” mistakes, 50–51, 54–55, 77IKEA, 24–26, 33–34Improvement, 84, 162Incentives, 82–83, 92, 93. See also
RewardsIncompetence, 70–73Individuals, changing, 2, 85–86, 91–94,
137–38, 188Inescapable experiences, 55–58Influence, 84Information systems, 92Innovation, masters of, 145Inquisitiveness (iQ), 140–45
enhancing, 141, 144–45example of, 143–44high-iQ leaders, 140, 145

I n d e x 192
Inquisitiveness (iQ) (cont.)low-iQ leaders, 140, 145questionnaire, 141–42
Integrated solution units (ISUs), 12–13, 67, 72
Intel, 19, 136, 179International assignments, 59–60Inventory, 127–28iQ (inquisitiveness), 140–45
enhancing, 141, 144–45example of, 143–44high-iQ leaders, 140, 145low-iQ leaders, 140, 145questionnaire, 141–42
ISUs (integrated solution units), 12–13, 67, 72
KKeebler Company, 118Kellogg’s, 30, 30–32, 117–18Kmart, 20, 178Knowledge transfer, 138
LLaunch sites, 108Leadership capabilities, 58–59Learning curves, 184, 185Living to learn, 144, 145Lost, becoming, 99–103Low-iQ leaders, 140, 145Lucent, 20
MManagerial maps, 58, 60Maps
of Australia, 41, 42, 55of California, 22, 23–24of contrast, 53–54, 54, 124–26distorted maps, 27–33, 117of growth, 118, 118–19managerial maps, 58, 60mental maps, 2, 7
brain barriers, 5, 7–8, 24–26
changing, 41, 43–44, 52, 58, 117, 119, 122, 131, 146
failure to see, 26head smacking, 60–61, 149questioning, 140shock, 58success, 21–23, 41, 43, 94,
112mistaken maps, 26–43new maps
contrast, 53–54, 54, 124–26destination, 68–69effort, 95–99understanding, 78–79
old mapscontrast, 53–54effort, 95–99understanding, 78
organizational maps, 58strip maps, 36–41, 37, 39successful maps, 21–23, 41, 43, 94,
112of United States, 22, 28, 29, 42upright maps, 41–43, 55
Market shifts, 51–52, 64–65Measurement of progress, 170–72, 171Mental maps, 2, 7
brain barriers, 5, 7–8, 24–26changing, 41, 43–44, 52, 58, 117,
119, 122, 131, 146head smacking, 60–61, 149questioning, 140shock, 58success, 21–23, 41, 43, 94, 112
Merrill Lynch, 20Mistaken maps, 26–43Mistakes
comprehensiveness mistakes, 49–50
“I get it” mistakes, 50–51, 54–55, 77
Money, and motivation, 82–83Morrison, Allen, 58–59Motivation
low levels of, 77money, 82–83

Index 193
movement, 82, 85–86, 157, 161rewards and, 85–86
Motorola, 18–21, 24Movement, motivation for, 82, 85–86,
157, 161Moving, keys to, 75–86, 112, 133, 153–
63
NNeeds, of people
motivation, 161, 162progress, 109rewards, 82, 83–85
Negative consequences, 166–68New maps
contrast, 53–54, 54, 124–26destination, 68–69effort, 95–99understanding, 78–79
Nissan, 178Nokia, 19, 24
OOld maps
contrast, 53–54effort, 95–99understanding, 78
OneCall, 124–25Opportunities, seeing, 114OptiPlex, 127–28Ordering process, 128–29Organizational change, 2, 85–86, 91–
94, 137–38, 188Organizational maps, 58
PPepsi, 184, 186Performance dashboard, 169–70, 170Performance reports, 133–34Practice, 136–37Praise, as reward, 83, 109Principles into practice, 136, 138–39,
187–88
Problem recognition, 126–27Problem solving, 84Products, existing, 115, 115–20, 116,
117, 118, 150Proficiency, lack of, 166–68Progress, charting, 109–10, 133–34,
169–74, 172Progress, measuring, 170–72, 171
QQuadQ, 51–57, 146, 151
RReactive change, 178, 179, 180, 182–
83, 186–87Relations, 84, 162Reorganization, 93Repetition, 55, 56–58Requisition forms, 128–30Resisting change, 3, 6, 65, 74, 78, 85–
86, 91Resources
for believing, 79–81chart of, 158–60for destinations, 79–81, 157–60supplying, 81
Return on investments (ROIs), 98, 99Rewards, 81–86, 92, 93
efforts, 95–99, 108motivation, 82, 85–86, 157, 161praise, 83, 109
Riggio, Lennie, 36, 38, 40Ritchie, J. Bonner, 143–44ROIs (return on investments), 98, 99Routines, changing, 144–45Rubber-meets-the-road behaviors, 166
SSamsung Electronics, 56–57Scalable ordering, 122“Seeing is believing”, 94, 100Seeing, keys to, 45–61, 112, 131–33,
139–52

I n d e x 194
Sight barrier, 48. See also Failure to seeSituations, identifying, 155–57, 156Solutions, 12, 67, 72Sound barrier, 6, 6Strategic change. See also Change
achieving, 165–75believing in, 153–63challenge of, 1–15conceiving, 135–52fundamentals of, 10–15“individual out” approach, 2, 188matrix, 10, 11, 21“organization in” approach, 2, 188stages of, 13success, 27toolkit for, 137, 139
Strip maps, 36–41, 37, 39Successful maps, 21–23, 41, 43, 94, 112
TTargets, seeing clearly
movement, 76–81, 154–61strategic change, 188
Teaching others, 136, 137, 138Test cases, 108Thinking, 84, 111, 111–12, 162Thoman, Rick, 66–68, 72, 181Timing of change, 177–88
anticipatory tactics, 178, 179, 180, 183–87
crisis tactics, 178, 179, 180, 180–82, 187
reactive tactics, 178, 179, 180, 182–83, 186–87
Tiredness, 91–99, 99
Toolkit, for change, 137, 139Tools
for breaking brain barriers, 151, 151–52
for change, 187–88for growth, 148, 150
Trust, of employees, 94–95Tucker, Laurie, 124–25
UUnited States, maps of, 22, 28, 29, 42Upright maps, 41–43, 55
VValues
motivation, 161, 162progress, 109reactive tactics, 83–85rewards, 82
Visions, 26of destination, 154–61growth and, 131–33movement and, 68–71, 74, 76–81,
86–87strategic change, 188
WWelch, Jack, 115, 136
XXerox, 11, 20, 66, 72, 181


8 reasons why you shouldread the Financial Times for
4 weeks RISK-FREE!
To help you stay current with significant developments in the world economy ...
and to assist you to make informed business decisions — the Financial Times brings you:
❶ Fast, meaningful overviews of international affairs ... plus daily
briefings on major world news.
❷ Perceptive coverage of economic, business, financial and political
developments with special focus on emerging markets.
❸ More international business news than any other publication.
❹ Sophisticated financial analysis and commentary on world market
activity plus stock quotes from over 30 countries.
❺ Reports on international companies and a section on global investing.
❻ Specialized pages on management, marketing, advertising and
technological innovations from all parts of the world.
❼ Highly valued single-topic special reports (over 200 annually)
on countries, industries, investment opportunities, technology and more.
❽ The Saturday Weekend FT section — a globetrotter’s guide to
leisure-time activities around the world: the arts, fine dining, travel,
sports and more.

The Financial Times delivers a world of business news.
Use the Risk-Free TrialVoucher below!To stay ahead in today’s business world youneed to be well-informed on a daily basis.And not just on the national level.You needa news source that closely monitors theentire world of business, and then delivers itin a concise, quick-read format.
With the Financial Times you get the majorstories from every region of the world. Reports found nowhere else. You get business,management, politics, economics, technology and more.
Now you can try the Financial Times for 4 weeks, absolutely risk free. And betteryet, if you wish to continue receiving the FinancialTimes you’ll get great savings offthe regular subscription rate. Just use the voucher below.
4 Week Risk-Free Trial VoucherPlease send me the Financial Times for 4 weeks (Monday through Saturday)Risk-Free, and details of special subscription rates in my country.
Name___________________________________________________________________
Company________________________________________________________________
Address _________________________________________❏ Business or ❏ Home Address
Apt./Suite/Floor ____________________City _________________State/Province_____
Zip/Postal Code_____________________Country _______________________________
Phone (optional) ______________________E-mail (optional)______________________
Limited time offer good for new subscribers in FT delivery areas only. To order contact Financial Times Customer Service in your area (mention offer SAB01A).
The Americas: Tel 800-628-8088 Fax 845-566-8220 E-mail: [email protected]
Europe: Tel 44 20 7873 4200 Fax 44 20 7873 3428 E-mail: [email protected]
Japan: Tel 0120 341-468 Fax 0120 593-146 E-mail: [email protected]
Korea: E-mail: [email protected]
S.E. Asia: Tel 852 2905 5555 Fax 852 2905 5590 E-mail: [email protected]
Yes!
www.ft.com

Where to find tomorrow’s best business and technology ideas. TODAY.
• Ideas for defining tomorrow’s competitive strategies — and executing them.
• Ideas that reflect a profound understanding of today’s global business realities.
• Ideas that will help you achieveunprecedented customer and enterprise value.
• Ideas that illuminate the powerful new connections between business and technology.
ONE PUBLISHER.
Financial TimesPrentice Hall.
ft-ph.comFast access to all Financial TimesPrentice Hall business books currently available.
InformIt.comYour link to today’stop business and technologyexperts: new content, practicalsolutions, and the world’s bestonline training.
Business-minds.comWhere the thought leaders of the business world gather to share key ideas, techniques,resources — and inspiration.
WORLD BUSINESS PUBLISHER
AND 3 GREAT WEB SITES: