Lawrence Erlbaum Associates (Taylor & Francis...
38
Lawrence Erlbaum Associates (Taylor & Francis Group) Examining the Effects of Different Multiple Representational Systems in Learning Primary Mathematics Author(s): Shaaron Ainsworth, Peter Bibby, David Wood Source: The Journal of the Learning Sciences, Vol. 11, No. 1 (2002), pp. 25-61 Published by: Lawrence Erlbaum Associates (Taylor & Francis Group) Stable URL: http://www.jstor.org/stable/1466720 Accessed: 19/11/2009 18:10 Your use of the JSTOR archive indicates your acceptance of JSTOR's Terms and Conditions of Use, available at http://www.jstor.org/page/info/about/policies/terms.jsp. JSTOR's Terms and Conditions of Use provides, in part, that unless you have obtained prior permission, you may not download an entire issue of a journal or multiple copies of articles, and you may use content in the JSTOR archive only for your personal, non-commercial use. Please contact the publisher regarding any further use of this work. Publisher contact information may be obtained at http://www.jstor.org/action/showPublisher?publisherCode=lebtaylorfrancis. Each copy of any part of a JSTOR transmission must contain the same copyright notice that appears on the screen or printed page of such transmission. JSTOR is a not-for-profit service that helps scholars, researchers, and students discover, use, and build upon a wide range of content in a trusted digital archive. We use information technology and tools to increase productivity and facilitate new forms of scholarship. For more information about JSTOR, please contact [email protected]. Lawrence Erlbaum Associates (Taylor & Francis Group) is collaborating with JSTOR to digitize, preserve and extend access to The Journal of the Learning Sciences. http://www.jstor.org
Transcript of Lawrence Erlbaum Associates (Taylor & Francis...
Lawrence Erlbaum Associates (Taylor & Francis Group)
Examining the Effects of Different Multiple Representational Systems in Learning PrimaryMathematicsAuthor(s): Shaaron Ainsworth, Peter Bibby, David WoodSource: The Journal of the Learning Sciences, Vol. 11, No. 1 (2002), pp. 25-61Published by: Lawrence Erlbaum Associates (Taylor & Francis Group)Stable URL: http://www.jstor.org/stable/1466720Accessed: 19/11/2009 18:10
Your use of the JSTOR archive indicates your acceptance of JSTOR's Terms and Conditions of Use, available athttp://www.jstor.org/page/info/about/policies/terms.jsp. JSTOR's Terms and Conditions of Use provides, in part, that unlessyou have obtained prior permission, you may not download an entire issue of a journal or multiple copies of articles, and youmay use content in the JSTOR archive only for your personal, non-commercial use.
Please contact the publisher regarding any further use of this work. Publisher contact information may be obtained athttp://www.jstor.org/action/showPublisher?publisherCode=lebtaylorfrancis.
Each copy of any part of a JSTOR transmission must contain the same copyright notice that appears on the screen or printedpage of such transmission.
JSTOR is a not-for-profit service that helps scholars, researchers, and students discover, use, and build upon a wide range ofcontent in a trusted digital archive. We use information technology and tools to increase productivity and facilitate new formsof scholarship. For more information about JSTOR, please contact [email protected].
Lawrence Erlbaum Associates (Taylor & Francis Group) is collaborating with JSTOR to digitize, preserve andextend access to The Journal of the Learning Sciences.
http://www.jstor.org
THE JOURNAL OF THE LEARNING SCIENCES, 11(1), 25-61 Copyright C 2002, Lawrence Erlbaum Associates, Inc.
Examining the Effects of Different Multiple Representational Systems in
Learning Primary Mathematics
Shaaron Ainsworth, Peter Bibby, and David Wood Economic and Social Research Council Centre for Research in
Development, Instruction, and Training University of Nottingham
Multi-representational learning environments are now commonplace in schools and homes. Research that has evaluated the effectiveness of such environments shows that learners can benefit from multiple representations once they have mastered a number of complex tasks. One of the key tasks for learning with multiple representa- tions is successful translation between representations. In order to explore the factors that influence learners' translation between representations, this article presents 2 ex- periments with a multi-representational environment where the difficulty of translat- ing between representations was manipulated. Pairs of pictorial, mathematical, or mixed pictorial and mathematical representations were used to teach children in 1 of 3 experimental conditions aspects of computational estimation. In Experiment 1, all children learned to become more accurate estimators. Children in the pictorial and the mathematical conditions improved in their ability to judge the accuracy of their esti- mates, but children in the mixed condition did not. Experiment 2 explored if the mixed condition's difficulties with translation were temporary by requiring additional time to be spent on the system. It was found that children in all the experimental conditions improved in theirjudgments of estimation accuracy. It is argued that the mixed condi- tion's failure to improve in Experiment I was due to the difficulties they experienced in translating information between disparate types of representation. Their success in Experiment 2 was explained not by learning to translate between representations, but through the adoption of a single representation that contained all the necessary infor- mation. This strategy was only effective because of the way that information was dis- tributed across representations.
Correspondence and requests for reprints should be sent to Shaaron Ainsworth, ESRC Centre for Re- search in Development, Instruction and Training, School of Psychology, University of Nottingham, University Park Nottingham, UK NG7 2RD E-mail: [email protected]
26 AINSWORTH, BIBBY, WOOD
The use of multiple external representations (MERs) to support learning is widespread in traditional classroom settings and in computer-based environments. For instance, percentages and fractions such as 33% or 1/3 are often presented to children alongside a drawing of a pie chart with one third shaded. Learners are given algebra word problems or early reading books that contain pictures. Geome- try software packages such as Geometry Inventor (LOGAL / Tangible Math) al- low tables and graphs to be dynamically linked to geometrical figures.
A number of researchers have designed computer-based environments to ex- ploit the advantages that MERs can contribute to developing students' understand- ing. One area that has seen particular activity of this kind is the teaching of mathematical function. For example, Function Probe (Confrey, 1991) provides graphs, tables, algebra, and calculator keystroke actions to help students come to understand the concept of function. Using MERs, it aims to help learners develop deep understanding by considering aspects of function such as field of applicabil- ity, rate of change, and patterns (e.g., Confrey & Smith, 1994; Confrey, Smith, Piliero, & Rizzuti, 1991). Each of the representations is designed to support spe- cific activities. For example, the graph window supports the qualitative explora- tion of aspects such as shape and direction, whereas the table window can be used to introduce a more explicit expression of the covariational approach to functions. Function Probe supports an understanding of the relation between these represen- tations by allowing students to pass functions between the different windows and by encouraging them to grasp the convergence across representations.
A similar approach to the teaching of functions can be seen in the "Visual Math- ematics" curriculum (e.g., Yerushalmy, 1997). Again, emphasis is placed on the use of MERs, and particularly graphical representations. This showed how stu- dents could come to understand functions of two variables by using a com- puter-based environment that allowed them to construct, reason with, and explain MERs. Brenner et al. (1997) showed that students could be successfully taught both to represent function problems in MERs and to translate between representa- tions such as tables and graphs.
Cognitive science and mathematics education perspectives provide an expla- nation of the benefits of these specific applications of MERs to teach functions. For example, Larkin and Simon (1987) contrasted informationally equivalent di- agrammatic and sentential representations in terms of search, recognition, and inference. They concluded that diagrams are searched more efficiently; do not have the high cost of perceptual enhancement associated with sentential repre- sentations; and exploit perceptual processes thus making recognition easier. Given that representations differ so fundamentally, it is clear that the use of MERs can be beneficial. By combining different representations with different computational properties, learners are not limited by the strengths and weak- nesses of one particular representation.
EXAMINING MULTI-REPRESENTATIONAL SYSTEMS 27
However, this is only one of the reasons to use MERs. Ainsworth (1999) pro- posed a functional taxonomy of MERs. She identified seven different uses of MERs in educational software that fall into three primary classes --complement, constrain, and construct. The first class is the use of representations that contain complemen- tary information or support complementary cognitive processes. For example, the Larkin and Simon (1987) example described above corresponds to this use ofrepre- sentations. In the second, one representation is used to constrain possible (mis)inter- pretations in the use of another. For example, simulation environments often provide a familiar concrete representation to help learners interpret a less familiar or abstract representation. Finally, MERs can be used to encourage learners to con- struct a deeper understanding of a situation. For example, Kaput (1989, pp. 179-180) proposed that "the cognitive linking of representations creates a whole that is more than the sum of its parts...it enables us to see complex ideas in a new way and apply them more effectively." Dienes (1973) argued that perceptual variability (the same concepts represented in varying ways) provides learners with the opportu- nity to build abstractions. In cognitive flexibility theory (e.g., Spiro & Jehng, 1990) the ability to construct and switch between multiple perspectives of a domain is fun- damental to successful learning. Mayer (e.g., Mayer & Anderson, 1992; Mayer & Sims, 1994) described a theory ofmulti-media learning, which showed that students gain better problem solving and conceptual knowledge when they are presented with both text and pictures. In all these cases, for learners to achieve the maximum bene- fits ofMERs, they must come to understand not only how individual representations operate, but also how the representations relate to each other. The latter constitutes a unique contribution to learning that MERs can make.
Although the coordination of representations provides an additional benefit in certain learning situations, previous research has shown that the ability to translate between representations differs markedly between experts and novices. Tabachneck, Leonardo, and Simon (1994) reported that novices learning with MERs in economics did not attempt to translate information between line graphs and written information. This contrasted with expert performance where graphical and verbal explanations were intimately bound together. Apparently, the deeper knowledge of the experts facilitated the ability to integrate the different represen- tational formats. Kozma, Chin, Russel, and Marx (2000) discussed how expert chemists can be distinguished from novice chemists by their integrated multi-rep- resentational understanding of chemical phenomena that allows experts to trans- late from one representational format to another. The behavior of these experts contrasts with the research of Schoenfeld, Smith, and Arcavi (1993), who studied a student learning to understand functions using the Grapher environment. They de- scribed in detail the mappings between the algebraic and graphical representations in this domain. They showed how a student could appear to have mastered funda- mental components of a domain terms of either algebra or graphs. However, her behavior with the representations was often inappropriate, as she had not inte-
28 AINSWORTH, BIBBY, WOOD
grated her knowledge across them. Schoenfeld et al.'s microgenetic analysis re- vealed both the complexity of the mappings that can exist between representations and the problems that can ensue when those mappings are not made.
Teaching learners to coordinate MERs has also been found to be a far from trivial activity (de Jong et al., 1998). Yerushalmy (1991) examined the understanding of functions by 35 fourteen-year-olds after an intensive 3 month course with multi-rep- resentational software. In total, only 12% of students gave answers that involved both visual and numerical considerations. Furthermore, children who used two rep- resentations were just as error prone as those who used a single representation.
If a learner is unable to translate, or has difficulty mapping their knowledge be- tween representations, then the unique benefits of MERs may never arise. One way to examine the importance of the translation between representations is to ma- nipulate the extent to which different pairs of representations can influence the translation process. To do this, we need to understand how representations can dif- fer. First, they can differ in terms of the information expressed. Second, they can differ in the way that the information is presented. These levels are often referred to as the represented and representing worlds (Palmer, 1978).
This article reports two studies that examine the use of MERs, varying the de- gree of similarity in the representing world and holding constant the information in the represented world. This is achieved in the context of a computer-based system that supports children learning estimation.
SYSTEM DESCRIPTION
The computer-based learning environment (Computational Estimation Nota- tion-Based Teaching System; CENTS) used in these experiments supports children in learning to understand computational estimation. Computational estimation can be defined as the process of simplifying an arithmetic problem using some set of rules or procedures to produce an approximate but satisfactory answer through mental calculation (Dowker, 1992). Estimation is not only a useful skill in its own right but has also been implicated in developing number sense (Sowder, 1992).
CENTS is designed to help 9- to 12-year-old children learn some of the basic knowledge and skills required in the successful performance of computational es- timation. It acts as an environment for children to practice and reflect upon their estimation skills. The central pedagogical goal is to encourage learners to under- stand how transforming numbers affects the accuracy of answers when estimating. This focus stems from recognition of the importance of this knowledge in develop- ing estimation skills and number sense (e.g., Trafton, 1986). It is a fundamental component for judging the appropriateness of an estimate (LeFevre, Greenham, & Waheed, 1993; Sowder & Wheeler, 1989) and is necessary if post-compensation (adjusting an estimate to make it more accurate) is to be used. However, LeFevre et
EXAMINING MULTI-REPRESENTATIONAL SYSTEMS 29
al. (1993) found this knowledge was underdeveloped in children's views of esti- mation. A computer-based environment is ideal for supporting the development of this knowledge as immediate feedback can be given which is contingent upon stu- dents' own estimates.
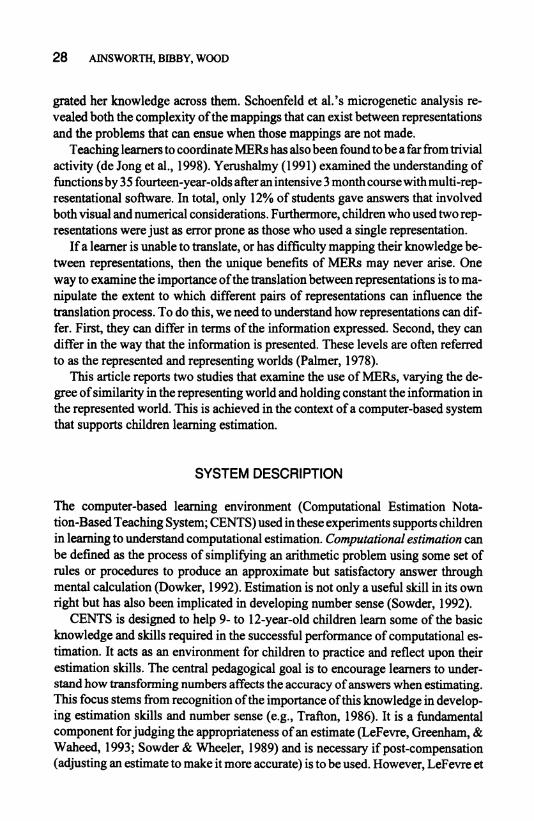
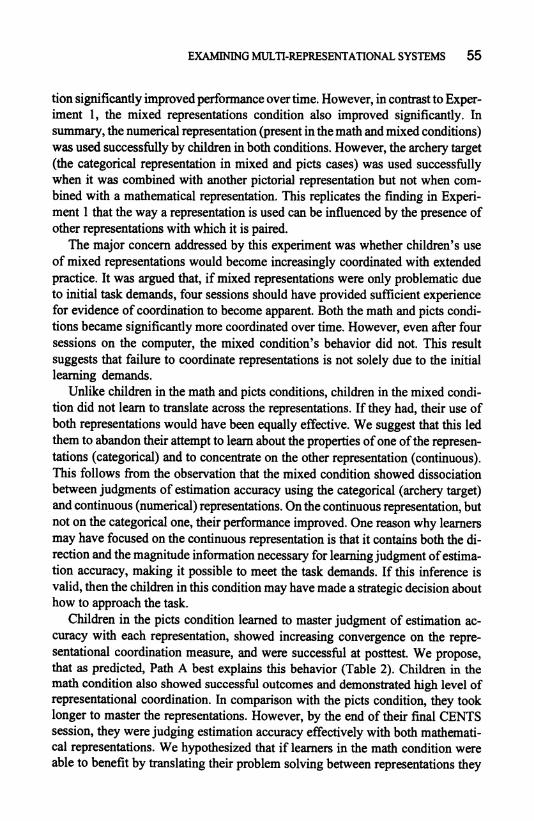
CENTS supports a number of estimation strategies identified by previous re- search (e.g., Reys, Rybolt, Bestgen, & Wyatt, 1982). Only two are used in the cur- rent study: rounding and truncation. With rounding, numbers are transformed to the nearest multiple of 5, 10, 100, and so forth, and then the appropriate arithmetic operation is applied. For example, 19 x 69 could be rounded to 20 x 70 (see upper LHS of Figure 1). Truncation involves substituting a new value for the right-most digit(s). Using the same example, 19 x 69 can be truncated to 10 x 60 (see upper RHS of Figure 1). These strategies were selected in accordance with teachers' wishes and the National Curriculum (England and Wales).
CENTS promotes the predict-test-explain cycle that has been found to produce better understanding in science education (e.g., Howe, Rodgers, & Tolmie, 1990). Using MERs, learners make predictions about a particular estimate, perform the estimation, and then have the opportunity to examine the results of the estimation process in the light of their predictions. After each problem, children log the results of (at least) two different estimation strategies in an on-line workbook. They de- scribe how they transformed the numbers, whether the estimate is accurate, and how difficult they found each estimation process. At the end of a session, children are encouraged to review the logbook to investigate patterns in their estimates.
il~uirit~ainq
S --7----- ---
Zeros
Answer 1400
trur~cation
E {tka 19 X 69
Zeros
Answer 600
no T
spo a w I
1410 500
I 600 1400 600a
FIGURE 1 An illustration of a completed problem using pictorial representations.
30 AINSWORTH, BIBBY, WOOD
Using CENTS
A typical sequence illustrated for one strategy (rounding) is as follows:
Given the problem-estimate 19 x 69
1. Produce the intermediate solution. Round to 20 x 70
2. Predict the accuracy of your estimate based on the intermediate solution. Rep 1. Higher and close to the exact answer Rep 2. Close to the exact answer
Note. Depending on the representations used this prediction will be performed using either numerical values or by selecting part of a picture (e.g., placing the cross on the splatwall). 3. Multiply the "extracted" digits.
2x 7=14 4. Adjust place value.
(1)0 x (1)0 = (1)00 5. Respond.
1400 6. Receive feedback on the accuracy of the estimate. This allows you to also
evaluate your judgment of the estimate's accuracy. Note. Depending on the representations, feedback is provided using either nu- merical values or by indicating part ofa picture (e.g., the splat on the splatwall).
Help is provided upon error or by request by the computer at stages 1, 3, and 4 to ensure that students do not fail due to slips or number fact errors (e.g., a times table square is available to help with multiplication).
REPRESENTATIONS IN CENTS
CENTS was used in the present studies to assess how different combinations of rep- resentations may affect the process and outcomes of learning. Multiple representa- tions are used both for display (to illustrate the accuracy of accurate children's esti- mates) and for action (children predict how accurate they judge their estimate to be). All representations are based on the percentage deviation of the estimate from the exact answer ([estimate - exact answer / exact answer] x 100), which captures both direction and magnitude differences. This is a common measure of the accu- racy of estimates (e.g., Dowker, 1992). No matter how the surface features of the representations differ, the deep structure is always based on this relationship.
EXAMINING MULTI-REPRESENTATIONAL SYSTEMS 31
Representations can differ in two ways, either in the information they express or in the way that this information is presented, that is, the represented and repre- senting worlds (Palmer, 1978). In this section, we will consider how these dimen- sions may interact to produce effective learning. We start with the represented world, then the representing world, and finally integrate both levels of explanation. Particular attention is paid to the ease with which each combination of representa- tions supports translation.
Represented World
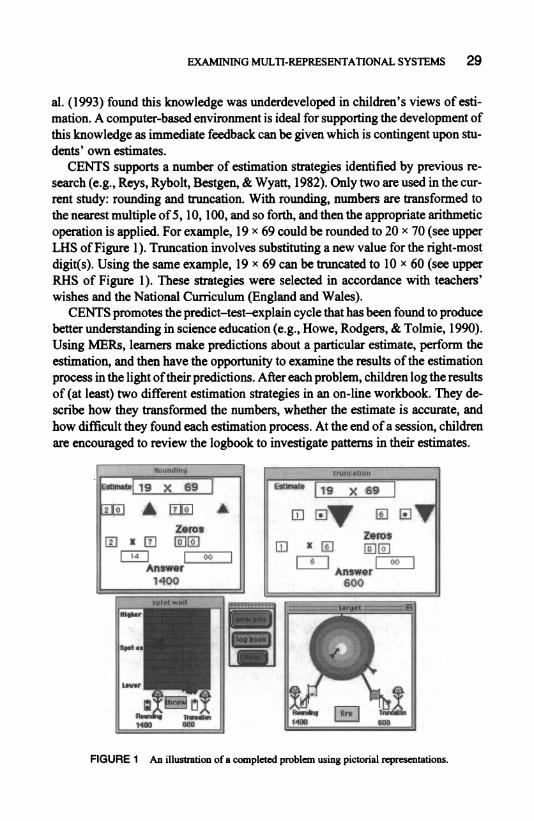
The information represented in CENTS varies along two dimensions-the amount of information (representations can display direction or magnitude sepa- rately or can display both dimensions simultaneously), and the resolution of in- formation (either categories of 10% or continuous representations accurate to 1%). Furthermore, in terms of informational content, combinations of represen- tations can be either fully redundant (same amount and resolution of information in both representations), nonredundant (no overlap between amount and resolu- tion of information), or partially redundant (some overlap between the amount and resolution of information in both representations). In the experiments de- scribed in this article, partially redundant representational systems were used (Table 1 and Figures 2 to 4). In each pairing of representations in CENTS, one representation expressed the magnitude of estimation accuracy in 10% bands (archery target, histogram). These are referred to throughout the article as the categorical representations. The second contains direction and magnitude infor- mation with continuous resolution (splatwall, numerical display) and are called continuous representations.
Representing World
CENTS can display estimation accuracy in different ways independent of the infor- mation expressed. Representations have two basic components, their format and
TABLE 1 Representations in CENTS
Representing World Represented World
Representation Format Available Information Resolution
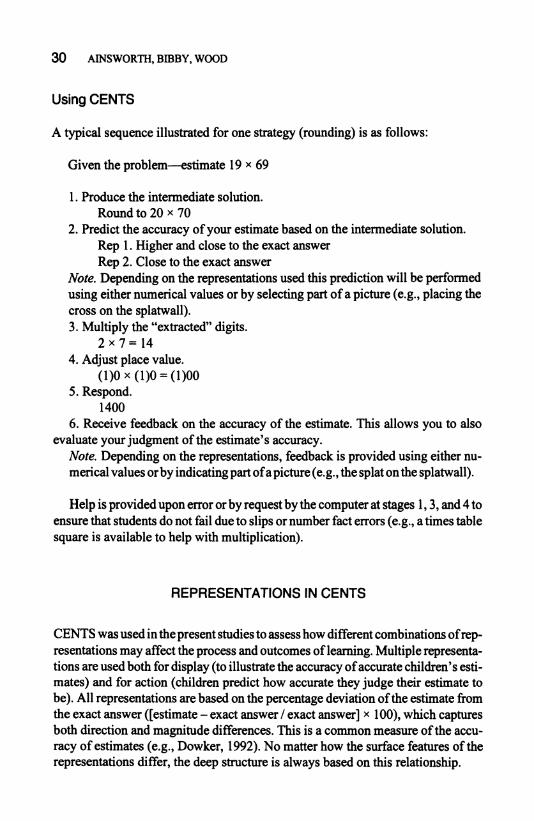
Splatwall Pictorial Direction and magnitude Continuous Numerical Mathematical Direction and magnitude Continuous Archery target Pictorial Magnitude Categorical (10%) Histogram Mathematical Magnitude Categorical (10%)
Higher
Spot on
Lover
Rounmng Trumwcion 1400 600
Roundn Trwmali6 n 1400 600
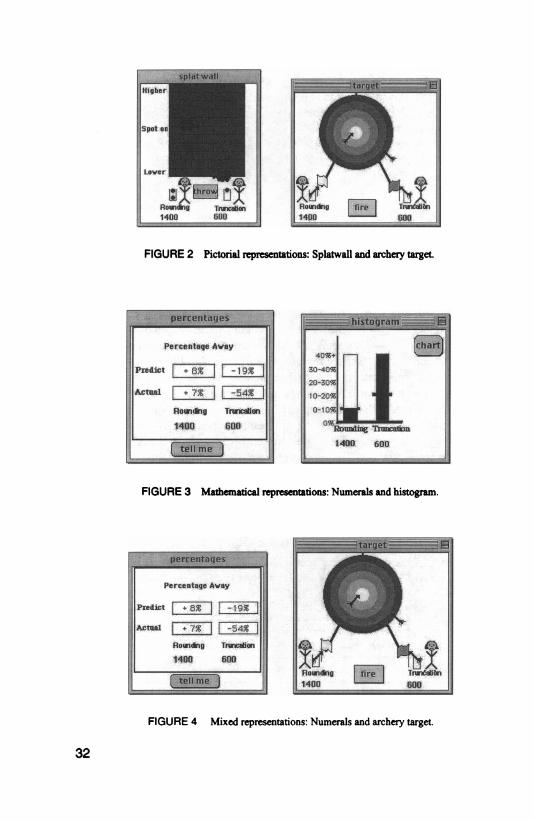
FIGURE 2 Pictorial representations: Splatwall and archery target.
Percentage Away
Predict i+5% -19%
Actual +7% -54%]
Rownig Trwcamn
1400 600
409+
30-40% I 20-30% I 10-20%, 0-10%
0% 1400 600"IdMWaM 1400 600
FIGURE 3 Mathematical representations: Numerals and histogram.
Percentage Away
Predict -19
Actua + -554.% i Roundmg Trmncaion
1400 600
[2tiatJ J Rounkng Trntbnr 1400 600
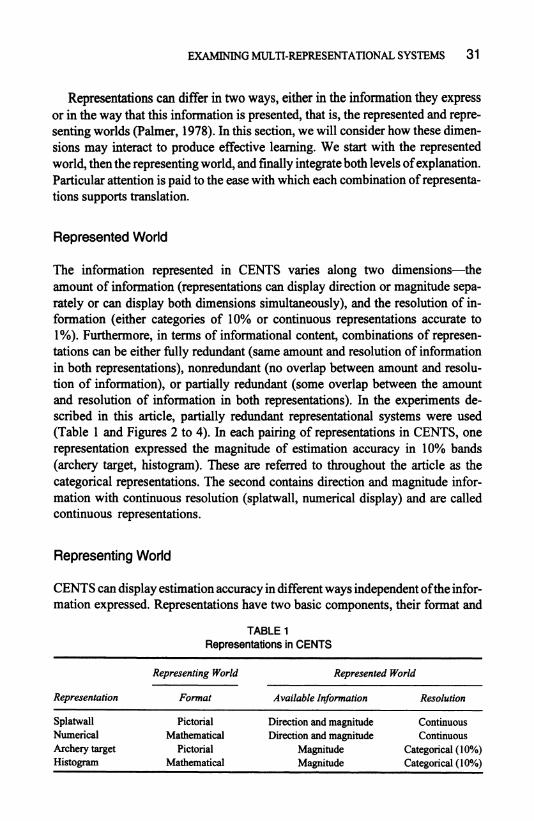
FIGURE 4 Mixed representations: Numerals and archery target.
32
EXAMINING MULTI-REPRESENTATIONAL SYSTEMS 33
operators. The format of a representation is the means by which information is pre- sented. The operators are the processes by which that information is manipulated. These factors tend to be integrated in taxonomies of representations (e.g., Lesh, Post, & Behr, 1987; Lohse, Biolsi, Walker, & Rueler, 1994). One simple but useful distinction proposed by Kaput (1987) is between ambient symbol systems, such as pictures and natural language, and other, normally school-taught representations such as graphs, tables, and schematic diagrams (referred to as mathematical repre- sentations). CENTS takes advantage of this distinction using both pictorial and mathematical representations.
The pictorial representations in CENTS are based upon the metaphor of physi- cal distance (Figure 2). The first representation is an archery target that represents magnitude information in bands of 10% deviations from the exact answer. The in- ner band, for example, represents 00/o--10%. To indicate how accurate they believe their estimate to be, users select a band in the target, which also highlights a flag with that color. The computer shoots an arrow to show the deviation of the esti- mate from the exact answer. This allows students both to see the accuracy of their estimate and to evaluate the success of their prediction of estimation accuracy. The second pictorial representation is a "splatwall" that represents both magnitude and direction information, and is continuous. The metaphor guiding its design is very similar to the archery target but includes a direction component. Children place crosses on the wall at some distance either above or below the center of the wall to represent their predictions. "Splats" are then fired to indicate the accuracy of their estimates and their predictions.
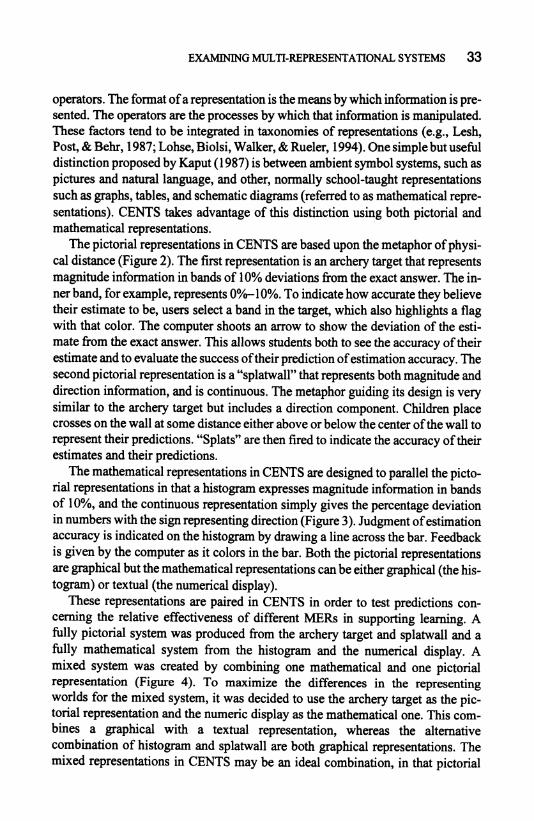
The mathematical representations in CENTS are designed to parallel the picto- rial representations in that a histogram expresses magnitude information in bands of 10%, and the continuous representation simply gives the percentage deviation in numbers with the sign representing direction (Figure 3). Judgment of estimation accuracy is indicated on the histogram by drawing a line across the bar. Feedback is given by the computer as it colors in the bar. Both the pictorial representations are graphical but the mathematical representations can be either graphical (the his- togram) or textual (the numerical display).
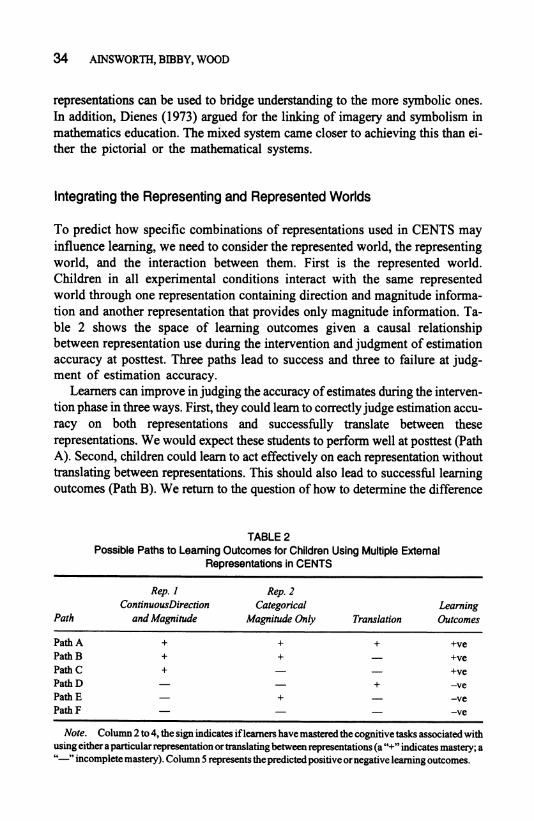
These representations are paired in CENTS in order to test predictions con- cerning the relative effectiveness of different MERs in supporting learning. A fully pictorial system was produced from the archery target and splatwall and a fully mathematical system from the histogram and the numerical display. A mixed system was created by combining one mathematical and one pictorial representation (Figure 4). To maximize the differences in the representing worlds for the mixed system, it was decided to use the archery target as the pic- torial representation and the numeric display as the mathematical one. This com- bines a graphical with a textual representation, whereas the alternative combination of histogram and splatwall are both graphical representations. The mixed representations in CENTS may be an ideal combination, in that pictorial
34 AINSWORTH, BIBBY, WOOD
representations can be used to bridge understanding to the more symbolic ones. In addition, Dienes (1973) argued for the linking of imagery and symbolism in mathematics education. The mixed system came closer to achieving this than ei- ther the pictorial or the mathematical systems.
Integrating the Representing and Represented Worlds
To predict how specific combinations of representations used in CENTS may influence learning, we need to consider the represented world, the representing world, and the interaction between them. First is the represented world. Children in all experimental conditions interact with the same represented world through one representation containing direction and magnitude informa- tion and another representation that provides only magnitude information. Ta- ble 2 shows the space of learning outcomes given a causal relationship between representation use during the intervention and judgment of estimation accuracy at posttest. Three paths lead to success and three to failure at judg- ment of estimation accuracy.
Learners can improve in judging the accuracy of estimates during the interven- tion phase in three ways. First, they could learn to correctly judge estimation accu- racy on both representations and successfully translate between these representations. We would expect these students to perform well at posttest (Path A). Second, children could learn to act effectively on each representation without translating between representations. This should also lead to successful learning outcomes (Path B). We return to the question of how to determine the difference
TABLE 2 Possible Paths to Learning Outcomes for Children Using Multiple External
Representations in CENTS
Rep. 1 Rep. 2 ContinuousDirection Categorical Learning
Path and Magnitude Magnitude Only Translation Outcomes
Path A + + + +ve Path B + + - +ve Path C + - +ve Path D - - + -ve Path E - + - -ve Path F - - - -ve
Note. Column 2 to 4, the sign indicates if learners have mastered the cognitive tasks associated with using either a particular representation or translating between representations (a "+" indicates mastery; a "-" incomplete mastery). Column 5 represents the predicted positive or negative learning outcomes.
EXAMINING MULTI-REPRESENTATIONAL SYSTEMS 35
between Path A and Path B in the final section of this article. Third, learners could master continuous representation without mastering the categorical representation or translating between representations. This again should lead to successful learn- ing outcomes (Path C) as this representation contains all the information necessary to complete the task.
Similarly, there are three ways in which learners can fail to improve at judging the accuracy of estimates. When interacting with CENTS, students could provide the same wrong answer on both representations. In this case, they have mastered translation without mastering judgment of estimation accuracy on either represen- tation. We would not expect these students to perform well at posttest, as they have not demonstrated the necessary skills during the intervention (Path D). Alterna- tively, children could learn to use the categorical representation but not the contin- uous representation. When this happens, translation between representations cannot occur. This does not provide them with all the information they need to per- form well at posttest (Path E). Finally, they do not learn to judge estimation accu- racy with either of the representations, and do not translate between them, resulting in poor performance at posttest (Path F).
The nature of the representing world is expected to influence the particular learning path that a child is likely to follow in CENTS. In line with existing lit- erature on the properties of individual mathematical or pictorial representations, a series of hypotheses was generated concerning the ease of mastery of the dif- ferent representations in CENTS. Both of the pictorial representations should be relatively easy to understand and use in that they require little mathematical knowledge, can be considered as ambient symbol systems (Kaput, 1987), and make use of perceptual processes to support inferences (Larkin & Simon, 1987). In addition, children with lower mathematical aptitude may be able to use these representations more successfully than the other types of representations (Cronbach & Snow, 1977). On the other hand, the mathematical representations in CENTS are less easy to understand than their pictorial equivalents as they re- quire more specialist knowledge and make less use of perceptual processes. Compared with pictorial representations, children should take longer to learn CENTS' mathematical representations.
The ease of translation between different MERs is also likely to differ depend- ent on the nature of the representing worlds. In the case of the representations in CENTS, children interact with estimation accuracy representations to consider two aspects of their estimates; whether the estimate is higher or lower than the ex- act calculation, and how much it deviates from the exact calculation. The first rep- resentation with which the children interact requires them to consider both of these aspects of estimation, and the second representation requires them only to consider the latter dimension. For example, if a child has already made a judgment about how far away an estimate is from the exact calculation, translation enables them to use this in the second representation to inform their judgment about the direction
36 AINSWORTH, BIBBY, WOOD
of this difference. On the other hand, if a child has already decided the magnitude and direction of the estimate from the exact calculation, then they have to carry the magnitude information to the second representation and use this to constrain their problem solving with this representation. Thus, translation occurs when children carry the product of their problem solving from one representation to the other and make use of this information.
It is predicted that the pictorial system of representations in CENTS will facili- tate translation as the format and operators in these representations are of a similar kind. In the same way, the mathematical representations in CENTS share format and operators, and thus in combination it should be relatively straightforward to translate between them. However, the mixed system of representations in CENTS combines representations that vary both the format and the operators that apply to those representations. In this case, translation between representations may well prove more difficult than either the pictorial or mathematical representational sys- tems in CENTS.
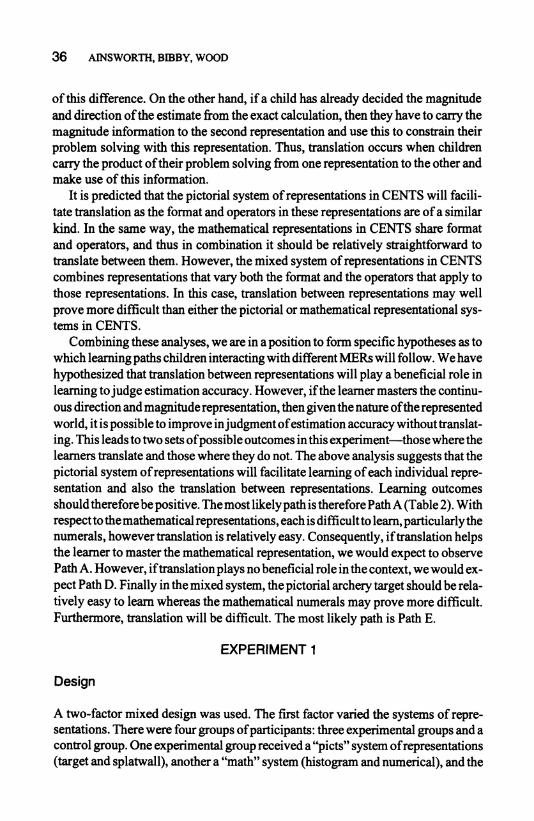
Combining these analyses, we are in a position to form specific hypotheses as to which learning paths children interacting with different MERs will follow. We have hypothesized that translation between representations will play a beneficial role in learning to judge estimation accuracy. However, if the learner masters the continu- ous direction and magnitude representation, then given the nature of the represented world, it is possible to improve in judgment of estimation accuracy without translat- ing. This leads to two sets ofpossible outcomes in this experiment-those where the learners translate and those where they do not. The above analysis suggests that the pictorial system of representations will facilitate learning of each individual repre- sentation and also the translation between representations. Learning outcomes should therefore be positive. The most likely path is therefore Path A (Table 2). With respect to the mathematical representations, each is difficult to learn, particularly the numerals, however translation is relatively easy. Consequently, if translation helps the learner to master the mathematical representation, we would expect to observe Path A. However, if translation plays no beneficial role in the context, we would ex- pect Path D. Finally in the mixed system, the pictorial archery target should be rela- tively easy to learn whereas the mathematical numerals may prove more difficult. Furthermore, translation will be difficult. The most likely path is Path E.
EXPERIMENT 1
Design
A two-factor mixed design was used. The first factor varied the systems of repre- sentations. There were four groups of participants: three experimental groups and a control group. One experimental group received a "picts" system of representations (target and splatwall), another a "math" system (histogram and numerical), and the

EXAMINING MULTI-REPRESENTATIONAL SYSTEMS 37
final group a "mixed" system (target and numerical). The final group was a no-in- tervention control that participated in the pen and paper tests, but took no other part in the experiment. The second factor, time, was within subjects. Children were as- signed to the different conditions based on their scores on a mental math test such that each group had approximately the same mean and standard deviation. Each condition had similar numbers of boys and girls, and the mean age of the partici- pants did not differ significantly.
Dependent Measures
To evaluate the way that representation use interacted with learning, a number of dependent variables were required to assess (a) learning outcomes, and (b) process measures of system usage. Learning outcomes were measured based on a paper and pen test that assessed learners' estimation knowledge and skills prior to and after interaction with CENTS. An example question from the test is shown in Figure 5. Each item on the paper and pen test required the children to estimate answers to either 2 x 2 or 3 x 3 digit multiplication problems. They were also asked to state how much their estimate differed from the exact answer. The accuracy of the estimates was provided by the percentage deviation of each estimate from the exact answer. Judgment of estimation accuracy was calculated as the absolute difference between the predicted accuracy and the actual accu- racy of each estimate. If different representational systems in CENTS lead to different learning outcomes these are most likely to be observed in the children's judgments of the accuracy of their estimates.
To determine how alternative MERs may lead to differences in learning out- comes, process measures were derived from the children's interactions with CENTS. For each of the six stages of interaction with CENTS, the children's key presses and mouse clicks were recorded by the system (described above in the sys- tem description of the article). For Stages 1, 3, 4, and 5 of the interactions with
1. Estimate: 19 x 69 my estimate is 1400
very much much less less just less exactly just more more much very much less I I I I the same more more
30% or 30% to 20% to 10% to 0% 0% to 10% to 20% to 30% or below 1 20% less 10% less I 0% less 10% more 120% more 130% more above
+
FIGURE 5 An example question (with answer) from the pen and paper test.
38 AINSWORTH, BIBBY, WOOD
CENTS, there were no differences in the children's experiences. Furthermore, their interactions with CENTS during these stages of strategic support were con- strained by the system. For example, at Stage 3 when the children multiply the ex- tracted digits, help would be provided if they made an error. Hence, no directly relevant differences in the patterns of interaction with the system could be ob- served for these stages between the different experimental conditions.
At Stage 2, children interacted with a different MERs according to their assigned experimental condition. At Stage 6, the nature ofthe feedback provided depended on the MERs. Given that this is the only part ofthe interaction with CENTS that differed systematically between the experimental conditions, this is where the behavioral analysis focused.
When interacting with each of the representations (e.g., the splatwall) children were given the task of judging how far their estimate was from the exact answer. Both the splatwall and the numerical display provided information about the extent to which children's judgments were accurate with respect to both magnitude and di- rection. The archery target and histogram only provided information about magni- tude. For the continuous representations, the absolute difference between the children's judgment of estimation accuracy and the actual value that should have been selected, given the particular problem, was calculated as a percentage. This on-line measure maps directly onto the score of judgment of estimation accuracy calculated for the paper and pen tests. Similarly, for the categorical representations, the absolute difference between the selected and correct categories was calculated. If differences in learning outcomes are observed for the judgments of estimation ac- curacy on the paper and pen tests, these should be related to either the judgments of estimation accuracy on the continuous representation, the categorical representa- tion, or both.
The extent to which children coordinated their interactions with the two represen- tations is measurable by examining the correlation between theirjudgments of esti- mation accuracy on the continuous and categorical representations. This measure is similar in kind to that use by Schwartz and Dreyfus (1993) to measure integration across representations in their multirepresentational software. Given that the repre- sentational systems are partially redundant, with one representation containing both magnitude and direction information and the second representation containing only magnitude information, it is only possible to derive a measure of coordination for the magnitude component. If children learn to coordinate their use of representations on this dimension, there should be a high positive correlation between their judgments on the two representations. Therefore, ifchildren can translate theirjudgment of esti- mation accuracy from the first representation with which they interacted onto the second representation, then they should show approximately the same percentage deviation from the exact answer on both representations. Ifthere is no correlation be- tween the two measures ofjudgment of estimation accuracy, then the children can- not be coordinating their use of the two representations. If the different MERs have
EXAMINING MULTI-REPRESENTATIONAL SYSTEMS 39
different impacts on the learning outcomes, then the degree to which the interactions are coordinated may predict those differences.
Participants
Forty-eight mixed-ability year-5 pupils from a state junior school took part in the experiment. They ranged in age from 9:9 to 10:8 years. All the children were expe- rienced with mouse driven computers.
Materials
A general test of mental mathematics was constructed by combining exercises from books two and three of "Think and Solve Mental Maths" (Clarke & Shepherd, 1984). It was piloted with a parallel class that was not taking part in the experiment.
The pen and paper test required the children to estimate an answer to a multipli- cation problem. There were 20 questions, eight 3-digit by 3-digit problems (e.g., 213 x 789) and twelve 2-digit by 2-digit problems (e.g., 21 x 78). To probe the un- derstanding that children had into the accuracy of their estimates, they were re- quired to state how much their estimate differed from the exact answer (judgment of estimation accuracy, see Figure 5).
Categories were labeled in both natural language and percentages. The natural language labels used in the pen and paper test were the same as those used by chil- dren to describe their estimates in their online logbooks. The resolution used for the pretests and posttests was the same as that used in the categorical representa- tions and the logbook was present in all three conditions.
Procedure
Pretest. Participants were given the mental math tests in their classroom. The class teacher read the items to the children and allowed them to query misun- derstood items. Children were allowed a short break after each block often items. In total, the test took about 30 min to complete.
The estimation tests were given the following day. The instructions stressed that exact answers were not required and encouraged guessing rather than leaving an answer blank. The judgment of estimation accuracy measure was also ex- plained. The children were allowed to proceed at their own pace through the test and generally took between 20 and 40 min to complete it. One participant was stopped after an hour. Three parallel versions of each test were created and, to pre- vent copying, children seated close together were given different versions.
40 AINSWORTH, BIBBY, WOOD
Computer intervention. The computer intervention began the following week. Participants used the computer individually in a quiet space. To ensure suffi- cient practice with the system, each child used CENTS twice, separated by approxi- mately two weeks. The total time spent on the computer was between 80 and 100 min. The experimenter demonstrated how to use CENTS and then stayed to provide support if children became confused about how to operate the system, but no direct teaching was given.
The children were set eight questions that they had to answer by both truncation and rounding. All questions presented were generated dynamically. Each child started with a two-by-two problem and was gradually introduced to larger prob- lems (two-by-three and three-by-two). The final two were three-by-three multipli- cation problems. After each problem, children filled in the on-line logbook recording details of their activities.
Posttest. Children received a parallel version of the estimation test within 10 days of their second computer session.
RESULTS
The design for the analyses of the pen and paper tests was 4 (control, math, mixed, picts) by 2 (pretest, posttest). The first factor, Condition, was between groups, and the second factor, Time, was a within subjects measure. The number of participants in each cell is 12 for all analyses unless otherwise stated.
Leaming Outcomes
Children's performance on pretests and posttests was analyzed to determine how effectively CENTS supported the acquisition of computational estimation skills. The most commonly used measure of estimation performance is the percentage de- viation of the estimate from the exact answer. For example, an estimate of 2500 for the sum "53 x 52" is 9.3% away from the exact answer. The support for learning to estimate was held constant over all three experimental conditions, so the only ex- pected differences on this measure were between the experimental and control con- ditions. In contrast, performance on the judgment of the accuracy of an estimate was expected to differ between the experimental conditions, as this was the focus of the different MERs.
Estimation accuracy. The results from one participant were removed. Her results were 10 standard deviations above the mean at pretest. Table 3
EXAMINING MULTI-REPRESENTATIONAL SYSTEMS 41
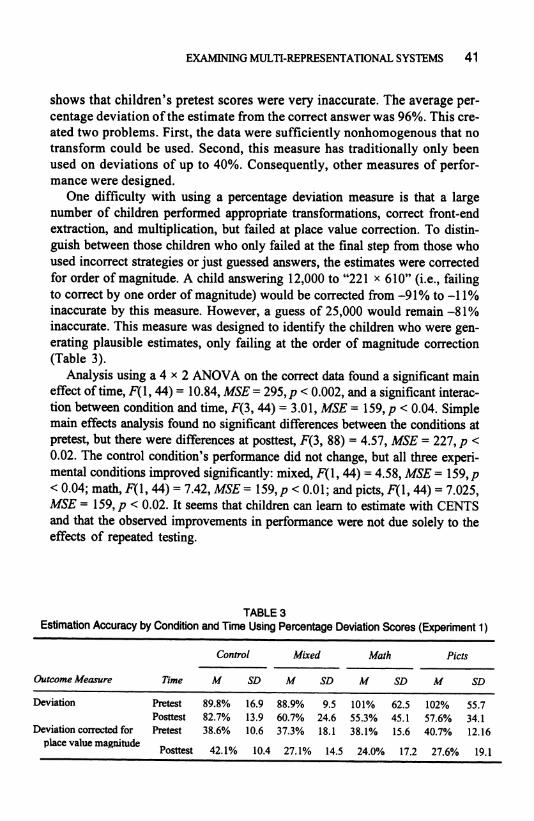
shows that children's pretest scores were very inaccurate. The average per- centage deviation of the estimate from the correct answer was 96%. This cre- ated two problems. First, the data were sufficiently nonhomogenous that no transform could be used. Second, this measure has traditionally only been used on deviations of up to 40%. Consequently, other measures of perfor- mance were designed.
One difficulty with using a percentage deviation measure is that a large number of children performed appropriate transformations, correct front-end extraction, and multiplication, but failed at place value correction. To distin- guish between those children who only failed at the final step from those who used incorrect strategies or just guessed answers, the estimates were corrected for order of magnitude. A child answering 12,000 to "221 x 610" (i.e., failing to correct by one order of magnitude) would be corrected from -91% to -11% inaccurate by this measure. However, a guess of 25,000 would remain -81% inaccurate. This measure was designed to identify the children who were gen- erating plausible estimates, only failing at the order of magnitude correction (Table 3).
Analysis using a 4 x 2 ANOVA on the correct data found a significant main effect of time, F(1, 44) = 10.84, MSE = 295, p < 0.002, and a significant interac- tion between condition and time, F(3, 44) = 3.01, MSE = 159, p < 0.04. Simple main effects analysis found no significant differences between the conditions at pretest, but there were differences at posttest, F(3, 88) = 4.57, MSE = 227, p < 0.02. The control condition's performance did not change, but all three experi- mental conditions improved significantly: mixed, F(1, 44) = 4.58, MSE = 159, p < 0.04; math, F(1, 44) = 7.42, MSE = 159, p < 0.01; and picts, F(l, 44) = 7.025, MSE = 159, p < 0.02. It seems that children can learn to estimate with CENTS and that the observed improvements in performance were not due solely to the effects of repeated testing.
TABLE 3 Estimation Accuracy by Condition and Time Using Percentage Deviation Scores (Experiment 1)
Control Mixed Math Picts
Outcome Measure Time M SD M SD M SD M SD
Deviation Pretest 89.8% 16.9 88.9% 9.5 101% 62.5 102% 55.7 Posttest 82.7% 13.9 60.7% 24.6 55.3% 45.1 57.6% 34.1
Deviation corrected for Pretest 38.6% 10.6 37.3% 18.1 38.1% 15.6 40.7% 12.16 place value magnitude
Posttest 42.1% 10.4 27.1% 14.5 24.0% 17.2 27.6% 19.1
42 AINSWORTH, BIBBY, WOOD
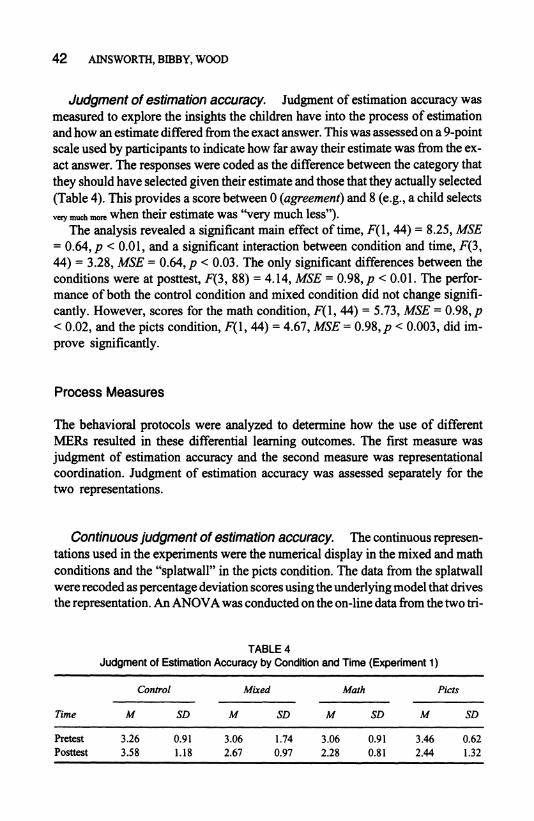
Judgment of estimation accuracy. Judgment of estimation accuracy was measured to explore the insights the children have into the process of estimation and how an estimate differed from the exact answer. This was assessed on a 9-point scale used by participants to indicate how far away their estimate was from the ex- act answer. The responses were coded as the difference between the category that they should have selected given their estimate and those that they actually selected (Table 4). This provides a score between 0 (agreement) and 8 (e.g., a child selects vey much more when their estimate was "very much less").
The analysis revealed a significant main effect of time, F(1, 44) = 8.25, MSE = 0.64, p < 0.01, and a significant interaction between condition and time, F(3, 44) = 3.28, MSE = 0.64, p < 0.03. The only significant differences between the conditions were at posttest, F(3, 88) = 4.14, MSE = 0.98, p < 0.01. The perfor- mance of both the control condition and mixed condition did not change signifi- cantly. However, scores for the math condition, F(1, 44) = 5.73, MSE = 0.98, p < 0.02, and the picts condition, F(1, 44) = 4.67, MSE = 0.98, p < 0.003, did im-
prove significantly.
Process Measures
The behavioral protocols were analyzed to determine how the use of different MERs resulted in these differential learning outcomes. The first measure was judgment of estimation accuracy and the second measure was representational coordination. Judgment of estimation accuracy was assessed separately for the two representations.
Continuous judgment of estimation accuracy. The continuous represen- tations used in the experiments were the numerical display in the mixed and math conditions and the "splatwall" in the picts condition. The data from the splatwall were recoded as percentage deviation scores using the underlying model that drives the representation. An ANOVA was conducted on the on-line data from the two tri-
TABLE 4 Judgment of Estimation Accuracy by Condition and Time (Experiment 1)
Control Mixed Math Picts
Time M SD M SD M SD M SD
Pretest 3.26 0.91 3.06 1.74 3.06 0.91 3.46 0.62 Posttest 3.58 1.18 2.67 0.97 2.28 0.81 2.44 1.32
EXAMINING MULTI-REPRESENTATIONAL SYSTEMS 43
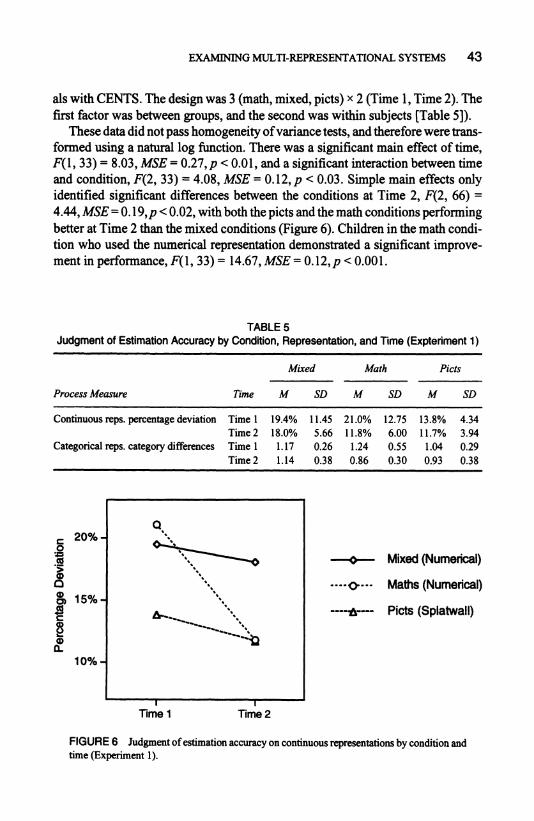
als with CENTS. The design was 3 (math, mixed, picts) x 2 (Time 1, Time 2). The first factor was between groups, and the second was within subjects [Table 5]).
These data did not pass homogeneity of variance tests, and therefore were trans- formed using a natural log function. There was a significant main effect of time, F(1, 33) = 8.03, MSE = 0.27, p < 0.01, and a significant interaction between time and condition, F(2, 33) = 4.08, MSE = 0.12, p < 0.03. Simple main effects only identified significant differences between the conditions at Time 2, F(2, 66) = 4.44, MSE= 0. 19, p < 0.02, with both the picts and the math conditions performing better at Time 2 than the mixed conditions (Figure 6). Children in the math condi- tion who used the numerical representation demonstrated a significant improve- ment in performance, F(1, 33) = 14.67, MSE = 0.12, p < 0.001.
TABLE 5 Judgment of Estimation Accuracy by Condition, Representation, and Time (Expteriment 1)
Mixed Math Picts
Process Measure Time M SD M SD M SD
Continuous reps. percentage deviation Time 1 19.4% 11.45 21.0% 12.75 13.8% 4.34 Time 2 18.0% 5.66 11.8% 6.00 11.7% 3.94
Categorical reps. category differences Time 1 1.17 0.26 1.24 0.55 1.04 0.29 Time 2 1.14 0.38 0.86 0.30 0.93 0.38
c 20% o
C
10%
Time I Time 2
Mixed (Numerical)
Maths (Numerical)
Picts (Splatwall)
FIGURE 6 Judgment of estimation accuracy on continuous representations by condition and time (Experiment 1).
44 AINSWORTH, BIBBY, WOOD
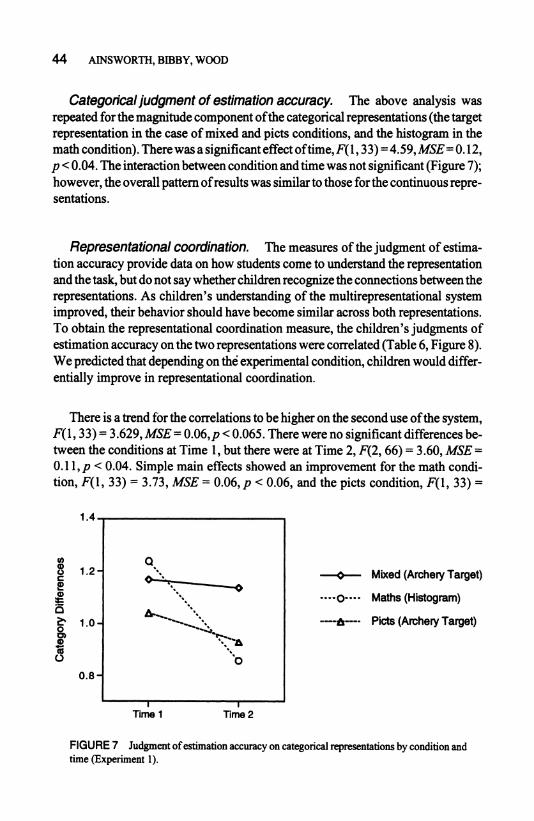
Categorical judgment of estimation accuracy. The above analysis was repeated for the magnitude component of the categorical representations (the target representation in the case of mixed and picts conditions, and the histogram in the math condition). There was a significant effect oftime, F(1, 33) = 4.59, MSE= 0.12, p < 0.04. The interaction between condition and time was not significant (Figure 7); however, the overall pattern of results was similar to those for the continuous repre- sentations.
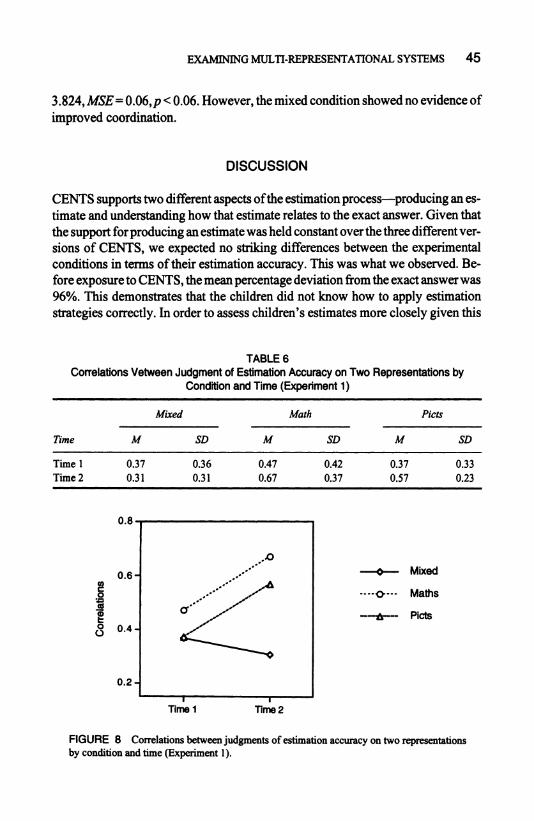
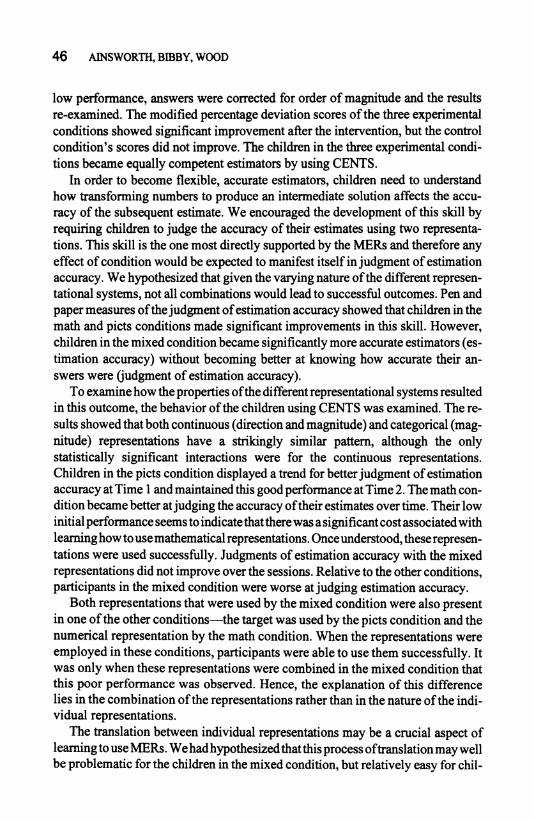
Representational coordination. The measures of the judgment of estima- tion accuracy provide data on how students come to understand the representation and the task, but do not say whether children recognize the connections between the representations. As children's understanding of the multirepresentational system improved, their behavior should have become similar across both representations. To obtain the representational coordination measure, the children's judgments of estimation accuracy on the two representations were correlated (Table 6, Figure 8). We predicted that depending on the experimental condition, children would differ- entially improve in representational coordination.
There is a trend for the correlations to be higher on the second use of the system, F(1, 33) = 3.629, MSE= 0.06, p < 0.065. There were no significant differences be- tween the conditions at Time 1, but there were at Time 2, F(2, 66) = 3.60, MSE = 0.11, p < 0.04. Simple main effects showed an improvement for the math condi- tion, F(1, 33) = 3.73, MSE = 0.06, p < 0.06, and the picts condition, F(1, 33) =
1.4
0
o 1.2
S1.0 0 0
0.8
Time 1 Time 2
Mixed (Archery Target)
Maths (Histogram)
Picts (Archery Target)
FIGURE 7 Judgment of estimation accuracy on categorical representations by condition and time (Experiment 1).
EXAMINING MULTI-REPRESENTATIONAL SYSTEMS 45
3.824, MSE = 0.06,p < 0.06. However, the mixed condition showed no evidence of improved coordination.
DISCUSSION
CENTS supports two different aspects of the estimation process-producing an es- timate and understanding how that estimate relates to the exact answer. Given that the support for producing an estimate was held constant over the three different ver- sions of CENTS, we expected no striking differences between the experimental conditions in terms of their estimation accuracy. This was what we observed. Be- fore exposure to CENTS, the mean percentage deviation from the exact answer was 96%. This demonstrates that the children did not know how to apply estimation strategies correctly. In order to assess children's estimates more closely given this
TABLE 6 Correlations Vetween Judgment of Estimation Accuracy on Two Representations by
Condition and Time (Experiment 1)
Mixed Math Picts
Time M SD M SD M SD
Time 1 0.37 0.36 0.47 0.42 0.37 0.33 Time 2 0.31 0.31 0.67 0.37 0.57 0.23
0.8
0.6
o
0.4
0.2
Time 1 Time 2
Mixed
Maths
Picts
FIGURE 8 Correlations between judgments of estimation accuracy on two representations by condition and time (Experiment 1).
46 AINSWORTH, BIBBY, WOOD
low performance, answers were corrected for order of magnitude and the results re-examined. The modified percentage deviation scores of the three experimental conditions showed significant improvement after the intervention, but the control condition's scores did not improve. The children in the three experimental condi- tions became equally competent estimators by using CENTS.
In order to become flexible, accurate estimators, children need to understand how transforming numbers to produce an intermediate solution affects the accu- racy of the subsequent estimate. We encouraged the development of this skill by requiring children to judge the accuracy of their estimates using two representa- tions. This skill is the one most directly supported by the MERs and therefore any effect of condition would be expected to manifest itself in judgment of estimation accuracy. We hypothesized that given the varying nature of the different represen- tational systems, not all combinations would lead to successful outcomes. Pen and paper measures of the judgment of estimation accuracy showed that children in the math and picts conditions made significant improvements in this skill. However, children in the mixed condition became significantly more accurate estimators (es- timation accuracy) without becoming better at knowing how accurate their an- swers were (judgment of estimation accuracy).
To examine how the properties of the different representational systems resulted in this outcome, the behavior of the children using CENTS was examined. The re- sults showed that both continuous (direction and magnitude) and categorical (mag- nitude) representations have a strikingly similar pattern, although the only statistically significant interactions were for the continuous representations. Children in the picts condition displayed a trend for better judgment of estimation accuracy at Time 1 and maintained this good performance at Time 2. The math con- dition became better at judging the accuracy of their estimates over time. Their low initial performance seems to indicate that there was a significant cost associated with learning how to use mathematical representations. Once understood, these represen- tations were used successfully. Judgments of estimation accuracy with the mixed representations did not improve over the sessions. Relative to the other conditions, participants in the mixed condition were worse at judging estimation accuracy.
Both representations that were used by the mixed condition were also present in one of the other conditions-the target was used by the picts condition and the numerical representation by the math condition. When the representations were employed in these conditions, participants were able to use them successfully. It was only when these representations were combined in the mixed condition that this poor performance was observed. Hence, the explanation of this difference lies in the combination of the representations rather than in the nature of the indi- vidual representations.
The translation between individual representations may be a crucial aspect of learning to use MERs. We had hypothesized that this process of translation may well be problematic for the children in the mixed condition, but relatively easy for chil-
EXAMINING MULTI-REPRESENTATIONAL SYSTEMS 47
dren in the picts and math conditions. To explore this, a measure of representational coordination was developed. It was predicted that as experience with the system in- creased, there should be a trend toward increasing convergence as measured by the correlation between thejudgments ofestimation accuracy on the two different repre- sentations. Convergence was found in both the math and picts conditions, but not in the mixed condition. This failure to converge suggests that children were less able to translate between the mixed representations.
These combinations of process and learning outcome measures allow us to identify which of the six learning paths for judgment of estimation accuracy we proposed in Table 2 best explain performance for each condition. Children in the picts condition learned to master judgment of estimation accuracy with each repre- sentation, to show increasing convergence on the representational coordination measure, and to be successful at posttest. We propose, that as predicted, learning Path A best describes this behavior. Children in the math condition also showed successful outcomes and demonstrated high level of representational coordina- tion. In comparison with the picts condition, they took longer to master the repre- sentations. However, by the end of their second CENTS session, they were judging estimation accuracy effectively with both mathematical representations. We hypothesized that if learners in the math condition were able to benefit by translating their problem solving between representations they would be success- ful. We conclude therefore that the behavior of children in this condition also cor- responded to learning Path A. Finally, for the mixed condition, we had predicted that, due to the difficulty in mastering the complex mathematical representation and the difficulty of translating between representations, the most likely Path was E. This was not what we observed. Instead, given the low representational coordi- nation scores and the failure to improve at judging estimation accuracy with either representation, the best explanation of performance is Path F. We believe that the reason why children performed less well than we expected in this condition was that their attempts to translate when translation was difficult interfered with the successful learning of the individual representations.
These findings are consistent with the idea that combinations of different repre- sentations do not always produce the optimum benefits. Rather, similar representing worlds may lead to higher performance than mixing representing worlds. However, the children used CENTS for less than two hours. It could be the case that our con- cerns about the lack of observable benefits ofmixed representations do not reflect a long-term difficulty. Rather, it could simply be that with mixed representing worlds children take longer to learn to translate between representations.
EXPERIMENT 2
Both the represented and representing worlds in CENTS were new to the partici- pants in Experiment 1. This placed especially heavy learning and working memory
48 AINSWORTH, BIBBY, WOOD
demands upon the children. The observation that the learners with the mixed repre- sentational system struggled is consistent with cognitive load analyses of learning (e.g., Chandler & Sweller, 1992; Sweller, 1988). Cognitive load accounts suggest that the task demands are initially very high when learners are introduced to a prob- lem. However, with practice, components of the task become automated, freeing up resources for other aspects ofthe task. Ifthis is the case, the difficulties that the chil- dren experience coordinating mixed representational systems are likely to be only problematic in the short-term. When children become more experienced with the learning environment and with estimation problems, coordination of mixed repre- sentations should improve.
This hypothesis was tested by adding two further intervention sessions to the experiment, producing a total of four CENTS trials in all.1 Given the successful performance of children in the math and picts condition in Experiment 1, we con- tinued to predict that they would demonstrate positive outcomes and follow Path A. However, if the children with the mixed MERs had not improved at representa- tional coordination by the fourth session, then the failure to coordinate or to learn the representations was unlikely to be due to the lack of familiarity with the task. We needed to determine which learning path children in the mixed condition were following. If they demonstrated successful learning outcomes, they may have fol- lowed paths A, B, or C (Table 2). If they did not improve at judging the accuracy of their estimates, they could have taken one of paths D, E, or F.
Design
This experiment employed the same representations and basic design as Experi- ment 1. A two-factor mixed design was used. The first factor varied the systems of representations. This resulted in three experimental conditions of 12 participants consisting of those who received "picts" (target and splatwall), "math" (histogram and numerical), and "mixed" (target and numerical) representations. The final con- dition was a no-intervention control who took the pen and paper tests. A second fac- tor, time, was within subjects. Children were assigned to a condition based on their scores on a mental math test. Each condition had similar numbers of boys and girls and the mean age of the participants did not differ significantly.
Participants
Forty-eight year-5 and year-6 pupils from a state junior school took part in the ex- periment. None had taken part in Experiment 1. The children ranged in age from 9:5 to 11:2 years. All the children were experienced with mouse driven computers.
'This number of sessions was also thought to constitute the maximum amount of time that a child could be expected to use such a focused learning environment in a UK classroom.

EXAMINING MULTI-REPRESENTATIONAL SYSTEMS 49
Materials
These were identical to those used in Experiment 1.
Procedure
Experiment 2 followed the same procedure as Experiment 1, except that children in the experimental condition used CENTS a total of four times. The total time they spent on the computer was between 150 and 220 min.
RESULTS
Leaming Outcomes
Pen and paper measures were taken to examine whether the computer intervention successfully taught children to become accurate estimators. As before, both the ac- curacy of their estimates (uncorrected and corrected for place value) and judgment of estimation accuracy scores were examined.
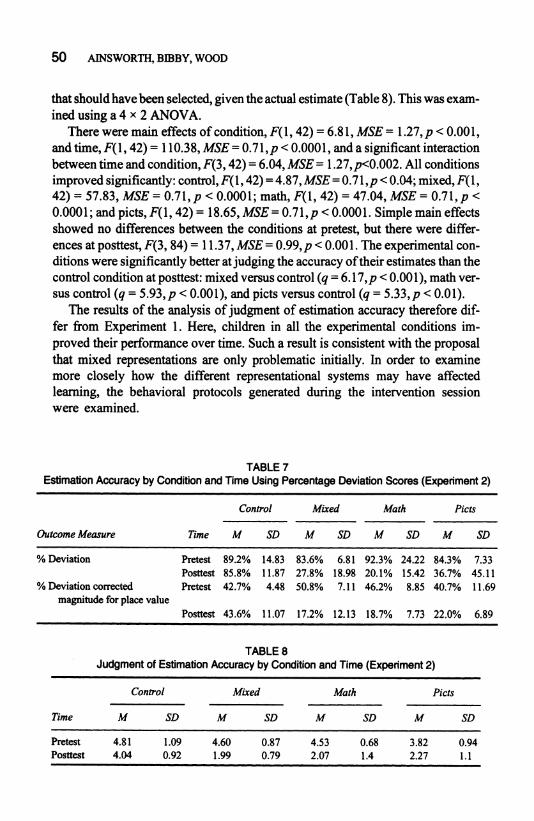
Estimation accuracy. As seen in Table 7, the pretest performance of the children was low. The estimates were on average 87% away from the exact answer. At posttest, the experimental conditions were much closer with an average 28% de- viation. No analysis was performed, as the data were extremely heterogeneous.
A second measure of accuracy is the corrected percentage deviation. This ad- justed children's answers to the correct order of magnitude and hence distin- guished between children who performed appropriate transformations, but failed at final place value correction, from those who used inappropriate strategies or simply guessed an answer (Table 7).
Analysis by a 4 x 2 ANOVA yielded significant main effects of condition, F(l1, 42) = 6.28, MSE = 105.1,p < 0.002, and time, F(1, 42) = 147.33, MSE= 60.9, p < 0.001. There was a significant interaction between condition and time, F(3, 42) = 21.38, MSE = 60.9, p < 0.001. All the experimental conditions improved over time: mixed, F(1, 42) = 111.65, MSE = 60.9, p < 0.001; math, F(l, 42) = 68.44, MSE = 60.9, p < 0.001; and picts, F(l, 42) = 31.81, MSE = 60.9, p < 0.001. The control condition did not improve.
The improvements in children's estimation skills after an intervention phase us- ing CENTS were therefore replicated convincingly by this experiment.
Judgment of estimation accuracy. The responses were coded as the dif- ference between their judgment of the accuracy of their estimates and the category
50 AINSWORTH, BIBBY, WOOD
that should have been selected, given the actual estimate (Table 8). This was exam- ined using a 4 x 2 ANOVA.
There were main effects of condition, F(l, 42) = 6.8 1, MSE = 1.27, p < 0.001, and time, F(1, 42) = 110.38, MSE = 0.7 1,p < 0.0001, and a significant interaction between time and condition, F(3, 42) = 6.04, MSE = 1.27,p<0.002. All conditions improved significantly: control, F(l, 42) = 4.87, MSE = 0.71 ,p < 0.04; mixed, F(1, 42) = 57.83, MSE = 0.71, p < 0.0001; math, F(1, 42) = 47.04, MSE = 0.71, p < 0.0001; and picts, F(1, 42) = 18.65, MSE = 0.71, p < 0.0001. Simple main effects showed no differences between the conditions at pretest, but there were differ- ences at posttest, F(3, 84) = 11.37, MSE = 0.99, p < 0.001. The experimental con- ditions were significantly better at judging the accuracy of their estimates than the control condition at posttest: mixed versus control (q = 6.17,p < 0.001), math ver- sus control (q = 5.93, p < 0.001), and picts versus control (q = 5.33, p < 0.01).
The results of the analysis of judgment of estimation accuracy therefore dif- fer from Experiment 1. Here, children in all the experimental conditions im- proved their performance over time. Such a result is consistent with the proposal that mixed representations are only problematic initially. In order to examine more closely how the different representational systems may have affected learning, the behavioral protocols generated during the intervention session were examined.
TABLE 7 Estimation Accuracy by Condition and Time Using Percentage Deviation Scores (Experiment 2)
Control Mixed Math Picts
Outcome Measure Time M SD M SD M SD M SD
% Deviation Pretest 89.2% 14.83 83.6% 6.81 92.3% 24.22 84.3% 7.33 Posttest 85.8% 11.87 27.8% 18.98 20.1% 15.42 36.7% 45.11
% Deviation corrected Pretest 42.7% 4.48 50.8% 7.11 46.2% 8.85 40.7% 11.69 magnitude for place value
Posttest 43.6% 11.07 17.2% 12.13 18.7% 7.73 22.0% 6.89
TABLE 8 Judgment of Estimation Accuracy by Condition and Time (Experiment 2)
Control Mixed Math Picts
Time M SD M SD M SD M SD
Pretest 4.81 1.09 4.60 0.87 4.53 0.68 3.82 0.94 Posttest 4.04 0.92 1.99 0.79 2.07 1.4 2.27 1.1

EXAMINING MULTI-REPRESENTATIONAL SYSTEMS 51
Process Measures
To examine how the children's performance changed with experience on CENTS and the effects of the different conditions, a number of analyses were performed. As for Experiment 1, two types of measures were examined: those that analyzed how the children's understanding of the domain was reflected in their use ofrepresenta- tions, and those that measured their appreciation of how the representations relate to each other.
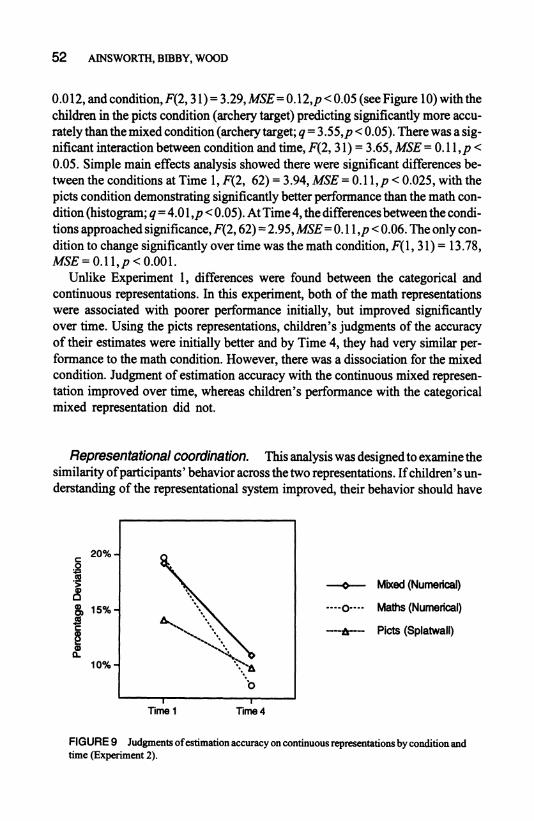
Continuous judgment of estimation accuracy. This measure examined judgment of estimation accuracy using the continuous representations. Estimation accuracy was represented as numerals for mixed and math conditions and as a "splatwall" for the picts condition. A 3 x 2 ANOVA was conducted with the on-line data from the participants' first and last trials with CENTS. The design was 3 (mixed, math, pictures) x 2 (Time 1, Time 4 [Table 9]).
Analysis revealed a main effect of time, F(1, 31) = 44.11, MSE = 24. 1, p < 0.0001. There was also a trend towards a main effect of condition, F(2, 31) = 2.99, MSE = 19.16, p < 0.065. A trend for an interaction between time and con- dition, F(2, 31) = 2.87, MSE = 24.1, p < 0.07, was also observed (Figure 9). There were significant differences between the conditions after the first session on the computer, F(2, 62) = 4.80, MSE = 24.6, p < 0.012, but not after all four sessions. At Time 1, children in the picts condition were performing signifi- cantly better than the other conditions: picts versus math (q = 4.10, p < 0.05) and picts versus mixed (q = 4.02, p < 0.05). However by Time 4, the other experi- mental conditions had improved significantly, but the picts condition had not improved further; mixed, F(1, 31) = 17.35, MSE = 24.1, p < 0.001; and math, F(1, 31) = 28.5, MSE = 24.1, p < 0.001.
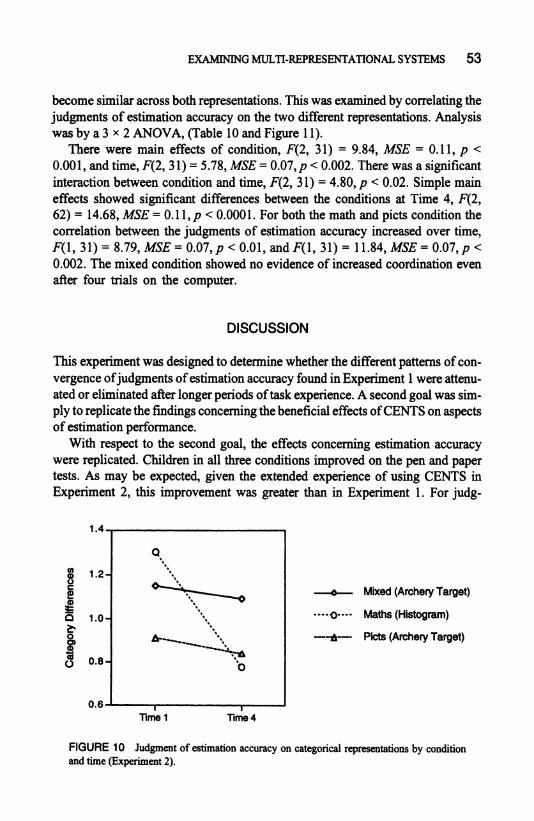
Categorical judgment of estimation accuracy. As with the continuous representations, there were main effects of time, F(1, 31) = 7.29, MSE = 0. 11, p <
TABLE 9 Judgment of Estimation Accuracy by Condition, Representation, and Time (Experiment 2)
Mixed Math Picts
Process Measure Time M SD M SD M SD
Continuous reps. percentage deviation Time 1 19.2% 5.69 19.3% 6.31 14.0% 4.27 Time 4 10.9% 4.50 8.2% 2.96 9.8% 3.06
Categorical reps. category differences Time 1 1.15 0.28 1.30 0.41 0.91 0.24 Time 4 1.10 0.27 0.78 0.30 0.84 0.43
52 AINSWORTH, BIBBY, WOOD
0.012, and condition, F(2, 3 1)= 3.29, MSE= 0.12,p < 0.05 (see Figure 10) with the children in the picts condition (archery target) predicting significantly more accu- rately than the mixed condition (archery target; q = 3.55,p < 0.05). There was a sig- nificant interaction between condition and time, F(2, 31) = 3.65, MSE = 0. 11, p < 0.05. Simple main effects analysis showed there were significant differences be- tween the conditions at Time 1, F(2, 62) = 3.94, MSE = 0. 11, p < 0.025, with the picts condition demonstrating significantly better performance than the math con- dition (histogram; q = 4.01,p < 0.05). At Time 4, the differences between the condi- tions approached significance, F(2, 62) = 2.95, MSE = 0. 11 ,p < 0.06. The only con- dition to change significantly over time was the math condition, F(l, 31) = 13.78, MSE = 0.11, p < 0.001.
Unlike Experiment 1, differences were found between the categorical and continuous representations. In this experiment, both of the math representations were associated with poorer performance initially, but improved significantly over time. Using the picts representations, children's judgments of the accuracy of their estimates were initially better and by Time 4, they had very similar per- formance to the math condition. However, there was a dissociation for the mixed condition. Judgment of estimation accuracy with the continuous mixed represen- tation improved over time, whereas children's performance with the categorical mixed representation did not.
Representational coordination. This analysis was designed to examine the similarity of participants' behavior across the two representations. If children's un- derstanding of the representational system improved, their behavior should have
20%
S
C10% 10%
Time 1 Time 4
Mixed (Numerical)
Maths (Numerical)
Picts (Splatwall)
FIGURE 9 Judgments of estimation accuracy on continuous representations by condition and time (Experiment 2).
EXAMINIG MULTI-REPRESENTATIONAL SYSTEMS 53
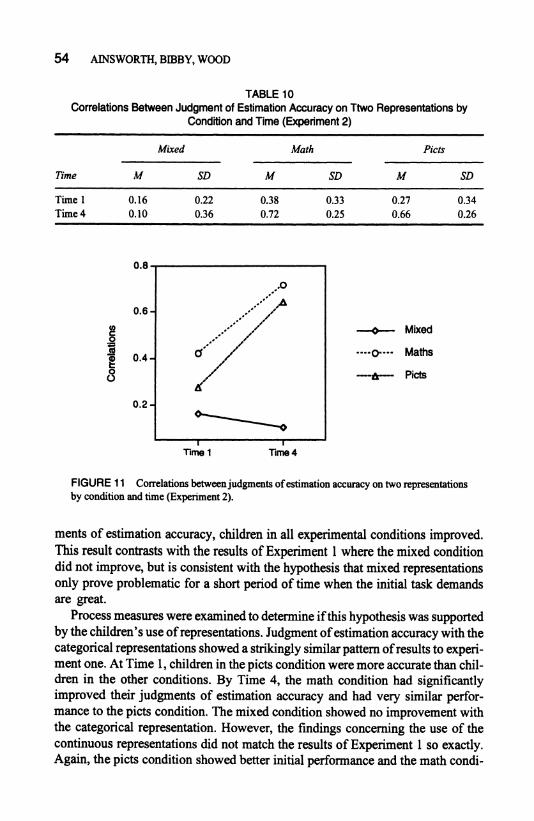
become similar across both representations. This was examined by correlating the judgments of estimation accuracy on the two different representations. Analysis was by a 3 x 2 ANOVA, (Table 10 and Figure 11).
There were main effects of condition, F(2, 31) = 9.84, MSE = 0.11, p < 0.001, and time, F(2, 31) = 5.78, MSE = 0.07, p < 0.002. There was a significant interaction between condition and time, F(2, 31) = 4.80, p < 0.02. Simple main effects showed significant differences between the conditions at Time 4, F(2, 62) = 14.68, MSE = 0.11, p < 0.0001. For both the math and picts condition the correlation between the judgments of estimation accuracy increased over time, F(1, 31) = 8.79, MSE = 0.07, p < 0.01, and F(l, 31) = 11.84, MSE = 0.07, p < 0.002. The mixed condition showed no evidence of increased coordination even after four trials on the computer.
DISCUSSION
This experiment was designed to determine whether the different patterns of con- vergence ofjudgments of estimation accuracy found in Experiment 1 were attenu- ated or eliminated after longer periods of task experience. A second goal was sim- ply to replicate the findings concerning the beneficial effects of CENTS on aspects of estimation performance.
With respect to the second goal, the effects concerning estimation accuracy were replicated. Children in all three conditions improved on the pen and paper tests. As may be expected, given the extended experience of using CENTS in Experiment 2, this improvement was greater than in Experiment 1. For judg-
1.4
1.2
o 1.0 o
0 0.8
0.6 Time 1 Time 4
Mixed (Archery Target)
Maths (Histogram)
Picts (Archery Target)
FIGURE 10 Judgment of estimation accuracy on categorical representations by condition and time (Experiment 2).
54 AINSWORTH, BIBBY, WOOD
TABLE 10 Correlations Between Judgment of Estimation Accuracy on Ttwo Representations by
Condition and Time (Experiment 2)
Mixed Math Picts
Time M SD M SD M SD
Time 1 0.16 0.22 0.38 0.33 0.27 0.34 Time 4 0.10 0.36 0.72 0.25 0.66 0.26
0.8
0.6
0.4
0.2
Time 1 Time 4
Mixed
Maths
Picts
FIGURE 11 Correlations between judgments of estimation accuracy on two representations by condition and time (Experiment 2).
ments of estimation accuracy, children in all experimental conditions improved. This result contrasts with the results of Experiment 1 where the mixed condition did not improve, but is consistent with the hypothesis that mixed representations only prove problematic for a short period of time when the initial task demands are great.
Process measures were examined to determine if this hypothesis was supported by the children's use of representations. Judgment of estimation accuracy with the categorical representations showed a strikingly similar pattern of results to experi- ment one. At Time 1, children in the picts condition were more accurate than chil- dren in the other conditions. By Time 4, the math condition had significantly improved their judgments of estimation accuracy and had very similar perfor- mance to the picts condition. The mixed condition showed no improvement with the categorical representation. However, the findings concerning the use of the continuous representations did not match the results of Experiment I so exactly. Again, the picts condition showed better initial performance and the math condi-
EXAMINING MULTI-REPRESENTATIONAL SYSTEMS 55
tion significantly improved performance over time. However, in contrast to Exper- iment 1, the mixed representations condition also improved significantly. In summary, the numerical representation (present in the math and mixed conditions) was used successfully by children in both conditions. However, the archery target (the categorical representation in mixed and picts cases) was used successfully when it was combined with another pictorial representation but not when com- bined with a mathematical representation. This replicates the finding in Experi- ment 1 that the way a representation is used can be influenced by the presence of other representations with which it is paired.
The major concern addressed by this experiment was whether children's use of mixed representations would become increasingly coordinated with extended practice. It was argued that, if mixed representations were only problematic due to initial task demands, four sessions should have provided sufficient experience for evidence of coordination to become apparent. Both the math and picts condi- tions became significantly more coordinated over time. However, even after four sessions on the computer, the mixed condition's behavior did not. This result suggests that failure to coordinate representations is not solely due to the initial learning demands.
Unlike children in the math and picts conditions, children in the mixed condi- tion did not learn to translate across the representations. If they had, their use of both representations would have been equally effective. We suggest that this led them to abandon their attempt to learn about the properties of one of the represen- tations (categorical) and to concentrate on the other representation (continuous). This follows from the observation that the mixed condition showed dissociation between judgments of estimation accuracy using the categorical (archery target) and continuous (numerical) representations. On the continuous representation, but not on the categorical one, their performance improved. One reason why learners may have focused on the continuous representation is that it contains both the di- rection and the magnitude information necessary for learning judgment of estima- tion accuracy, making it possible to meet the task demands. If this inference is valid, then the children in this condition may have made a strategic decision about how to approach the task.
Children in the picts condition learned to master judgment of estimation ac- curacy with each representation, showed increasing convergence on the repre- sentational coordination measure, and were successful at posttest. We propose, that as predicted, Path A best explains this behavior (Table 2). Children in the math condition also showed successful outcomes and demonstrated high level of representational coordination. In comparison with the picts condition, they took longer to master the representations. However, by the end of their final CENTS session, they were judging estimation accuracy effectively with both mathemati- cal representations. We hypothesized that if learners in the math condition were able to benefit by translating their problem solving between representations they
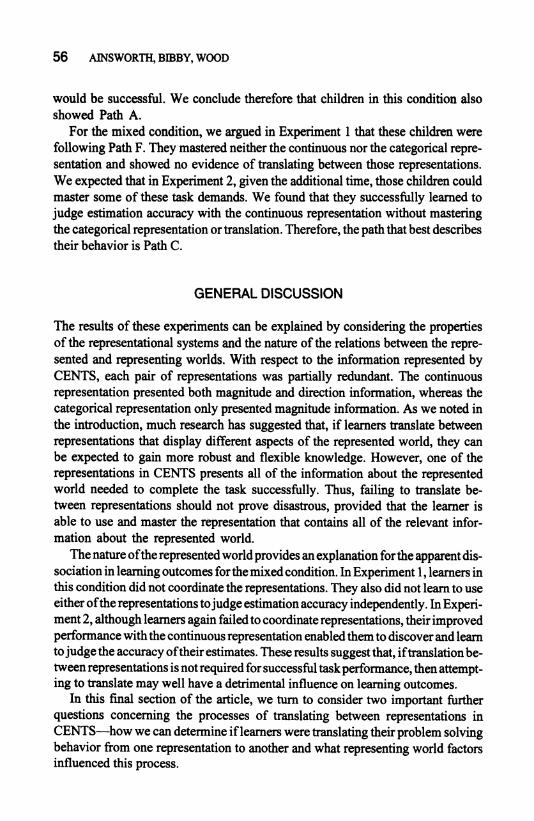
56 AINSWORTH, BIBBY, WOOD
would be successful. We conclude therefore that children in this condition also showed Path A.
For the mixed condition, we argued in Experiment I that these children were following Path F. They mastered neither the continuous nor the categorical repre- sentation and showed no evidence of translating between those representations. We expected that in Experiment 2, given the additional time, those children could master some of these task demands. We found that they successfully learned to judge estimation accuracy with the continuous representation without mastering the categorical representation or translation. Therefore, the path that best describes their behavior is Path C.
GENERAL DISCUSSION
The results of these experiments can be explained by considering the properties of the representational systems and the nature of the relations between the repre- sented and representing worlds. With respect to the information represented by CENTS, each pair of representations was partially redundant. The continuous representation presented both magnitude and direction information, whereas the categorical representation only presented magnitude information. As we noted in the introduction, much research has suggested that, if learners translate between representations that display different aspects of the represented world, they can be expected to gain more robust and flexible knowledge. However, one of the representations in CENTS presents all of the information about the represented world needed to complete the task successfully. Thus, failing to translate be- tween representations should not prove disastrous, provided that the learner is able to use and master the representation that contains all of the relevant infor- mation about the represented world.
The nature of the represented world provides an explanation for the apparent dis- sociation in learning outcomes for the mixed condition. In Experiment 1, learners in this condition did not coordinate the representations. They also did not learn to use either of the representations to judge estimation accuracy independently. In Experi- ment 2, although learners again failed to coordinate representations, their improved performance with the continuous representation enabled them to discover and learn to judge the accuracy of their estimates. These results suggest that, if translation be- tween representations is not required for successful task performance, then attempt- ing to translate may well have a detrimental influence on learning outcomes.
In this final section of the article, we turn to consider two important further questions concerning the processes of translating between representations in CENTS-how we can determine if learners were translating their problem solving behavior from one representation to another and what representing world factors influenced this process.
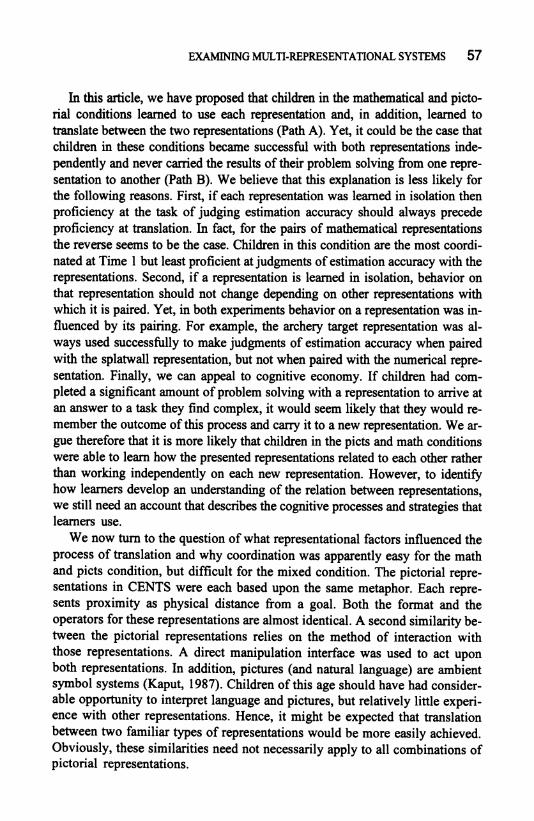
EXAMINING MULTI-REPRESENTATIONAL SYSTEMS 57
In this article, we have proposed that children in the mathematical and picto- rial conditions learned to use each representation and, in addition, learned to translate between the two representations (Path A). Yet, it could be the case that children in these conditions became successful with both representations inde- pendently and never carried the results of their problem solving from one repre- sentation to another (Path B). We believe that this explanation is less likely for the following reasons. First, if each representation was learned in isolation then proficiency at the task of judging estimation accuracy should always precede proficiency at translation. In fact, for the pairs of mathematical representations the reverse seems to be the case. Children in this condition are the most coordi- nated at Time 1 but least proficient at judgments of estimation accuracy with the representations. Second, if a representation is learned in isolation, behavior on that representation should not change depending on other representations with which it is paired. Yet, in both experiments behavior on a representation was in- fluenced by its pairing. For example, the archery target representation was al- ways used successfully to make judgments of estimation accuracy when paired with the splatwall representation, but not when paired with the numerical repre- sentation. Finally, we can appeal to cognitive economy. If children had com- pleted a significant amount of problem solving with a representation to arrive at an answer to a task they find complex, it would seem likely that they would re- member the outcome of this process and carry it to a new representation. We ar- gue therefore that it is more likely that children in the picts and math conditions were able to learn how the presented representations related to each other rather than working independently on each new representation. However, to identify how learners develop an understanding of the relation between representations, we still need an account that describes the cognitive processes and strategies that learners use.
We now turn to the question of what representational factors influenced the process of translation and why coordination was apparently easy for the math and picts condition, but difficult for the mixed condition. The pictorial repre- sentations in CENTS were each based upon the same metaphor. Each repre- sents proximity as physical distance from a goal. Both the format and the operators for these representations are almost identical. A second similarity be- tween the pictorial representations relies on the method of interaction with those representations. A direct manipulation interface was used to act upon both representations. In addition, pictures (and natural language) are ambient symbol systems (Kaput, 1987). Children of this age should have had consider- able opportunity to interpret language and pictures, but relatively little experi- ence with other representations. Hence, it might be expected that translation between two familiar types of representations would be more easily achieved. Obviously, these similarities need not necessarily apply to all combinations of pictorial representations.
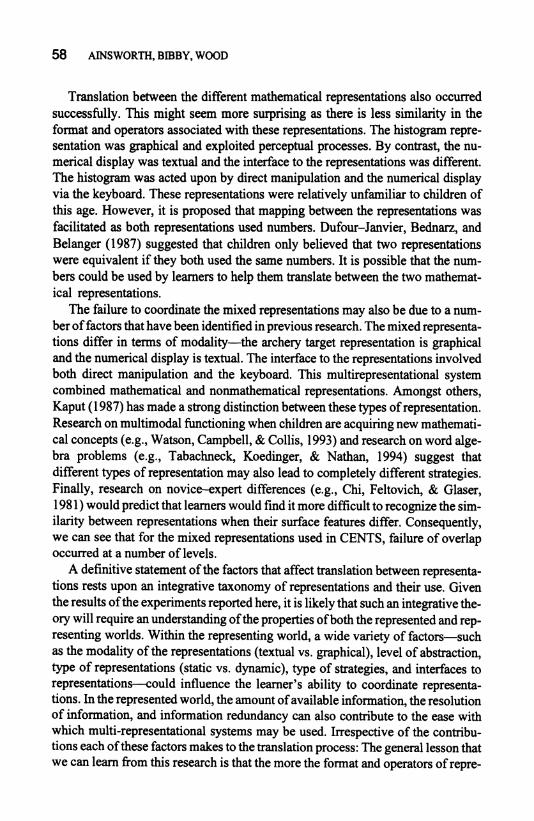
58 AINSWORTH, BIBBY, WOOD
Translation between the different mathematical representations also occurred successfully. This might seem more surprising as there is less similarity in the format and operators associated with these representations. The histogram repre- sentation was graphical and exploited perceptual processes. By contrast, the nu- merical display was textual and the interface to the representations was different. The histogram was acted upon by direct manipulation and the numerical display via the keyboard. These representations were relatively unfamiliar to children of this age. However, it is proposed that mapping between the representations was facilitated as both representations used numbers. Dufour-Janvier, Bednarz, and Belanger (1987) suggested that children only believed that two representations were equivalent if they both used the same numbers. It is possible that the num- bers could be used by learners to help them translate between the two mathemat- ical representations.
The failure to coordinate the mixed representations may also be due to a num- ber of factors that have been identified in previous research. The mixed representa- tions differ in terms of modality-the archery target representation is graphical and the numerical display is textual. The interface to the representations involved both direct manipulation and the keyboard. This multirepresentational system combined mathematical and nonmathematical representations. Amongst others, Kaput (1987) has made a strong distinction between these types of representation. Research on multimodal functioning when children are acquiring new mathemati- cal concepts (e.g., Watson, Campbell, & Collis, 1993) and research on word alge- bra problems (e.g., Tabachneck, Koedinger, & Nathan, 1994) suggest that different types of representation may also lead to completely different strategies. Finally, research on novice-expert differences (e.g., Chi, Feltovich, & Glaser, 1981) would predict that learners would find it more difficult to recognize the sim- ilarity between representations when their surface features differ. Consequently, we can see that for the mixed representations used in CENTS, failure of overlap occurred at a number of levels.
A definitive statement of the factors that affect translation between representa- tions rests upon an integrative taxonomy of representations and their use. Given the results of the experiments reported here, it is likely that such an integrative the- ory will require an understanding of the properties of both the represented and rep- resenting worlds. Within the representing world, a wide variety of factors-such as the modality of the representations (textual vs. graphical), level of abstraction, type of representations (static vs. dynamic), type of strategies, and interfaces to representations-could influence the learner's ability to coordinate representa- tions. In the represented world, the amount of available information, the resolution of information, and information redundancy can also contribute to the ease with which multi-representational systems may be used. Irrespective of the contribu- tions each of these factors makes to the translation process: The general lesson that we can learn from this research is that the more the format and operators ofrepre-
EXAMINING MULTI-REPRESENTATIONAL SYSTEMS 59
sentations differ the more difficult learners will find translating and integrating in- formation across representations.
This research emphasizes the importance of explicitly considering the design of multirepresentational environments in terms of the represented world, the repre- senting world, and the interactions between these two levels. It demonstrates that with similar representing worlds, where it is relatively straightforward to translate between representations, there are substantial gains in learning. When the repre- senting worlds are dissimilar, learners can find difficulty in translating between representations. However, if learners focus their attention on single appropriate representation, this can result in successful learning outcomes. This is only possi- ble if the design of the represented world ensures that this one representation en- capsulates all the necessary information.
ACKNOWLEDGMENTS
This research was supported by the Economic and Social Research Council at the Economic and Research Council Centre for Research in Development Instruction and Training.
The authors would like to thank Ben Williams, Dr. Caroline Windrum, and two anonymous referees for their help in preparing this article.
REFERENCES
Ainsworth, S. E. (1999). A functional taxonomy of multiple representations. Computers and Education, 33, 131-152.
Brenner, M. E., Mayer, R. E., Moseley, B., Brar, T., Duran, R., Smith Reed, B., & Webb, D. (1997). The role of multiple representations in learning algebra. American Education Research Journal, 34, 663-689.
Chandler, P., & Sweller, J. (1992). The split-attention effect as a factor in the design of instruction. Brit- ish Journal ofEducational Psychology, 62, 233-246.
Chi, M. T. H., Feltovich, P. J., & Glaser, R. (1981). Categorization and representation in physics prob- lems by experts and novices. Cognitive Science, 5, 121-152.
Clarke, H., & Shepherd, R. (1984) Thinkandsolve mental maths. Cambridge, England: Cambridge Uni- versity Press
Confrey, J. (1991). Function Probe?. Santa Barbara, CA: Intellimation Library for the Macintosh. Confrey, J., & Smith, E. (1994). Exponential functions, rates of change, and the multiplicative unit. Edu-
cational Studies in Mathematics, 26, 135-164. Confrey, J., Smith, E., Piliero, S., & Rizzuti, J. (1991). The use of contextual problems and multi-repre-
sentational software to teach the concept of functions. Final Project Report to the National Science Foundation and Apple Computers Inc.
Cronbach, L. J., & Snow, R. E. (1977). Aptitudes and instructional methods. New York: Irvington. de Jong, T., Ainsworth, S., Dobson, M., van der Hulst, A., Levonen, J., Reimann, P., Sime, J., van
Someren, M., Spada, H., & Swaak, J. (1998). Acquiring knowledge in science and math: the use of multiple representations in technology based learning environments. In M.W Van Someren, P.
60 AINSWORTH, BIBBY, WOOD
Reimann, H. Bozhimen, & T. de Jong (Eds.), Learning with multiple representations (pp 9-40). Amsterdam: Elsevier.
Dienes, Z. (1973). The six stages in the process oflearning mathematics. Slough, UK: National Founda- tion for Education Research-Nelson.
Dowker, A. (1992). Computational estimation strategies of professional mathematicians. Journal for Research in Mathematics Education, 23(1), 45-55.
Dufour-Janvier, B., Bednarz, N., & Belanger, M. (1987). Pedagogical considerations concerning the problem of representation. In C. Janvier (Ed.), Problems ofrepresentation in the teaching and learn- ing of mathematics (pp. 109-122). Hillsdale, NJ: Lawrence Erlbaum Associates, Inc.
Howe, C. J., Rodgers, C., & Tolmie, A. (1990). Physics in the primary school: Peer interaction and the understanding of floating and sinking. European Journal ofPsychology ofEducation, 4, 459-475.
Kaput, J. J. (1987). Towards a theory of symbol use in mathematics. In C. Janvier (Ed.), Problems ofrep- resentation in the teaching and learning of mathematics (pp. 159-196). Hillsdale, NJ: Lawrence Erlbaum Associates, Inc.
Kaput, J. J. (1989). Linking representations in the symbol systems of algebra. In S. Wagner & C. Kieran (Eds.), Research issues in the learning and teaching ofalgebra (pp. 167-194). Hillsdale, NJ: Law- rence Erlbaum Associates, Inc.
Kozma, R., Chin, C., Russel, J., & Marx, N. (2000). The roles of representations and tools in the chemis- try laboratory and their implications for chemistry learning. The Journal ofthe Learning Sciences, 9, 105-143.
Larkin, J. H., & Simon, H. A. (1987). Why a diagram is (sometimes) worth ten thousand words. Cogni- tive Science, 11, 65-99.
LeFevre, J., Greenham, S. L., & Waheed, N. (1993). The development of procedural and conceptual knowledge in computational estimation. Cognition and Instruction, 11, 95-132.
Lesh, R., Post, T., & Behr, M. (1987). Representations and translations among representations in mathe- matics learning and problem solving. In C. Janvier (Ed.), Problems ofrepresentation in the teaching and learning ofmathematics (pp. 33-40). Hillsdale, NJ: Lawrence Erlbaum Associates, Inc.
Lohse, G. L., Biolsi, K., Walker, N., & Rueler, H. (1994). A classification of visual representations. Communication of the ACM, 37(12), 36-49.
Mayer, R. E., & Anderson, R. B. (1992). The instructive animation: Helping students build connections between words and pictures in multimedia learning. Journal of Educational Psychology, 84, 444-452.
Mayer, R. E., & Sims, V. K. (1994). For whom is a picture worth a thousand words? Extensions of a dual coding theory of multimedia learning. Journal of Educational Psychology, 86, 339-401.
Palmer, S. E. (1978). Fundamental aspects of cognitive representation. In E. Rosch & B. B. Lloyd (Eds.), Cognition and categorization (pp. 259-303). Hillsdale, NJ: Lawrence Erlbaum Associates, Inc.
Reys, R. E., Rybolt, J. F., Bestgen, B. J., & Wyatt, J. W. (1982). Processes used by good computational estimators. Journal for Research in Mathematics Education, 13(3), 183-201.
Schoenfeld, A. H., Smith, J. P., & Arcavi, A. (1993). Learning: The microgenetic analysis of one stu- dent's evolving understanding of a complex subject matter domain. In R. Glaser (Ed.), Advances in instructionalpsychology, volume 4 (pp. 55-175). Hillsdale, NJ: Lawrence Erlbaum Associates, Inc.
Schwartz, B., & Dreyfus, T. (1993). Measuring integration of information in multi-representational software. Interactive Learning Environments, 3, 177-198.
Sowder, J. (1992). Estimation and number sense. In D. A. Grouws (Ed.), Handbook of research on teaching and learning mathematics (pp. 371-389). New York: Macmillan.
Sowder, J. T., & Wheeler, M. M. (1989). The development of concepts and strategies used in computa- tional estimation. Journal for Research in Mathematics Education, 20, 130-146.
Spiro, R. J., & Jehng, J-C. (1990). Cognitive flexibility and hypertext: Theory and technology for non- linear and multi-dimensional traversal of complex subject matter. In D. Nix & R. J. Spiro (Eds.),
EXAMINING MULTI-REPRESENTATIONAL SYSTEMS 61
Cognition, education and multi-media: Exploring ideas in high technology (pp. 163-205). Hillsdale, NJ: Lawrence Erlbaum Associates, Inc.
Sweller, J. (1988). Cognitive load during problem solving: Effects on learning. Cognitive Science, 12, 257-285.
Tabachneck, H. J. M., Koedinger, K. R.,
& Nathan, M. J. (1994). Towards a theoretical account of strat- egy use and sense making in mathematical problem solving. In A. Ram & K. Eiselt (Eds.), 16th Annual Conference of the Cognitive Science Society (pp. 836-841). Hillsdale, NJ: Lawrence Erlbaum Associates, Inc.
Tabachneck, H. J. M., Leonardo, A. M., & Simon, H. A. (1994). How does an expert use a graph? A model of visual & verbal inferencing in economics. In A. Ram & K. Eiselt (Ed.), 16th Annual Conference of the Cognitive Science Society, (pp. 842-847). Hillsdale, NJ: Lawrence Erlbaum Associates, Inc.
Trafton, P. R. (1986). Teaching computational estimation: Establishing an estimation mind-set. In H. L. Schoen & M. Zweng (Eds.), Estimation and mental computation (pp. 16-30). Reston, VA: National Council of Teachers of Mathematics.
Watson, J. M., Campbell, K. J., & Collis, K. F. (1993). Multimodal functioning in understanding frac- tions. Journal of Mathematical Behavior, 12(1), 45-62.
Yerushalmy, M. (1991). Student perceptions of aspects of algebraic function using multiple representa- tion software. Journal of Computer Assisted Learning, 7, 42-57.
Yerushalmy, M. (1997). Designing representations: Reasoning about functions of two variables. Jour- nal for Research in Mathematics Education, 28(4), 431-466.