Laser speckle imaging in the spatial frequency domain file10. S. J. Kirkpatrick, D. D. Duncan, and...
11
Laser speckle imaging in the spatial frequency domain Amaan Mazhar, 1,2 David J. Cuccia, 3 Tyler B. Rice, 2 Stefan A. Carp, 4,5 Anthony J. Durkin, 2 David A. Boas, 4,5 Bernard Choi, 1,2 and Bruce J. Tromberg 1,2,* 1 Department of Biomedical Engineering, University of California, Irvine, California 92612, USA 2 Beckman Laser Institute, University of California, Irvine, California 92612, USA 3 Modulated Imaging Inc., Technology Incubator Office, Irvine, California 92612, USA 4 Massachusetts General Hospital. Charlestown, Massachusetts 02129, USA 5 Athinoula A. Martinos Center for Biomedical Imaging, Charlestown, Massachusetts 02129, USA *[email protected] Abstract: Laser Speckle Imaging (LSI) images interference patterns produced by coherent addition of scattered laser light to map subsurface tissue perfusion. However, the effect of longer path length photons is typically unknown and poses a limitation towards absolute quantification. In this work, LSI is integrated with spatial frequency domain imaging (SFDI) to suppress multiple scattering and absorption effects. First, depth sensitive speckle contrast is shown in phantoms by separating a deep source (4 mm) from a shallow source (2 mm) of speckle contrast by using a high spatial frequency of illumination (0.24 mm 1 ). We develop an SFD adapted correlation diffusion model and show that with high frequency (0.24 mm 1 ) illumination, doubling of absorption contrast results in only a 1% change in speckle contrast versus 25% change using a planar unmodulated (0 mm 1 ) illumination. Similar absorption change is mimicked in vivo imaging a finger occlusion and the relative speckle contrast change from baseline is 10% at 0.26 mm 1 versus 60% at 0 mm 1 during a finger occlusion. These results underscore the importance of path length and optical properties in determining speckle contrast. They provide an integrated approach for simultaneous mapping of blood flow (speckle contrast) and oxygenation (optical properties) which can be used to inform tissue metabolism. © 2011 Optical Society of America OCIS codes: (170.6480) Spectroscopy, speckle; (170.3660) Light propagation in tissues. Reference and links 1. J. D. Briers and S. Webster, “Laser speckle contrast analysis (LASCA): a nonscanning, full-field technique for monitoring capillary blood flow,” J. Biomed. Opt. 1(2), 174–179 (1996). 2. S. J. Kirkpatrick, D. D. Duncan, R. K. Wang, and M. T. Hinds, “Quantitative temporal speckle contrast imaging for tissue mechanics,” J. Opt. Soc. Am. A 24(12), 3728–3734 (2007). 3. R. Bandyopadhyay, A. S. Gittings, S. S. Suh, P. K. Dixon, and D. J. Durian, “Speckle-visibility spectroscopy: A tool to study time-varying dynamics,” Rev. Sci. Instrum. 76(9), 093110–093111 (2005). 4. A. K. Dunn, H. Bolay, M. A. Moskowitz, and D. A. Boas, “Dynamic imaging of cerebral blood flow using laser speckle,” J. Cereb. Blood Flow Metab. 21(3), 195–201 (2001). 5. Y.-C. Huang, T. L. Ringold, J. S. Nelson, and B. Choi, “Noninvasive blood flow imaging for real-time feedback during laser therapy of port wine stain birthmarks,” Lasers Surg. Med. 40(3), 167–173 (2008). 6. J. D. Briers, “Laser Doppler, speckle and related techniques for blood perfusion mapping and imaging,” Physiol. Meas. 22(4), R35–R66 (2001). 7. D. D. Duncan, S. J. Kirkpatrick, J. C. Gladish, and S. A. Hurst, “Laser speckle contrast imaging for the quantitative assessment of flow,” Proc. SPIE 7176, 717603, 717603-8 (2009). 8. D. D. Duncan and S. J. Kirkpatrick, “Can laser speckle flowmetry be made a quantitative tool?” J. Opt. Soc. Am. A 25(8), 2088–2094 (2008). 9. B. Choi, J. C. Ramirez-San-Juan, J. Lotfi, and J. Stuart Nelson, “Linear response range characterization and in vivo application of laser speckle imaging of blood flow dynamics,” J. Biomed. Opt. 11(4), 041129 (2006). #144967 - $15.00 USD Received 1 Apr 2011; revised 5 May 2011; accepted 9 May 2011; published 13 May 2011 (C) 2011 OSA 1 June 2011 / Vol. 2, No. 6 / BIOMEDICAL OPTICS EXPRESS 1553
-
Upload
truongthuy -
Category
Documents
-
view
214 -
download
0
Transcript of Laser speckle imaging in the spatial frequency domain file10. S. J. Kirkpatrick, D. D. Duncan, and...

Laser speckle imaging in the spatial frequency
domain
Amaan Mazhar,1,2
David J. Cuccia,3 Tyler B. Rice,
2 Stefan A. Carp,
4,5 Anthony J.
Durkin,2 David A. Boas,
4,5 Bernard Choi,
1,2 and Bruce J. Tromberg
1,2,*
1Department of Biomedical Engineering, University of California, Irvine, California 92612, USA 2Beckman Laser Institute, University of California, Irvine, California 92612, USA
3Modulated Imaging Inc., Technology Incubator Office, Irvine, California 92612, USA 4Massachusetts General Hospital. Charlestown, Massachusetts 02129, USA
5Athinoula A. Martinos Center for Biomedical Imaging, Charlestown, Massachusetts 02129, USA *[email protected]
Abstract: Laser Speckle Imaging (LSI) images interference patterns
produced by coherent addition of scattered laser light to map subsurface
tissue perfusion. However, the effect of longer path length photons is
typically unknown and poses a limitation towards absolute quantification. In
this work, LSI is integrated with spatial frequency domain imaging (SFDI)
to suppress multiple scattering and absorption effects. First, depth sensitive
speckle contrast is shown in phantoms by separating a deep source (4 mm)
from a shallow source (2 mm) of speckle contrast by using a high spatial
frequency of illumination (0.24 mm1
). We develop an SFD adapted
correlation diffusion model and show that with high frequency (0.24 mm1
)
illumination, doubling of absorption contrast results in only a 1% change in
speckle contrast versus 25% change using a planar unmodulated (0 mm1
)
illumination. Similar absorption change is mimicked in vivo imaging a
finger occlusion and the relative speckle contrast change from baseline is
10% at 0.26 mm1
versus 60% at 0 mm1
during a finger occlusion. These
results underscore the importance of path length and optical properties in
determining speckle contrast. They provide an integrated approach for
simultaneous mapping of blood flow (speckle contrast) and oxygenation
(optical properties) which can be used to inform tissue metabolism.
© 2011 Optical Society of America
OCIS codes: (170.6480) Spectroscopy, speckle; (170.3660) Light propagation in tissues.
Reference and links
1. J. D. Briers and S. Webster, “Laser speckle contrast analysis (LASCA): a nonscanning, full-field technique for monitoring capillary blood flow,” J. Biomed. Opt. 1(2), 174–179 (1996).
2. S. J. Kirkpatrick, D. D. Duncan, R. K. Wang, and M. T. Hinds, “Quantitative temporal speckle contrast imaging
for tissue mechanics,” J. Opt. Soc. Am. A 24(12), 3728–3734 (2007). 3. R. Bandyopadhyay, A. S. Gittings, S. S. Suh, P. K. Dixon, and D. J. Durian, “Speckle-visibility spectroscopy: A
tool to study time-varying dynamics,” Rev. Sci. Instrum. 76(9), 093110–093111 (2005).
4. A. K. Dunn, H. Bolay, M. A. Moskowitz, and D. A. Boas, “Dynamic imaging of cerebral blood flow using laser speckle,” J. Cereb. Blood Flow Metab. 21(3), 195–201 (2001).
5. Y.-C. Huang, T. L. Ringold, J. S. Nelson, and B. Choi, “Noninvasive blood flow imaging for real-time feedback during laser therapy of port wine stain birthmarks,” Lasers Surg. Med. 40(3), 167–173 (2008).
6. J. D. Briers, “Laser Doppler, speckle and related techniques for blood perfusion mapping and imaging,” Physiol.
Meas. 22(4), R35–R66 (2001). 7. D. D. Duncan, S. J. Kirkpatrick, J. C. Gladish, and S. A. Hurst, “Laser speckle contrast imaging for the
quantitative assessment of flow,” Proc. SPIE 7176, 717603, 717603-8 (2009).
8. D. D. Duncan and S. J. Kirkpatrick, “Can laser speckle flowmetry be made a quantitative tool?” J. Opt. Soc. Am. A 25(8), 2088–2094 (2008).
9. B. Choi, J. C. Ramirez-San-Juan, J. Lotfi, and J. Stuart Nelson, “Linear response range characterization and in
vivo application of laser speckle imaging of blood flow dynamics,” J. Biomed. Opt. 11(4), 041129 (2006).
#144967 - $15.00 USD Received 1 Apr 2011; revised 5 May 2011; accepted 9 May 2011; published 13 May 2011(C) 2011 OSA 1 June 2011 / Vol. 2, No. 6 / BIOMEDICAL OPTICS EXPRESS 1553

10. S. J. Kirkpatrick, D. D. Duncan, and E. M. Wells-Gray, “Detrimental effects of speckle-pixel size matching in
laser speckle contrast imaging,” Opt. Lett. 33(24), 2886–2888 (2008). 11. S. Yuan, Y. Chen, A. K. Dunn, and D. a. Boas, “Noise analysis in laser speckle contrast imaging,” Animals 7563,
75630J (2010).
12. A. B. Parthasarathy, W. J. Tom, A. Gopal, X. Zhang, and A. K. Dunn, “Robust flow measurement with multi-exposure speckle imaging,” Opt. Express 16(3), 1975–1989 (2008).
13. D. D. Duncan, S. J. Kirkpatrick, and R. K. Wang, “Statistics of local speckle contrast,” J. Opt. Soc. Am. A 25(1),
9–15 (2008). 14. P. Zakharov, A. Völker, A. Buck, B. Weber, and F. Scheffold, “Quantitative modeling of laser speckle imaging,”
Opt. Lett. 31(23), 3465–3467 (2006).
15. D. A. Boas and A. K. Dunn, “Laser speckle contrast imaging in biomedical optics,” J. Biomed. Opt. 15(1), 011109 (2010).
16. M. Draijer, E. Hondebrink, T. Leeuwen, and W. Steenbergen, “Review of laser speckle contrast techniques for
visualizing tissue perfusion,” Lasers Med. Sci. 24(4), 639–651 (2009). 17. D. J. Cuccia, F. Bevilacqua, A. J. Durkin, F. R. Ayers, and B. J. Tromberg, “Quantitation and mapping of tissue
optical properties using modulated imaging,” J. Biomed. Opt. 14(2), 024012 (2009).
18. D. J. Cuccia, F. Bevilacqua, A. J. Durkin, and B. J. Tromberg, “Modulated imaging: quantitative analysis and tomography of turbid media in the spatial-frequency domain,” Opt. Lett. 30(11), 1354–1356 (2005).
19. A. Mazhar, D. J. Cuccia, S. Gioux, A. J. Durkin, J. V. Frangioni, and B. J. Tromberg, “Structured illumination
enhances resolution and contrast in thick tissue fluorescence imaging,” J. Biomed. Opt. 15(1), 010506 (2010). 20. D. A. Boas and A. G. Yodh, “Spatially varying dynamical properties of turbid media probed with diffusing
temporal light correlation,” J. Opt. Soc. Am. A 14(1), 192–215 (1997).
21. F. Ayers, A. Grant, D. Kuo, D. J. Cuccia, and A. J. Durkin, “Fabrication and characterization of silicone-based tissue phantoms with tunable optical properties in the visible and near infrared domain,” in Proc. SPIE, 2008),
6870E.
22. K. K. Bizheva, A. M. Siegel, and D. A. Boas, “Path-length-resolved dynamic light scattering in highly scattering random media: The transition to diffusing wave spectroscopy,” Phys. Rev. E Stat. Phys. Plasmas Fluids Relat.
Interdiscip. Topics 58(6), 7664–7667 (1998). 23. B. Varghese, V. Rajan, T. G. Van Leeuwen, and W. Steenbergen, “Measurement of particle flux in a static matrix
with suppressed influence of optical properties, using low coherence interferometry,” Opt. Express 18(3), 2849–
2857 (2010). 24. V. Rajan, B. Varghese, T. G. Van Leeuwen, and W. Steenbergen, “Influence of tissue optical properties on laser
Doppler perfusion imaging, accounting for photon penetration depth and the laser speckle phenomenon,” J.
Biomed. Opt. 13(2), 024001 (2008). 25. O. B. Thompson and M. K. Andrews, “Tissue perfusion measurements: multiple-exposure laser speckle analysis
generates laser Doppler-like spectra,” J. Biomed. Opt. 15(2), 027015 (2010).
26. D. A. Boas, L. E. Campbell, and A. G. Yodh, “Scattering and Imaging with Diffusing Temporal Field
Correlations,” Phys. Rev. Lett. 75(9), 1855–1858 (1995).
27. C. Cheung, J. P. Culver, K. Takahashi, J. H. Greenberg, and A. G. Yodh, “In vivo cerebrovascular measurement
combining diffuse near-infrared absorption and correlation spectroscopies,” Phys. Med. Biol. 46(8), 2053–2065 (2001).
28. C. A. Thompson, K. J. Webb, and A. M. Weiner, “Diffusive media characterization with laser speckle,” Appl.
Opt. 36(16), 3726–3734 (1997). 29. P. B. Jones, H. K. Shin, D. A. Boas, B. T. Hyman, M. A. Moskowitz, C. Ayata, and A. K. Dunn, “Simultaneous
multispectral reflectance imaging and laser speckle flowmetry of cerebral blood flow and oxygen metabolism in
focal cerebral ischemia,” J. Biomed. Opt. 13(4), 044007 (2008). 30. S. D. Konecky, A. Mazhar, D. Cuccia, A. J. Durkin, J. C. Schotland, and B. J. Tromberg, “Quantitative optical
tomography of sub-surface heterogeneities using spatially modulated structured light,” Opt. Express 17(17),
14780–14790 (2009). 31. J. R. Weber, D. J. Cuccia, and B. J. Tromberg, “Modulated imaging in layered media,” in Conf Proc IEEE Eng
Med Biol Soc, 2006), 6674–6676.
1. Introduction
Laser Speckle Imaging (LSI) is a wide-field imaging method used for mapping blood flow
and mechanical properties in tissue [1,2]. LSI typically uses a CCD camera to image the
interference (i.e., speckle) patterns produced by the coherent addition of scattered laser light
propagating with varying path lengths. The motion of scattering particles causes intensity
fluctuations in the speckle pattern that can be analyzed with temporal, spatial, or combined
spatiotemporal algorithms [3]. For example, laser Doppler flowmetry (LDF) and diffuse
correlation spectroscopy (DCS) analyze fluctuations at a single point in space over time. The
LSI technique has been used to track relative changes in blood flow in tissues such as skin and
brain over a specified time [4,5].
#144967 - $15.00 USD Received 1 Apr 2011; revised 5 May 2011; accepted 9 May 2011; published 13 May 2011(C) 2011 OSA 1 June 2011 / Vol. 2, No. 6 / BIOMEDICAL OPTICS EXPRESS 1554

Fercher and Briers introduced the LSI method using spatial statistics to characterize the
fluctuations at the surface [6]. This method enables imaging of two-dimensional structure and
flow. A single snapshot taken at an exposure time on the order of the speckle correlation time
is analyzed using spatial statistics. The local speckle contrast, K, is calculated from a
reflectance image as:
sKI
(1)
where σs and <I> represent the spatial standard deviation and mean pixel intensity in a region
of interest. In practice, a speckle contrast image is calculated with use of a sliding window
operator moved across the entire image. In principle, regions with increased flow result in
rapid intensity fluctuations. During a single camera exposure (typically on the order of 1-
20ms), these fluctuations will reduce speckle visibility as compared with regions with
relatively less motion. Thus, speckle contrast is inversely proportional to motion in a sample.
Several methods have been suggested to convert speckle contrast to a measure of flow in
tissue [7]. Assumptions must be made to describe the nature of the motion. Methods using
Gaussian, Lorentzian, hybrid, random, and calibration models of perfusion have been
described but absolute flow quantification remains difficult [7,8]. In general, the speckle
contrast value is inversely related to blood flow and a metric such as the Speckle Flow Index
(SFI) can be defined to assess relative flow in an image [9]. Regardless of the model used, the
calculation of an accurate speckle contrast value is crucial. This manuscript describes factors
that affect the measured speckle contrast value and assumes random Brownian motion for all
samples.
Measurement and model considerations for accurate measurement of speckle contrast
depend on many factors. These include the ratio of speckle size to pixel size [10], speckle
window size, choice of dynamic model, noise [11], and effects of static scattering [12–14].
Comprehensive reviews of image processing algorithms and applications have covered many
of these studies [15,16].
LSI is used to measure many types of tissue such as brain and skin with a large span of
optical properties and optical path length. In addition, optical path length can change for a
given tissue during dynamic physiological measurements. Thus, absolute quantification of
speckle contrast remains a significant challenge due to modulation of the speckle pattern
resulting from multiple light scattering and variation in optical path length. We systematically
evaluate the impact of path length for LSI by introducing an approach for modulating LSI in
the spatial frequency domain. Spatial frequency domain imaging (SFDI) is used to quantify
absorption and scattering properties of turbid media by employing multi-frequency structured
light illumination scheme and model based reconstruction [17]. Specifically, the sample is
illuminated with a periodic illumination pattern with various frequencies of the form:
0
0
,, [1 cos(2 )]
2x
S x yS x y M f (2)
where S0, M0, fx, and α are the source intensity distribution, modulation depth of the periodic
pattern, spatial frequency, and spatial phase respectively. The diffuse reflectance imaged with
a CCD camera, is composed of AC and DC components:
DCAC III (3)
Assuming that the pattern does not vary in the y-direction (i.e., sinusoidal pattern with
amplitude variation only in the x-direction), the measured AC component of the reflected
intensity, IAC, can be characterized as:
#144967 - $15.00 USD Received 1 Apr 2011; revised 5 May 2011; accepted 9 May 2011; published 13 May 2011(C) 2011 OSA 1 June 2011 / Vol. 2, No. 6 / BIOMEDICAL OPTICS EXPRESS 1555

( , ) cos(2 )AC AC x xI M x f f (4)
where MAC(x,fx) represents the modulation of reflected photon density wave. MAC depends on
the optical properties of the tissue and can be estimated with diffusion-based light transport
algorithms. To extract MAC(x,fx) from measurements of IAC, a signal demodulation algorithm
is employed. The tissue is illuminated with a sinusoidal pattern at a specific fx with three
relative spatial phases α = 0, 2π/3, and 4π/3 radians. MAC(x,fx) is then calculated with the
following demodulation equation:
2 2 2 1/2
1 2 2 3 3 2
2( , ) [( ) ( ) ( ) ]
3AC xM x f I I I I I I (5)
In practice, MAC(x,fx) is determined from images collected at multiple fx. As fx increases, the
contribution of longer path length photons to the measured reflectance is reduced. There are
two major implications due to this phenomenon. First, since absorption lengths in the near
infrared (NIR) are much greater than the transport scattering length (>10-fold), an increase in
fx means that MAC(x,fx) is progressively insensitive to absorption. Thus, measurements at
multiple fx values enables quantitation of both absorption and scattering properties [17,18]. To
estimate local tissue optical properties, we fit MAC(x,fx) to predictions of MAC calculated with
a forward diffusion or Monte Carlo light transport model. Second, multiply scattering photons
can be suppressed by increasing fx, resulting in improved axial/lateral resolution and higher
contrast of superficial structures [18,19].
In this work, we integrate LSI and SFDI in order to understand the impact of path length
and optical properties on speckle contrast. First, a model framework for calculation of speckle
contrast in the spatial frequency domain is presented. Second, initial phantom experiments
show that suppression of long path length photons in the SFD result in speckle contrast
measurements that are (1) depth sensitive and (2) closer to unity. Third, the impact of static
optical properties is discussed in the context of measured speckle contrast. Finally, a method
is presented to calculate optical properties and speckle contrast in a single measurement. This
method is used to calculate bulk optical properties and speckle contrast simultaneously in
phantoms and a dynamic in vivo skin perfusion measurement.
2. Correlation diffusion equation
Although intensity fluctuations are quantified in LSI measurements (Eq. (1)), the speckle
contrast can also be written as a function of the electric field temporal autocorrelation
function, 1G , and camera exposure time, T, as derived in previous literature [3,8,14]:
2
102
2
1
21
0
T
G T dTK
G
(6)
1G is related to the intensity autocorrelation function, 2G , via the Siegert relationship.
The factor β accounts for polarization and coherence effects of the system. Theoretically, β =
1, but in practice it will be smaller. For simplicity, we proceed with β = 1. It has also been
shown that the correlation diffusion equation can be used to model 1G in a turbid media
[20]:
2
1 1effG G q (7)
In these equations, q is the source, µtr = (µa + µs') the transport or total attenuation coefficient,
µa the absorption coefficient, µs', the reduced scattering coefficient, µa,dyn is the dynamic
#144967 - $15.00 USD Received 1 Apr 2011; revised 5 May 2011; accepted 9 May 2011; published 13 May 2011(C) 2011 OSA 1 June 2011 / Vol. 2, No. 6 / BIOMEDICAL OPTICS EXPRESS 1556

absorption term, and µeff = [3µa,dynµtr]1/2
. The µa,dyn term is unique to this framework as it
incorporates the motion in the turbid system:
2 2
,
1'
3a dyn a s ok r (8)
Here 2
o
nk
is the wave number of the propagating photons, and 2r is the mean
square displacement of the dynamic scattering particles. Note that for Brownian motion
2 6 Br D , where DB is the Brownian diffusion coefficient. The solution for Eq. (7) is
in the same form as the photon fluence equation in the diffuse regime, except that the
absorption term is modified [20]. If we apply the solution for the photon diffusion equation in
the spatial frequency domain for a sinusoidally modulated light source [17], 1G in the
SFD becomes
A
AP
G
tr
eff
tr
eff
tr
s
3'
1'
'3 0
1
(9)
In this equation, µeff ’ = (µeff2 + k
2)
1/2, where k is the spatial frequency of the illumination
pattern (2πfx), Po is incident optical power, and A is a constant that depends on choice of
boundary conditions [17]. In this work, a partial current boundary condition is used, and A
becomes
2
1 0.710 1.440; 0.0636 0.668
2(1 )
eff
eff
eff
RA R n
R n n
(10)
where n is the index of refraction of the turbid media. Based on these derivations, a model has
been established to characterize the speckle contrast in the spatial frequency domain using a
diffusion approximation to correlation transport.
3. Materials and methods
3.1 Instrumentation
LSI instruments consist of two major components: a coherent light source and a CCD camera.
SFDI instruments require a light source, a spatial light modulator (SLM), and a CCD camera.
The similarity in the required instrumentation for the two methods allows for their integration
into a single-platform system using a 785nm, long-coherence-length source (CrystaLaser,
Reno, NV) to illuminate a reflective liquid crystal-on-silicon (LCOS) SLM (1080 L-RC
Holoeye, Lake Forest, CA) (Fig. 1). Linearly polarized light was used to illuminate to the
LCOS micro display in conjunction with a beam splitter. A diffusing glass was used to expand
the light prior to reaching the SLM. The molecules in the liquid crystal layer change
orientation based on the applied voltage, which controls the amplitude and the polarization of
the light at each pixel. Light whose polarization state was fully rotated, was reflected back
through the beam splitter, resulting in projection of spatially-modulated, coherent light
patterns onto the sample. Three spatial phases (α = 0, 2π/3, and 4π/3 radians) were used. A 12-
bit, cooled CCD camera (Retiga EXi, Q-Imaging, Surrey, Canada) was used to capture the
reflectance pattern. The camera exposure time was set to 15 ms unless noted otherwise. SLM
pattern projection and image acquisition were controlled with software written in C# and data
reduction performed with software written in MATLAB (The Mathworks, Natick, MA).
#144967 - $15.00 USD Received 1 Apr 2011; revised 5 May 2011; accepted 9 May 2011; published 13 May 2011(C) 2011 OSA 1 June 2011 / Vol. 2, No. 6 / BIOMEDICAL OPTICS EXPRESS 1557

Fig. 1. System diagram.
3.2 Phantom experiments
Tissue-like polydimethysiloxane (PDMS) phantoms were fabricated using the method
described by Ayers et al. [21]. The phantom was fabricated with tissue-like µa and µs’ values
of 0.01 mm1
and 0.8 mm1
, respectively at 785 nm. Two 2 mm diameter tubes were placed at
depths of 2 mm and 4 mm, respectively, and a syringe pump was used to induce flow of a
scattering liquid through the tubes at a speed of 6 mm/s (Fig. 2(a)). The optical properties of
the liquid were matched to the PDMS phantoms. fx values between 0 mm1
and 0.25 mm1
were used, in intervals of 0.01mm1
.
For each reflectance image captured at a specific spatial frequency (fx) and α, a 7x7 sliding
window was applied to generate maps of local mean pixel intensity and local standard
deviation. For each fx, the demodulation algorithm (Eq. (5)) was applied to calculate
separately a demodulated mean intensity image and a demodulated standard deviation image.
To compute local speckle contrast for a given spatial frequency (fx), the quotient image of the
demodulated mean and standard deviation images was calculated, resulting in a spatial
frequency dependent speckle contrast image.
The distribution of photon path lengths is an important consideration for understanding
speckle contrast. Multiple scattering and absorption events affect the photon path length
distribution. An increase in reduced scattering has been shown to reduce speckle contrast due
to longer photon path lengths [14]. Similarly, an increase in absorption suppresses the
contribution of long path length photons and results in an increase in speckle contrast [20,22].
To demonstrate this experimentally, a titration of scattering (0.5 mm1
< µs’ < 4 mm1
) and
absorption (0.0025 mm1
< µa < 0.08 mm1
) coefficients was performed at multiple exposure
times. Liquid phantoms were used for this portion of this study with Intralipid (Baxter
#144967 - $15.00 USD Received 1 Apr 2011; revised 5 May 2011; accepted 9 May 2011; published 13 May 2011(C) 2011 OSA 1 June 2011 / Vol. 2, No. 6 / BIOMEDICAL OPTICS EXPRESS 1558

Healthcare, Deerfield, IL) used as primary scattering agent and water soluble nigrosin (Sigma-
Aldrich, St. Louis, MO) was used as the absorbing agent.
3.3 In vivo experiments
An occlusion measurement was performed in vivo to determine the impact of our findings in
tissue. A tourniquet was applied to the finger of a volunteer for 10 minutes and released after
baseline data were collected over two minutes. The tourniquet was designed to occlude
arterial and venous flow. Time-resolved optical properties and the spatial-frequency
dependent speckle contrast were calculated for the occluded region.
For this experiment, a 633 nm HeNe laser was used to image the occlusion instead of a
785 nm laser. This wavelength was chosen to highlight the impact of changes in optical
properties during a hemodynamic measurement. In an arterial/venous occlusion, oxy-
hemoglobin (ctO2Hb) is converted to deoxy-hemoglobin (ctHHb) as the blood supply is shut
down and tissue metabolic demand persists. At 633 nm, the molar extinction coefficient of
ctHHb is approximately ten times larger than ctO2Hb. Thus, the conversion of hemoglobin
changes the absorption at 633 nm even if total blood volume remains the same.
4. Results
4.1 Depth-sensitive speckle characterization
Fig. 2. Spatial frequency depth speckle contrast maps. (a) A PDMS phantom with two tubes separated by 2 mm and buried 2 mm and 4 mm below the surface was fabricated, (b)
Horizontal line profiles of (c-e) demodulated maps at three spatial frequencies shows increased
sensitivity to 2 mm superficial tube flow (centered at left arrow) compared to 4 mm deep flow (centered at right arrow) as spatial frequency increases.
With increasing fx, the contribution of the scattering liquid in the deeper tube to the overall
local speckle contrast map decreased (Fig. 2(b)). At fx = 0 mm1
, which is identical to the
uniform illumination used typically in LSI, contributions to speckle contrast from scattering
liquid in both tubes, was apparent (Fig. 2(c)). Although an identical flow rate of 6 mm/s was
achieved within both tubes, the speckle contrast associated with flow in the deeper tube was
higher due to the relatively larger contribution of light scattering from the overlying unmoving
#144967 - $15.00 USD Received 1 Apr 2011; revised 5 May 2011; accepted 9 May 2011; published 13 May 2011(C) 2011 OSA 1 June 2011 / Vol. 2, No. 6 / BIOMEDICAL OPTICS EXPRESS 1559
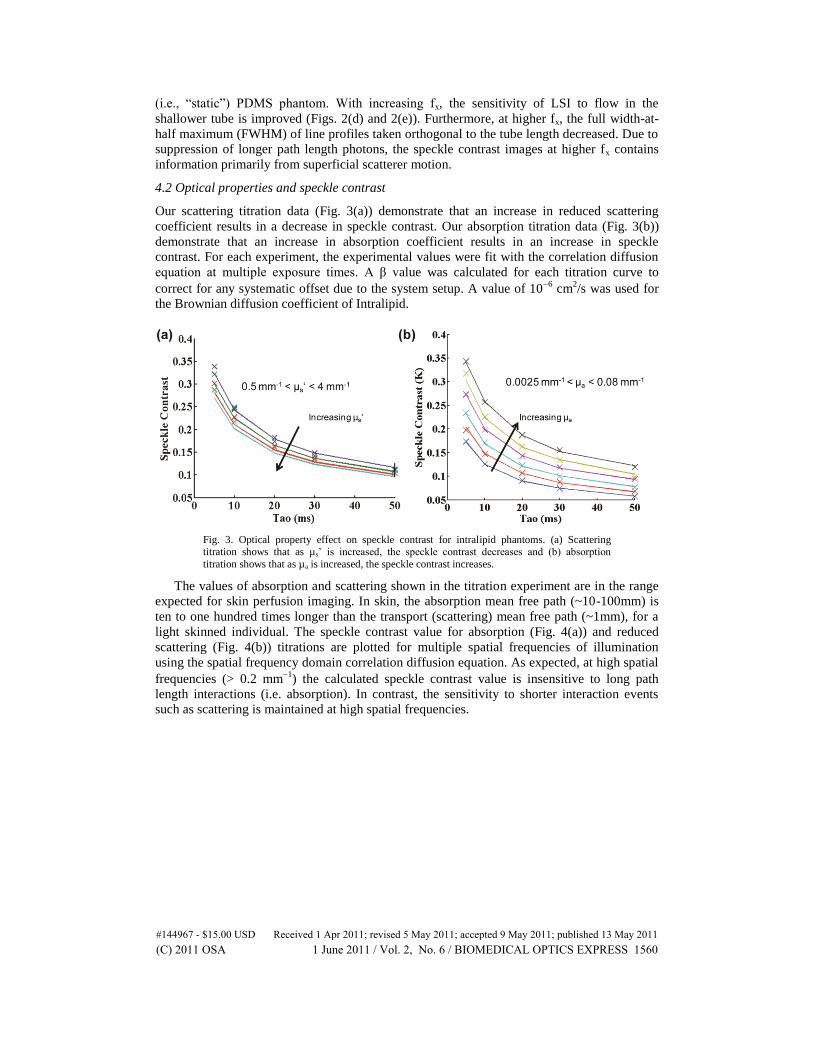
(i.e., “static”) PDMS phantom. With increasing fx, the sensitivity of LSI to flow in the
shallower tube is improved (Figs. 2(d) and 2(e)). Furthermore, at higher fx, the full width-at-
half maximum (FWHM) of line profiles taken orthogonal to the tube length decreased. Due to
suppression of longer path length photons, the speckle contrast images at higher fx contains
information primarily from superficial scatterer motion.
4.2 Optical properties and speckle contrast
Our scattering titration data (Fig. 3(a)) demonstrate that an increase in reduced scattering
coefficient results in a decrease in speckle contrast. Our absorption titration data (Fig. 3(b))
demonstrate that an increase in absorption coefficient results in an increase in speckle
contrast. For each experiment, the experimental values were fit with the correlation diffusion
equation at multiple exposure times. A β value was calculated for each titration curve to
correct for any systematic offset due to the system setup. A value of 106
cm2/s was used for
the Brownian diffusion coefficient of Intralipid.
Fig. 3. Optical property effect on speckle contrast for intralipid phantoms. (a) Scattering titration shows that as µs’ is increased, the speckle contrast decreases and (b) absorption
titration shows that as µa is increased, the speckle contrast increases.
The values of absorption and scattering shown in the titration experiment are in the range
expected for skin perfusion imaging. In skin, the absorption mean free path (~10-100mm) is
ten to one hundred times longer than the transport (scattering) mean free path (~1mm), for a
light skinned individual. The speckle contrast value for absorption (Fig. 4(a)) and reduced
scattering (Fig. 4(b)) titrations are plotted for multiple spatial frequencies of illumination
using the spatial frequency domain correlation diffusion equation. As expected, at high spatial
frequencies (> 0.2 mm1
) the calculated speckle contrast value is insensitive to long path
length interactions (i.e. absorption). In contrast, the sensitivity to shorter interaction events
such as scattering is maintained at high spatial frequencies.
#144967 - $15.00 USD Received 1 Apr 2011; revised 5 May 2011; accepted 9 May 2011; published 13 May 2011(C) 2011 OSA 1 June 2011 / Vol. 2, No. 6 / BIOMEDICAL OPTICS EXPRESS 1560

Fig. 4. Correlation Diffusion Equation in the Spatial Frequency Domain. (a) Speckle contrast
has reduced sensitivity to absorption at high spatial frequencies. (b) Speckle contrast retains
sensitivity to reduced scattering at high spatial frequencies.
4.3 Dynamic in vivo measurement
This method is also capable of simultaneous measurement of optical properties (Fig. 5). To
extract tissue optical properties, the SFDI analysis method described above, was applied to the
demodulated mean intensity image at each fx. In other words, the same spatially-modulated
coherent illumination data set was used to calculate both optical properties and speckle
contrast (Fig. 5).
Fig. 5. Data flow for modulated speckle. Sample images are from a hand with an occluded
middle finger.
#144967 - $15.00 USD Received 1 Apr 2011; revised 5 May 2011; accepted 9 May 2011; published 13 May 2011(C) 2011 OSA 1 June 2011 / Vol. 2, No. 6 / BIOMEDICAL OPTICS EXPRESS 1561

According to extracted SFDI data, an 80% increase in absorption was observed during the
occlusion as ctO2Hb was consumed (Fig. 6(a)). The scattering value decreased slightly, most
likely due to some cellular swelling, but the percentage change is less than 3% (Fig. 6(b)). A
multiple frequency measurement of speckle contrast demonstrated the presence of spatial
frequency-dependent flow dynamics in the tissue (Fig. 6(c)). During occlusion, the maximum
change in speckle contrast at a high frequency (0.26 mm1
), was much less (10% vs. 75%)
than that observed with planar speckle illumination during occlusion. Following release, the
peak absolute magnitude of the change again was lower (30% vs. 40%) with data collected at
the higher spatial frequency.
Fig. 6. In vivo demonstration of spatial frequency dependent speckle contrast. (a) Absorption time trace, (b) reduced scattering time trace, and (c) spatial frequency dependent speckle
contrast time trace. Red arrows indicate start and end of occlusion.
5. Discussion
Previous research has shown that tissue acts as a low-pass filter for an incoherent light source
[18]. In this work, the same principle has been used for coherent illumination in order to
separate superficial sources of speckle contrast from deep sources of speckle contrast. This
observation suggests that sources of speckle contrast can be resolved in depth, although
methods for quantitative reconstruction require further investigation. Recent work on laser
Doppler flowmetry showed that optical path length is an important consideration during
measurement [23,24]. Laser Doppler spectra have also been shown to be similar to laser
speckle analysis for tissue perfusion measurements [25]. In this paper, the effect of optical
path length on speckle contrast was modeled and demonstrated in phantoms for cases that
satisfy the correlation diffusion regime. Thus, it is important to note that for many
applications, these findings explain a trend: an increase in µa increases speckle contrast and an
increase in µs’ decreases speckle contrast when measured in a reflectance geometry. In our
model, the dynamic scattering term (Eq. (8)) increases the effective absorption which we refer
to as dynamic absorption. Typically, the dynamic absorption needs to be an order of
magnitude lower than reduced scattering for the model to be absolutely valid. This criterion
may not be satisfied in tissue at longer exposure times (~10 ms) and for cases with rapid or
highly ordered flow. Thus, the diffusion approximation may not be applicable and Monte
Carlo modeling of correlation transport is needed to understand this system.
These studies have used a single platform that is able to image both optical properties
(absorption and reduced scattering) and speckle contrast. An occlusion measurement (Fig. 6)
shows concurrent changes in absorption, scattering and spatial-frequency dependent speckle
contrast. The variation in spatial-frequency dependent speckle contrast shown in the arm
occlusion could be due to two effects that currently cannot be decoupled. First, at higher
spatial frequencies, the sampling volume is more superficial. The majority of blood vessels
are located in the dermis, which may not be adequately sampled at high fx. Second, the higher
frequencies diminish the impact of long path photons. This could suppress the effects of
absorption changes at 633 nm during occlusion and represent a more accurate change in
contrast. Trends suggest both effects and thus the full impact of optical properties on speckle
#144967 - $15.00 USD Received 1 Apr 2011; revised 5 May 2011; accepted 9 May 2011; published 13 May 2011(C) 2011 OSA 1 June 2011 / Vol. 2, No. 6 / BIOMEDICAL OPTICS EXPRESS 1562

contrast in vivo is unclear. The dynamics need to be modeled for tissue and may vary based on
applications (i.e. skin perfusion vs. vessel imaging).
In the results discussed so far, imaging has been limited to perfusion applications with low
spatial frequency content. Samples with high spatial frequency content may not be a suitable
subject for this simultaneous measurement. The smoothing used to calculate optical properties
of samples with a coherent light source will affect the resolution of the final image. Further
work is needed to understand these phenomena.
6. Conclusions
The introduction of multiple-frequency spatially modulated light for laser speckle imaging
enables gating of long path length interactions. First, qualitative suppression of deeper sources
of speckle contrast modulation in phantoms occurs with higher spatial frequencies. Second,
our data suggest that longer path length interactions are suppressed at higher spatial
frequencies. Based on this, a change in optical properties is shown to affect the speckle
contrast value in an Intralipid titration experiment. Specifically, a two-fold increase in
absorption translates to a 25% increase in speckle contrast value for Intralipid phantoms. This
magnitude of change in absorption is observed in skin perfusion imaging during an occlusion
measurement at 633 nm. A multi-frequency illumination scheme shows spatial-frequency
dependent effects, including speckle contrast for a dynamic measurement. This dependence is
due to a combination of differential partial volume sampling and suppression of absorption.
Further work using Monte Carlo based correlation transport in the spatial frequency domain
will help understand this problem.
In this work, a platform has been developed to simultaneously image optical properties
and speckle contrast. This is the frequency domain analog of the fiber-probe based geometry
developed by Boas et al. to extract optical properties in DCS [26,27]. Optical properties have
also been calculated using a source with coherence length that is comparable to the optical
path length [28]. Multi-spectral imaging has already been performed with planar LSI in the
brain in order to calculate relative metabolic rate of oxygen consumption [29]. A multi-
spectral embodiment of this platform would allow calculation of metabolic extraction rate
with simultaneous measurement of path length corrected oxygen utilization and
hemodynamics. Finally, SFDI methods have shown utility in tomography applications
suggesting that further model development for speckle contrast in the spatial frequency
domain could help quantify flow speed and correct for partial volume effects [30,31].
Acknowledgments
In addition to the co-authors, the primary author would like to thank Professor Vasan
Venugopalan, Dr. Soren Konecky, Dr. Eugene Huang, and the Virtual Photonics group at
Beckman Laser Institute for their insight regarding concepts/models presented in this work.
This research was made possible by the Laser Microbeam and Medical Program (LAMMP),
an NIH Biomedical Technology Resource, Grant No. P41-RR01192, the Beckman
Foundation, and the Military Photomedicine Program, AFOSR Grant No. FA9550-08-1-0384.
#144967 - $15.00 USD Received 1 Apr 2011; revised 5 May 2011; accepted 9 May 2011; published 13 May 2011(C) 2011 OSA 1 June 2011 / Vol. 2, No. 6 / BIOMEDICAL OPTICS EXPRESS 1563