Laser Scanning Technology for Bridge Monitoring5 Laser Scanning Technology for Bridge Monitoring...
24
5 Laser Scanning Technology for Bridge Monitoring Shen-En Chen Department of Civil and Environmental Engineering University of North Carolina at Charlotte USA 1. Introduction After the collapse of the Minnesota I-35 bridge (August 1, 2007), there has been a renewed interest in the US to enhance bridge infrastructure monitoring (Liu et al., 2009). Other than developing traditional inspection and material testing techniques, there has been also increased discussions about possible applications of Commercial Remote Sensing (CRS) technologies for civil infrastructure monitoring (Al-Turk & Uddin, 1999, Shinozuka & Rejajaie, 2000, Chen et al., 2011). Laser scanning techniques are one of the remote sensing technologies that play significant role in environmental and infrastructure evaluation and monitoring. However, there are different sensing requirements for monitoring physical structures such as bridges, than conventional geospatial applications such as air quality, environmental impact and transportation operations, etc. The most important of which is the sensor resolution requirement. This chapter discusses critical bridge monitoring issues and provides examples of applications of two laser scanner technologies that are currently being developed for bridge monitoring: 1) range finding laser (static) and 2) scanning laser vibrometer (dynamic). Both laser systems are terrestrial and single point systems that utilize mechanical or optical scanning mechanisms to create a field of view (FOV) of the optical receiver. The range finding laser, also called LiDAR (for Light Detection and Ranging), is based on the transmission and receiving of pulsed lights. By determining the heterodyne laser beam phase shifts, scanning LiDAR can detect the distance information from a plane of data points, called point cloud. The point cloud information, which basically consists of the physical positions of any surface that the laser “sees”, can then be used to detect useful critical information about a structure including the elevation (underclearance), surface (damage quantification) and deformation under loading (deflection), etc. Contrast to conventional analysis of photographic images, relatively simple algorithms can be used to manipulate the geometric point cloud data to retrieve the afore-mentioned information. Other bridge-related issues including validation of new constructions and comparisons before- and after critical event, can also be extracted from LiDAR scans. www.intechopen.com
Transcript of Laser Scanning Technology for Bridge Monitoring5 Laser Scanning Technology for Bridge Monitoring...
5
Laser Scanning Technology for Bridge Monitoring
Shen-En Chen Department of Civil and Environmental Engineering
University of North Carolina at Charlotte USA
1. Introduction
After the collapse of the Minnesota I-35 bridge (August 1, 2007), there has been a renewed
interest in the US to enhance bridge infrastructure monitoring (Liu et al., 2009). Other than
developing traditional inspection and material testing techniques, there has been also
increased discussions about possible applications of Commercial Remote Sensing (CRS)
technologies for civil infrastructure monitoring (Al-Turk & Uddin, 1999, Shinozuka &
Rejajaie, 2000, Chen et al., 2011). Laser scanning techniques are one of the remote sensing
technologies that play significant role in environmental and infrastructure evaluation and
monitoring. However, there are different sensing requirements for monitoring physical
structures such as bridges, than conventional geospatial applications such as air quality,
environmental impact and transportation operations, etc. The most important of which is
the sensor resolution requirement.
This chapter discusses critical bridge monitoring issues and provides examples of
applications of two laser scanner technologies that are currently being developed for
bridge monitoring: 1) range finding laser (static) and 2) scanning laser vibrometer
(dynamic). Both laser systems are terrestrial and single point systems that utilize
mechanical or optical scanning mechanisms to create a field of view (FOV) of the optical
receiver.
The range finding laser, also called LiDAR (for Light Detection and Ranging), is based on
the transmission and receiving of pulsed lights. By determining the heterodyne laser
beam phase shifts, scanning LiDAR can detect the distance information from a plane of
data points, called point cloud. The point cloud information, which basically consists of
the physical positions of any surface that the laser “sees”, can then be used to detect
useful critical information about a structure including the elevation (underclearance),
surface (damage quantification) and deformation under loading (deflection), etc. Contrast
to conventional analysis of photographic images, relatively simple algorithms can be used
to manipulate the geometric point cloud data to retrieve the afore-mentioned information.
Other bridge-related issues including validation of new constructions and comparisons
before- and after critical event, can also be extracted from LiDAR scans.
www.intechopen.com
Laser Scanner Technology 72
Based on the measurement of Doppler effects of a returning continuous laser beam from a
moving target, the scanning laser vibrometer (SLV) is a laser system that can detect the
vibration of a subject. By covering the entire surface of a subject, SLV can not only detect the
vibration frequencies but is able to separate the different vibration mode shapes of the
subject (Oliver, 1995). This makes the SLV a very useful tool in isolating vibration-induced
problems and in some cases, detect system or component level damages.
Because of the non-contact nature and the ability of sensing from a distance away, scanning
lasers have the advantages of limited disruption to traffic, low labor requirements and
providing permanent electronic documentations of the temporal changes of a structure.
Scanning Laser is ideal as a bridge field inspection tool and can help reduce the costs of
inspection and at the same time, enhance the accuracy in field inspections.
However, to implement laser scanning systems into bridge evaluation, one needs to
understand the basics of bridge inspection practices and issues, in particular, recognizes the
fact that some bridge issues are not necessarily associated with condition assessment, but
with serviceability requirements such as adequate bridge underclearance, excessive bridge
movements or traffic-induced vibrations.
Scanning lasers alone will not provide the critical information associated with bridge
inspection, additional evaluation methodologies usually are needed to extract the necessary
information associated with the bridge problems. The examples provided will demonstrate
some additional physical theories that can be used to identify critical bridge information
that affiliate with actual structural conditions.
2. Scanning laser technologies
The scanning laser technologies described herein can be best described as mid-range,
terrestrial (ground-based) laser scanning systems that have found significant bridge health
monitoring applications. The 3D scanning laser or LiDAR is a static laser that is a close
cousin of the airborne LiDAR systems that generates large landscape footprints (Rueger,
1990). The SLV is the 2D dynamic laser systems that measures motions of specific position
points based on Doppler shift measurements (Drain, 1980). Figure 1 shows the basic system
components for both systems which include the ranging unit, the scanning mechanism, the
laser controller and the data recorder.
Most laser scanners use servo-controlled rotating mirrors to reflect the laser beams on the
target surface and usually allow the coverage of two-dimensional or three-dimensional
areas. The servo-controller or galvanometers can be either moving-iron or moving-coil
types and can be multiple-axial systems. The movable mirror system can be either
through the use of a hexagonal mirror or the use of multiple-axis rotating flat mirrors.
Laser beams bounce off the mirror and travel to different positions on the target and
returns to the same mirror system. The returned laser beam help create the position data
from the target surface. Most servo-controlled, rotating mirror has a fixed scanning speed.
Hence, depending on the demand of data points, the duration of scan can vary from few
minutes to several minutes. Figure 2 shows an example of a schematic moving-iron type
galvanometer.
www.intechopen.com

Laser Scanning Technology for Bridge Monitoring 73
Fig. 1. Terrestrial Laser Scanning System Components
Fig. 2. Moving-Iron Galvanometer
www.intechopen.com
Laser Scanner Technology 74
2.1 3D scanning LiDAR
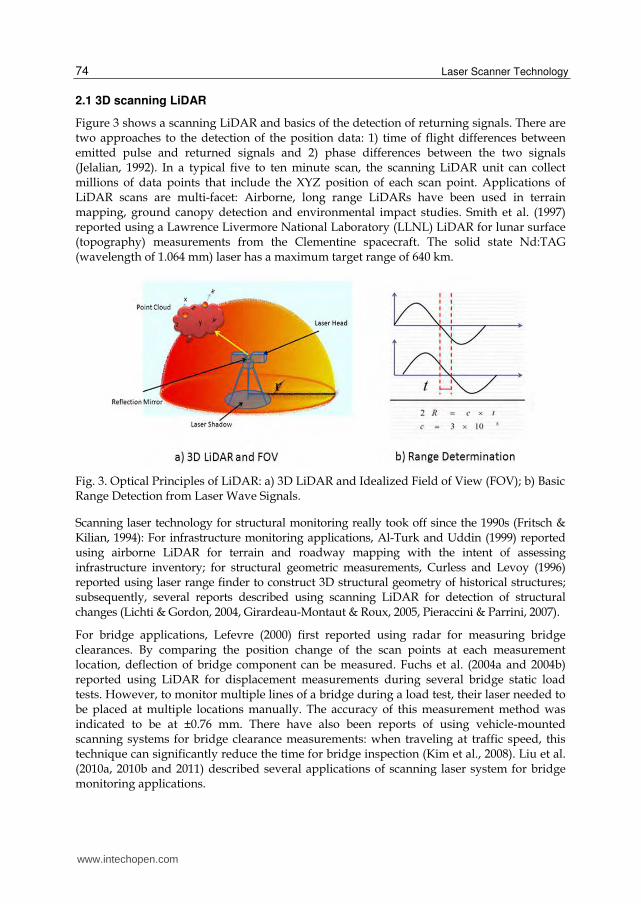
Figure 3 shows a scanning LiDAR and basics of the detection of returning signals. There are two approaches to the detection of the position data: 1) time of flight differences between emitted pulse and returned signals and 2) phase differences between the two signals (Jelalian, 1992). In a typical five to ten minute scan, the scanning LiDAR unit can collect millions of data points that include the XYZ position of each scan point. Applications of LiDAR scans are multi-facet: Airborne, long range LiDARs have been used in terrain mapping, ground canopy detection and environmental impact studies. Smith et al. (1997) reported using a Lawrence Livermore National Laboratory (LLNL) LiDAR for lunar surface (topography) measurements from the Clementine spacecraft. The solid state Nd:TAG (wavelength of 1.064 mm) laser has a maximum target range of 640 km.
Fig. 3. Optical Principles of LiDAR: a) 3D LiDAR and Idealized Field of View (FOV); b) Basic Range Detection from Laser Wave Signals.
Scanning laser technology for structural monitoring really took off since the 1990s (Fritsch & Kilian, 1994): For infrastructure monitoring applications, Al-Turk and Uddin (1999) reported using airborne LiDAR for terrain and roadway mapping with the intent of assessing infrastructure inventory; for structural geometric measurements, Curless and Levoy (1996) reported using laser range finder to construct 3D structural geometry of historical structures; subsequently, several reports described using scanning LiDAR for detection of structural changes (Lichti & Gordon, 2004, Girardeau-Montaut & Roux, 2005, Pieraccini & Parrini, 2007).
For bridge applications, Lefevre (2000) first reported using radar for measuring bridge clearances. By comparing the position change of the scan points at each measurement location, deflection of bridge component can be measured. Fuchs et al. (2004a and 2004b) reported using LiDAR for displacement measurements during several bridge static load tests. However, to monitor multiple lines of a bridge during a load test, their laser needed to be placed at multiple locations manually. The accuracy of this measurement method was indicated to be at ±0.76 mm. There have also been reports of using vehicle-mounted scanning systems for bridge clearance measurements: when traveling at traffic speed, this technique can significantly reduce the time for bridge inspection (Kim et al., 2008). Liu et al. (2010a, 2010b and 2011) described several applications of scanning laser system for bridge monitoring applications.
www.intechopen.com
Laser Scanning Technology for Bridge Monitoring 75
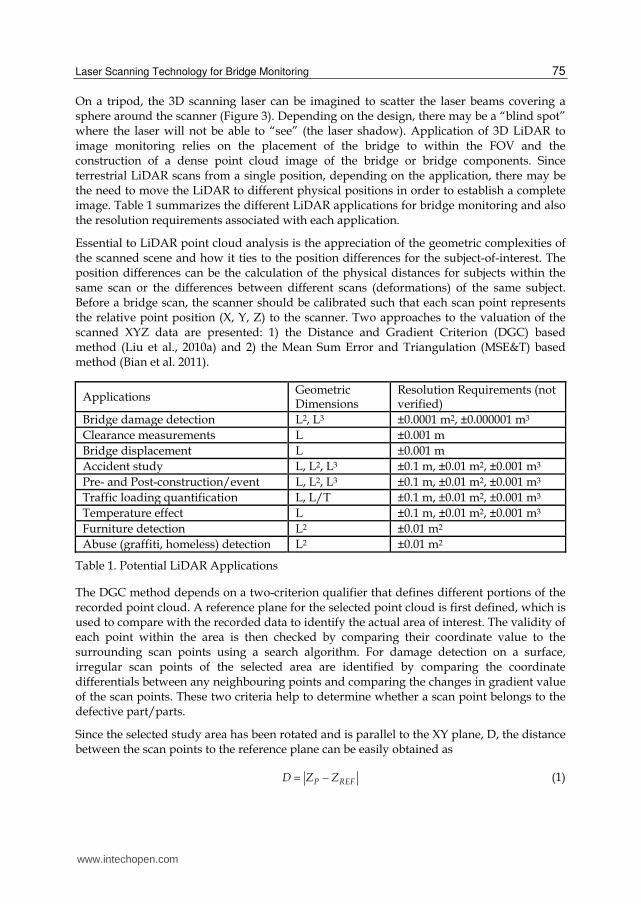
On a tripod, the 3D scanning laser can be imagined to scatter the laser beams covering a sphere around the scanner (Figure 3). Depending on the design, there may be a “blind spot” where the laser will not be able to “see” (the laser shadow). Application of 3D LiDAR to image monitoring relies on the placement of the bridge to within the FOV and the construction of a dense point cloud image of the bridge or bridge components. Since terrestrial LiDAR scans from a single position, depending on the application, there may be the need to move the LiDAR to different physical positions in order to establish a complete image. Table 1 summarizes the different LiDAR applications for bridge monitoring and also the resolution requirements associated with each application.
Essential to LiDAR point cloud analysis is the appreciation of the geometric complexities of the scanned scene and how it ties to the position differences for the subject-of-interest. The position differences can be the calculation of the physical distances for subjects within the same scan or the differences between different scans (deformations) of the same subject. Before a bridge scan, the scanner should be calibrated such that each scan point represents the relative point position (X, Y, Z) to the scanner. Two approaches to the valuation of the scanned XYZ data are presented: 1) the Distance and Gradient Criterion (DGC) based method (Liu et al., 2010a) and 2) the Mean Sum Error and Triangulation (MSE&T) based method (Bian et al. 2011).
Applications Geometric Dimensions
Resolution Requirements (not verified)
Bridge damage detection L2, L3 ±0.0001 m2, ±0.000001 m3
Clearance measurements L ±0.001 m
Bridge displacement L ±0.001 m
Accident study L, L2, L3 ±0.1 m, ±0.01 m2, ±0.001 m3
Pre- and Post-construction/event L, L2, L3 ±0.1 m, ±0.01 m2, ±0.001 m3
Traffic loading quantification L, L/T ±0.1 m, ±0.01 m2, ±0.001 m3
Temperature effect L ±0.1 m, ±0.01 m2, ±0.001 m3
Furniture detection L2 ±0.01 m2
Abuse (graffiti, homeless) detection L2 ±0.01 m2
Table 1. Potential LiDAR Applications
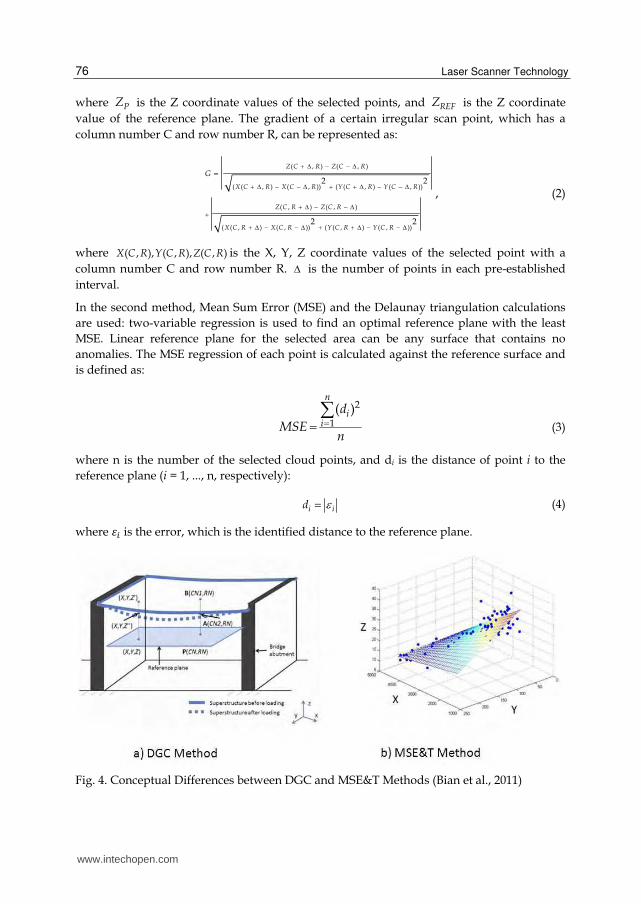
The DGC method depends on a two-criterion qualifier that defines different portions of the recorded point cloud. A reference plane for the selected point cloud is first defined, which is used to compare with the recorded data to identify the actual area of interest. The validity of each point within the area is then checked by comparing their coordinate value to the surrounding scan points using a search algorithm. For damage detection on a surface, irregular scan points of the selected area are identified by comparing the coordinate differentials between any neighbouring points and comparing the changes in gradient value of the scan points. These two criteria help to determine whether a scan point belongs to the defective part/parts.
Since the selected study area has been rotated and is parallel to the XY plane, D, the distance between the scan points to the reference plane can be easily obtained as
P REFD Z Z (1)
www.intechopen.com
Laser Scanner Technology 76
where PZ is the Z coordinate values of the selected points, and REFZ is the Z coordinate
value of the reference plane. The gradient of a certain irregular scan point, which has a
column number C and row number R, can be represented as:
( , ) ( , )
( ( , ) ( , )) ( ( , ) ( , ))
( , ) ( , )
( ( , ) ( , )) ( ( , ) ( , ))
2 2
2 2
Z C R Z C R
X C R X C R Y C R Y C R
Z C R Z C R
X C R X C R Y C R Y C R
G
, (2)
where ( , ), ( , ), ( , )X C R Y C R Z C R is the X, Y, Z coordinate values of the selected point with a
column number C and row number R. is the number of points in each pre-established
interval.
In the second method, Mean Sum Error (MSE) and the Delaunay triangulation calculations
are used: two-variable regression is used to find an optimal reference plane with the least
MSE. Linear reference plane for the selected area can be any surface that contains no
anomalies. The MSE regression of each point is calculated against the reference surface and
is defined as:
2
1
( )n
ii
d
MSEn
(3)
where n is the number of the selected cloud points, and di is the distance of point i to the
reference plane (i = 1, ..., n, respectively):
i id (4)
where 綱沈 is the error, which is the identified distance to the reference plane.
Fig. 4. Conceptual Differences between DGC and MSE&T Methods (Bian et al., 2011)
www.intechopen.com
Laser Scanning Technology for Bridge Monitoring 77
MSE&T method uses the distance from scan points to the reference plane as the criterion to identify the defective parts. Therefore, a pre-determined tolerance value needs to be manually assigned before detecting the defective areas. After that, the Delaunay’s triangulation algorithm is used to aggregate the projected points on X-Y plane and the z value is then assigned back to the projected point set, thus forming a 3D surface. Figure 4 shows the conceptual differences between the two methods: a) DGC and b) MSE&T.
Boehler and Marbs (2002) investigated the accuracies of 3D scanning technologies and identified several factors that can influence the scanner accuracies including temperature, atmospheric (lighting) and interfering radiations. The scanning angles between the laser and the target can result in significant scattering of the laser energy and reduce angular accuracy of the laser.
2.2 Scanning laser vibrometry
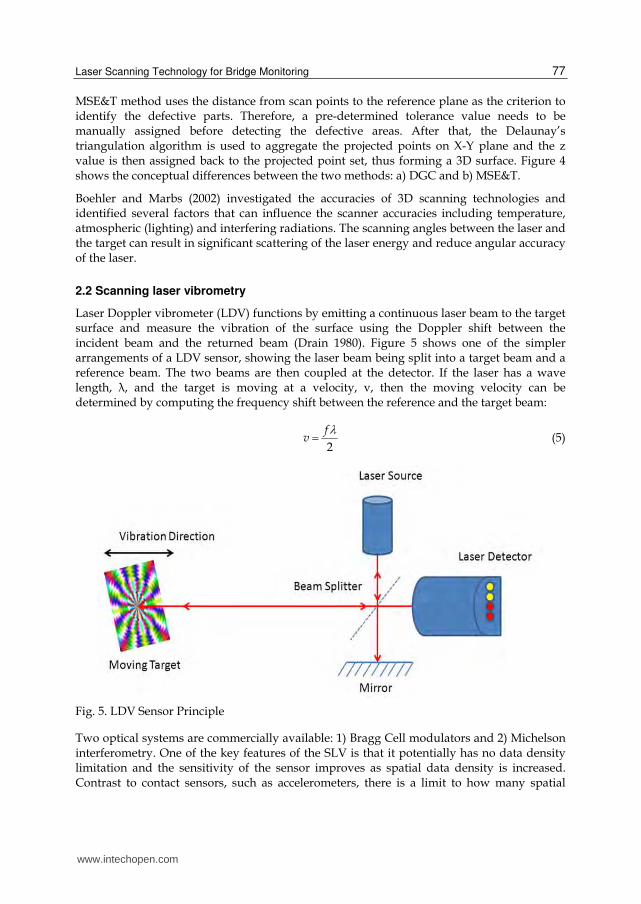
Laser Doppler vibrometer (LDV) functions by emitting a continuous laser beam to the target surface and measure the vibration of the surface using the Doppler shift between the incident beam and the returned beam (Drain 1980). Figure 5 shows one of the simpler arrangements of a LDV sensor, showing the laser beam being split into a target beam and a reference beam. The two beams are then coupled at the detector. If the laser has a wave length, λ, and the target is moving at a velocity, v, then the moving velocity can be determined by computing the frequency shift between the reference and the target beam:
2
fv
(5)
Fig. 5. LDV Sensor Principle
Two optical systems are commercially available: 1) Bragg Cell modulators and 2) Michelson interferometry. One of the key features of the SLV is that it potentially has no data density limitation and the sensitivity of the sensor improves as spatial data density is increased. Contrast to contact sensors, such as accelerometers, there is a limit to how many spatial
www.intechopen.com
Laser Scanner Technology 78
points can be practically measured. SLV has been used extensively in the automobile industry for studying dynamic behaviors of cars (Junge, 1994). Other advantages of using a SLV for inspection include:
no added mass on the structure, full-field measurement capability, speed test setup,
accurate measurements, central remote operation (Oliver, 1995)
3. Examples of LiDAR applications for bridge monitoring
3.1 3D LiDAR for bridge damage evaluation
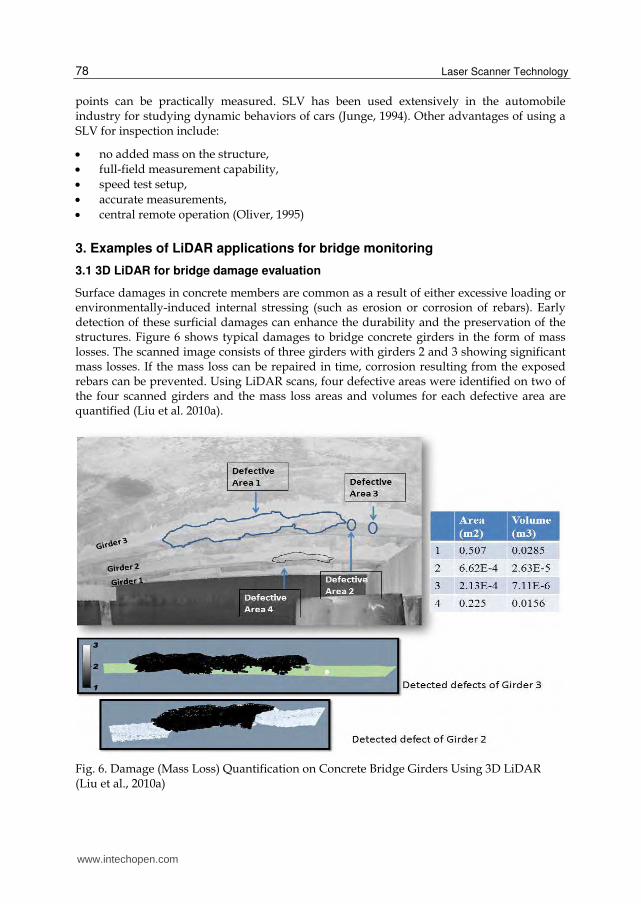
Surface damages in concrete members are common as a result of either excessive loading or environmentally-induced internal stressing (such as erosion or corrosion of rebars). Early detection of these surficial damages can enhance the durability and the preservation of the structures. Figure 6 shows typical damages to bridge concrete girders in the form of mass losses. The scanned image consists of three girders with girders 2 and 3 showing significant mass losses. If the mass loss can be repaired in time, corrosion resulting from the exposed rebars can be prevented. Using LiDAR scans, four defective areas were identified on two of the four scanned girders and the mass loss areas and volumes for each defective area are quantified (Liu et al. 2010a).
Fig. 6. Damage (Mass Loss) Quantification on Concrete Bridge Girders Using 3D LiDAR (Liu et al., 2010a)
www.intechopen.com

Laser Scanning Technology for Bridge Monitoring 79
Such damages can also occur when a bridge does not have the required clearances and
resulted in vehicle collisions to the bridge superstructures. Hence, the underclearance
measurements for a bridge are very important.
3.2 3D LiDAR for bridge underclearance measurements
Conventional clearance measurements are performed using surveying equipment and
usually several measurement points are needed to determine the lowest point underneath a
bridge, which is a time consuming process. LiDAR systems can provide bridge vertical
clearance information for the entire bridge with accuracies in the order of millimeters. The
display of clearance change over the entire bridge coverage area can be useful to assess
damages and help engineers to devise bridge improvement planning. Using truck-mount
LiDAR system, it is even possible to determine bridge clearance on the fly without stopping
ongoing traffics (Kim et al., 2008).
Fig. 7. Laser Scan of Harris Boulevard Bridge: a) Harris Boulevard Bridge; b) Laser Scan Showing Both Spans; c) Temperature Deviation during Winter Scan; d) Temperature Deviation During Spring Scan; e) Winter Scan Traffic; and f) Spring Scan Traffic. (Watson et al., 2011)
www.intechopen.com
Laser Scanner Technology 80
However, it is necessary to establish the effects of traffic loading over the bridge to ensure
no large displacements occur due to vehicle crossing. A temperature and traffic effects study
is conducted on the Harris Boulevard Bridge, Charlotte, NC (Watson et al. 2011). Multiple
scans were conducted during a day in the winter of 2009 and a day in the late spring of 2010.
Figure 7 shows a) the bridge, b) example laser scan, c) winter temperature deviation, d)
spring temperature deviation, e) winter traffic and f) spring traffic. Statistical analysis and a
hypothesis testing were conducted on the test results to determine if the measurement
deviations can be tied to either temperature effects or the passing traffics on the bridge. The
statistical analysis and hypothesis testing indicated that LiDAR scans were not influenced
by the weather or traffic effects.
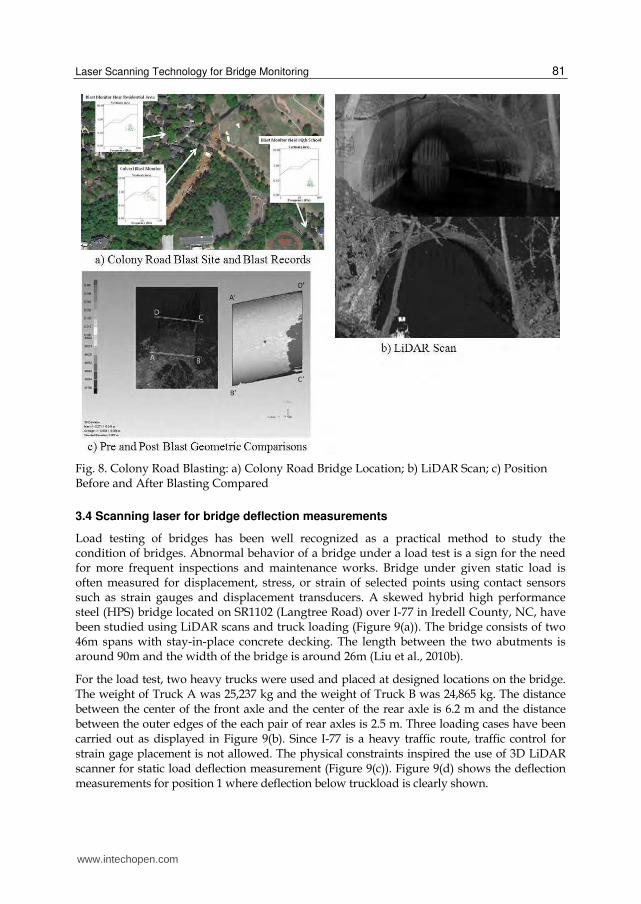
3.3 3D LiDAR for post blast assessment
The Colony Road Bridge is a concrete culvert with a two-lane road above. The abutments of
the culvert are backfilled with earth, which is retained by large trees, shrubs, and large
granite gravel to protect the embankments and foundation culvert from erosion. At both
openings of the culvert are wing walls that angled out from the culvert. The culvert crosses
the Briars Creek which is about ten meters wide. Figure 8 outlines the basic geometry of the
culvert, which has a width of 10.4 m and a height of 5.7 m.
For the Colony Road Bridge, there were several concerns with respect to a construction
blasting project: A layer of rock had to be removed in order to lay a new sanitary pipe, but
the construction area is nearby to the reinforced concrete culvert, a school, and family
homes. The structure of most concern was the concrete culvert as the blasting would occur
only 11 meters away from the structure, which is less than the allowable distance of a
blasting from the City Ordinance (Charlotte City Council, 2011).
The blast plan called for 3.67 kg of high explosives including: 2x16 dynamite and 2 1/2x16
unimax blasting agent. The drill pattern was 1.54 x 1.83 with 20 to 30 holes drilled. The
diameters of bore holes were approximately 0.089 m with a depth of 0.762. The blasting
was done to remove a 3.96 layer of rock below 5.18 of earth so that a new 1.52 diameter
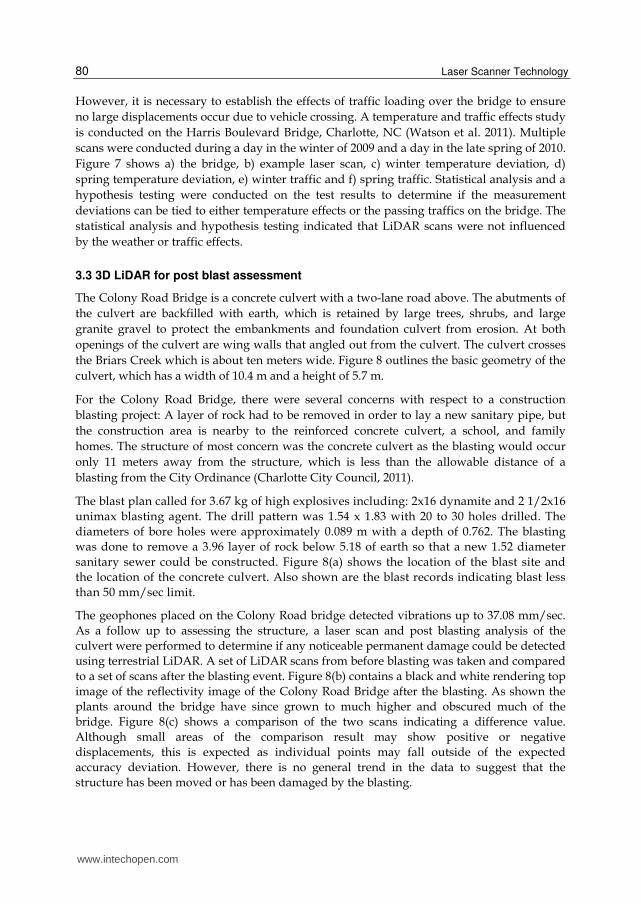
sanitary sewer could be constructed. Figure 8(a) shows the location of the blast site and
the location of the concrete culvert. Also shown are the blast records indicating blast less
than 50 mm/sec limit.
The geophones placed on the Colony Road bridge detected vibrations up to 37.08 mm/sec.
As a follow up to assessing the structure, a laser scan and post blasting analysis of the
culvert were performed to determine if any noticeable permanent damage could be detected
using terrestrial LiDAR. A set of LiDAR scans from before blasting was taken and compared
to a set of scans after the blasting event. Figure 8(b) contains a black and white rendering top
image of the reflectivity image of the Colony Road Bridge after the blasting. As shown the
plants around the bridge have since grown to much higher and obscured much of the
bridge. Figure 8(c) shows a comparison of the two scans indicating a difference value.
Although small areas of the comparison result may show positive or negative
displacements, this is expected as individual points may fall outside of the expected
accuracy deviation. However, there is no general trend in the data to suggest that the
structure has been moved or has been damaged by the blasting.
www.intechopen.com
Laser Scanning Technology for Bridge Monitoring 81
Fig. 8. Colony Road Blasting: a) Colony Road Bridge Location; b) LiDAR Scan; c) Position Before and After Blasting Compared
3.4 Scanning laser for bridge deflection measurements
Load testing of bridges has been well recognized as a practical method to study the condition of bridges. Abnormal behavior of a bridge under a load test is a sign for the need for more frequent inspections and maintenance works. Bridge under given static load is often measured for displacement, stress, or strain of selected points using contact sensors such as strain gauges and displacement transducers. A skewed hybrid high performance steel (HPS) bridge located on SR1102 (Langtree Road) over I-77 in Iredell County, NC, have been studied using LiDAR scans and truck loading (Figure 9(a)). The bridge consists of two 46m spans with stay-in-place concrete decking. The length between the two abutments is around 90m and the width of the bridge is around 26m (Liu et al., 2010b).
For the load test, two heavy trucks were used and placed at designed locations on the bridge. The weight of Truck A was 25,237 kg and the weight of Truck B was 24,865 kg. The distance between the center of the front axle and the center of the rear axle is 6.2 m and the distance between the outer edges of the each pair of rear axles is 2.5 m. Three loading cases have been carried out as displayed in Figure 9(b). Since I-77 is a heavy traffic route, traffic control for strain gage placement is not allowed. The physical constraints inspired the use of 3D LiDAR scanner for static load deflection measurement (Figure 9(c)). Figure 9(d) shows the deflection measurements for position 1 where deflection below truckload is clearly shown.
www.intechopen.com

Laser Scanner Technology 82
Fig. 9. Langtree Road Bridge over I-77 Highway: a) Bridge under Load Test; b) Load Truck
Positions; c) LiDAR Scan with Clearance Measurements; d) Deflection Values under Each
Girder (Liu et al. 2011b)
4. Examples of SLV applications for bridge monitoring
To determine vibration-related problems or inverse engineer the vibration measurements to
determine damage within a bridge, the natural modal behaviors of the bridge must first be
studied. Typically, contact transducers such as accelerometers or geophones are used in the
vibration study of bridges. However, because of the sizes of a bridge, large grids of sensor
placements typically resulted in long cables in place and result in extensive time and efforts
for test preparation. SLV would have solved such problems. The following describes the
modal testing on a military bridge.
4.1 SLV for full-scale bridge vibration mode identification
The Armored Vehicle Launched Bridges (AVLBs) are mobile military bridges used for tank
crossing during military operations. Designed for Military Load Capacity (MLC) of 60 to 70
tons, these bridges are unique due to their structural complexity and to being light-weight.
Constructed of high-strength aluminum alloy and steel, AVLBs are scissor-type structures
usually built with two treadways supported on four hinged girders with tapered
www.intechopen.com

Laser Scanning Technology for Bridge Monitoring 83
approaches. The bridge is typically mounted on a launcher and has a hydraulic mechanism
to open the bridge. The average AVLB weight is approximately 13 tons with a span of 18.3
m. Figure 10 shows a typical AVLB bridge (10a) and the close up of the center hinge for
mechanical opening (Chen et al., 2002).
Fig. 10. AVLB: a) Entire Bridge View and b) Close Up of Center Hinge [34] (Chen et al. 2002)
AVLBs are designed to resist cycles of launching impact and heavy tank loads, hence
dynamic impact dominates the design limit states. As a result, the most common damages
found on the AVLBs are cracking from high-stress, low-fatigue cycle loads (Cho, 1994). An
understanding of the dynamic behaviors of the AVLB is therefore critical to the design and
analysis of the bridge.
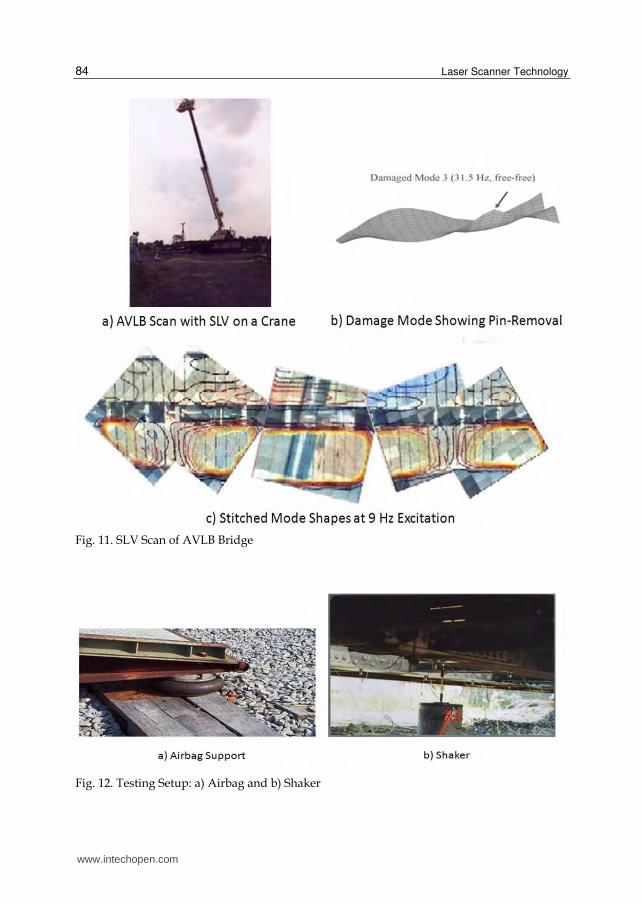
To simulate free-free conditions, the AVLB was suspended by four airbags underneath the
four girders. Figure 11 shows the experimental setup which includes: a) an airbag
underneath each of the girders and b) mechanical shakers. The airbags were used to
separate the rigid body modes from the flexible modes and to minimize the effect of the
supports on the bridge dynamic characteristics. Since the structure is hinged, to ensure
uniform excitation, two shakers were placed symmetrically underneath each inner girder.
The shakers were synchronized to provide the same amount of stroke at the same time.
The vibration data were measured using an Ometron VP4000 SLV which uses a “lock-in”
approach for single frequency scans. To scan the AVLB, a crane was used to lift the laser to
18 m above the bridge (Figure 12). However, even at such height, it is difficult to collect the
complete modal information. Figure 12(c) shows the stitched mode shape of the AVLB at 9
Hz excitation. To scan the entire AVLB with an allowable scan angle of 20 degrees would
mean that the laser has to be at 64 m height.
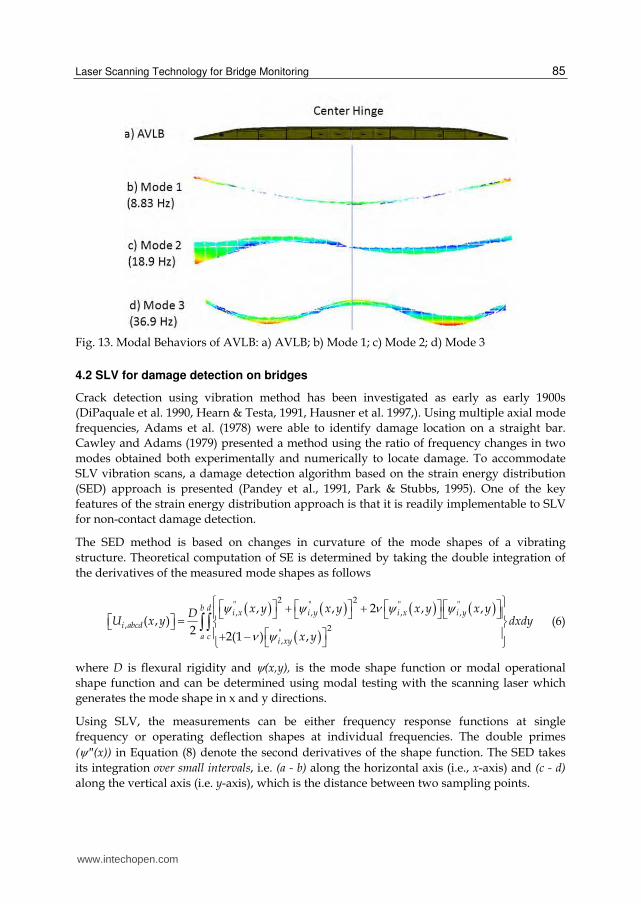
Since the four girders act as loosely connected members, several torsion and out-of-phase
bending modes have been observed. Figure 13 shows the first three bending modes of the
AVLB (Nessler & Lovelace, 1997). The results indicated that the AVLB behaves like a loosely
coupled structure where the two treadways act independently.
www.intechopen.com
Laser Scanner Technology 84
Fig. 11. SLV Scan of AVLB Bridge
Fig. 12. Testing Setup: a) Airbag and b) Shaker
www.intechopen.com
Laser Scanning Technology for Bridge Monitoring 85
Fig. 13. Modal Behaviors of AVLB: a) AVLB; b) Mode 1; c) Mode 2; d) Mode 3
4.2 SLV for damage detection on bridges
Crack detection using vibration method has been investigated as early as early 1900s
(DiPaquale et al. 1990, Hearn & Testa, 1991, Hausner et al. 1997,). Using multiple axial mode
frequencies, Adams et al. (1978) were able to identify damage location on a straight bar.
Cawley and Adams (1979) presented a method using the ratio of frequency changes in two
modes obtained both experimentally and numerically to locate damage. To accommodate
SLV vibration scans, a damage detection algorithm based on the strain energy distribution
(SED) approach is presented (Pandey et al., 1991, Park & Stubbs, 1995). One of the key
features of the strain energy distribution approach is that it is readily implementable to SLV
for non-contact damage detection.
The SED method is based on changes in curvature of the mode shapes of a vibrating
structure. Theoretical computation of SE is determined by taking the double integration of
the derivatives of the measured mode shapes as follows
2 2" " " "
, , , ,
, 2",
, , 2 , ,( , )
22(1 ) ,
b di x i y i x i y
i abcd
a ci xy
x y x y x y x yDU x y dxdy
x y
(6)
where D is flexural rigidity and (x,y), is the mode shape function or modal operational
shape function and can be determined using modal testing with the scanning laser which
generates the mode shape in x and y directions.
Using SLV, the measurements can be either frequency response functions at single
frequency or operating deflection shapes at individual frequencies. The double primes
(″(x)) in Equation (8) denote the second derivatives of the shape function. The SED takes
its integration over small intervals, i.e. (a - b) along the horizontal axis (i.e., x-axis) and (c - d)
along the vertical axis (i.e. y-axis), which is the distance between two sampling points.
www.intechopen.com
Laser Scanner Technology 86
For damaged cases, it is assumed that the flexural rigidity does not change and the damaged strain energy can be expressed as
2 2" " " "
, , , ,
, 2",
, , 2 , ,( , )
22(1 ) ,
d d d d
d
d
b di x i y i x i y
i abcd
a ci xy
x y x y x y x yDU x y dxdy
x y
(7)
where the lower level subscript, d, denotes the strain energy of the damaged structure.
Local stiffness reduction as a result of cracking or damage would then be reflected in a local increase of SE. This local SE increase is present in different deflected shapes. The SED is computed on a mode-by-mode and element-by-element basis. It has been shown that any local stiffness reduction would lead to a concentration of the local curvature near the damaged cross section, hence producing higher SE. As a result, a comparison of the SEDs for damaged and intact structures can reveal locations of defects. Realistically, SE computations should take into consideration the reduction of cross sections. However, since crack locations are generally unknown beforehand, it is assumed that the effect is much smaller than the element sizes considered and is hence ignored. To detect damage, the numerical difference between damaged and undamaged SED values is used (Chen et al., 2000)
, , ,( , ) ( , ) ( , )di abcd i abcd i abcdU x y U x y U x y
(8)
Since SED is a function of curvature, its sensitivity improves with increased spatial data densities. Again, using SLV, the problem is easily addressed. Figure 12c shows damage detection on the AVLB by removing one of the hinges at the quarter point on the bridge.
4.3 SLV for cable tension measurements
To ensure the safety and integrity of tied arch bridges, it is crucial that tension levels in cables be monitored and do not exceed their design levels. One possible approach would be to correlate the vibration frequencies with the tensions in these cables. However, due to their long length, access to these cables for mounting contact sensors is not easy. Again using SLV, this problem can be solved.
Traditionally, cable vibration measurements of natural frequencies are used to predict cable tension using the taut string model, where the natural frequencies, ωn, for the out-of-plane motion of a suspended cable are given as (Leonard, 1988):
2n
Tn
mL (9)
where n = nth mode of vibration, m = distributed mass per unit length, T = cable tension, and L = total or effective length of the cable. If the vibration frequencies can be clearly identified, then tension level can be back-calculated with exact measurements of the three unknowns, ωn, m and L:
22nT mL
n
(10)
www.intechopen.com
Laser Scanning Technology for Bridge Monitoring 87
The distributed mass, m, usually does not alter significantly, unless the metal has been heavily corroded. L is a function of the boundary condition, which typically was assumed to be pinned-pinned.
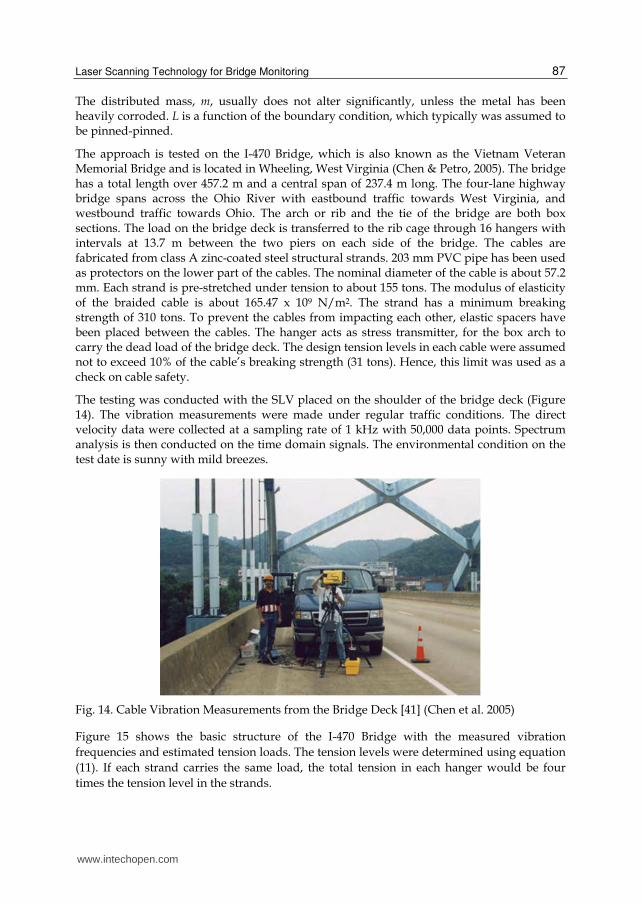
The approach is tested on the I-470 Bridge, which is also known as the Vietnam Veteran Memorial Bridge and is located in Wheeling, West Virginia (Chen & Petro, 2005). The bridge has a total length over 457.2 m and a central span of 237.4 m long. The four-lane highway bridge spans across the Ohio River with eastbound traffic towards West Virginia, and westbound traffic towards Ohio. The arch or rib and the tie of the bridge are both box sections. The load on the bridge deck is transferred to the rib cage through 16 hangers with intervals at 13.7 m between the two piers on each side of the bridge. The cables are fabricated from class A zinc-coated steel structural strands. 203 mm PVC pipe has been used as protectors on the lower part of the cables. The nominal diameter of the cable is about 57.2 mm. Each strand is pre-stretched under tension to about 155 tons. The modulus of elasticity of the braided cable is about 165.47 x 10⁹ N/m2. The strand has a minimum breaking strength of 310 tons. To prevent the cables from impacting each other, elastic spacers have been placed between the cables. The hanger acts as stress transmitter, for the box arch to carry the dead load of the bridge deck. The design tension levels in each cable were assumed not to exceed 10% of the cable’s breaking strength (31 tons). Hence, this limit was used as a check on cable safety.
The testing was conducted with the SLV placed on the shoulder of the bridge deck (Figure 14). The vibration measurements were made under regular traffic conditions. The direct velocity data were collected at a sampling rate of 1 kHz with 50,000 data points. Spectrum analysis is then conducted on the time domain signals. The environmental condition on the test date is sunny with mild breezes.
Fig. 14. Cable Vibration Measurements from the Bridge Deck [41] (Chen et al. 2005)
Figure 15 shows the basic structure of the I-470 Bridge with the measured vibration
frequencies and estimated tension loads. The tension levels were determined using equation
(11). If each strand carries the same load, the total tension in each hanger would be four
times the tension level in the strands.
www.intechopen.com

Laser Scanner Technology 88
Fig. 15. Cable Load Capacity and Measured Vibration Frequencies (Chen et al. 2005)
5. Discussion
This chapter discusses several potential applications of scanning lasers for bridge monitoring. Other potential applications that are currently gaining popularity include high density, multi-dimensional geospatial model construction using LiDAR and photo imaging techniques for applications such as accident reporting and management, furniture (sign and luminaires) management, disaster mitigation and management, etc. Applying scanning laser technologies to bridge monitoring signifies a critical shift in bridge management paradigm – it naturally integrates conventional visual inspection and paper reporting with digital computing via geoscience technologies such as Geological Information Systems (GIS) and advanced image analysis.
However, before the industry catch on with the technology, there is a need to carefully evaluate the potential impacts to the industry, in particular, in the form of life cycle cost analysis. Because of the capability in providing high resolution spatial information from a distance away, commercializing scanning laser technologies poses different issues than those faced by other structural monitoring science and technologies including issues of privacy and security, issues about redundancy in image information and legality and technology relevancy issues related to commercialization. With this in mind, the technical barriers would be the issue of retrieving useful and legitimate CRS data from multi-variant imaging and data sources that can be best used in enhancing bridge infrastructure management. The potential of generating massive data in the order of petabytes also challenges the computing sciences and pushing the technology envelope towards unprecedented scale.
These are not easy issues to address, which have to be answered by all bridge managers,
government and stakeholders. However, the societal benefits are tremendous: for example,
there is the potential of conducting temporal effect studies. By temporal, we mean more
www.intechopen.com

Laser Scanning Technology for Bridge Monitoring 89
frequent inspections/visits than current federally mandated two-year cycles, which would
allow reliable imaging of the transformation of damage through time. With the digital, high
resolution imaging techniques, it may also be possible to identify critical problems prior to
disastrous failure, such as what happened to the Minnesota I-35 Bridge. It is also possible to
report real time tracking of excessive truck loading and environmental loadings.
Finally, bridge management decisions are complex processes that must consider bridge
conditions as well as bridge utility, available funding and impact of rehabilitation
techniques. Bridge managers need a tool to enable “total management” decision-making.
This consideration is critical to the development of RS technologies for structural health
monitoring, since it helps us understand how remote sensing data is associated with the
bridge utilities. However, such considerations also represent a need to revisit the definitions
and operations of existing bridge management systems.
6. Conclusion
This chapter introduces two types of scanning laser technologies: 1) static range finding
laser and 2) dynamic measurement laser. Several bridge monitoring applications of
scanning laser technologies have been described including damage detection,
underclearance measurements, load deflection measurements, post-event validations,
damage detection, modal behavior identification and cable tension measurements. These
examples of scanning laser application provide realistic scenarios for industry-wide
implementation of scanning laser techniques for bridge monitoring and both technologies
are ready to be commercialized. However, it is also pointed out that such applications can
significantly influence conventional bridge inspection and management by forcing the
integration of geoscience technologies and advanced image capture and processing
techniques. However, much work needs to be done to ascertain critical issues such as data
security, privacy and the management of massively generated data are first addressed.
7. References
Adams, R.D., Cawley, P., Pye, C.J. & Stone, B.J. (1978). A Vibration Technique for
Nondestructively Assessing the Integrity of Structures. Journal Mechanical
Engineering Science, Vol. 20, No. 2, pp.93-100.
Aktan, A.E., Farhey, D.N., Helmicki, A.J., Brown, D.L., Hunt, V.J., Lee, K.L. & Levi, A.
(1997). Structural Identification for Condition Assessment: Experimental Arts.
ASCE Journal of Structural Engineering, Vol. 123, No. 12, pp.1674-1685.
Al-Turk, E. & Uddin, W. (1999). Infrastructure Inventory and Condition Assessment Using
Airborne Laser Terrain Mapping and Digital Photography, Transportation Research
Records, TRB, Vol. 1690, pp. 121-125.
Bian, H., Bai, L., Wang, X., Liu, W., Chen, S.E. & Wang, S. (2011). Effective LiDAR Damage
Detection: Comparing Two Detection Algorithms, Structural Engineers. Vo. 27, No.
137, pp.327-333.
www.intechopen.com
Laser Scanner Technology 90
Boehler, W. and Marbs, A. (2002). 3D Scanning Instruments, Proceedings of CIPA, Heritage
Documentation – International Workshop on Scanning for Cultural Heritage Recording,
Corfu, Greece.
Cawley, P. and Adams, R.D. (1979). The Location of Defects in Structures from
Measurements of Natural Frequencies, Journal of Strain Analysis, Vol. 14, No. 2,
pp.49-57.
Charlotte City Council (2011). City of Charlotte Zoning Ordinance, City of Charlotte.
Chen, S.E. & Petro, P. (2005). Nondestructive Bridge Cable Tension Assessment Using Laser
Vibrometry, Experimental Techniques, Vol. 29, No. 2, pp. 29-32.
Chen, S.E., Rice, C., Boyle, C. & Hauser, E. (2011). Small Format Aerial Photography for
Highway Bridge Monitoring, ASCE Journal of Performance of Constructed Facilities,
Vol. 25, No. 2, pp. 105-112.
Chen, S.E., Petro, S., Venkatappa, S., GangaRao, H. and Moody, J. (2002). Modal Testing of
an AVLB Bridge, Experimental Techniques, Vol. 26, No. 6, pp.43-46.
Chen, S.E., Venkatappa, S., Petro, S.H. & GangaRao, H. (2000). A Novel Damage Detection
Technique Using Scanning Laser Vibrometry and A Strain Energy Distribution
Method, Materials Evaluation, Vol. 58, No. 12, pp.1389-1394.
Cho, N. (1994). Preproduction Qualification Test (PPQT) of the Armored vehicle Launch Bridge
(AVLB) – MLC 70 Upgrade Program, U.S. Army Tank-Automotive Command Final
Report # CSTA-7567.
Choi, S. & Stubbs, N. (1997). Nondestructive Damage Detection Algorithm for 2-D Plates,
Smart Systems for Bridges, Structures, and Highways, Proceeding of SPIE, Vol. 3043,
pp.193-204.
Curless, B. & Levoy, M. (1996). A Volumetric Method for Building Complex Models from
Range Images, Proceedings of SIGGRAPH, pp.303-312.
DiPasquale, E., Ju, J.W., Atilla, A. & Cakmak, A.S.(1990). Relation Between Global Damage
Indices and Local Stiffness Degradation. ASCE Journal of Structural Engineering, Vol.
116, No. 5, pp.1440-1456.
Drain, L.E., The Laser Doppler Technique, Wiley-Interscience, Sussex, England, 1980.
Fritsch, D. & Kilian, J.C. (1994). Filtering and Calibration of Laser-Scanner Measurements,
Proceedings of ISPRS Commission III Symposium, SPIE, Vol. 2357, pp. 227-234.
Fuchs, P.A., Washer, G.A., Chase, S.B. & Moore, M. (2004a). Application of laser-based
instrumentation for highway bridges. ASCE Journal of Bridge Engineering, Vol. 9, No.
6., pp.541-549.
Fuchs, P.A., Washer, G.A., Chase, S.B. & Moore, M. (2004b) Laser-based instrumentation for
bridge load testing, ASCE Journal of Performance of Constructed Facilities. Vol. 18, No.
4, pp.213-219.
Girardeau-Montaut, D. & Roux, M. (2005). Change detection on points cloud data acquired
with a ground laser scanner. Proceedings of Workshop Laser scanning 2005, Enschede,
the Netherlands.
Hausner, G.W., Bergman, L.A., Caughey, T.K., Chassiakos, A.G., Claus, R.O., Masri, S.F.,
Skelton, R.E., Soong, T.T., Spencer, B.F. & Yao, J.T.P. (1997). Structural Control:
Past, present, and Future, ASCE Journal of Engineering Mechanics, Vol. 123, No. 9,
pp.897-958.
www.intechopen.com
Laser Scanning Technology for Bridge Monitoring 91
Hearn, G. & Testa, R.B. (1991). Modal Analysis for Damage Detection in Structures. ASCE
Journal of Structural Engineering, Vol. 117, No. 10, pp.3042-3063.
Jelalian, A.V. Laser Radar Systems. Artech House, Boston, London, 1992.
Junge, B. (1994). Experiences with Scanning Laser Vibrometry in Automotive Industries,
Proceedings of SPIE, Vol. 2358, pp.377-382.
Kim, Y.R., Hummer, J.E., Gabr, M., Johnston, D., Underwood, B.S., Findley, D.J. &
Cunningham, C.M. (2008). Asset Management Inventory and Data Collection, Final
Report, FHWA/NC/2008-15.
Lefevre, R. J. (2000). Radar bridge clearance sensor. Proceedings of IEEE 2000 International
Radar Conference, Alexandria, VA, pp. 660-665.
Leonard, J.W. (1988), Tension structures – behavior and analysis, McGraw-Hill, New York, NY.
Lichti, D.D. & Gordon, S.J. (2004). Error propagation in directly georeferenced terrestrial
laser scanner point clouds for cultural heritage recording, Proceedings of WSA2
Modeling and Visualization, Athens, Greece.
Liu, M., Frangopol, D.M. & Kim, S. (2009). Bridge Safety Evaluation Based on Monitored
Live Load Effects, ASCE Journal of Bridge Engineering, Vol. 14, No. 4, pp. 257-269.
Liu, W.Q., Chen, S.E. & Hauser, E. (2010a). LiDAR-Based Bridge Structure Defect Detection,
Experimental Techniques, DOI: 10.1111/j.1747-1567.2010.00644.x.
Liu, W.Q., Chen, S.E. & Hauser, E. (2011). Bridge Clearance Evaluation Based on Terrestrial
LiDAR Scan, ASCE Journal of Performance of Constructed Facilities,
doi:10.1061/(ASCE)CF.1943-5509.0000208.
Liu, W.Q., Chen, S.E., Boyajian, D. &Hauser, E. (2010b) Application of 3D LiDAR Scan of
Bridge Under Static Load Testing, Materials Evaluation, Vol. 68, No.12, pp.1359-
1367.
Nessler, G. & Lovelace, D. (1997). Final Report on Acquisition of Frequency Response Data on an
Armored Vehicle Launched Bridge (AVLB).
Oliver, D.E. (1995). Scanning Laser Vibrometer for Dynamic Deflection Shape
Characterization of Aerospace Structures, Proceedings, SPIE, Vol. 2472, pp.12-22.
Pandey, A.K., Biswas, M. & Samman, M.M. (1991). Damage Detection from Changes in
Curvature Mode Shapes, Journal of Sound and Vibration, Vol. 145, No. 2, pp.321-332.
Park, S. & Stubbs, N. (1995). Bridge Diagnostics via Vibration Monitoring, Proceedings of
SPIE, Vol. 2719, pp. 36-45.
Pieraccini, M. & Parrini, F. et al., (2007). Static and dynamic testing of bridges through
microwave interferometry. NDT&E International, Vol. 40, pp. 208-214.
Rueger, J.M., Electronic Distance Measurements: An Introduction, Springer-Verlag, New York,
1990.
Shinozuka, M. & Rejajaie, S.A. (2000). Analysis of Remotely Sensed Pre- and Post-Disaster
Images for Damage Detection, Smart Structures and Materials, Proceedings of SPIE,
Vol. 3988, pp. 307-318.
Smith, D.E., Zuber, M.T., Neumann, G.A. & Lernoine, F.G. (1997). Topography of the Moon
from the Clementine LiDAR, Journal of Geophysical Research,Vol.102, No. E1, pp.
1591-1611.
www.intechopen.com

Laser Scanner Technology 92
Watson, C., Chen, S.E., Bian, H. & Hauser, E. (2011). 3D Terrestrial LiDAR for Operational
Bridge Clearance Measurements, ASCE Journal of Performance of Constructed
Facilities, doi:10.1061/(ASCE)CF.1943-5509.0000277.
www.intechopen.com

Laser Scanner TechnologyEdited by Dr. J. Apolinar Munoz Rodriguez
ISBN 978-953-51-0280-9Hard cover, 258 pagesPublisher InTechPublished online 28, March, 2012Published in print edition March, 2012
InTech EuropeUniversity Campus STeP Ri Slavka Krautzeka 83/A 51000 Rijeka, Croatia Phone: +385 (51) 770 447 Fax: +385 (51) 686 166www.intechopen.com
InTech ChinaUnit 405, Office Block, Hotel Equatorial Shanghai No.65, Yan An Road (West), Shanghai, 200040, China
Phone: +86-21-62489820 Fax: +86-21-62489821
Laser scanning technology plays an important role in the science and engineering arena. The aim of thescanning is usually to create a digital version of the object surface. Multiple scanning is sometimes performedvia multiple cameras to obtain all slides of the scene under study. Usually, optical tests are used to elucidatethe power of laser scanning technology in the modern industry and in the research laboratories. This bookdescribes the recent contributions reported by laser scanning technology in different areas around the world.The main topics of laser scanning described in this volume include full body scanning, traffic management, 3Dsurvey process, bridge monitoring, tracking of scanning, human sensing, three-dimensional modelling, glaciermonitoring and digitizing heritage monuments.
How to referenceIn order to correctly reference this scholarly work, feel free to copy and paste the following:
Shen-En Chen (2012). Laser Scanning Technology for Bridge Monitoring, Laser Scanner Technology, Dr. J.Apolinar Munoz Rodriguez (Ed.), ISBN: 978-953-51-0280-9, InTech, Available from:http://www.intechopen.com/books/laser-scanner-technology/laser-scanner-technology-for-bridge-monitoring

© 2012 The Author(s). Licensee IntechOpen. This is an open access articledistributed under the terms of the Creative Commons Attribution 3.0License, which permits unrestricted use, distribution, and reproduction inany medium, provided the original work is properly cited.