Land Acquisition and Ethnic Minority Development Plan
29
Qinghai Delingha Concentrated Solar Thermal Power Project (RRP PRC 46058) Qinghai Delingha Concentrated Solar Thermal Power Project Land Acquisition and Ethnic Minority Development Plan China Guangdong Nuclear Solar Energy Development Co. Ltd. December 2012
Transcript of Land Acquisition and Ethnic Minority Development Plan
Qinghai Delingha Concentrated Solar Thermal Power Project (RRP PRC 46058)
Qinghai Delingha Concentrated Solar Thermal Power Project
Land Acquisition and Ethnic Minority Development Plan
China Guangdong Nuclear Solar Energy Development Co. Ltd.
December 2012


Table of Contents
I. INTRODUCTION 4
A. Project Description 4 B. Scope of Land Acquisition 4
II. SOCIOECONOMIC INFORMATION AND PROFILE 4
A. Delingha City 4 B. Xuji Township and Taositu Village 6 C. Affected Households 7 D. General Description of Mongolian Ethnic Minority 10
III. IMPACT ASSESSMENT 11
A. Land Loss 11 B. Income Loss 12
IV. INFORMATION DISCLOSURE, CONSULTATION, AND PARTICIPATION 12
V. GRIEVANCE REDRESS MECHANISM 13
VI. LEGAL FRAMEWORK, ENTITLEMENTS, ASSISTANCE AND BENEFITS 14
A. Legal Framework 14 B. Entitlement, Assistance and Benefits 14
VII. IMPLEMANTATION PLAN 15
A. Actions 15 B. Implementation Schedule 16
VIII. BUDGET 17
A. Budget 17
IX. MONITORING AND REPORTING 17
ANNEX 1: LIST AND SIGNATURES OF CONTRACT HOUSEHOLDS 18
ANNEX 2: RESULT OF HOUSEHOLD SURVEY OF AFFECTED PEOPLE 19
Tables and Figures
Table 1: Socioeconomic Data of Qinghai, Haixi and Delingha (2011) ........................................... 5 Table 2: Specific Social Development Data of Delingha (2010) .................................................... 5 Table 3: General Data of Xuji Township and Taositu Village (2011) .............................................. 7 Table 4: Land Resource ................................................................................................................ 8 Table 5: Holdings of Animals and Other Assets ............................................................................. 9 Table 6: Employment of the Work Force ....................................................................................... 9 Table 7: Education Levels of the Work Force ................................................................................ 9 Table 8: Land and Income Losses of Affected Households ......................................................... 11 Table 9: Consultation Activities .................................................................................................... 13 Table 10: Entitlement Matrix ........................................................................................................ 14 Table 11: Implementation Schedule ............................................................................................ 16 Table 12: Budget Estimation ....................................................................................................... 17 Figure 1: Locations of Project Site, Xuji Township and Taositu Village ......................................... 1 Figure 2: Project Site (behind the Power Line) .............................................................................. 2 Figure 3: Ground Vegetation of Project Site (five years after grazing ban) ................................... 2 Figure 4: New Apartments and Old Houses .................................................................................. 3

Figure 1: Locations of Project Site, Xuji Township and Taositu Village

Figure 2: Project Site (behind the Power Line)
Figure 3: Ground Vegetation of Project Site

Figure 4: New Apartments and Old Houses
(Note: There are 9 buildings with 360 sets of apartments for herder households of Taositu, Wuchahan and Yikela villages of Xuji Township. These buildings form a compound named as Herders’ Community. Sixty sets of these apartments were allocated to the project village of Taositu.

I. INTRODUCTION A. Project Description
1. Qinghai Delingha Concentrated Solar Thermal Power Project will construct 50 megawatt (MW) concentrated solar thermal power (CSP) plant in Taositu village, Xuji township, Delingha city, Qinghai province. The project site is about 7 kilometers (km) from urban Delingha city. The project affected village of Taositu, located at the northern suburb of urban Delingha, is one of the nearest communities to the project site. 1 . The China Guangdong Nuclear Solar Energy Development Company Co. Ltd (CGNPC) is the implementing agency of the project.
2. The impact of the project will be expanded share of CSP plants in the renewable energy mix in the People’s Republic of China (PRC). The outcome will be successful commercial operation of the utility scale CSP plant with thermal storage system in Qinghai province.
B. Scope of Land Acquisition
3. The project will acquire 246 hectare (ha) (3,690 mu)2 of semi-arid unused land from 153 persons of 31 households in Taositu village of Xuji township in Delingha city. The acquired land is within a jointly contracted grazing land of 136,827 mu of the affected village. The land use right was contracted to the 31 households of affected village in 1984 for 50 years (1984–2034). This jointly contracted land, as part of the officially mapped desert land (see Figure 1) was under grazing ban since 5 years ago.
4. The land to be acquired accounts only for 0.73% of the total land3 (3,690 mu out of a total 507,556 mu) and only 2.7% of the jointly contracted land (3,690 mu out of 136,827 mu) of the 31 affected households. Each household will be compensated by CNY167,552 by giving up the semi-arid unused land which is equivalent to three times of the annual average net household income (CNY54,837 in 2011).
5. There is no shelter or structure in the land acquisition area (Figure 2)..Therefore, there will be no loss of crops, trees, and fixed assets (Figure 2 and Figure 3). Overall, there will be no economic and physical displacement resulting from the land acquisition, as the amount of land lost has no impact on their grassland areas for herding.
II. SOCIOECONOMIC INFORMATION AND PROFILE
A. Delingha City
6. Delingha city is the capital of Haixi prefecture which was established in 1988 by separating the Delingha town and 5 townships from the Wulan county. Delingha means “golden world” in Mongolian. Delingha is within the Qinghai-Tibetan Plateau and its average elevation is over 3,000 meters (m) above sea level. The total land area of the city is 27,700 square kilometers (km2) and a total population is 73,300 in 2010. Around 70,000 people are concentrated in urban Delingha and its suburbs. Delingha city administrates four township and three urban subdistricts, and all townships are located along the Qinghai-Tibetan Highway (Figure 1). There are 18 ethnic groups in Delingha, including Han, Mongol, Tibetan, Tu, Hui, Shala, and etc. The ethnic minority population accounted for about 27% of the total population in 2010.
1 Village site of Taositu is mixed with that of the Baishuihe, Hongguang, Yikela and Wuchahan villages. 2 One hectare is equivalent to 15 mu. 3 These are both individually and jointly contracted land.

5
7. The general socioeconomic data of Delingha city, in comparison with Haixi prefecture and Qinghai province, are given in Tables 1 and 2. As shown in the tables, Delingha’s main economic indicators are better than the provincial averages, but slightly behind the prefecture averages. Delingha and its neighboring areas have rich salt and alkaline earth resources, and salt and alkaline related chemical industries are the backbone of Delingha’s economy. As indicated in Figure 1, southern Delingha, including the project site, is a desert where there are a number of salt lakes. The desert area of Delingha is part of the Qaidam Basin which is known for rich mineral resource of salt lakes. As a result of salt-related industries of the Qaidam Basin, Haixi prefecture’s per capita gross domestic product is CNY97,747 in 2011 which is 3.4 times higher than the provincial average of CNY28,800.
Table 1: Socioeconomic Data of Qinghai, Haixi and Delingha (2011)
No. Indicator Unit Qinghai Province
Haixi Prefecture
DelinghaCity
1. Total population Person 5,681,700 495,700 73,300
1.1 Agri. popu. % 68.6 23.9 41.5
1.2 Non-agri. popu. % 31.4 76.1 59.1
1.3 Han % 53.0 76.2 73.0
1.4 Tibetan % 24.4 10.1 5.6
1.5 Mongolian % 1.8 5.3 9.9
1.6 Male % 50.6 51.8 51.4
1.7 Female % 49.4 48.2 48.6
2. Land area km2 720,000 325,785 27,700
3. GDP (2011) CNY million 163,472 48,140 32,820
3.1 Primary sector % 9.5 2.8 8.8
3.2 Secondary sector % 57.5 81.2 54.7
3.3 Tertiary sector % 33.0 16.0 36.5
4. GDP per capita CNY 28,800 97,747 44,757
5. Urban per capita annual income CNY 15,603 19,007 17,210
6. Rural per capita annual income CNY 4,608 6,574 6,192
7. Rural poor (CNY1,500) % 10.3 11.9 9.2
8. Urban poor
8.1 Standard CNY/month n.a. 238 238
8.2 Poor % 13.2 7.6 12.8 % = percentage, CNY = yuan, GDP = gross domestic product, km2 = square kilometer, n.a. = not applicable. Sources: http://wenku.baidu.com/view/1708b98ba0116c175f0e48dd.html for Qinghai 2011 data; http://wenku.baidu.com/view/c87b141a59eef8c75fbfb31b.html for Haixi Prefecture data; and http://www.hxdlh.gov.cn/sites/dlh/index.jsp.
Table 2: Specific Social Development Data of Delingha (2010)
No. Indicator Unit Qty
1. No. of townships No. 4
2. No. of urban subdistrict No. 3
3. 3.1
No. of villages No. 51
No. of herder villages No. 13

6
No. Indicator Unit Qty 3.2 3.3 3.4 3.5
No. of farming/cropping villages No. 38
Villages with tap water % 74.5
Villages with telephone connection % 90.2
Villages with cable television % 54.9
4. Farmland mu 110,000
5. Grassland area Usable grassland area (grazing land)
mu mu
14,750,000 7,140,000
6. Color television among rural households % 100
7. Computer coverage rate among rural households % 8.3
8. Enrollment rate of school-aged children % 99.9
9. Enrollment rate of school-aged girls % 99.9
10. Primary school graduates entering into junior middle schools % 67.5
11. Junior secondary school graduates entering into high schools % 82.0
12. Registered urban unemployment rate % 4.4
13. Coverage of rural cooperative medical service % 73.2
14. Baby delivery in hospitals % 98.3
15. Per capita GDP (2011) CNY 44,757 % = percentage, CNY = Yuan, GDP = gross domestic product, 1 hectare = 15 mu, Qty = quantity. Source: Qinghai Statistical Yearbook, 2011. http://www.hxdlh.gov.cn/sites/dlh/index.jsp B. Xuji Township and Taositu Village
8. The project site is within Taositu village in Xuji township. The project site is about 7 km from the village site (as well as the urban Delingha), and 50 km from the township center. General data of Xuji township and Taositu village are given in the Table 3.
9. Xuji township has six Mongolian villages4 with a total population of 2,178 in 2011. The main economic activity of the township is livestock. The township is sparsely populated and it only has 3.0% of Delingha’s total population while it has as 29.3% of Delingha’s total land area. The population density of Xuji township is only 0.27 person/km2 compared to 2.65 person/km2 for Delingha city. Xuji is the richest township in Delingha in terms of per capita net income due to its rich grassland resource. As indicated in Table 3, Xuji Township’s rural per capita net income of CNY6,585 in 2011 is 6.3% higher than Delingha’s average of CNY6,192.
10. Taositu village is one of the six Mongolian villages of Xuji township. The village, with a total area of 385 km2, stretches for about 140 km from south to north. The village site of Taositu is at the northern suburb of urban Delingha and it is mixed with that of Baishuihe, Hongguang, Wuchahan and Yikela villages (Figure 1). The project site, officially mapped as desert land (Figure 1), is at the southern part of the village. The better grassland, to the north of village, was individually contracted to the 31 households in 1985 for 50 years (1985–2035). The semi-arid land in the south (Figure 1), where the project site is located, was jointly contracted to the 31 households also in 1985 for 50 years. Annex 1 shows that the land was evenly distributed among the 31 households. The semi-arid land can grow some limited Alhagi Sparsifolia (Figure 2 and Figure 3).
11. There were 31 households in Taositu village in 1984 when land contracts were rewarded. The 31 households had split into 46 households by 2011. Since there was no contract
4 All Mongolian herder households, including those from the project affected Taositu village, will be resettled in
department building of urban style of compounds (see Figure 4).

7
adjustment or re-contracting after 1984, all lands including the project site are still contracted by the original 31 households. However, the new households formerly obtained some grazing land elsewhere in the village from their parents and/or grandparents among the original 31 households
Table 3: General Data of Xuji Township and Taositu Village (2011)
Indicator Unit Xuji Township Taositu Village
1. Land area km2 8,125 385
2. Total HH HH 522 46
3. Number of agricultural HH HH 522 46
4. Total population Person 2,178 246
4.1 Agricultural population % 100 100
4.2 Han % 7.0 0
4.3 Tibetan % 1.2 0
4.4 Mongol % 89.0 97.6
4.5 Hui % 0.0 0
4.6 Tu % 2.8 2.4
4.7 Male % 49.5 50.1
4.8 Female % 50.5 49.9
4.9 Population density p/km2 0.27 0.65
5. Cropland mu 800 160*
6. Total grazing land mu 12,150,000 572,732*
7. Per capita annual net income CNY 6,586 8,600
8. Rural poor % 8.4 8.1 (20 persons of 8 HHs)
CNY = yuan, HH = household, 1 hectare = 15 mu, p/km2 = population per square kilometers. *: 507,556.4mu belong to the 31 affected households, and 65,175.6mu belong to the remaining 15 households that are officially registered in the village, but originally from some of the 31 households. Source: township government and village authority.
C. Affected Households
12. The land acquisition will affect 153 persons from 31 households that had legally and jointly contracted the land (equal share per household) in 1984 for 50 years5. The 31 households include 30 Mongolian households of 148 persons and 1 Tuzu household of 5 members. There is no vulnerable household. Details for each affected household are given in Annex 2.
1. Land Resource
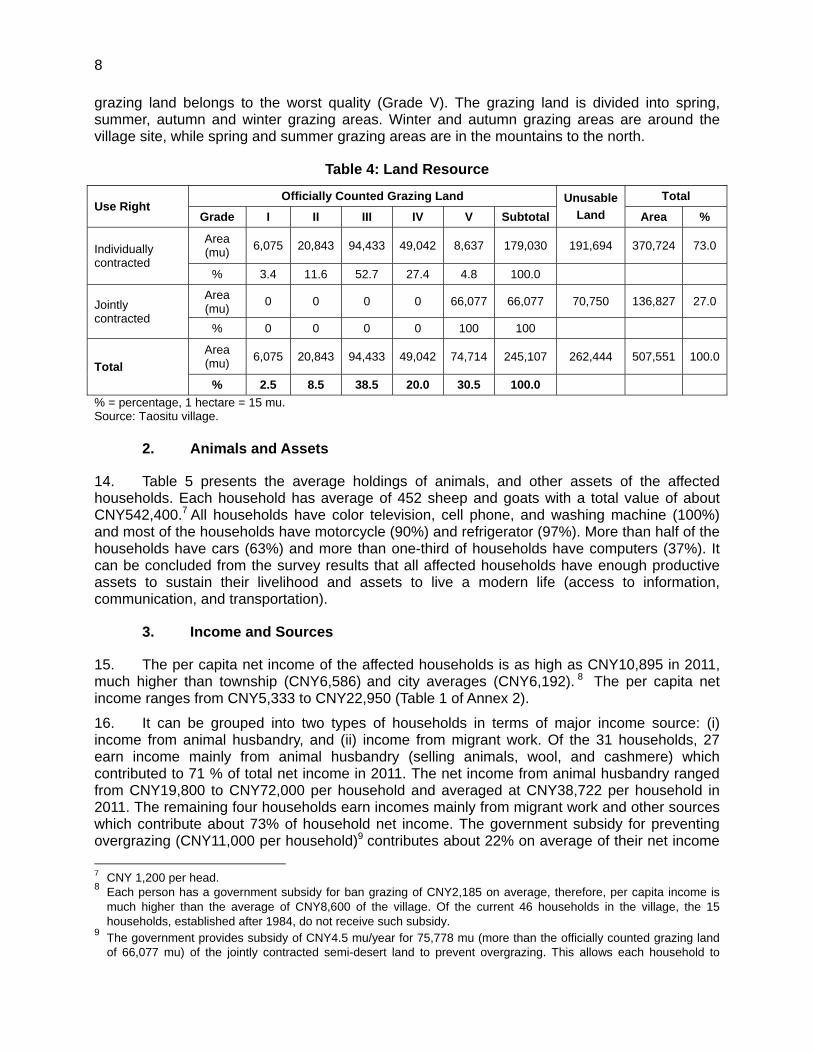
13. Table 4 shows the land resource of the 31 households. The individually contracted grazing land accounts for 73% and the jointly contracted grazing land account for 27% of the total land. On average, each household has 16,372 mu of land, of which 48% is officially counted grazing land.6 The quality of grazing land is classified into five grades. As shown in Table 4, good quality (Grade I-II) grazing land is very limited (15%), and all jointly contracted
5 The remaining 15 households in the village will be indirectly affected as they were new households developed from
those 31 households. These 15 households have obtained certain grazing lands5 from the individually contracted grasslands of their parents and/or grandparents among the 31 households.
6 Eligible for government project support or subsides, if any. The remaining 52% of land are counted as unusable land.
8
grazing land belongs to the worst quality (Grade V). The grazing land is divided into spring, summer, autumn and winter grazing areas. Winter and autumn grazing areas are around the village site, while spring and summer grazing areas are in the mountains to the north.
Table 4: Land Resource
Use Right Officially Counted Grazing Land Unusable
Land
Total
Grade I II III IV V Subtotal Area %
Individually contracted
Area (mu)
6,075 20,843 94,433 49,042 8,637 179,030 191,694 370,724 73.0
% 3.4 11.6 52.7 27.4 4.8 100.0
Jointly contracted
Area (mu)
0 0 0 0 66,077 66,077 70,750 136,827 27.0
% 0 0 0 0 100 100
Total
Area (mu)
6,075 20,843 94,433 49,042 74,714 245,107 262,444 507,551 100.0
% 2.5 8.5 38.5 20.0 30.5 100.0
% = percentage, 1 hectare = 15 mu. Source: Taositu village.
2. Animals and Assets
14. Table 5 presents the average holdings of animals, and other assets of the affected households. Each household has average of 452 sheep and goats with a total value of about CNY542,400.7 All households have color television, cell phone, and washing machine (100%) and most of the households have motorcycle (90%) and refrigerator (97%). More than half of the households have cars (63%) and more than one-third of households have computers (37%). It can be concluded from the survey results that all affected households have enough productive assets to sustain their livelihood and assets to live a modern life (access to information, communication, and transportation).
3. Income and Sources
15. The per capita net income of the affected households is as high as CNY10,895 in 2011, much higher than township (CNY6,586) and city averages (CNY6,192). 8 The per capita net income ranges from CNY5,333 to CNY22,950 (Table 1 of Annex 2).
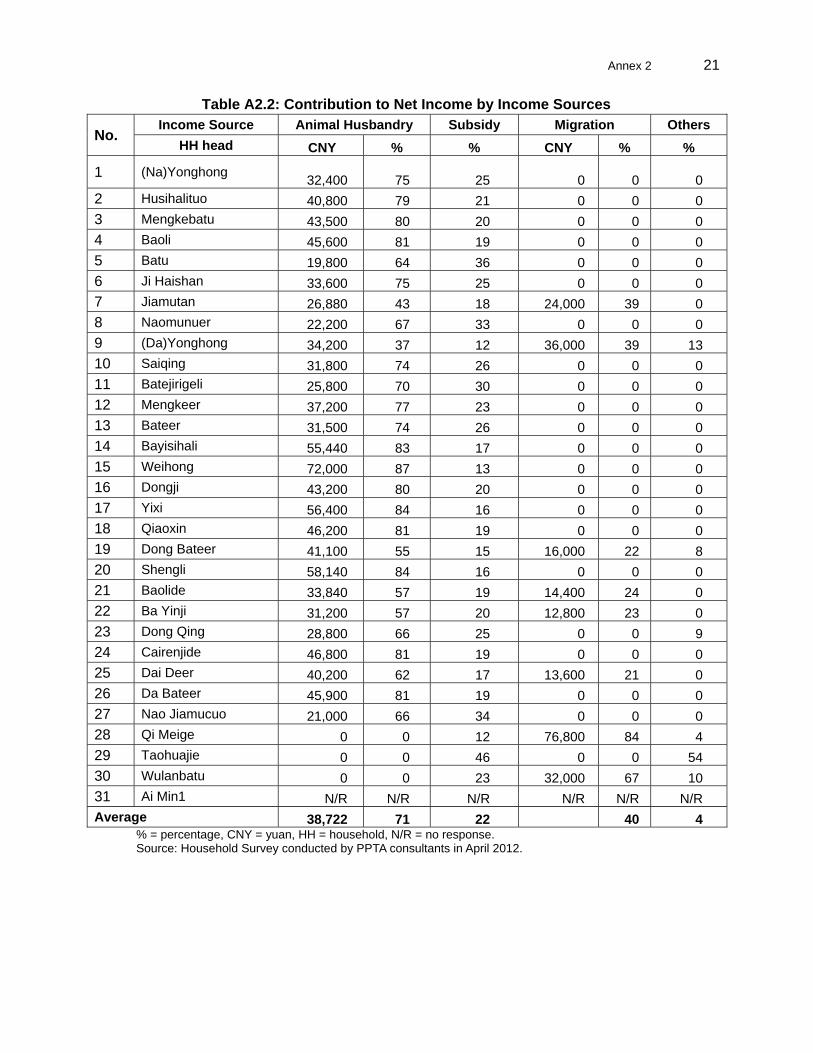
16. It can be grouped into two types of households in terms of major income source: (i) income from animal husbandry, and (ii) income from migrant work. Of the 31 households, 27 earn income mainly from animal husbandry (selling animals, wool, and cashmere) which contributed to 71 % of total net income in 2011. The net income from animal husbandry ranged from CNY19,800 to CNY72,000 per household and averaged at CNY38,722 per household in 2011. The remaining four households earn incomes mainly from migrant work and other sources which contribute about 73% of household net income. The government subsidy for preventing overgrazing (CNY11,000 per household)9 contributes about 22% on average of their net income
7 CNY 1,200 per head. 8 Each person has a government subsidy for ban grazing of CNY2,185 on average, therefore, per capita income is
much higher than the average of CNY8,600 of the village. Of the current 46 households in the village, the 15 households, established after 1984, do not receive such subsidy.
9 The government provides subsidy of CNY4.5 mu/year for 75,778 mu (more than the officially counted grazing land of 66,077 mu) of the jointly contracted semi-desert land to prevent overgrazing. This allows each household to

9
(Table A2.2).
Table 5: Holdings of Animals and Other Assets
Assets Unit Range/Average % of HH with Assets
Animals (27 HHs)10
Sheep/goats
Head/HH
310-800/452 90
Yak 7-150/11 19
Horse 1-6 (19 HHs)/2 70
Production & living assets (data of 30 HHs)11
Agri.vehicle
Set/HH
10
Tractor 47
Pickup/car 63
Motorcycle 90
Color television 100
Cell phone 100
Washing mach. 100
Refrigerator 97
Computer 37 HH = household. Source: Household survey in April 2012.
4. Employment and Education
17. Tables 6 and 7 present the employment status and educational levels of the work force12 of the affected households. Among the 31 households, 8 households have migrant workers (8.9% and 12.5% of total male and female labors), but only 4 households are long-term migrant workers; the remaining workforce are engaged in animal husbandry.
18. The educational levels of the workforce were poor. The illiteracy rates are 14.2% for the male workforce and 17.3% for the female workforce. Only 19.3% of the workforce have attended or are attending high school or higher level. It is interesting to see that the female attendance above high school level is higher than male. All school aged children are attending schools (Annex 2).
Table 6: Employment of the Work Force
Employment
Male Female Total
Number % Number % Number %
Migration (eight HHs) 5 8.9 6 12.5 11 10.6
Pure grazing 51 91.1 42 87.5 93 89.4
Total 56 100.0 48 100.0 104 100.0
% = percentage, HH = household. Source: Household survey in April 2012.
Table 7: Education Levels of the Work Force
Level of Education
Male Female TotalNumber % Number % Number %
University 4 7.1 5 10.4 9 8.7
receive CNY11,000 of the subsidy every year from the government.
10 Four households are no longer engaged in animal husbandry. 11 One household is living in Dacaidan some 200km away to the west (migration). 12 The ages range from 18 to 65 years old.

10
Technical secondary school 1 1.7 2 4.1 3 2.9 High school 3 5.3 5 10.4 8 7.7 Primary middle school 12 21.4 9 18.7 21 20.2 Primary school 28 50.3 17 35.4 45 43.3 Illiterate 8 14.2 10 21.0 18 17.3 Total 56 100.0 48 100.0 104 100.0 % = percentage. Source: Household survey in April 2012.
5. Housing Conditions
19. Under the government rural housing program, 27 out of 31 affected households moved into apartment buildings with district heating before Oct 2011 (Figure 4)13 and the remaining four households bought houses in city. The new apartment buildings14 are close to the current village site and to both a primary and a secondary school.15 Individual households could choose either 87 square meter (m2) or 120 m2 apartment based on their affordability. The government provided the subsidy of CNY45,000 for each household regardless of the size of the apartment. Contribution from individual household was CNY60,000 for the 87 m2 apartments or CNY99,000 for the 120 m2.
20. During the spring and summer time, labors live in their traditional yurt in their grazing areas which could be as far as120 km away from the village site. A new type of yurt, which is light and highly insulated, is now available in the project area. The project will promote this type of yurt to affected ethnic minority herder households.
D. General Description of Mongolian Ethnic Minority
21. History. Mongolians first came to Qinghai in 1200s as rulers and they ruled Qinghai region for about 150 years (the period of Yuan Dynasty in PRC, 1229–1368 or so). Eastern Mongols first fled/came to the Qaidam Basin area as semi-settled herders in 1514 from current Inner Mongolia after their failure against the Ming Dynasty Government. Then more eastern Mongols joined in 1559 as herders. Western Mongols, from current Xinjiang province, then defeated the Eastern Mongolia in 1638 and occupied Qinghai. As a result, many western Mongolian came to the project area and Qinghai as semi-settled herders.
22. In 1723, the Mongolians organized themselves to fight the Qing Dynasty Government, but were defeated in 1724 with many Mongolian being killed. The remaining Mongolians were then restricted to the specific sites and were organized in a manner of military units.16 As a result, the Mongols became fully settled herders with fixed grazing areas. According to the Place Name Book of Haixi prefecture,17 almost all the current Mongolian villages, including the project village of Taositu, were established shortly after 1724. There were 10 Qi in the current Haixi prefecture since 1720s, the project city of Delingha belonged to the Beizuoyi Qi (also named as Kelugoubeizi Qi).
23. Language. The Mongolian language belongs to the Mongolian group of the Altaic phylum and has eastern and western dialects. Mongols in the project area speak the latter. The written form is derived from that of the 13th century and had experienced many changes. Although many Mongols can speak their own language, they use Mandarin for written
13 The apartment buildings have been constructed as shown Figure 2. 14 There are 360 sets of apartments for three Mongolian herder villages of Taositu, Wuchahan and Yikela of the Xuji
Township. 15 Shijian Hope Primary School and No.2 Middle School of Delingha. 16 A hundred households formed a Zuoling (similar to current village), some Zuoling formed a Qi (like today’s township
or county), several Qi formed a Meng (similar to today’s prefecture). 17 Chief editor: Wang Zhenguo, internal publication of Haixi Prefecture Toponymy Office, Dec 1990.

11
documents (e.g., signatures are all in Mandarin).
24. Religion. Before the 16th century, the Mongolians, together with many other northern tribes, believed in Shamanism but turned to Lamaism (Buddhist) in the Yuan Dynasty when they were the mainstream and ruling group.
25. Livelihoods. For rural Mongolian, herding/pasturing livestock is still the main economic activity and source of income.
26. Housing. Rural Mongolians are settled herders and they used to live in single storey houses of brick-wood and earth-wood structures (Figure 4). During summer and spring time, when grazing in high mountains, they live in traditional yurts.18 Currently, local governments are promoting modern apartment buildings with district heating system and modern highly insulated yurts.
27. Gender Aspects. Mongolian, compared with the Han, don’t have gender preference and discrimination against women. Usually, the Mongolian parents will give large dowry, in the forms of animals and grazing land, to their daughters when getting married. However, men are still considered superior to women and men hardly do any household chores except tending (grazing) their animals.
III. IMPACT ASSESSMENT
A. Land Loss
28. The affected households will lose 246 ha or 3,690mu (7.94ha or 119.0mu per household) of jointly contracted semi-arid unused land (classified as lowest grade of V). Table 8 presents the land losses of each affected household. Land loss impact is very insignificant as each household will lose only 0.7% of their total land on average.
Table 8: Land and Income Losses of Affected Households
No. Household Land Area (mu) Land Loss
HH Contracted
Jointly Contracted
Total Area (mu) %
1. (Na)Yonghong 13,002.0 4,413.8 17,416 119 0.7
2. Husihalituo 19,512.0 4,413.8 23,926 119 0.5
3. Qi Meige 7,282.0 4,413.8 11,696 119 1.0
4. Mengkebatu 12,833.0 4,413.8 17,247 119 0.7
5. Baoli 6,699.0 4,413.8 11,113 119 1.1
6. Batu 13,086.0 4,413.8 17,500 119 0.7
7. Ji Haishan 6,997.0 4,413.8 11,411 119 1.0
8. Jiamutan 13,928.0 4,413.8 18,342 119 0.6
9. Naomunuer 9,002.0 4,413.8 13,416 119 0.9
10. (Da)Yonghong 10,619.0 4,413.8 15,033 119 0.8
11. Saiqing 6,344.0 4,413.8 10,758 119 1.1
12. Taohuajie 19,029.0 4,413.8 23,443 119 0.5
13. Batejirigeli 19,151.0 4,413.8 23,565 119 0.5
14. Mengkeer 7,657.0 4,413.8 12,071 119 1.0
18 The Mongolian yurt is a domed tent. A circular wood frame at the top is supported by slim wooden poles about two
meters long that extend to the top of the walls. The walls themselves are an interwoven latticework structure. The frame is covered with a thick piece of felt fastened from the outside of the yurt with ropes. The yurt has an adjustable opening on top which provides both light and ventilation.

12
No. Household Land Area (mu) Land Loss
HH Contracted
Jointly Contracted
Total Area (mu) %
15. Bateer 12,040.0 4,413.8 16,454 119 0.7
16. Bayisihali 13,723.0 4,413.8 18,137 119 0.7
17. Weihong 15,875.0 4,413.8 20,289 119 0.6
18. Dongji 15,107.0 4,413.8 19,521 119 0.6
19. Yixi 14,523.0 4,413.8 18,937 119 0.6
20. Wulanbatu 8,461.0 4,413.8 12,875 119 0.9
21. Qiaoxin 8,410.0 4,413.8 12,824 119 0.9
22. Dong Bateer 15,440.0 4,413.8 19,854 119 0.6
23. Shengli 10,157.6 4,413.8 14,571 119 0.8
24. Baolide 15,394.0 4,413.8 19,808 119 0.6
25. Ba Yinji 8,878.0 4,413.8 13,292 119 0.9
26. Dong Qing 6,402.0 4,413.8 10,816 119 1.1
27. Cairenjide 17,917.0 4,413.8 22,331 119 0.5
28. Dai Deer 13,353.0 4,413.8 17,767 119 0.7
29. Da Bateer 6,007.0 4,413.8 10,421 119 1.1
30. Nao Jiamucuo 12,388.0 4,413.8 16,802 119 0.7
31. Aimin 11,512.0 4,413.8 15,926 119 0.7
Total 370,728.6 136,827.8 507,556.4 3,690 0.7 % = percentage, HH = household, 1 hectare = 15 mu. Source: Household survey in April 2012.
B. Income Loss
29. The land to be acquired is semi-arid and unused land, therefore, there will be no loss of crops, trees, and fixed assets. There is also no shelter or structure in the land acquisition area (see Figure 2).
30. Each household will be compensated CNY167,552 by giving up semi-arid unused land which is equivalent to three times of the annual average net household income (CNY54,837 in 2011). This type of land is not permitted to be grazed, so each household gets a government subsidy of CNY 4.5 per mu for 66mu out of the 119mu to be acquired. After the land is acquired, this subsidy will be lost (CNY 297 per household per year) but the cash compensation each household receives will be equivalent to 564 times of the annually subsidy loss. Overall, there will be no economic and physical displacement resulting from the land acquisition. In fact, the compensation will be a significant benefit for the affected households.
IV. INFORMATION DISCLOSURE, CONSULTATION, AND PARTICIPATION
31. A number of consultation sessions among local people, township and city governments, were carried out during the feasibility study and is in the process of preparing the resettlement plan and the environmental impact assessment (Table 9). The results of public consultation with all affected households are summarized below:
(i) All the affected households and government departments support the project. (ii) All households are willing to transfer their land use rights to the project by a
reasonable compensation fee.19
19 Some herders even made phone calls to the consultants during July-August showing their worries if the project and
land acquisition are not going to be implemented..

13
(iii) All households prefer conflict arbitration through local governments. (iv) The affected households had experienced land acquisition for the same type of
solar thermal power plants for four times, and are satisfied with the land acquisition policy, procedures and compensation rate.
Table 9: Consultation Activities
Date Participants Number Purpose
June 2011–February 2012
Design institute; implementing agency; Haixi prefecture and Delingha city governments and their line agencies (land resource bureaus, development and reform bureaus, energy sector, environmental sectors, agricultural bureaus); Xuji township; and Taositu village
120 (30F and
90M) in 10 times
Assess the feasibility of the project, project site selection, land availability
April 2012 Implementing agency, consultants, Xuji township, government agencies, Taositu village, herder households
50 (25F and
25M)
Assess land acquisition, social, and environmental impacts
May 2012 Implementing agency, consultant, Xuji township, Taositu village, affected herder households
70 (35F &35M)
Socioeconomic survey, impact assessment on social and land acquisition
Sept 2012 Delingha Land Resource Bureau, Toasitu village50
(30F & 20M)
Notifying the scaling down of land acquisition impact from 4,200mu to 3,690mu.
Oct 2012 Consultants, EA 10
(6F & 4M)
Latest progress of the project preparation, adjustment of land acquisition scope
Total 300
(126F & 174M)
F = female; M = male Source: Public consultations under TA-7643 (PRC): Qinghai Delingha Concentrated Solar Thermal Plant Project.
V. GRIEVANCE REDRESS MECHANISM
32. Any disagreement related to land acquisition and compensation will be settled according to the following procedures:
Step 1: If any affected person is aggrieved by any aspect of the land acquisition, he/she can state his/her grievance and appeal to the village committee in oral or in written form. If an oral appeal is made, the village committee will record it on paper and process it. Village committee will make a decision on or resolve it in 2 weeks. Step 2: If the aggrieved affected person is not satisfied with the decision of the township, the aggrieved affected can state the grievance and appeal to the township government in oral or in written form. The township government will make a decision on or resolve it in 2 weeks. Step 3: If the aggrieved affected person is not satisfied with the decision of the township, he/she can appeal to Delingha city government after receiving the decision; the city government will reach a decision in 2 weeks.
33. At any point, if the affected person is dissatisfied with the grievance process, he/she may appeal to the civil division of a people’s court according to the civil court procedure.
14
VI. LEGAL FRAMEWORK, ENTITLEMENTS, ASSISTANCE AND BENEFITS
A. Legal Framework
34. In accordance with Qinghai Provincial Land and Resources Department’s Order No. 144 issued in 2005 and the requirements of ADB's Safeguard Policy Statement (2009),20 all the affected households are entitled for cash compensation for transferring their land use rights to the CGNPC through the Delingha City Land and Resource Bureau.
B. Entitlement, Assistance and Benefits
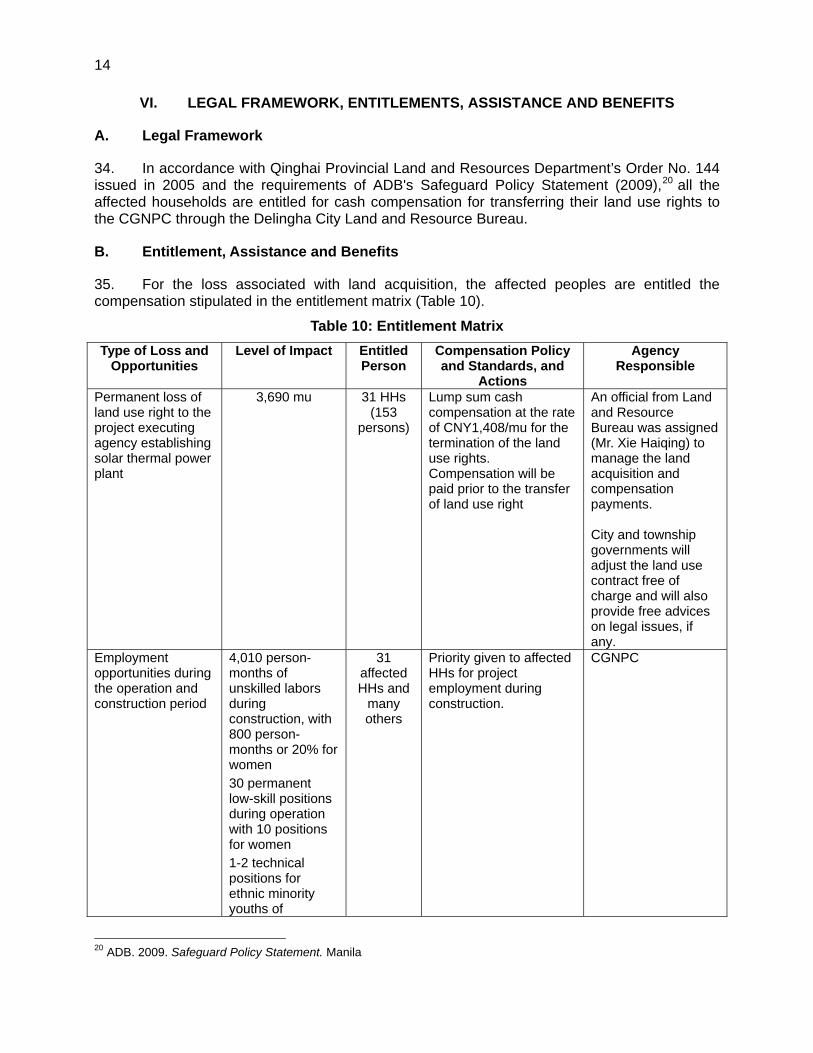
35. For the loss associated with land acquisition, the affected peoples are entitled the compensation stipulated in the entitlement matrix (Table 10).
Table 10: Entitlement Matrix
Type of Loss and Opportunities
Level of Impact Entitled Person
Compensation Policy and Standards, and
Actions
Agency Responsible
Permanent loss of land use right to the project executing agency establishing solar thermal power plant
3,690 mu 31 HHs (153
persons)
Lump sum cash compensation at the rate of CNY1,408/mu for the termination of the land use rights. Compensation will be paid prior to the transfer of land use right
An official from Land and Resource Bureau was assigned (Mr. Xie Haiqing) to manage the land acquisition and compensation payments. City and township governments will adjust the land use contract free of charge and will also provide free advices on legal issues, if any.
Employment opportunities during the operation and construction period
4,010 person-months of unskilled labors during construction, with 800 person-months or 20% for women 30 permanent low-skill positions during operation with 10 positions for women 1-2 technical positions for ethnic minority youths of
31 affected HHs and
many others
Priority given to affected HHs for project employment during construction.
CGNPC
20 ADB. 2009. Safeguard Policy Statement. Manila

15
Type of Loss and Opportunities
Level of Impact Entitled Person
Compensation Policy and Standards, and
Actions
Agency Responsible
university graduates
Provision of high insulation yurts
40 sets 40 HHs of Taositu
village
City government (agricultural sector) and participating households
Provision of portable solar power generation set for yurts
40 sets 40 HHs of Taositu
village
City government (agricultural sector) and implementing agency
Training Capacity building of households in Taositu village
All HHs of Taositu village
Employment skill training: 100 person-times, 20% of women Grassland management training: 200 person-times, 40% of women Household financial resource and asset management training: 100 person-times, 50% of women
CGNPC Agricultural bureauof Delingha city Women’s federation of Delingha city
CGNPC = China Guangdong Nuclear Solar Energy Development Company Co. Ltd, CNY = yuan, HH = household, 1 hectare = 15 mu. Source: Implementing agency and local government estimates.
VII. ACTION PLAN
A. Actions
36. To better benefit the affected households and avoid any potential negative impact from the sudden flow in a large sum of compensation to the affected households, the following enhancement actions will be taken along with the implementation of land acquisition.
37. Employment skill training. The project will provide: (i) 4,010 person-months of unskilled labors during construction, with 800 person-months or 20% for women; and (ii) 30 permanent low-skill positions during operation with 10 positions for women. To better benefit affected households and many others from these employment opportunities, the implementing agency will train at least 100 person-times of local laborers (2 person-times for each household), including 20 person-times of female laborers.
38. Provision of high insulation yurts and portable solar power generation sets. Herder households have to stay in yurts in the high mountains, with the farthest of over 100km, during spring and summer grazing periods. Due to high elevation of over 3,000m, the grazing grounds are rather cold in evenings even in summer. The project will provide 40 sets21 of high insulation yurts and portable solar power generation sets to the herder households of the affected village of Taositu.
39. Grassland management training. Along with the provision high insulation yurts and solar power generation sets, training on protection oriented grassland management will be provided to both male and female laborers of all herder households. About 200 person-times of
21 There are 46 hosueholds in the village, but some of them are no longer engaged in grazing/ animal production.

16
training (2 person-times for each household), with 40% for women, will be organized.
40. Training on household financial management. To enable the affected households to better use the land compensation payment, which is a large sum to each affected household, training on both household financial and assets management for both male and female adults will be carried out by the local women’s federation before and after compensation disbursement. Similarly, 100 person-times of training (2 person-times for each household), with 50% for women, will be organized.
B. Implementation Schedule
41. Implementation schedule is presented in Table 11.
Table 11: Implementation Schedule
No. Tasks Target ResponsibleAgency
Status and Deadline
1 Preparation of Land Acquisition and Ethnic Minority Development Plan
1.1 Draft plan Implementing agency and PPTA consultants
30 May 2012
1.2 Information disclosure 31 HHs Implementing agency, PPTA consultants, local government
Done in April and May 2012
1.3 Finalizing Land Acquisition and Ethnic Minority Development Plan and Approval
Ditto and ADB November 2012
1.4 Approval of land acquisition and ethnic minority development plan
Implementing agency, Delingha city government
December 2012
1.5 Posting on ADB website ADB January 2013 or sooner 2 Implementation
2.1 Jointly signing contract 31 HHs Delingha city government
April 2013 or sooner
2.2 Disbursement of compensation fee
31 HHs Delingha land and resource bureau
Within 1 month after signing contract
2.3 Land transfer Delingha land and resource bureau and the executing agency
Within 2 weeks after paying compensation to affected
HHs
2.4 Provision of high insulate yurts and portable solar power generation panels
40 HHs Government and benefiting HHs
May 2013-May 2015
2.5 Employment skill training for construction
100 person-times of labours
Implementing agency
June 2013-December 2016
2.6 Employment of locals as long term staff
5-10 locals Ditto January 2017 or sooner
2.7 Training on grassland management
Taositu village
Agricultural bureau of Delingha
March (i.e., before grazing season starts) in each year
from 2013 to 2017, 40 person time each year
2.8 Training on household financial management
100 person-
time
Delingha women’s federation
Before and after compensation payments
3 Monitoring and Reporting 3.1 Semi-annual progress report 3 report Implementing July 2013

17
No. Tasks Target ResponsibleAgency
Status and Deadline
agency January 2014 July 2014
January 2015 3.2 Completion report 1 report Ditto January 2016
ADB = Asian Development Bank, HH = household, PPTA = project preparatory technical assistance, TBD = to be determined. Source: Implementing agency and local government estimates.
VIII. BUDGET
42. Table 12 presents the budget for land acquisition and ethnic minority development. The total budget will be CNY6,625,520 including (i) land compensation of CNY5,195,520 with the rate of CNY1,408 per mu; (ii) ethnic minority development cost of CNY600,000; (iii) training expense of CNY 50,000; (iv) administration and monitoring expense of CNY260,000; and (v) contingency of CNY520,000. As indicated in Table 12, the costs will be shared by CGNPC (91.5%), government (6.6%) and the benefiting households (1.8%)22. The land compensation will be evenly and directly paid to the 31 affected households through a local bank by the Delingha City Land Resource Bureau.
Table 12: Cost Estimates
Item Unit Qty Unit cost
Cost Funding Source (CNY)CNY % IA Gov’t HHs
1. Land acquisition
Permanent land acquisition
mu 3,690 1,408 5,195,520 78.4 5,195,520 0 0
2. Ethnic minority development
High insulation yurt
Set 40 12,000 480,000 7.2 0 400,000 80,000
Portable solar power generation set
Set 40 3,000 120,000 1.8 40,000 40,000 40,000
3. Training activities
50,000 0.8 50,000
4. Administration and monitoring 5 % of land compensation cost
260,000 3.9 260,000 0 0
5. Contingency 10% of land compensation cost
520,000 7.8 520,000 0 0
Total23 6,625,520 100 6,065,520 440,000 120,000
91.5% 6.6% 1.8%
% = percentage, CNY = yuan, HH = household, IA = implementation agency Source: Implementing agency and local government
IX. MONITORING AND REPORTING
43. Semi-annual reports will be required during implementation which the first report will be due after land transfer. Thereafter, two annual monitoring reports will be prepared to evaluate the impacts of the project on the livelihoods and lifestyles of the affected village and ensure there are no remaining issues. If issues should arise, remedial measures should be prepared and agreed with ADB and implemented prior to project completion.
22 Households will contribute one sixth of cost for yurts and one third of cost for portable solar power generators. 23 Exemption of government charges for renewable energy projects.

18 Annex 1
ANNEX 1: LIST AND SIGNATURES OF CONTRACT HOUSEHOLDS

19
Annex 2
ANNEX 2: RESULT OF HOUSEHOLD SURVEY OF AFFECTED PEOPLE
Table A2.1: Household Size, Ethnic Groups, Income and Sources
No. HH head Sex Ethnic Group
Age HH
Size If
Poor
Annual Income (CNY) and Sources
Total Animal
husbandry. %
Ban Grazing Subsidy
% Migration %
Land Leasing or
Salary (bold)
% Net
Income Per
Capita
65,000 54,000 83 11,000 17 0 0 0 0 43,400 10,850
79,000 68,000 86 11,000 14 0 0 0 0 51,800 17,267
3 Mengkebatu M Mongol 42 7 No 83,500 72,500 87 11,000 13 0 0 0 0 54,500 7,786
4 Baoli M Mongol 56 10 No 87,000 76,000 87 11,000 13 0 0 0 0 56,600 5,660
5 Batu M Mongol 34 2 No 44,000 33,000 75 11,000 25 0 0 0 0 30,800 15,400
6 Ji Haishan M Tu Zu 38 5 No 67,000 56,000 84 11,000 16 0 0 0 0 44,600 8,920
7 Jiamutan M Mongol 58 5 No 85,800 44,800 52 11,000 13 30,000 35 0 0 61,880 12,376
8 Naomunuer M Mongol 60 5 No 48,000 37,000 77 11,000 23 0 0 0 0 33,200 6,640
9 (Da)Yonghong M Mongol 45 5 No 25,000 57,000 46 11,000 9 45,000 36 12,000 10 93,200 18,640
10 Saiqing F Mongol 49 6 No 64,000 53,000 83 11,000 17 0 0 0 0 42,800 7,133
11 Batejirigeli M Mongol 42 5 No 54,000 43,000 80 11,000 20 0 0 0 0 36,800 7,360
12 Mengkeer M Mongol 50 4 No 73,000 62,000 85 11,000 15 0 0 0 0 48,200 12,050
13 Bateer M Mongol 42 5 No 63,500 52,500 83 11,000 17 0 0 0 0 42,500 8,500
14 Bayisihali M Mongol 40 6 No 03,400 92,400 89 11,000 11 0 0 0 0 66,440 11,073
15 Weihong M Mongol 43 4 No 31,000 120,000 92 11,000 8 0 0 0 0 83,000 20,750
16 Dongji M Mongol 44 4 No 83,000 72,000 87 11,000 13 0 0 0 0 54,200 13,550
17 Yixi M Mongol 64 9 No 05,000 94,000 90 11,000 10 0 0 0 0 67,400 7,489
18 Qiaoxin M Mongol 57 8 No 88,000 77,000 88 11,000 13 0 0 0 0 57,200 7,150
19 Dong Bateer M Mongol 48 4 No 05,500 68,500 65 11,000 10 20,000 19 6,000 6 74,100 18,525
20 Shengli M Mongol 45 6 No 07,900 96,900 90 11,000 10 0 0 0 0 69,140 11,523
21 Baolide M Mongol 47 3 No 85,400 56,400 66 11,000 13 18,000 21 0 0 59,240 19,747
22 Ba Yinji M Mongol 50 4 No 79,000 52,000 66 11,000 14 16,000 20 0 0 55,000 13,750

20 A
nnex 2
No. HH head Sex Ethnic Group
Age HH
Size If
Poor
Annual Income (CNY) and Sources
Total Animal
husbandry. %
Ban Grazing Subsidy
% Migration %
Land Leasing or
Salary (bold)
% Net
Income Per
Capita
23 Dong Qing M Mongol 38 4 No 63,000 48,000 76 11,000 17 0 0 4,000 6 43,800 10,950
24 Cairenjide F Mongol 77 3 No 89,000 78,000 88 11,000 12 0 0 0 0 57,800 19,267
25 Dai Deer M Mongol 62 7 No 95,000 67,000 71 11,000 12 17,000 18 0 0 64,800 9,257
26 Da Bateer M Mongol 61 8 No 87,500 76,500 87 11,000 13 0 0 0 0 56,900 7,113
27 Nao Jiamucuo M Mongol 69 6 No 46,000 35,000 76 11,000 24 0 0 0 0 32,000 5,333
28 Qi Meige F Mongol 52 4 No 11,000 0 0 11,000 10 96,000 86 4,000 4 91,800 22,950
29 Taohuajie F Mongol 54 2 No 24,000 0 0 11,000 46 0 0 13,000 54 24,000 12,000
30 Wulanbatu M Mongol 40 3 No 56,000 0 0 11,000 20 40,000 71 5,000 9 48,000 16,000
31 Ai Min1 M Mongol 41 2 No N/A N/A N/A N/A N/A N/A N/A N/A N/A N/A N/A
Average 4.9 No 79,950 64,537 79 16 5,407 79 7,333 22 54,837 10,895
Note: Data is not available as the household migrated to another county. Source: Household survey conducted by TA consultants in April 2012.
Annex 2 21
Table A2.2: Contribution to Net Income by Income Sources
No. Income Source Animal Husbandry Subsidy Migration Others
HH head CNY % % CNY % %
1 (Na)Yonghong 32,400 75 25 0 0 0
2 Husihalituo 40,800 79 21 0 0 0
3 Mengkebatu 43,500 80 20 0 0 0
4 Baoli 45,600 81 19 0 0 0
5 Batu 19,800 64 36 0 0 0
6 Ji Haishan 33,600 75 25 0 0 0
7 Jiamutan 26,880 43 18 24,000 39 0
8 Naomunuer 22,200 67 33 0 0 0
9 (Da)Yonghong 34,200 37 12 36,000 39 13
10 Saiqing 31,800 74 26 0 0 0
11 Batejirigeli 25,800 70 30 0 0 0
12 Mengkeer 37,200 77 23 0 0 0
13 Bateer 31,500 74 26 0 0 0
14 Bayisihali 55,440 83 17 0 0 0
15 Weihong 72,000 87 13 0 0 0
16 Dongji 43,200 80 20 0 0 0
17 Yixi 56,400 84 16 0 0 0
18 Qiaoxin 46,200 81 19 0 0 0
19 Dong Bateer 41,100 55 15 16,000 22 8
20 Shengli 58,140 84 16 0 0 0
21 Baolide 33,840 57 19 14,400 24 0
22 Ba Yinji 31,200 57 20 12,800 23 0
23 Dong Qing 28,800 66 25 0 0 9
24 Cairenjide 46,800 81 19 0 0 0
25 Dai Deer 40,200 62 17 13,600 21 0
26 Da Bateer 45,900 81 19 0 0 0
27 Nao Jiamucuo 21,000 66 34 0 0 0
28 Qi Meige 0 0 12 76,800 84 4
29 Taohuajie 0 0 46 0 0 54
30 Wulanbatu 0 0 23 32,000 67 10
31 Ai Min1 N/R N/R N/R N/R N/R N/R Average 38,722 71 22 40 4
% = percentage, CNY = yuan, HH = household, N/R = no response. Source: Household Survey conducted by PPTA consultants in April 2012.

Annex 2 22
Table A2.3: Land Resource, Land and Income Losses
Name of Households
Households Contracted Grassland (mu) Jointly Contracted (mu)Grand Total (mu)
Land Loss Grazing Land by Class
Unusable Total
Grazing Land
Unusable Total I II III IV V Subtotal V
Area (mu)
%
1. (Na)Yonghong 303 1,161 2,910 1,906 0 5,976 6,723 13,002 2,445 1,969 4,414 17,416 119 0.7
2. Husihalituo 221 788 5,285 2,940 189 9,202 10,090 19,512 2,445 1,969 4,414 23,926 119 0.5
3. Qi Meige 128 556 1,688 1,146 0 3,389 3,765 7,282 2,445 1,969 4,414 11,696 119 1.0
4. Mengkebatu 297 1,140 2,691 1,799 270 5,900 6,636 12,833 2,445 1,969 4,414 17,247 119 0.7
5. Baoli 141 548 1,436 883 228 3,094 3,464 6,699 2,445 1,969 4,414 11,113 119 1.1
6. Batu 268 1,094 2,844 2,113 0 6,051 6,767 13,086 2,445 1,969 4,414 17,500 119 0.7
7. Ji Haishan 82 255 2,113 803 126 3,297 3,618 6,997 2,445 1,969 4,414 11,411 119 1.0
8. Jiamutan 132 612 4,546 1,437 0 6,595 7,202 13,928 2,445 1,969 4,414 18,342 119 0.6
9. Naomunuer 159 679 2,114 1,129 267 4,188 4,655 9,002 2,445 1,969 4,414 13,416 119 0.9
10. (Da)Yonghong 213 742 2,268 1,478 428 4,915 5,491 10,619 2,445 1,969 4,414 15,033 119 0.8
11. Saiqing 80 273 1,712 760 240 2,984 3,280 6,344 2,445 1,969 4,414 10,758 119 1.1
12. Taohuajie 203 667 5,220 2,392 708 8,987 9,840 19,029 2,445 1,969 4,414 23,443 119 0.5
13. Batejirigeli 245 734 5,445 2,289 536 9,004 9,903 19,151 2,445 1,969 4,414 23,565 119 0.5
14. Mengkeer 245 202 2,393 858 0 3,453 3,959 7,657 2,445 1,969 4,414 12,071 119 1.0
15. Bateer 266 1,045 2,780 1,724 0 5,548 6,226 12,040 2,445 1,969 4,414 16,454 119 0.7
16. Bayisihali 206 647 3,802 1,651 319 6,419 7,096 13,723 2,445 1,969 4,414 18,137 119 0.7
17. Weihong 141 390 5,030 1,788 318 7,526 8,209 15,875 2,445 1,969 4,414 20,289 119 0.6
18. Dongji 184 168 4,323 1,900 721 7,112 7,812 15,107 2,445 1,969 4,414 19,521 119 0.6
19. Yixi 289 1,114 2,847 1,403 1,360 6,724 7,510 14,523 2,445 1,969 4,414 18,937 119 0.6
20. Wulanbatu 151 626 1,765 1,545 0 3,935 4,375 8,461 2,445 1,969 4,414 12,875 119 0.9
21. Qiaoxin 158 637 2,101 1,166 0 3,903 4,349 8,410 2,445 1,969 4,414 12,824 119 0.9
22. Dong Bateer 152 474 4,753 1,699 378 7,304 7,984 15,440 2,445 1,969 4,414 19,854 119 0.6
23. Shengli 230 230 2,356 2,091 0 4,678 5,250 10,158 2,445 1,969 4,414 14,571 119 0.8
24. Baolide 231 727 4,269 1,850 357 7,203 7,960 15,394 2,445 1,969 4,414 19,808 119 0.6
25. Ba Yinji 176 733 2,121 1,258 0 4,111 4,591 8,878 2,445 1,969 4,414 13,292 119 0.9
26. Dong Qing 75 389 1,506 791 332 3,017 3,310 6,402 2,445 1,969 4,414 10,816 119 1.1

Annex 2 23
Name of Households
Households Contracted Grassland (mu) Jointly Contracted (mu)Grand Total (mu)
Land Loss Grazing Land by Class
Unusable Total
Grazing Land
Unusable Total I II III IV V Subtotal V
Area (mu)
%
27. Cairenjide 178 483 5,488 2,143 361 8,475 9,265 17,917 2,445 1,969 4,414 22,331 119 0.5
28. Dai Deer 247 1,098 2,556 1,476 1,071 6,201 6,905 13,353 2,445 1,969 4,414 17,767 119 0.7
29. Da Bateer 186 765 989 961 0 2,715 3,106 6,007 2,445 1,969 4,414 10,421 119 1.1
30. Nao Jiamucuo 245 919 2,706 1,683 429 5,737 6,406 12,388 2,445 1,969 4,414 16,802 119 0.7
31. Aimin 243 947 2,382 1,988 0 5,316 5,953 11,512 2,445 1,969 4,414 15,926 119 0.7
Total 6,075 20,843 94,433 49,042 8,637 172,955 191,694 370,729 75,789 61,039 136,828 507,556 3690 0.7 Source: Household Survey conducted by PPTA consultants in April 2012.

24 Annex 2
Table A2.4: Animals and Animal Products
No. Household
Sheep/Goat (head) Yak (head) Horse (head) Wool Sold in
2011 (kg)
Cashmere Sold in
2011 (kg) Qty in Stock
Qty Sold in 2011
Qty in Stock
Qty Sold in 2011
Qty in Stock
Qty Sold in 2011
1. (Na)Yonghong 400 100 1 270
2. Husihalituo 500 100 4 380
3. Mengkebatu 460 110 100 20 150
4. Baoli 450 100 3 2 30
5. Batu 600 60 3 300
6. Ji Haishan 400 100 2 260
7. Jiamutan 500 90 3 200 10
8. Naomunuer 380 80 3 180
9. (Da)Yonghong
10. Saiqing 360 80 2 100
11. Batejirigeli 650 70 350 12
12. Mengkeer 300 100 2 120 8
13. Bateer 500 80 2 450
14. Bayisihali 800 200 6 1 150
15. Weihong 350 200 11 4 110
16. Dongji 370 120 7 2 3 130 12
17. Yixi 450 200 2 130
18. Qiaoxin 420 100 1 1 40 50
19. Dong Bateer 500 100 3 250
20. Shengli 700 200 15 5
21. Baolide 600 100 10
22. Ba Yinji 360 110 3 400
23. Dong Qing 310 90 3 100 20
24. Cairenjide 600 100 150 8 5 500
25. Dai Deer 400 100 480
26. Da Bateer 500 100 2 10
27. Nao Jiamucuo 350 70
28. Qi Meige Land leased to others
29. Wulanbatu Land leased to others
30. Taohuajie Land leased to others
Total (27 HHs) 12,210 2,860 283 28 55 13 5,050 162
Average (head/HH) 452.2 105.9 10.5 1.0 2.0 0.5 187.0 6.0
HH = household, Kg = kilogram, Qty = quantity. Source: Household Survey conducted by PPTA consultants in April 2012.

Table A2.5: Educational Attainment (Currently in School) No. Age Primary School Junior middle school High school University
Girls
1 11 X
2 20 X
3 7 X
4 21 X
5 21 X
6 14 X
7 23 X
8 16 X
9 19 X
10 15 X
11 14 X
12 14 X
13 20 X
14 16 X
15 15 X
16 14 X
17 13 X
Subtotal 8 2 1 6
Boys
1 19 X
2 6 X
3 17 X
4 13 X
5 15 X
6 8 X
7 13 X
8 7 X
9 18 X
10 15 X
11 7 X
12 6 X
13 19 X
14 13 X
15 9 X
16 16 X
17 6 X
18 14 X
19 17 X
20 8 X
21 13 X
Subtotal 13 4 2 2
Total 21 6 3 8
Source: Household Survey conducted by PPTA consultants in April 2012. Among the 30 households surveyed, there were 17 females and 21 males between the age of 6 and 23.

Table A2.6: Production and Assets
Household Agri.
Vehicle Tractor Car MotorcycleColor
TV Cell
Phone Washing Machine Refrigerator Computer
1. (Na)Yonghong 1 2 1 3 1 1 1 2. Husihalituo 1 1 2 1 2 1 1 3. Qi Meige 1 4 1 1 4. Mengkebatu 1 1 1 1 4 1 1 1 5. Baoli 1 1 1 3 7 3 2 1 6. Batu 1 1 1 3 1 1 7. Ji Haishan 1 1 2 1 3 1 1 8. Jiamutan 1 1 2 1 5 1 1 9. Naomunuer 1 1 1 3 1 4 1 10. (Da)Yonghong 1 1 1 4 1 1 2 11. Saiqing 1 2 2 4 1 1 12. Taohuajie 1 1 1 2 1 1 13. Batejirigeli 1 2 1 3 1 1 1 14. Mengkeer 2 1 4 1 1 15. Bateer 1 1 1 5 1 1 16. Bayisihali 1 1 2 1 6 1 1 17. Weihong 1 2 1 4 2 2 1 18. Dongji 1 1 1 1 2 1 1 19. Yixi 1 1 3 4 6 4 4 1 20. Wulanbatu 1 3 1 1 21. Qiaoxin 1 1 2 1 5 1 1 22. Dong Bateer 1 2 2 4 1 1 1 23. Shengli 1 1 1 6 1 1 24. Baolide 1 1 1 3 1 1 1 25. Ba Yinji 1 1 1 4 1 1 1 26. Dong Qing 1 2 1 3 1 1 27. Cairenjide 1 1 2 1 1 28. Dai Deer 1 3 1 5 1 1 1 29. Da Bateer 1 2 1 7 1 1 30. Nao Jiamucuo 1 4 1 1 31. Ai Min Number of Households Possesses 3 14 19 27 30 30 30 29 11 Percentage of Possession (%) 10 47 63 90 100 100 100 97 37 Source: Household Survey conducted by PPTA consultants in April 2012.