Lake County TDP Preliminary Fixed-Route Ridership Forecasting · Lake County Transit Development...
29
FILENAME: C:\USERS\EHEINE\APPDATA\LOCAL\MICROSOFT\WINDOWS\TEMPORARY INTERNET FILES\CONTENT.OUTLOOK\TN1T99MT\TECH MEMO - FORECASTS - DRAFT - 061113.DOCX TECHNICAL MEMORANDUM Lake County Transit Development Plan Update ‒ Preliminary Fixed-Route Ridership Forecasting Date: June 11, 2013 Project #: 11073.0 To: Mike Woods, Lake-Sumter Metropolitan Planning Organization From: Kelly Blume, Kittelson & Associates, Inc. cc: Caroline Ferris, TranSystems OVERVIEW Preliminary fixed-route ridership forecasts for existing LakeXpress routes and potential new routes were developed using the sketch-level process described in this technical memorandum. The sketch- level process relies on elasticities, model-generated origin-destination (O-D) flows, existing and future population densities, and research that relates household densities to the amount of transit service that a given household density can support. Elasticities assess changes to existing routes. O-D flows and transit-supportive densities assess the need for new routes and identify the level of transit service to be offered by the new routes. Transit-supportive densities also link ridership to land use. The resulting forecasts relayed in this memorandum are considered to be preliminary because other project activities (e.g., public outreach) are anticipated to shape the identification of specific needs. BACKGROUND CONCEPTS Elasticity Elasticity is a concept originating in economics that relates a 1% change in a parameter such as transit travel time to a corresponding change in ridership. Elasticities for transit service coverage (expressed as bus miles) and bus frequency (expressed as buses per hour) were obtained from Exhibit 3-19 of TCRP Report 118. These elasticities are +0.8 and +0.4, respectively. TCRP Report 118 also provides the following formula for applying elasticities to produce estimates of ridership change: ( ) ( ) ( ) ( ) Where E = elasticity R 1 = base ridership R 2 = estimated future ridership X 1 = quantity of base attribute (travel time or frequency)
-
Upload
truongkien -
Category
Documents
-
view
214 -
download
0
Transcript of Lake County TDP Preliminary Fixed-Route Ridership Forecasting · Lake County Transit Development...

FILENAME: C:\USERS\EHEINE\APPDATA\LOCAL\MICROSOFT\WINDOWS\TEMPORARY INTERNET FILES\CONTENT.OUTLOOK\TN1T99MT\TECH MEMO - FORECASTS - DRAFT -
061113.DOCX
TECHNICAL MEMORANDUM Lake County Transit Development Plan Update ‒ Preliminary Fixed-Route Ridership Forecasting
Date: June 11, 2013 Project #: 11073.0
To: Mike Woods, Lake-Sumter Metropolitan Planning Organization
From: Kelly Blume, Kittelson & Associates, Inc.
cc: Caroline Ferris, TranSystems
OVERVIEW
Preliminary fixed-route ridership forecasts for existing LakeXpress routes and potential new routes
were developed using the sketch-level process described in this technical memorandum. The sketch-
level process relies on elasticities, model-generated origin-destination (O-D) flows, existing and future
population densities, and research that relates household densities to the amount of transit service
that a given household density can support. Elasticities assess changes to existing routes. O-D flows
and transit-supportive densities assess the need for new routes and identify the level of transit
service to be offered by the new routes. Transit-supportive densities also link ridership to land use.
The resulting forecasts relayed in this memorandum are considered to be preliminary because other
project activities (e.g., public outreach) are anticipated to shape the identification of specific needs.
BACKGROUND CONCEPTS
Elasticity
Elasticity is a concept originating in economics that relates a 1% change in a parameter such as transit
travel time to a corresponding change in ridership. Elasticities for transit service coverage (expressed
as bus miles) and bus frequency (expressed as buses per hour) were obtained from Exhibit 3-19 of
TCRP Report 118. These elasticities are +0.8 and +0.4, respectively. TCRP Report 118 also provides
the following formula for applying elasticities to produce estimates of ridership change:
( ) ( ) ( ) ( )
Where E = elasticity
R1 = base ridership
R2 = estimated future ridership
X1 = quantity of base attribute (travel time or frequency)

Lake County Transit Development Plan Update ‒ Preliminary Fixed-Route Ridership Forecasting Project #: 11073.0 June 11, 2013 Page 2
Kittelson & Associates, Inc. Orlando, Florida
X2 = quantity of future attribute (travel time or frequency)
Using this formula, it is possible to estimate the change in ridership that corresponds to a change in
bus miles (possibly resulting from extension of an existing route and/or an increase in service span) or
to a change in bus frequency.
Transit-Supportive Densities
Several sources of information exist that relate density (typically household or employment density)
to the level of transit service that it can support. The formative research on this subject is that of
Pushkarev and Zupan (1987). Table 1 summarizes their findings.
Table 1 Transit-Supportive Densities
Mode Service
Minimum Necessary Residential Density (Dwelling
Units per Net Acre)1 Remarks
Dial-a-bus2
Many origins to many destinations
6 Only if labor costs are not more than twice those of taxis.
Dial-a-bus2
Fixed destination or subscription service
3.5-5 Lower figure if labor costs are twice those of taxis; higher if thrice those of taxis.
Local bus
“Minimum” 1/2-mile route spacing 20 buses per day ~60-minute headways
4.5
Average. Varies as a function of downtown size and distance from residential areas to downtown.
“Intermediate” 1/2-mile route spacing 40 buses per day ~30-minute headways
7
“Frequent” 1/2-mile route spacing 120 buses per day ~10-minute headways
15
Express bus, accessed on foot
5 buses during 2-hour peak period
15 (average density over 2 square mile tributary area)
From 10-15 miles away to largest downtowns only.
Express bus, accessed by auto
5-10 buses during 2-hour peak period
3 (average density over 20 square mile tributary area)
From 10-20 miles away to downtowns larger than 20 million square feet of non-residential floor space.
Light rail3
5-minute headways or better during peak hour
9 (average density for a corridor of 25-100 square miles)
To downtowns of 20-50 million square feet of nonresidential floor space.
Rapid transit (heavy rail)
5-minute headways or better during peak hour
12 (average density for a corridor of 100-150 square miles)
To downtowns larger than 50 million square feet of nonresidential floor space.
Commuter rail 20 trains per day 1-2 Only to largest downtowns, if rail line exists.
1 Multiply by 0.67 for gross acres. SOURCE: Pushkarev and Zupan (1987)
2 Demand-responsive service available to the general public
3 Full-featured bus rapid transit (BRT) also

Lake County Transit Development Plan Update ‒ Preliminary Fixed-Route Ridership Forecasting Project #: 11073.0 June 11, 2013 Page 3
Kittelson & Associates, Inc. Orlando, Florida
APPROACH TO RIDERSHIP FORECASTING
Existing LakeXpress Routes
The steps used to develop preliminary 2023 ridership forecasts for the existing routes are as follows:
1. Obtain 2012 ridership data for the existing LakeXpress routes.
2. From the 2012 ridership data, determine average daily riders for each route.
3. Estimate ridership changes for each existing route using elasticities under three preliminary
scenarios:
a. 10% increase in bus miles
b. 20% increase in bus miles
c. 50% reduction in headway
4. Apply a growth factor to represent 2023 conditions.
Potential New Routes
The steps used to develop preliminary 2023 ridership forecasts for potential new routes are as
follows:
1. Obtain 2005 and 2035 O-D flows between population centers in Lake and Sumter Counties
and between Lake and Sumter Counties and adjacent counties from the Central Florida
Regional Planning Model (CFRPM). Interpolate to obtain 2012 and 2023 O-D flows.
2. Determine existing transit mode split in corridors that are currently served by transit.
a. Identify O-D flows in corridors that are currently served by transit.
b. Using 2012 ridership data, calculate the transit mode split for each of the corridors
currently served by transit.
3. Use data about transit-supportive future densities to identify the appropriate level of transit
service (if any) to be provided in corridors that currently served by fixed-route transit or are
not currently served by transit.
a. Consider densities within 1/4 mile of the potential transit route.
b. Consider that the pattern of transit-supportive densities may suggest express or
limited-stop bus service instead of local bus service.
4. Estimate potential 2023 daily ridership in the corridors identified in Step 3.
a. If an existing route could support increases in service based on level of transit-
supportive densities in the corridor, apply elasticities and a growth factor .
b. Identify O-D flows in corridors that are not currently served by transit.
c. Apply a transit mode split, calculated in Step 2, from a comparable corridor that is
currently served by transit.
d. Select the transit mode split that best represents the potential service in the new
corridors. For example, a new route that connects multiple cities might use the transit
mode split determined for Route 1 (i.e., 6%) while a new circulator might use 2 or 3%
(representative of Routes 2 and 3).

Lake County Transit Development Plan Update ‒ Preliminary Fixed-Route Ridership Forecasting Project #: 11073.0 June 11, 2013 Page 4
Kittelson & Associates, Inc. Orlando, Florida
e. Elasticities could be used to refine the results of this step. If the new route that
connects multiple cities operates at half-hour headways, for example, application of
the 6% mode split to the corridor may underestimate transit trip potential.
RESULTS
Elasticities and Existing Routes
Table 2 summarizes the results of applying elasticity factors to existing ridership under three
preliminary scenarios. Existing transit ridership data can be found in Attachment 1. The detailed
calculations for the application of the elasticity factors can be found in Attachment 2. The
calculations can be readily updated to reflect alternative improvement scenarios for the existing
transit routes, as alternatives are developed and refined to reflect input from other tasks.
Table 2 Changes in Average Daily Ridership Based on Elasticities
Route Existing August 2012
(Peak Month) 10% Increase in Revenue Miles
20% Increase in Revenue Miles
50% Reduction in Headway
1 696 751 805 910
2 249 269 288 326
3 171 184 198 223
4 310 334 358 405
Total 1,426 1,538 (+112) 1,649 (+223) 1,864 (+438)
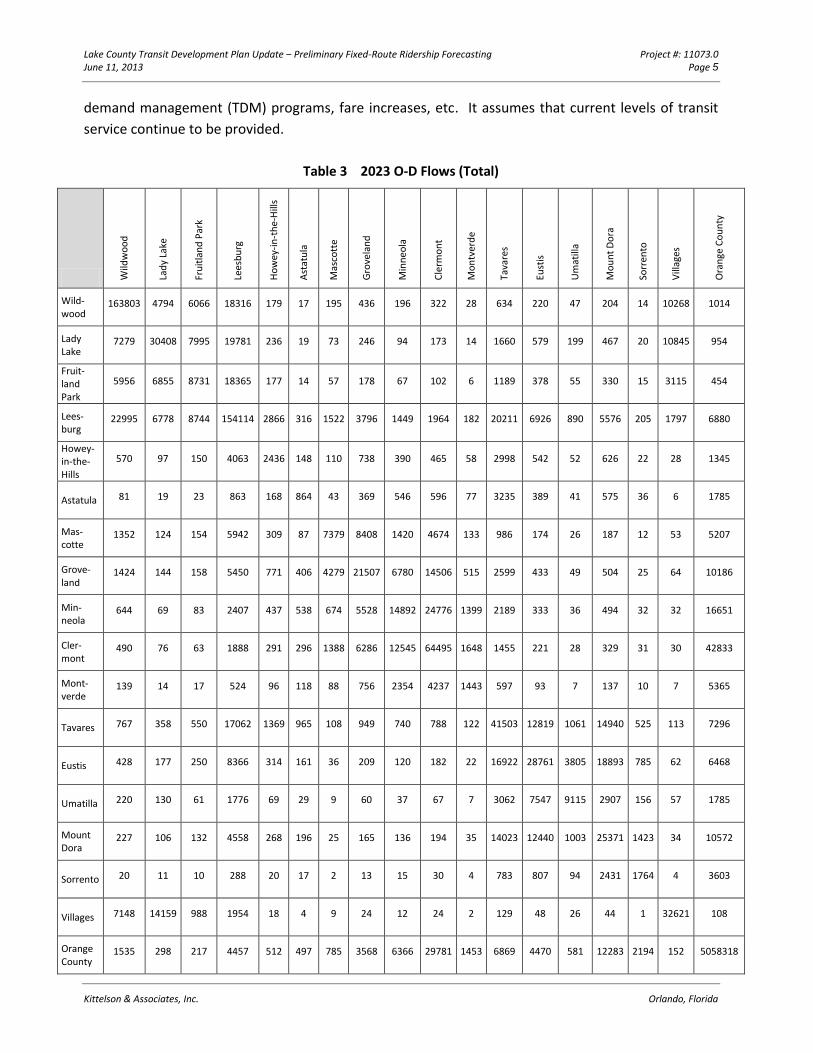
O-D Flows
Attachment 3 contains detailed O-D flow tables for 2005 and 2035. Table 3 below reports the total
2023 O-D flows. The 2023 O-D flows were interpolated from the 2005 and 2035 tables. Table 3
includes home-based work, home-based shopping, home-based social/recreational, home-based
other, and non-home-based trips.
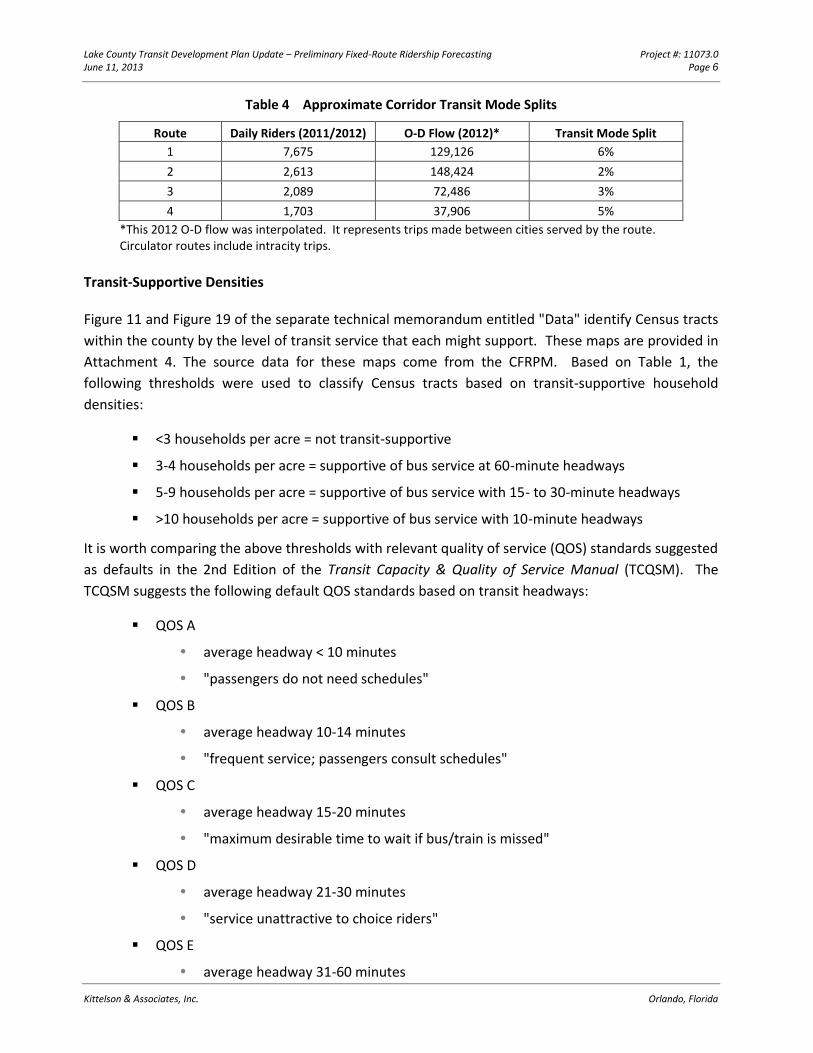
Table 4 shows approximate transit mode splits in corridors currently served by transit, which were
calculated by comparing 2011/2012 ridership data to O-D flows (interpolated from the 2005 and 2035
O-D data) in the same service areas. This is an approximation, but it provides a general idea of how
often transit is currently used with respect to total travel demand in a given service area. When these
mode splits are applied in comparable service areas, they provide estimates of ridership potential in
the new service areas.
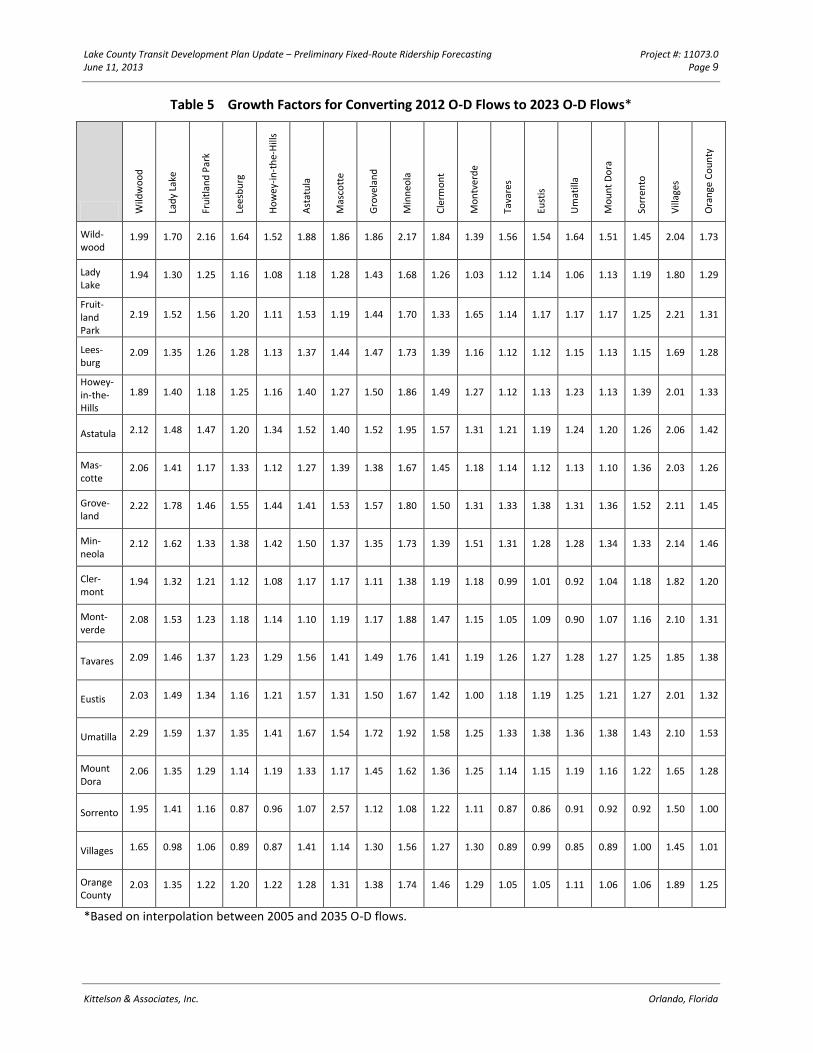
The transit mode splits also can be used to estimate ridership associated with a given O-D forecast
year. Table 5 shows growth factors for converting 2012 O-D flows to 2023 flows. Application of
growth factors in this manner assumes that transit ridership grows in proportion to total travel
demand. This assumption does not take into consideration factors such as increased congestion
(which may or may not provide an incentive for drivers to switch to transit), intensified transportation
Lake County Transit Development Plan Update ‒ Preliminary Fixed-Route Ridership Forecasting Project #: 11073.0 June 11, 2013 Page 5
Kittelson & Associates, Inc. Orlando, Florida
demand management (TDM) programs, fare increases, etc. It assumes that current levels of transit
service continue to be provided.
Table 3 2023 O-D Flows (Total)
Wild
wo
od
Lad
y La
ke
Fru
itla
nd
Par
k
Lees
bu
rg
Ho
wey
-in
-th
e-H
ills
Ast
atu
la
Mas
cott
e
Gro
vela
nd
Min
neo
la
Cle
rmo
nt
Mo
ntv
erd
e
Tava
res
Eust
is
Um
atill
a
Mo
un
t D
ora
Sorr
ento
Vill
ages
Ora
nge
Co
un
ty
Wild-wood
163803 4794 6066 18316 179 17 195 436 196 322 28 634 220 47 204 14 10268 1014
Lady Lake
7279 30408 7995 19781 236 19 73 246 94 173 14 1660 579 199 467 20 10845 954
Fruit-land Park
5956 6855 8731 18365 177 14 57 178 67 102 6 1189 378 55 330 15 3115 454
Lees-burg
22995 6778 8744 154114 2866 316 1522 3796 1449 1964 182 20211 6926 890 5576 205 1797 6880
Howey-in-the-Hills
570 97 150 4063 2436 148 110 738 390 465 58 2998 542 52 626 22 28 1345
Astatula 81 19 23 863 168 864 43 369 546 596 77 3235 389 41 575 36 6 1785
Mas-cotte
1352 124 154 5942 309 87 7379 8408 1420 4674 133 986 174 26 187 12 53 5207
Grove-land
1424 144 158 5450 771 406 4279 21507 6780 14506 515 2599 433 49 504 25 64 10186
Min-neola
644 69 83 2407 437 538 674 5528 14892 24776 1399 2189 333 36 494 32 32 16651
Cler-mont
490 76 63 1888 291 296 1388 6286 12545 64495 1648 1455 221 28 329 31 30 42833
Mont-verde
139 14 17 524 96 118 88 756 2354 4237 1443 597 93 7 137 10 7 5365
Tavares 767 358 550 17062 1369 965 108 949 740 788 122 41503 12819 1061 14940 525 113 7296
Eustis 428 177 250 8366 314 161 36 209 120 182 22 16922 28761 3805 18893 785 62 6468
Umatilla 220 130 61 1776 69 29 9 60 37 67 7 3062 7547 9115 2907 156 57 1785
Mount Dora
227 106 132 4558 268 196 25 165 136 194 35 14023 12440 1003 25371 1423 34 10572
Sorrento 20 11 10 288 20 17 2 13 15 30 4 783 807 94 2431 1764 4 3603
Villages 7148 14159 988 1954 18 4 9 24 12 24 2 129 48 26 44 1 32621 108
Orange County
1535 298 217 4457 512 497 785 3568 6366 29781 1453 6869 4470 581 12283 2194 152 5058318
Lake County Transit Development Plan Update ‒ Preliminary Fixed-Route Ridership Forecasting Project #: 11073.0 June 11, 2013 Page 6
Kittelson & Associates, Inc. Orlando, Florida
Table 4 Approximate Corridor Transit Mode Splits
Route Daily Riders (2011/2012) O-D Flow (2012)* Transit Mode Split
1 7,675 129,126 6%
2 2,613 148,424 2%
3 2,089 72,486 3%
4 1,703 37,906 5%
*This 2012 O-D flow was interpolated. It represents trips made between cities served by the route. Circulator routes include intracity trips.
Transit-Supportive Densities
Figure 11 and Figure 19 of the separate technical memorandum entitled "Data" identify Census tracts
within the county by the level of transit service that each might support. These maps are provided in
Attachment 4. The source data for these maps come from the CFRPM. Based on Table 1, the
following thresholds were used to classify Census tracts based on transit-supportive household
densities:
<3 households per acre = not transit-supportive
3-4 households per acre = supportive of bus service at 60-minute headways
5-9 households per acre = supportive of bus service with 15- to 30-minute headways
>10 households per acre = supportive of bus service with 10-minute headways
It is worth comparing the above thresholds with relevant quality of service (QOS) standards suggested
as defaults in the 2nd Edition of the Transit Capacity & Quality of Service Manual (TCQSM). The
TCQSM suggests the following default QOS standards based on transit headways:
QOS A
average headway < 10 minutes
"passengers do not need schedules"
QOS B
average headway 10-14 minutes
"frequent service; passengers consult schedules"
QOS C
average headway 15-20 minutes
"maximum desirable time to wait if bus/train is missed"
QOS D
average headway 21-30 minutes
"service unattractive to choice riders"
QOS E
average headway 31-60 minutes

Lake County Transit Development Plan Update ‒ Preliminary Fixed-Route Ridership Forecasting Project #: 11073.0 June 11, 2013 Page 7
Kittelson & Associates, Inc. Orlando, Florida
"service available during the hour"
QOS E
average headway > 60 minutes
"service unattractive to all riders"
The TCQSM suggestions indicate that transit service provided at headways of more than 60 minutes is
unattractive to all riders. On this basis, it is recommended that LakeXpress strive to provide hourly
service or better on all routes. To the extent that LakeXpress wishes to grow choice ridership, it
should strive to provide service at 20-minute headways or better.
Review of Figure 11 (which represents existing conditions) shows that most of the Census tracts in
Lake County are not currently transit-supportive based on the thresholds listed above. Pockets of
transit-supportive Census tracts exist in the central part of the county in parts of Eustis and Mount
Dora and west of Lake Eustis. A pocket of transit-supportive density also exists in Clermont. If a
transit agency were to use the locations of these pockets to design a brand new transit system for
Lake County, such a system might focus on the central county, with express or limited-stop transit
service connecting Clermont to other origins and destinations. The current LakeXpress routes and
LYNX's 204 Clermont Xpress embody this configuration. Figure 11 does not reveal household
densities that would support higher-frequency transit service than is currently provided, although
there may be value in extending LakeXpress service into Sumter County and in reducing headways on
Route 4 to 60 minutes. The components of such a system that are not currently in place are the
following:
Route 4 service at headways of no more than 60 minutes
Transit service into Sumter County
It is worth noting that Figure 13 in the "Data" memorandum reveals that the highest concentrations
of households that currently do not have automobile access are in central Lake County.
Review of Figure 19 (which represents 2035 conditions) shows new transit-supportive pockets in the
central county, new transit-supportive pockets in the Groveland and Leesburg areas, and pockets that
are dense enough to meet the threshold for 10-minute bus service. Transit-supportive pockets in the
Lake County portion of The Villages and at the intersection of the Turnpike and CR 470W also
manifest. A transit agency designing a brand new transit system for Lake County might continue to
focus on the central county, with service connecting The Villages to Mount Dora; a high level of
circulator service in the Eustis, Tavares, and Mount Dora area; a moderate level of circulator service in
the Leesburg and Fruitland Park area; and Express transit service extending west of Clermont to
Groveland. Service might also connect to origins and destinations Sumter County and Orange County.
Many of the components of such a service are already in place; the components that are not currently
in place are the following:
Service at headways shorter than 60 minutes in central Lake County

Lake County Transit Development Plan Update ‒ Preliminary Fixed-Route Ridership Forecasting Project #: 11073.0 June 11, 2013 Page 8
Kittelson & Associates, Inc. Orlando, Florida
Express transit service extended west from Clermont to Groveland (in partnership with LYNX)
Express or limited-stop transit service between Clermont, Groveland, and the cities in central Lake County
Transit service into Sumter County (in partnership with Sumter County local governments)
It is worth noting that Figure 21 in the "Data" memorandum reveals that the highest concentrations
of households that projected to not have automobile access are located in central Lake County.
Summary
Table 6 summarizes a preliminary plan for new and increased transit service in the county. The plan is
based on information uncovered by the analyses described earlier in this technical memorandum, and
it reflects 2023 conditions. The plan is aggressive: It puts service in place in 2023 based on 2035
household densities. The aggressiveness of the plan is supported by the fact that existing LakeXpress
service is provided at a higher level than 2005 household densities alone would suggest is warranted.
This may be a policy decision on the part of the County and/or it may reflect that other factors are
being considered (e.g., increased job access and provision of lifeline transit service to transit-
dependent populations).
Implementation of the new and increased transit services should be staged between today and 2023.
Prioritizing needs and developing an implementation plan is the product of a separate task. It is
recommended that the implementation plan include coordination with municipalities to facilitate and
promote access to transit via walking and bicycling.
Lake County Transit Development Plan Update ‒ Preliminary Fixed-Route Ridership Forecasting Project #: 11073.0 June 11, 2013 Page 9
Kittelson & Associates, Inc. Orlando, Florida
Table 5 Growth Factors for Converting 2012 O-D Flows to 2023 O-D Flows*
Wild
wo
od
Lad
y La
ke
Fru
itla
nd
Par
k
Lees
bu
rg
Ho
wey
-in
-th
e-H
ills
Ast
atu
la
Mas
cott
e
Gro
vela
nd
Min
neo
la
Cle
rmo
nt
Mo
ntv
erd
e
Tava
res
Eust
is
Um
atill
a
Mo
un
t D
ora
Sorr
ento
Vill
ages
Ora
nge
Co
un
ty
Wild-wood
1.99 1.70 2.16 1.64 1.52 1.88 1.86 1.86 2.17 1.84 1.39 1.56 1.54 1.64 1.51 1.45 2.04 1.73
Lady Lake
1.94 1.30 1.25 1.16 1.08 1.18 1.28 1.43 1.68 1.26 1.03 1.12 1.14 1.06 1.13 1.19 1.80 1.29
Fruit-land Park
2.19 1.52 1.56 1.20 1.11 1.53 1.19 1.44 1.70 1.33 1.65 1.14 1.17 1.17 1.17 1.25 2.21 1.31
Lees-burg
2.09 1.35 1.26 1.28 1.13 1.37 1.44 1.47 1.73 1.39 1.16 1.12 1.12 1.15 1.13 1.15 1.69 1.28
Howey-in-the-Hills
1.89 1.40 1.18 1.25 1.16 1.40 1.27 1.50 1.86 1.49 1.27 1.12 1.13 1.23 1.13 1.39 2.01 1.33
Astatula 2.12 1.48 1.47 1.20 1.34 1.52 1.40 1.52 1.95 1.57 1.31 1.21 1.19 1.24 1.20 1.26 2.06 1.42
Mas-cotte
2.06 1.41 1.17 1.33 1.12 1.27 1.39 1.38 1.67 1.45 1.18 1.14 1.12 1.13 1.10 1.36 2.03 1.26
Grove-land
2.22 1.78 1.46 1.55 1.44 1.41 1.53 1.57 1.80 1.50 1.31 1.33 1.38 1.31 1.36 1.52 2.11 1.45
Min-neola
2.12 1.62 1.33 1.38 1.42 1.50 1.37 1.35 1.73 1.39 1.51 1.31 1.28 1.28 1.34 1.33 2.14 1.46
Cler-mont
1.94 1.32 1.21 1.12 1.08 1.17 1.17 1.11 1.38 1.19 1.18 0.99 1.01 0.92 1.04 1.18 1.82 1.20
Mont-verde
2.08 1.53 1.23 1.18 1.14 1.10 1.19 1.17 1.88 1.47 1.15 1.05 1.09 0.90 1.07 1.16 2.10 1.31
Tavares 2.09 1.46 1.37 1.23 1.29 1.56 1.41 1.49 1.76 1.41 1.19 1.26 1.27 1.28 1.27 1.25 1.85 1.38
Eustis 2.03 1.49 1.34 1.16 1.21 1.57 1.31 1.50 1.67 1.42 1.00 1.18 1.19 1.25 1.21 1.27 2.01 1.32
Umatilla 2.29 1.59 1.37 1.35 1.41 1.67 1.54 1.72 1.92 1.58 1.25 1.33 1.38 1.36 1.38 1.43 2.10 1.53
Mount Dora
2.06 1.35 1.29 1.14 1.19 1.33 1.17 1.45 1.62 1.36 1.25 1.14 1.15 1.19 1.16 1.22 1.65 1.28
Sorrento 1.95 1.41 1.16 0.87 0.96 1.07 2.57 1.12 1.08 1.22 1.11 0.87 0.86 0.91 0.92 0.92 1.50 1.00
Villages 1.65 0.98 1.06 0.89 0.87 1.41 1.14 1.30 1.56 1.27 1.30 0.89 0.99 0.85 0.89 1.00 1.45 1.01
Orange County
2.03 1.35 1.22 1.20 1.22 1.28 1.31 1.38 1.74 1.46 1.29 1.05 1.05 1.11 1.06 1.06 1.89 1.25
*Based on interpolation between 2005 and 2035 O-D flows.

Lake County Transit Development Plan Update ‒ Preliminary Fixed-Route Ridership Forecasting Project #: 11073.0 June 11, 2013 Page 10
Kittelson & Associates, Inc. Orlando, Florida
Table 6 Preliminary 2023 Service Plan for New and Increased Transit Service in Lake County
Route Description of 2023
Service Assumptions and Estimation Process
2023 Daily Ridership Forecast
1 (existing)
Maintain 2012 headway and service span.
Subject to efficiency and effectiveness analysis conducted under a separate task. If route is continued in its current form, apply Table 5 growth factor (averaged
for the route's service area) to existing ridership.
7,675 x growth factor of 1.25 = 9,600 (rounded)
2 (existing)
Maintain 2012 headway and service span.
Subject to efficiency and effectiveness analysis conducted under a separate task. If route is continued in its current form, apply Table 5 growth factor (averaged
for the route's service area) to existing ridership.
2,613 x growth factor of 1.33 = 3,500 (rounded)
3 (existing)
Maintain 2012 headway and service span.
Subject to efficiency and effectiveness analysis conducted under a separate task. If route is continued in its current form, apply Table 5 growth factor (averaged
for the route's service area) to existing ridership.
2,089 x growth factor of 1.18 = 2,500 (rounded)
4 (existing)
Maintain 2012 headway and service span.
Subject to efficiency and effectiveness analysis conducted under a separate task. If route is continued in its current form, apply Table 5 growth factor (averaged
for the route's service area) to existing ridership.
1,703 x growth factor of 1.26 = 2,100 (rounded)
1 (enhanced)
Increase amount of service currently provided (e.g.,
reduce headways and/or increase service span).
Long-term potential indicated by transit-supportive densities analysis. Apply elasticities to estimate ridership
increase associated with a specific change in headway. Assume 50% reduction in headways initially. Increase
ridership per Table 2. Then apply Table 5 growth factor (averaged for the route's service area) to the increase.
7,675 + 910 = 8,585 (Year 2012)
8,585 x growth factor of 1.25 =
10,700 (Year 2023 rounded)
2 (enhanced)
Increase amount of service currently provided (e.g.,
reduce headways and/or increase service span).
Long-term potential indicated by transit-supportive densities analysis. Apply elasticities to estimate ridership
increase associated with a specific change in headway. Assume 50% reduction in headways initially. Increase
ridership per Table 2. Then apply Table 5 growth factor (averaged for the route's service area) to the increase.
2,613 + 326 = 2,939 (Year 2012)
2,939 x growth factor of 1.33 =
3,900 (Year 2023 rounded)
3 (enhanced)
Increase amount of service currently provided (e.g.,
reduce headways and/or increase service span).
Long-term potential indicated by transit-supportive densities analysis. Apply elasticities to estimate ridership
increase associated with a specific change in headway. Assume 50% reduction in headways initially. Increase
ridership per Table 2. Then apply Table 5 growth factor (averaged for the route's service area) to the increase.
2,089 + 223 = 2,312 (Year 2012)
2,312 x growth factor of 1.18 = 2,700 (Year 23
rounded)
4 (enhanced)
Increase amount of service currently provided (e.g.,
reduce headways and/or increase service span).
Desirable to provide headways of 60 minutes or better as a QOS policy. Apply elasticities to estimate ridership increase associated with a specific change in headway. Assume 50% reduction in headways initially. Increase
ridership per Table 2. Then apply Table 5 growth factor (averaged for the route's service area) to the increase.
1,703 + 405 = 2,108 (Year 2012)
2,108 x growth factor of 1.26 =
2,700 (Year 2023 rounded)
5 (new)
Provide limited-stop service at 60-minute headways between central Lake County,
Clermont, and
Potential indicated by transit-supportive densities analysis. Apply 5% mode split (modeled after existing Route 4) to 2023 O-D flow in corridor (i.e., Groveland-
Clermont-Tavares). As existing Route 4 mode split is not reflective of level of transit service to be established in
26,584 x 5% = 1,329 (Year 2023
base)
1,329 + 409 =

Lake County Transit Development Plan Update ‒ Preliminary Fixed-Route Ridership Forecasting Project #: 11073.0 June 11, 2013 Page 11
Kittelson & Associates, Inc. Orlando, Florida
Groveland. corridor (i.e., 60-minute headways), apply elasticities to account for the headway reduction.
1,700 (enhanced, rounded)
6 (new)
In partnership with Sumter County local
governments, provide limited-stop service at 60-minute headways between central Lake County,
The Villages, and Wildwood
Potential indicated by transit-supportive densities analysis. Apply 5% mode split (modeled after existing
Route 4) to 2023 O-D flow in corridor (i.e., Leesburg-The Villages-Wildwood). As existing Route 4 mode split is not
reflective of level of transit service to be established in corridor (i.e., 60-minute headways), apply elasticities to
account for the headway reduction.
62,478 x 5% = 3,124 (Year 2023
base)
3,124 + 961 = 4,085 (enhanced,
rounded)
7 (new)
In partnership with LYNX, extend
commuter bus service west of
Clermont to Groveland
Extension of LYNX 204 Clermont Xpress. To be determined
The information in Table 6 suggests the following:
Headway improvements may offer more return on investment for Route 4 than the other existing routes.
A service that crosses the Lake/Sumter County line has the potential to transport a daily ridership volume more than that currently transported by Route 2. Services that cross county lines create opportunities for partnerships to offset the costs of improved regional transit connectivity.
A staged approach to implementing transit service improvements is feasible. Routes can be established primarily to create connections, and the QOS for each route can be improved as justified over time.
NEXT STEPS
Ridership forecasts can be used to develop revenue forecasts and assess the need for additional
person capacity (in the form of more buses and/or larger buses) in a given corridor. Revenue
forecasts and person capacity improvements feed into cost estimation, which is the topic of a
subsequent task.

ATTACHMENT 1: RIDERSHIP DATA

LakeXpress Route 1 Oct 2011 Nov 2011 Dec 2011 Jan 2012 Feb 2012 Mar 2012 Apr 2012 May 2012 June 2012 July 2012 Aug 2012 Sep 2012
Actual Unlinked Trips 12,683 13,334 13,321 12,773 12,823 14,444 13,458 13,670 12,837 13,899 16,010 12,621
Revenue Hours 1,124 1,124 1,124 1,070 1,124 1,177 1,124 1,177 1,124 1,124 1,231 1,017
Vehicle Hours 1,152 1,152 1,152 1,097 1,152 1,207 1,152 1,207 1,152 1,152 1,262 1,042
Revenue Miles 19,694 19,694 19,694 18,756 19,694 20,632 19,694 20,632 19,694 19,694 21,569 17,818
Vehicle Miles 19,963 19,963 19,963 19,012 19,963 20,913 19,963 20,913 19,963 19,963 21,864 18,061
Days this month 21 21 21 20 21 22 21 22 21 21 23 19
LakeXpress Route 1 Oct 2011 Nov 2011 Dec 2011 Jan 2012 Feb 2012 Mar 2012 Apr 2012 May 2012 June 2012 July 2012 Aug 2012 Sep 2012
Actual trips Per Rev Hour 11 12 12 12 11 12 12 12 11 12 13 12
Actual trips Per Veh Hour 11 12 12 12 11 12 12 11 11 12 13 12
Actual trips Per Rev Mile 1 1 1 1 1 1 1 1 1 1 1 1
Actual trips Per Veh Mile 1 1 1 1 1 1 1 1 1 1 1 1
Actual trips Per Day 604 635 634 639 611 657 641 621 611 662 696 664
LakeXpress Route 2 Oct 2011 Nov 2011 Dec 2011 Jan 2012 Feb 2012 Mar 2012 Apr 2012 May 2012 June 2012 July 2012 Aug 2012 Sep 2012
Actual Unlinked Trips 4,448 4,598 4,400 4,329 4,409 4,903 4,658 4,416 4,133 4,572 5,735 4,509
Revenue Hours 273 273 273 260 273 286 273 286 273 273 299 247
Vehicle Hours 280 280 280 267 280 293 280 293 280 280 307 253
Revenue Miles 4,150 4,150 4,150 3,952 4,150 4,347 4,150 4,347 4,150 4,150 4,545 3,754
Vehicle Miles 4,217 4,217 4,217 4,016 4,217 4,418 4,217 4,418 4,217 4,217 4,618 3,815
Days this month 21 21 21 20 21 22 21 22 21 21 23 19
LakeXpress Route 2 Oct 2011 Nov 2011 Dec 2011 Jan 2012 Feb 2012 Mar 2012 Apr 2012 May 2012 June 2012 July 2012 Aug 2012 Sep 2012
Actual trips Per Rev Hour 16 17 16 17 16 17 17 15 15 17 19 18
Actual trips Per Veh Hour 16 16 16 16 16 17 17 15 15 16 19 18
Actual trips Per Rev Mile 1 1 1 1 1 1 1 1 1 1 1 1
Actual trips Per Veh Mile 1 1 1 1 1 1 1 1 1 1 1 1
Actual trips Per Day 212 219 210 216 210 223 222 201 197 218 249 237
LakeXpress Route 3 Oct 2011 Nov 2011 Dec 2011 Jan 2012 Feb 2012 Mar 2012 Apr 2012 May 2012 June 2012 July 2012 Aug 2012 Sep 2012
Actual Unlinked Trips 3,733 3,935 3,723 3,509 3,310 3,893 3,577 3,754 3,475 3,724 4,185 3,243
Revenue Hours 273 273 273 260 273 286 273 286 273 273 299 247
Vehicle Hours 305 305 305 290 305 319 305 319 305 305 334 276
Revenue Miles 4,423 4,423 4,423 4,212 4,423 4,633 4,423 4,633 4,423 4,423 4,844 4,001
Vehicle Miles 5,582 5,582 5,582 5,316 5,582 5,848 5,582 5,848 5,582 5,582 6,113 5,050
Days this month 21 21 21 20 21 22 21 22 21 21 23 19
LakeXpress Route 3 Oct 2011 Nov 2011 Dec 2011 Jan 2012 Feb 2012 Mar 2012 Apr 2012 May 2012 June 2012 July 2012 Aug 2012 Sep 2012
Actual trips Per Rev Hour 14 14 14 13 12 14 13 13 13 14 14 13
Actual trips Per Veh Hour 12 13 12 12 11 12 12 12 11 12 13 12
Actual trips Per Rev Mile 1 1 1 1 1 1 1 1 1 1 1 1
Actual trips Per Veh Mile 1 1 1 1 1 1 1 1 1 1 1 1
Actual trips Per Day 178 187 177 175 158 177 170 171 165 177 182 171
LakeXpress Route 4 Oct 2011 Nov 2011 Dec 2011 Jan 2012 Feb 2012 Mar 2012 Apr 2012 May 2012 June 2012 July 2012 Aug 2012 Sep 2012
Actual Unlinked Trips 3,076 3,043 3,063 2,856 2,928 3,197 2,827 3,126 2,846 3,168 3,312 2,483
Revenue Hours 252 252 252 240 252 264 252 264 252 252 276 228
Vehicle Hours 283 283 283 269 283 296 283 296 283 283 310 256
Revenue Miles 5,947 5,947 5,947 5,664 5,947 6,230 5,947 6,230 5,947 5,947 6,514 5,381
Vehicle Miles 7,018 7,018 7,018 6,684 7,018 7,352 7,018 7,352 7,018 7,018 7,687 6,350
Days this month 21 21 21 20 21 22 21 22 21 21 23 19
LakeXpress Route 4 Oct 2011 Nov 2011 Dec 2011 Jan 2012 Feb 2012 Mar 2012 Apr 2012 May 2012 June 2012 July 2012 Aug 2012 Sep 2012
Actual trips Per Rev Hour 12 12 12 12 12 12 11 12 11 13 12 11
Actual trips Per Veh Hour 11 11 11 11 10 11 10 11 10 11 11 10
Actual trips Per Rev Mile 1 1 1 1 0 1 0 1 0 1 1 0
Actual trips Per Veh Mile 0 0 0 0 0 0 0 0 0 0 0 0
Actual trips Per Day 146 145 146 143 139 145 135 142 136 151 144 131

ATTACHMENT 2: ELASTICITY CALCULATION SPREADSHEET

Chan
ges
in A
vera
ge D
aily
Rid
ersh
ipSc
enar
io:
10%
incr
ease
in re
venu
e m
iles
Scen
ario
:fr
eque
ncy
(bus
es p
er h
our)
dou
bled
Att
ribu
te
Tim
e of
Yea
r
Oct 2011
Nov 2011
Dec 2011
Jan 2012
Feb 2012
Mar 2012
Apr 2012
May 2012
June 2012
July 2012
Aug 2012
Sep 2012
Max
Oct 2011
Nov 2011
Dec 2011
Jan 2012
Feb 2012
Mar 2012
Apr 2012
May 2012
June 2012
July 2012
Aug 2012
Sep 2012
Max
Oct 2011
Nov 2011
Dec 2011
Jan 2012
Feb 2012
Mar 2012
Apr 2012
May 2012
June 2012
July 2012
Aug 2012
Sep 2012
Max
EEl
asti
city
0.0
0.8
0.8
0.8
0.8
0.8
0.8
0.8
0.8
0.8
0.8
0.8
0.8
0.8
0.4
0.4
0.4
0.4
0.4
0.4
0.4
0.4
0.4
0.4
0.4
0.4
0.4
X1Q
uant
ity
of B
ase
Att
ribu
te0
938
938
938
938
938
938
938
938
938
938
938
938
938
11
11
11
11
11
11
1
X2Q
uant
ity
of F
utur
e A
ttri
bute
010
3210
3210
3210
3210
3210
3210
3210
3210
3210
3210
3210
3210
322
22
22
22
22
22
22
R1Ba
se R
ider
ship
604
635
634
639
611
657
641
621
611
662
696
664
696
604
635
634
639
611
657
641
621
611
662
696
664
696
604
635
634
639
611
657
641
621
611
662
696
664
696
R2Es
tim
ated
Fut
ure
Ride
rshi
p83
888
188
088
684
791
188
986
284
891
896
592
196
565
268
568
568
965
970
969
267
166
071
475
171
775
179
083
083
083
579
985
983
881
379
986
691
086
991
0
∆Ch
ange
in R
ider
ship
234
246
245
247
236
254
248
240
237
256
269
257
269
4850
5051
4852
5149
4852
5553
5518
619
519
519
718
820
219
719
118
820
421
420
421
4
Att
ribu
te
Tim
e of
Yea
r
Oct 2011
Nov 2011
Dec 2011
Jan 2012
Feb 2012
Mar 2012
Apr 2012
May 2012
June 2012
July 2012
Aug 2012
Sep 2012
Max
Oct 2011
Nov 2011
Dec 2011
Jan 2012
Feb 2012
Mar 2012
Apr 2012
May 2012
June 2012
July 2012
Aug 2012
Sep 2012
Max
Oct 2011
Nov 2011
Dec 2011
Jan 2012
Feb 2012
Mar 2012
Apr 2012
May 2012
June 2012
July 2012
Aug 2012
Sep 2012
Max
EEl
asti
city
0.0
0.8
0.8
0.8
0.8
0.8
0.8
0.8
0.8
0.8
0.8
0.8
0.8
0.8
0.4
0.4
0.4
0.4
0.4
0.4
0.4
0.4
0.4
0.4
0.4
0.4
0.4
X1Q
uant
ity
of B
ase
Att
ribu
te0
198
198
198
198
198
198
198
198
198
198
198
198
198
11
11
11
11
11
11
1
X2Q
uant
ity
of F
utur
e A
ttri
bute
021
721
721
721
721
721
721
721
721
721
721
721
721
72
22
22
22
22
22
22
R1Ba
se R
ider
ship
212
219
210
216
210
223
222
201
197
218
249
237
249
212
219
210
216
210
223
222
201
197
218
249
237
249
212
219
210
216
210
223
222
201
197
218
249
237
249
R2Es
tim
ated
Fut
ure
Ride
rshi
p29
430
429
130
029
130
930
827
827
330
234
632
934
622
923
622
623
422
724
123
921
721
223
526
925
626
927
728
627
428
327
529
129
026
225
728
532
631
032
6
∆Ch
ange
in R
ider
ship
81.9
84.7
81.1
83.7
81.2
86.2
85.8
77.7
76.1
84.2
96.5
91.8
96.5
1717
1717
1718
1816
1617
2019
2065
6764
6765
6968
6261
6777
7377
Att
ribu
te
Tim
e of
Yea
r
Oct 2011
Nov 2011
Dec 2011
Jan 2012
Feb 2012
Mar 2012
Apr 2012
May 2012
June 2012
July 2012
Aug 2012
Sep 2012
Max
Oct 2011
Nov 2011
Dec 2011
Jan 2012
Feb 2012
Mar 2012
Apr 2012
May 2012
June 2012
July 2012
Aug 2012
Sep 2012
Max
Oct 2011
Nov 2011
Dec 2011
Jan 2012
Feb 2012
Mar 2012
Apr 2012
May 2012
June 2012
July 2012
Aug 2012
Sep 2012
Max
EEl
asti
city
0.0
0.8
0.8
0.8
0.8
0.8
0.8
0.8
0.8
0.8
0.8
0.8
0.8
0.8
0.4
0.4
0.4
0.4
0.4
0.4
0.4
0.4
0.4
0.4
0.4
0.4
0.4
X1Q
uant
ity
of B
ase
Att
ribu
te0
211
211
211
211
211
211
211
211
211
211
211
211
211
11
11
11
11
11
11
1
X2Q
uant
ity
of F
utur
e A
ttri
bute
023
223
223
223
223
223
223
223
223
223
223
223
223
22
22
22
22
22
22
22
R1Ba
se R
ider
ship
143
132
113
118
116
117
125
111
133
144
171
160
171
143
132
113
118
116
117
125
111
133
144
171
160
171
143
132
113
118
116
117
125
111
133
144
171
160
171
R2Es
tim
ated
Fut
ure
Ride
rshi
p19
918
315
716
416
116
217
315
418
520
023
722
223
715
514
312
212
712
512
613
512
014
415
618
417
318
418
717
314
815
415
215
316
414
517
418
922
321
022
3
∆Ch
ange
in R
ider
ship
55.4
51.1
43.7
45.7
44.8
45.2
48.4
42.8
51.5
55.8
66.1
62.1
66.1
1110
99
99
109
1111
1413
1444
4135
3636
3638
3441
4453
4953
Att
ribu
te
Tim
e of
Yea
r
Oct 2011
Nov 2011
Dec 2011
Jan 2012
Feb 2012
Mar 2012
Apr 2012
May 2012
June 2012
July 2012
Aug 2012
Sep 2012
Max
Oct 2011
Nov 2011
Dec 2011
Jan 2012
Feb 2012
Mar 2012
Apr 2012
May 2012
June 2012
July 2012
Aug 2012
Sep 2012
Max
Oct 2011
Nov 2011
Dec 2011
Jan 2012
Feb 2012
Mar 2012
Apr 2012
May 2012
June 2012
July 2012
Aug 2012
Sep 2012
Max
EEl
asti
city
0.0
0.8
0.8
0.8
0.8
0.8
0.8
0.8
0.8
0.8
0.8
0.8
0.8
0.8
0.4
0.4
0.4
0.4
0.4
0.4
0.4
0.4
0.4
0.4
0.4
0.4
0.4
X1Q
uant
ity
of B
ase
Att
ribu
te0
283
283
283
283
283
283
283
283
283
283
283
283
283
0.5
0.5
0.5
0.5
0.5
0.5
0.5
0.5
0.5
0.5
0.5
0.5
0.5
X2Q
uant
ity
of F
utur
e A
ttri
bute
031
231
231
231
231
231
231
231
231
231
231
231
231
21
11
11
11
11
11
11
R1Ba
se R
ider
ship
283
283
283
269
283
296
283
296
283
283
310
256
310
283
283
283
269
283
296
283
296
283
283
310
256
310
283
283
283
269
283
296
283
296
283
283
310
256
310
R2Es
tim
ated
Fut
ure
Ride
rshi
p39
239
239
237
439
241
139
241
139
239
243
035
543
030
530
530
529
130
532
030
532
030
530
533
427
633
437
037
037
035
237
038
737
038
737
037
040
533
540
5
∆Ch
ange
in R
ider
ship
109
109
109
104
109
115
109
115
109
109
120
9912
022
2222
2122
2322
2322
2225
2025
8787
8783
8791
8791
8787
9579
95
Rout
e 1
Rout
e 2
Rout
e 3
Rout
e 4
TOTA
LIn
crea
se d
ue to
ser
vice
exp
ansi
onIn
crea
se d
ue to
dec
reas
ed h
eadw
ay
TOTA
LIn
crea
se d
ue to
ser
vice
exp
ansi
onIn
crea
se d
ue to
dec
reas
ed h
eadw
ay
TOTA
LIn
crea
se d
ue to
ser
vice
exp
ansi
onIn
crea
se d
ue to
dec
reas
ed h
eadw
ay
TOTA
LIn
crea
se d
ue to
ser
vice
exp
ansi
onIn
crea
se d
ue to
dec
reas
ed h
eadw
ay

ATTACHMENT 3: O-D FLOW TABLES
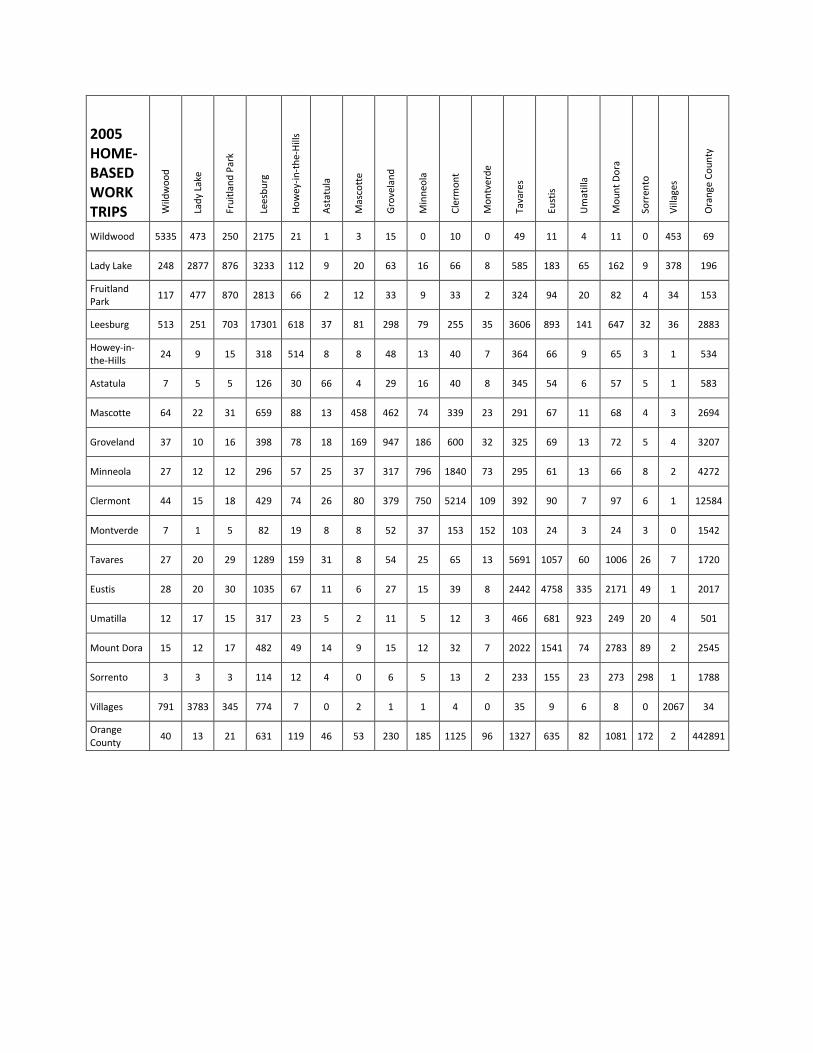
2005 HOME-BASED WORK TRIPS W
ildw
oo
d
Lad
y La
ke
Fru
itla
nd
Par
k
Lees
bu
rg
Ho
wey
-in
-th
e-H
ills
Ast
atu
la
Mas
cott
e
Gro
vela
nd
Min
neo
la
Cle
rmo
nt
Mo
ntv
erd
e
Tava
res
Eust
is
Um
atill
a
Mo
un
t D
ora
Sorr
ento
Vill
ages
Ora
nge
Co
un
ty
Wildwood 5335 473 250 2175 21 1 3 15 0 10 0 49 11 4 11 0 453 69
Lady Lake 248 2877 876 3233 112 9 20 63 16 66 8 585 183 65 162 9 378 196
Fruitland Park
117 477 870 2813 66 2 12 33 9 33 2 324 94 20 82 4 34 153
Leesburg 513 251 703 17301 618 37 81 298 79 255 35 3606 893 141 647 32 36 2883
Howey-in-the-Hills
24 9 15 318 514 8 8 48 13 40 7 364 66 9 65 3 1 534
Astatula 7 5 5 126 30 66 4 29 16 40 8 345 54 6 57 5 1 583
Mascotte 64 22 31 659 88 13 458 462 74 339 23 291 67 11 68 4 3 2694
Groveland 37 10 16 398 78 18 169 947 186 600 32 325 69 13 72 5 4 3207
Minneola 27 12 12 296 57 25 37 317 796 1840 73 295 61 13 66 8 2 4272
Clermont 44 15 18 429 74 26 80 379 750 5214 109 392 90 7 97 6 1 12584
Montverde 7 1 5 82 19 8 8 52 37 153 152 103 24 3 24 3 0 1542
Tavares 27 20 29 1289 159 31 8 54 25 65 13 5691 1057 60 1006 26 7 1720
Eustis 28 20 30 1035 67 11 6 27 15 39 8 2442 4758 335 2171 49 1 2017
Umatilla 12 17 15 317 23 5 2 11 5 12 3 466 681 923 249 20 4 501
Mount Dora 15 12 17 482 49 14 9 15 12 32 7 2022 1541 74 2783 89 2 2545
Sorrento 3 3 3 114 12 4 0 6 5 13 2 233 155 23 273 298 1 1788
Villages 791 3783 345 774 7 0 2 1 1 4 0 35 9 6 8 0 2067 34
Orange County
40 13 21 631 119 46 53 230 185 1125 96 1327 635 82 1081 172 2 442891

2005 HOME-BASED SHOP-PING TRIPS W
ildw
oo
d
Lad
y La
ke
Fru
itla
nd
Par
k
Lees
bu
rg
Ho
wey
-in
-th
e-H
ills
Ast
atu
la
Mas
cott
e
Gro
vela
nd
Min
neo
la
Cle
rmo
nt
Mo
ntv
erd
e
Tava
res
Eust
is
Um
atill
a
Mo
un
t D
ora
Sorr
ento
Vill
ages
Ora
nge
Co
un
ty
Wildwood 5037 291 88 604 1 0 1 4 2 3 1 26 15 0 19 3 526 34
Lady Lake 131 4468 1313 2617 2 1 0 4 0 3 0 41 20 4 23 1 381 106
Fruitland Park
78 643 950 2265 1 0 1 1 0 2 0 52 15 1 20 0 32 25
Leesburg 209 343 1399 18880 113 16 56 297 33 63 2 1682 832 48 780 11 10 162
Howey-in-the-Hills
3 4 22 598 196 27 4 62 11 19 2 537 87 0 133 1 0 38
Astatula 1 1 0 144 7 129 1 21 16 24 2 509 53 1 110 4 0 38
Mascotte 8 4 19 664 12 16 912 1098 94 475 5 46 13 3 21 1 1 156
Groveland 1 2 7 241 30 73 317 1870 378 1533 24 210 22 1 37 0 0 176
Minneola 0 1 4 94 18 85 34 655 1041 3353 64 192 14 0 24 2 1 472
Clermont 2 3 2 71 6 48 82 754 1259 10793 147 90 12 4 26 2 0 2557
Montverde 1 2 1 31 6 42 4 133 136 559 209 84 4 2 11 0 0 281
Tavares 1 3 21 2241 30 73 0 15 5 3 0 3800 1366 30 2246 28 0 95
Eustis 1 1 10 988 3 2 0 0 1 0 0 1952 3811 277 3226 69 0 73
Umatilla 0 1 0 74 0 0 0 1 0 1 0 304 970 782 398 7 0 36
Mount Dora 1 0 3 471 2 13 0 1 0 0 0 1471 1570 43 4478 146 0 172
Sorrento 0 0 0 25 1 2 0 0 1 0 0 117 205 4 756 547 0 169
Villages 188 3578 65 126 0 0 1 0 0 2 0 12 5 3 11 0 3214 17
Orange County
29 33 28 467 3 61 29 117 102 988 35 694 511 44 2065 281 5 450633

2005 HOME-BASED SOCIAL/REC. TRIPS W
ildw
oo
d
Lad
y La
ke
Fru
itla
nd
Par
k
Lees
bu
rg
Ho
wey
-in
-th
e-H
ills
Ast
atu
la
Mas
cott
e
Gro
vela
nd
Min
neo
la
Cle
rmo
nt
Mo
ntv
erd
e
Tava
res
Eust
is
Um
atill
a
Mo
un
t D
ora
Sorr
ento
Vill
ages
Ora
nge
Co
un
ty
Wildwood 4107 284 121 1062 13 0 6 9 0 2 1 50 12 2 16 1 295 6
Lady Lake 253 3814 1031 1964 11 0 2 3 0 2 0 64 25 9 23 0 832 38
Fruitland Park
125 653 605 2297 12 0 0 4 0 0 0 71 14 1 14 1 90 9
Leesburg 733 371 802 16662 449 16 109 114 20 29 8 2601 800 47 459 10 40 91
Howey-in-the-Hills
26 6 14 463 539 14 8 37 8 10 4 526 54 5 59 1 0 27
Astatula 1 1 0 85 20 99 1 20 13 13 9 580 45 3 66 3 0 45
Mascotte 48 13 18 828 59 9 1063 735 59 243 13 97 19 3 21 1 3 106
Groveland 37 7 14 478 114 57 442 1556 366 1030 71 304 33 5 41 2 0 202
Minneola 22 3 11 261 59 78 74 705 998 2317 197 261 34 3 47 2 0 601
Clermont 26 7 7 281 55 51 149 857 1505 8301 310 241 34 4 58 5 0 2824
Montverde 6 0 1 73 21 24 11 100 135 330 326 98 12 1 22 2 1 273
Tavares 12 9 18 1454 132 70 1 14 4 6 3 4823 1273 41 1377 31 2 128
Eustis 4 11 9 945 14 5 0 4 0 0 1 2240 3549 374 2173 89 2 128
Umatilla 1 5 7 100 2 1 0 0 0 2 1 237 802 960 212 6 1 28
Mount Dora 3 6 5 400 17 10 0 6 1 0 0 2055 1687 63 3249 223 1 322
Sorrento 1 0 0 32 1 0 0 2 0 1 0 151 194 7 634 595 0 339
Villages 525 1877 192 521 5 2 0 2 0 0 1 39 9 5 8 0 2971 1
Orange County
34 17 11 374 55 55 47 195 254 1647 125 902 571 38 1589 402 5 333912

2005 HOME-BASED OTHER TRIPS W
ildw
oo
d
Lad
y La
ke
Fru
itla
nd
Par
k
Lees
bu
rg
Ho
wey
-in
-th
e-H
ills
Ast
atu
la
Mas
cott
e
Gro
vela
nd
Min
neo
la
Cle
rmo
nt
Mo
ntv
erd
e
Tava
res
Eust
is
Um
atill
a
Mo
un
t D
ora
Sorr
ento
Vill
ages
Ora
nge
Co
un
ty
Wildwood 8948 135 114 1690 14 0 9 25 4 13 3 55 20 5 16 0 104 43
Lady Lake 364 2565 1260 4358 62 1 13 30 5 11 0 526 188 86 126 1 229 167
Fruitland Park
152 471 605 3807 30 2 11 28 7 10 0 281 95 13 84 3 24 46
Leesburg 607 283 809 21725 488 28 184 483 113 322 47 3993 1243 240 948 37 19 334
Howey-in-the-Hills
42 12 21 667 378 11 25 102 29 82 13 634 135 18 145 5 0 86
Astatula 2 1 5 205 27 62 12 56 34 86 14 743 95 16 123 7 0 137
Mascotte 78 16 34 1062 71 15 1134 1833 137 686 41 314 36 2 37 1 0 282
Groveland 39 5 19 625 83 28 468 2815 427 1522 76 466 78 6 95 3 1 508
Minneola 31 4 15 500 60 32 119 1081 1135 4158 196 482 87 6 131 5 0 1626
Clermont 15 4 11 489 70 32 265 1647 1694 13156 337 555 48 8 80 4 0 5916
Montverde 5 0 4 167 22 14 27 178 153 606 324 217 34 1 57 1 0 718
Tavares 30 20 40 2215 146 56 12 96 33 96 17 5749 1672 174 1730 42 0 382
Eustis 15 15 35 1636 44 10 4 28 8 14 3 2968 4987 889 3058 83 1 407
Umatilla 1 10 7 298 7 3 0 0 1 4 1 396 948 1776 338 23 0 77
Mount Dora 6 5 13 768 34 15 1 19 14 22 7 2452 2278 198 4117 169 1 762
Sorrento 0 1 4 135 6 6 0 1 3 3 0 303 293 58 790 383 1 694
Villages 814 3558 197 695 7 0 2 8 0 5 0 47 18 12 15 1 4147 34
Orange County
56 31 27 785 68 68 92 510 421 4398 251 2015 1401 194 4235 609 4 870938

2005 NON-HOME-BASED TRIPS W
ildw
oo
d
Lad
y La
ke
Fru
itla
nd
Par
k
Lees
bu
rg
Ho
wey
-in
-th
e-H
ills
Ast
atu
la
Mas
cott
e
Gro
vela
nd
Min
neo
la
Cle
rmo
nt
Mo
ntv
erd
e
Tava
res
Eust
is
Um
atill
a
Mo
un
t D
ora
Sorr
ento
Vill
ages
Ora
nge
Co
un
ty
Wildwood 6726 385 157 1141 30 3 28 54 17 54 10 82 35 6 30 3 309 164
Lady Lake 516 5283 870 3144 21 3 12 25 11 33 5 149 47 18 44 4 1142 97
Fruitland Park
188 755 550 2087 40 2 18 23 6 16 0 224 70 7 50 2 146 44
Leesburg 1321 2683 2062 24803 675 80 333 623 207 397 49 4808 1903 219 1694 71 490 916
Howey-in-the-Hills
35 21 40 672 259 18 27 88 33 64 12 415 100 4 109 2 4 117
Astatula 0 1 1 69 14 23 5 37 31 78 14 157 41 2 62 5 0 123
Mascotte 16 10 15 307 26 4 429 493 126 551 18 36 8 2 11 0 2 227
Groveland 29 17 21 559 81 36 472 1579 490 1874 114 240 35 5 39 1 4 892
Minneola 8 6 7 167 30 26 109 449 631 1811 95 120 16 1 21 2 1 1096
Clermont 15 17 7 298 52 67 477 1639 1726 10212 342 193 35 9 47 6 7 7251
Montverde 2 3 1 43 9 13 15 109 95 367 119 46 6 1 8 2 0 459
Tavares 43 122 201 4657 399 169 36 260 151 241 57 7501 2999 375 3331 225 19 1714
Eustis 24 35 62 1829 98 37 12 36 17 41 10 3008 4277 704 2849 220 7 1271
Umatilla 3 18 5 228 4 1 2 7 2 8 0 406 745 740 404 23 3 133
Mount Dora 11 38 45 1548 96 64 9 40 24 56 10 3137 2754 366 4910 381 8 2946
Sorrento 0 2 1 51 1 3 0 2 4 4 1 170 168 18 314 186 0 615
Villages 236 1857 91 233 3 0 2 4 4 5 0 23 8 7 11 0 3700 20
Orange County
100 79 66 1010 115 91 262 897 959 6294 410 1404 1008 132 2223 530 19 1328589

2035 HOME-BASED WORK TRIPS W
ildw
oo
d
Lad
y La
ke
Fru
itla
nd
Par
k
Lees
bu
rg
Ho
wey
-in
-th
e-H
ills
Ast
atu
la
Mas
cott
e
Gro
vela
nd
Min
neo
la
Cle
rmo
nt
Mo
ntv
erd
e
Tava
res
Eust
is
Um
atill
a
Mo
un
t D
ora
Sorr
ento
Vill
ages
Ora
nge
Co
un
ty
Wildwood 44456 1468 2164 5413 35 1 11 67 11 18 3 82 16 6 18 1 4091 116
Lady Lake 2571 6528 1610 4860 115 12 34 175 64 115 6 615 229 63 204 10 2831 328
Fruitland Park
2346 1690 2256 4787 68 5 17 98 32 61 4 357 129 19 111 10 1089 235
Leesburg 6684 737 1213 32835 754 72 220 1180 355 606 43 4514 1302 186 946 55 409 4827
Howey-in-the-Hills
237 29 27 704 674 21 17 204 64 97 8 536 111 16 112 6 20 988
Astatula 75 10 10 253 44 193 12 112 79 105 9 563 88 11 105 8 6 1168
Mascotte 795 69 63 1562 113 29 1532 1535 292 851 30 409 112 14 110 9 48 4549
Groveland 855 81 58 1611 195 71 636 4666 949 1857 61 766 199 26 198 15 53 8136
Minneola 458 37 41 818 112 96 89 1029 3476 4106 187 576 122 20 155 12 29 9146
Clermont 375 37 29 644 72 39 121 651 1613 8922 134 375 92 8 111 13 24 14616
Montverde 113 9 11 196 25 18 18 167 469 512 201 151 34 4 41 5 7 3001
Tavares 462 93 80 2802 271 109 29 272 118 201 22 10585 2432 120 2214 47 57 3749
Eustis 340 74 67 1638 94 32 11 112 50 96 9 3543 7432 537 3423 84 49 3504
Umatilla 234 78 37 806 53 15 5 61 32 43 6 925 1837 1955 607 37 49 1324
Mount Dora 168 34 33 737 58 22 9 73 41 66 5 2638 2247 96 4049 120 19 3608
Sorrento 24 6 4 91 8 5 3 10 6 18 0 143 110 15 318 240 2 1343
Villages 2671 2723 221 353 3 0 0 3 1 2 0 7 7 2 3 0 5560 9
Orange County
731 56 60 1334 175 101 122 884 989 3531 150 1668 867 97 1683 253 36 756020
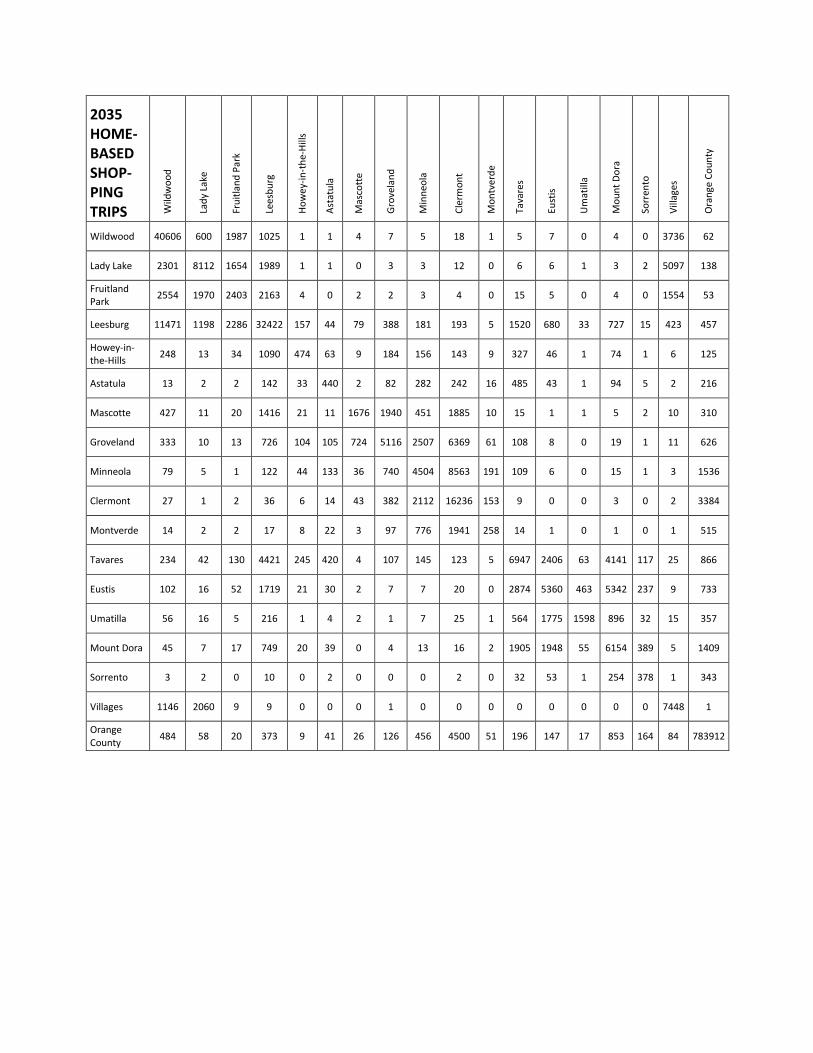
2035 HOME-BASED SHOP-PING TRIPS W
ildw
oo
d
Lad
y La
ke
Fru
itla
nd
Par
k
Lees
bu
rg
Ho
wey
-in
-th
e-H
ills
Ast
atu
la
Mas
cott
e
Gro
vela
nd
Min
neo
la
Cle
rmo
nt
Mo
ntv
erd
e
Tava
res
Eust
is
Um
atill
a
Mo
un
t D
ora
Sorr
ento
Vill
ages
Ora
nge
Co
un
ty
Wildwood 40606 600 1987 1025 1 1 4 7 5 18 1 5 7 0 4 0 3736 62
Lady Lake 2301 8112 1654 1989 1 1 0 3 3 12 0 6 6 1 3 2 5097 138
Fruitland Park
2554 1970 2403 2163 4 0 2 2 3 4 0 15 5 0 4 0 1554 53
Leesburg 11471 1198 2286 32422 157 44 79 388 181 193 5 1520 680 33 727 15 423 457
Howey-in-the-Hills
248 13 34 1090 474 63 9 184 156 143 9 327 46 1 74 1 6 125
Astatula 13 2 2 142 33 440 2 82 282 242 16 485 43 1 94 5 2 216
Mascotte 427 11 20 1416 21 11 1676 1940 451 1885 10 15 1 1 5 2 10 310
Groveland 333 10 13 726 104 105 724 5116 2507 6369 61 108 8 0 19 1 11 626
Minneola 79 5 1 122 44 133 36 740 4504 8563 191 109 6 0 15 1 3 1536
Clermont 27 1 2 36 6 14 43 382 2112 16236 153 9 0 0 3 0 2 3384
Montverde 14 2 2 17 8 22 3 97 776 1941 258 14 1 0 1 0 1 515
Tavares 234 42 130 4421 245 420 4 107 145 123 5 6947 2406 63 4141 117 25 866
Eustis 102 16 52 1719 21 30 2 7 7 20 0 2874 5360 463 5342 237 9 733
Umatilla 56 16 5 216 1 4 2 1 7 25 1 564 1775 1598 896 32 15 357
Mount Dora 45 7 17 749 20 39 0 4 13 16 2 1905 1948 55 6154 389 5 1409
Sorrento 3 2 0 10 0 2 0 0 0 2 0 32 53 1 254 378 1 343
Villages 1146 2060 9 9 0 0 0 1 0 0 0 0 0 0 0 0 7448 1
Orange County
484 58 20 373 9 41 26 126 456 4500 51 196 147 17 853 164 84 783912

2035 HOME-BASED SOCIAL/REC. TRIPS W
ildw
oo
d
Lad
y La
ke
Fru
itla
nd
Par
k
Lees
bu
rg
Ho
wey
-in
-th
e-H
ills
Ast
atu
la
Mas
cott
e
Gro
vela
nd
Min
neo
la
Cle
rmo
nt
Mo
ntv
erd
e
Tava
res
Eust
is
Um
atill
a
Mo
un
t D
ora
Sorr
ento
Vill
ages
Ora
nge
Co
un
ty
Wildwood 36337 1137 1181 3690 39 3 30 44 17 26 2 95 27 5 28 4 2174 38
Lady Lake 2076 7622 2089 2783 10 0 6 6 5 3 0 56 24 7 23 2 3505 103
Fruitland Park
1850 1857 2173 3317 18 1 2 7 3 2 0 77 17 2 14 1 847 35
Leesburg 6496 1176 1814 33138 523 38 237 388 122 100 13 3202 1097 78 688 16 307 352
Howey-in-the-Hills
141 17 25 901 816 38 19 151 75 45 9 686 76 3 88 2 8 90
Astatula 17 4 7 146 54 295 7 74 141 71 19 892 72 4 115 6 1 185
Mascotte 402 24 26 1479 59 17 2412 2076 253 678 18 83 14 4 19 2 12 264
Groveland 448 33 34 1302 272 127 1524 6252 2046 3096 144 427 48 6 67 5 16 679
Minneola 181 17 13 439 150 217 139 1570 4348 5539 592 373 42 2 62 8 7 1510
Clermont 119 8 9 240 35 49 174 962 3055 12109 429 109 14 2 33 5 5 3404
Montverde 41 3 2 92 23 40 16 166 844 1068 521 68 12 0 16 2 2 528
Tavares 134 44 67 3039 333 256 9 76 71 47 10 9493 2741 125 3211 89 20 587
Eustis 61 29 33 1411 36 22 2 15 8 9 1 3498 5798 792 3990 173 10 475
Umatilla 29 25 8 240 7 4 2 3 3 2 0 556 2079 2407 594 27 11 166
Mount Dora 37 11 15 622 32 26 1 11 4 10 3 2896 2441 107 5236 362 4 927
Sorrento 1 2 3 19 2 1 0 1 1 0 1 76 111 6 534 439 0 405
Villages 1783 1680 227 308 0 1 0 1 1 2 0 17 3 1 3 0 4640 2
Orange County
276 25 18 433 67 89 85 418 1142 4818 272 664 477 36 1535 405 25 579765

2035 HOME-BASED OTHER TRIPS W
ildw
oo
d
Lad
y La
ke
Fru
itla
nd
Par
k
Lees
bu
rg
Ho
wey
-in
-th
e-H
ills
Ast
atu
la
Mas
cott
e
Gro
vela
nd
Min
neo
la
Cle
rmo
nt
Mo
ntv
erd
e
Tava
res
Eust
is
Um
atill
a
Mo
un
t D
ora
Sorr
ento
Vill
ages
Ora
nge
Co
un
ty
Wildwood 58827 1814 2714 8687 57 3 64 138 65 79 10 316 90 18 82 6 3014 294
Lady Lake 1583 7690 2428 8044 93 5 29 81 31 19 4 928 304 111 226 3 1843 434
Fruitland Park
1176 2096 2597 7551 51 7 24 67 37 26 1 523 171 32 165 6 828 137
Leesburg 3397 1054 1473 44791 726 91 530 1334 689 901 82 7024 2051 378 1688 86 215 1142
Howey-in-the-Hills
119 35 35 1191 532 30 46 239 143 195 24 1182 222 34 259 16 5 270
Astatula 14 6 9 323 44 165 21 120 172 201 26 1529 156 27 225 18 0 443
Mascotte 337 39 51 2159 110 35 2881 4117 618 1680 72 557 53 6 54 2 7 758
Groveland 337 36 56 2199 238 110 1753 9209 2594 4470 179 1425 224 15 275 9 3 2140
Minneola 169 14 30 1108 140 139 231 1999 5460 8332 577 1227 189 11 310 18 2 4896
Clermont 80 2 6 572 71 57 298 1612 4132 16538 503 627 53 7 107 9 0 8641
Montverde 36 0 5 249 35 28 46 269 1094 1442 501 337 48 1 78 5 0 1727
Tavares 127 82 81 4027 264 165 43 244 215 269 45 13005 3651 368 3942 143 14 1345
Eustis 65 46 56 2296 61 35 9 57 48 35 6 5286 8343 1558 5300 228 7 1177
Umatilla 10 32 17 676 20 12 2 9 4 8 0 1147 2779 4388 962 80 5 360
Mount Dora 26 19 19 974 47 27 5 40 53 51 9 3849 3272 273 6112 333 3 1675
Sorrento 0 2 3 72 6 4 0 1 4 7 2 207 187 38 672 377 0 701
Villages 2000 2936 125 349 3 1 0 3 2 4 0 27 6 6 8 0 8503 23
Orange County
163 61 27 899 82 102 156 849 2052 9406 457 2219 1346 192 4673 799 20 1501099

2035 NON-HOME-BASED TRIPS W
ildw
oo
d
Lad
y La
ke
Fru
itla
nd
Par
k
Lees
bu
rg
Ho
wey
-in
-th
e-H
ills
Ast
atu
la
Mas
cott
e
Gro
vela
nd
Min
neo
la
Cle
rmo
nt
Mo
ntv
erd
e
Tava
res
Eust
is
Um
atill
a
Mo
un
t D
ora
Sorr
ento
Vill
ages
Ora
nge
Co
un
ty
Wildwood 72677 1925 1577 7263 113 18 184 400 214 341 20 384 164 38 147 8 2974 969
Lady Lake 2593 8056 1978 5082 35 4 22 62 33 63 4 251 94 29 70 7 2824 185
Fruitland Park
1560 1812 2736 3944 54 6 22 64 22 37 3 375 116 11 90 1 657 112
Leesburg 8021 4511 3938 47424 1054 163 962 1827 767 762 66 6299 2633 345 2225 63 1245 1764
Howey-in-the-Hills
118 33 54 1074 306 42 44 228 149 152 22 615 154 8 169 4 5 234
Astatula 8 4 3 155 39 95 15 118 162 213 27 367 97 7 141 7 1 346
Mascotte 149 20 19 940 42 15 1133 1264 426 1167 25 57 15 4 18 1 6 487
Groveland 305 52 51 1711 218 122 1250 4758 1973 4012 202 576 84 14 91 4 18 2073
Minneola 128 25 20 646 133 147 379 1737 3964 5767 368 464 54 11 89 2 9 5285
Clermont 148 48 29 610 130 185 975 3353 5374 21903 698 325 63 8 89 9 14 20588
Montverde 13 5 1 56 18 22 21 179 370 756 170 59 6 1 11 0 1 989
Tavares 246 219 353 6243 591 392 57 590 539 400 61 10765 4557 639 4932 245 53 2921
Eustis 97 75 111 2590 160 106 21 94 60 81 6 4596 6747 1272 4449 247 21 2293
Umatilla 26 31 12 344 10 7 2 14 11 16 2 705 1345 1390 718 31 9 251
Mount Dora 78 65 81 2069 158 136 14 93 82 107 24 4659 4272 644 7710 496 17 5503
Sorrento 2 3 2 50 3 6 1 3 5 9 1 198 207 24 429 167 3 810
Villages 2610 4430 472 672 9 3 10 22 13 22 2 60 32 12 24 1 17485 75
Orange County
732 182 134 2212 281 282 598 2370 4691 17746 880 2473 1862 300 4266 706 65 2525092

ATTACHMENT 4: TRANSIT-SUPPORTIVE DENSITY MAPS