NYCDOTBus Ridership Survey and Route Analysis · New York City Department of Transportation Bus...
32
Submitted to New York City Department of Transportation Submitted by Urbitran Associates, Inc. In association with Abrams Cherwony & Associates AJM Consulting University Transportation Research Center, Region II, City University of New York May 2004 NYCDOT Bus Ridership Survey and Route Analysis Final Report TECHNICAL M EMORANDUM URBITRAN
Transcript of NYCDOTBus Ridership Survey and Route Analysis · New York City Department of Transportation Bus...

S u b m i t t e d t o
New York City Department of TransportationS u b m i t t e d b y
U r b i t r a n A s s o c i a t e s , I n c .I n a s s o c i a t i o n w i t h
Abrams Cherwony & AssociatesAJM ConsultingUniversity Transportation Research Center,Region II, City University of New York
Ma y 2004
NYCDOT Bus Ridership Surveyand Route AnalysisFinal Report
T E C H N I C A L M E M O R A N D U M
URBITRAN

New York City Department of Transportation Bus Ridership Survey and Route Analysis
New York City Department of Transportation Bus Ridership Survey and
Route Analysis
Final Report
May 2004

New York City Department of Transportation Bus Ridership Survey and Route Analysis
TABLE OF CONTENTS
Executive Summary
Section 1 Existing Conditions and Ridership Survey
Section 2 Proposed Service Modifications Section 3 Service Guidelines Section 4 Implementation Plan APPENDIX A Major Trip Generators in the Bronx and Queens APPENDIX B Route Profiles APPENDIX C Ridecheck Methodology APPENDIX D Sample Ridecheck Form APPENDIX E Monthly Passenger Totals by Route APPENDIX F On-Time Performance by Route
APPENDIX G Running Time
APPENDIX H Route Service Operating Statistic Changes APPENDIX I Bus Fleet Purchase Program

Executive Summary

New York City Department of Transportation Bus Ridership Survey and Route Analysis
1
Executive Summary
The franchised bus program administered by New York City Department of Transportation (NYCDOT) provides public transportation services through a number of private companies in New York City. In the Bronx, express bus service is provided by Liberty Lines and New York Bus Service. In Queens, both local and express bus services are provided, operated by Green Bus Lines, Jamaica Buses, Queens Surface, and Triboro Coach. Several of these routes also extend into Brooklyn, the Bronx, or Manhattan (local and express bus service operated in Brooklyn by Command Bus were not included as part of this study as they were looked at in the Southern Brooklyn Transportation Investment Study occurring concurrently). These services complement, and in many instances feed the bus and subway services operated by the Metropolitan Transportation Authority’s New York City Transit, as well as the Long Island Rail Road. New York City Department of Transportation (NYCDOT) hired the consultant team of Urbitran Associates, in association with Abrams-Cherwony & Associates, AJM Consulting, and the University Transportation Research Center Region 2 to conduct a bus ridership survey and route efficiency study of the private franchised carriers in the Bronx and Queens. This study consisted of a major data collection element and a study of NYCDOT Franchised carrier routes and planning guidelines. The impacted carriers included Green Bus Lines, Jamaica Buses, Liberty Lines Express, New York Bus Service, Queens Surface Corporation, and Triboro Coach. The bus operator in Brooklyn, Command Bus Company, was not included in this study. A project oversight committee, made up of representatives from NYCDOT, New York State Department of Transportation (NYSDOT), New York Metropolitan Transportation Council (NYMTC) and representatives from each of the affected carriers provided input to the study. The project oversight committee had a kickoff meeting on September 10, 2002, and met three times during the course of the study at timings that corresponded to the three deliverables produced. The three deliverables produced during this study are the sections that make up this final report, along with this executive summary. Throughout the course of the study, the issue of whether or not the NYCDOT Franchised Bus Program was to be taken over by the Metropolitan Transportation Authority – New York City Transit (MTA-NYCTA) was of concern. On April 19, 2004, an announcement was made that effective July 1, 2004 MTA-NYCTA would indeed be taking over this program. The findings of this study will still be relevant regardless of who and how the service is operated after July 1, 2004. Data Collection The data collection element was conducted in the fall of 2002 between October 30th and December 15th. A 50% ridership sample was collected for local services operated in Queens. Surveyors were placed aboard the sampled buses to record boardings and alightings at each stop for each trip during the day. Besides recording boarding and

New York City Department of Transportation Bus Ridership Survey and Route Analysis
2
alighting data, surveyors recorded the arrival time at timepoints in order to check running time and on-time performance. For express services, a load check at the maximum load point for each route was conducted for each inbound trip. Surveyors counted the total number of passengers onboard each inbound bus at the last pick-up bus stop before the bus goes express to Manhattan The exact methodology for the data collection is presented in the existing conditions section and in Appendix C. Existing Conditions The existing conditions summary provides an overview of the local and express bus service operated by the New York City Department of Transportation franchised carriers in the Bronx and Queens and the environment that they operate in. The demographic summary provides an overview of the boroughs of the Bronx and Queens, showing population change in the last 10 years, population density from the 2000 census, average vehicles per household, and locations of major trip generators in each borough. Also provided in this section is an overview of the network and the carriers, including the routes and service area of each company, route headways by time of day, span of each route, the inventory of the fleet, capital projects relating to the service, peak fleet requirements, the fare policy (as of April 2003), and a few potential policy changes, some of which have since been implemented. Table 1 provides an overview of the services operated by each carrier.
Table1: Bus Company Service Areas and Routes
Company Local/Limited Service Area
# Local/Limited Routes*
Express Service Area**
# Express Routes)*
Green Bus Lines
Southern and Central Queens
16 Southern and Central Queens
5
Jamaica Buses Southeastern Queens
4 Southeastern Queens
1
Queens Surface Corp.
Northeastern Queens,
Northwestern Queens
12 Northeastern Queens
6
Triboro Coach Corp
Western and Central Queens
13 Western and Central Queens
5
Liberty Lines NA NA Western and Central Bronx
7
New York Bus Service
NA NA Eastern Bronx 6
TOTAL 45 30 *Routes having distinct route numbers **Express routes provide service to Midtown and/or downtown Manhattan from service area
New York City Department of Transportation Bus Ridership Survey and Route Analysis
3
Trends in ridership, revenue hours of service, and revenue miles of service were tracked, based on National Transit Database figures from 1997 to 2001. What this shown is that from 1997 to 2001 ridership grew by 22%, while revenue miles of service grew by 12%, and revenue hours of service grew by 19%. Revenue and expenses were presented for year 2001, including showing a sample month of fare revenue by fare type. From this data, the farebox recovery (percent of cost recovered at the farebox) was calculated at 40% for these companies From this information, performance indicators, such as passengers per hour, passengers per mile, cost per hour, cost per mile, and cost per passenger were developed for year 2001 to show the performance of the network. The last few chapters in this section deal with items that come directly from the field data collection, route ridership and on-time performance. Ridership is presented by average day, by time of day, and by stop. Crowding issues were also presented, based on the load analysis from the ridership counts, showing that relatively few express trips are overcrowded, while some local routes such as the Q6, Q11, Q23, Q65, and Q113 have a high percentage of trips that are overcrowded. The on-time performance data shows that trips that some routes have very low percent of trips that actually operate on-time, which are mostly long routes, or routes with high ridership. Route Analysis and Recommendation The route analysis was based on the field data collection. The analysis consisted of determining, from the ride-check survey, where and how passengers were using the service, and how much crowding is an issue with the route. Based on this data, service level recommendations were made on increasing and decreasing service. Other types of recommendations were also made, relating to opportunities to improve the bus network within the boroughs. Recommendations were made to combine or split routes in order to improve route efficiency or provide a one seat ride to patrons along a corridor. Route alignment changes were also recommended in order to better serve bus riders or generators, or to better rationalize the system. Route lengths were also lengthened or shortened in order to better serve a core market. A few new routes or completely restructured routes were developed to provide a service that currently does not exist. Some of the route recommendations will impact routes that are operated by New York City Transit. For the most part, there were very few recommendations relating to the express bus routes. The recommendations for the local bus routes are summarized below on Table 2.

New York City Department of Transportation Bus Ridership Survey and Route Analysis
4
Table 2: Local Route Recommendations
Change Type Green Bus Lines
Jamaica Buses
Queens Surface
Triboro Coach
Nomenclature Change Q9A, Q10A Q110 (branch)
Q65A, Q101R
Q19A, Q19B, Q38, Q53
Increase Service to Meet Demand
Q6, Q9, Q10, Q11, Q40
Q113 Q25, Q66
Re-Route/Route Rationalization
Q9, Q10, Q37, Q40
Q110, Q111, Q112, Q113
Q66 Q23
New Branch/Route Extension
Q6, Q7, Q8, Q9, Q10, Q11
Q111 Q65, Q65A, Q102, Q103
Q18, Q19, Q23, Q33, Q38, Q39, Q72
New/Change Short Turn Location
Q19B, Q23
Limited Stop Service Q10 Q113 Q25, Q65 Additional Stops on Limited Stop Routes
Q101R Q53
Complete Route Restructuring
Q9A
Route Consolidation Q22, Q35 Q112 Q66 Q45, Q47 Split Route Q25, Q65,
QBx1
Route Length Reduction Q41, Q60 Service Reduction Q67 Q38 Route Elimination Q21 Q34 No Change Q22A Q101, Q104 Q29
The most significant recommendation relating to express buses was the development of two transfer facilities. For buses coming from Queens, a transfer facility was proposed in the vicinity of Queens Center mall near the Long Island Expressway for patrons to transfer to buses serving all major areas of Manhattan including services along 3rd Avenue, 6th Avenue, 8th Avenue, and Wall Street. For Bronx express routes, a transfer facility was proposed in the vicinity of Madison Square Park along 23rd Street, allowing Bronx patrons to transfer to the BxM18 to Wall Street. Service Standards Service guidelines can be used both to evaluate both existing services and design new services. The service guidelines discussed in this section come from a few sources, including NYCDOT Local and Express Bus Service Planning Guidelines draft report prepared in February of 2002, various documents prepared by the New York City Transit Authority. Also considered were research results presented in the Transit Capacity and Quality of Service Manual (TCQSM), however since the applications of the guidelines should be consistent with available agency and carrier resources, the TCQSM was used

New York City Department of Transportation Bus Ridership Survey and Route Analysis
5
more as a reference. The standards that are suggested for use in the current route planning assignment focus on several areas of concern such as on-time performance, overcrowding, and productivity. A total of nine different guidelines have been defined for this category. All deal with how the transit system is or should be designed to meet community expectations for mobility. Service design guidelines have been developed for the following nine areas:
• Service Availability • Bus Stop Spacing • Span of Service • Frequency • Directness • Route Branching/Turnbacks • Bus Shelter Locations • Bus Stop Information • Public Information
A total of five different guidelines have been defined for this category. All deal with how well the NYCDOT franchise bus routes perform “on the street”. The emphasis is on rider comfort and the efficiency and effectiveness of these services. Performance guidelines have been developed for the following five areas:
• Service Reliability • Farebox Recovery Ratio • Passenger Productivity Levels • Vehicle Loading • Vehicle Condition

New York City Department of Transportation Bus Ridership Survey and Route Analysis
6
Implementation The recommended service plan will impact service delivery in many ways. It will add significant operating costs to the system. Additional peak vehicles will be required to implement the plan. The plan will need to be implemented in stages as vehicles and funding becomes available. Table 3 provides an overview of the amount of service hours, service miles, and peak vehicles it will take to implement the proposed services. Also, presented is the cost to implement the service, based on F.Y. 2001 costs. This table also provides a ridership and revenue forecast, as well as estimating the deficit entailed in operating the proposed service.
Table 3: Operations Statistic Summary
Statistic
Base Year
Increment
Forecast
Percent Change
Vehicle Hours (000's) 2,845 411 3,256 14.4
Vehicle Miles (000's) 28,361 2,912 31,273 10.3
Peak Vehicles 974 154 1,128 15.8
Ridership (000's) 114,925 10,041 124,966 8.7
Operating Costs ($000's) 265,474 33,394 298,868 12.6
Revenue ($000's) 107,206 8,232 115,438 7.7
Deficit ($000's) 158,268 25,162 183,430 15.9 A major finding of this study is the old age of the franchised carrier fleet. Over 50% of buses in the fleet are past their useful life of 12 years. Besides the need to replace these buses, the recommended route and service changes will require additional vehicles. A total of 1,035 new buses will need to be purchased by 2009 to replace the current fleet that currently is or will be passed its useful life, as well as expanding the fleet to reduce crowding on routes, implement the plan, and provide adequate spares. The plan recommends distributing the purchases of buses evenly throughout the 5 years up to 2009. By 2009 the recommended fleet size for the Bronx and Queens franchised carriers will be 1,353 buses, up from 1,168 in the fleet today. An issue with this fleet is the ability for the bus storage and maintenance facilities to store and maintain the current fleet or an expanded fleet. Some of the storage facilities, such as the New York Bus Service facility, has no trouble storing and servicing the current fleet and will be able to store an expanded fleet. On the other hand some facilities, such as the Triboro Coach facility, are unable to handle the current fleet (storing over 25 buses on the street overnight) and would have great difficulty storing and expanded fleet. The service implementation plan does not set which routes should be implemented in what order, rather it sets priorities for implementing new services. The implementation

New York City Department of Transportation Bus Ridership Survey and Route Analysis
7
priorities are set based on critical needs of the network and ease of implementation. For example, maintaining current headways is a much higher priority than implementing new routes that will enhance the route network. Also, route nomenclature, or route naming, while not a priority for the efficiency of the network, is set as a high priority as it is something that could be implemented rather quickly and easily.
Section 1
Existing Conditions and Ridership Survey

New York City Department of Transportation Bus Ridership and Route Analysis
i
TABLE OF CONTENTS
Chapter/Section Page Chapter 1 Introduction.................................................................................................1
Chapter 2 Service Area Profile....................................................................................2
2.1 Population ....................................................................................................2 2.2 Auto Ownership ...........................................................................................5 2.3 Major Trip Generators .................................................................................5
Chapter 3 Transit System Characteristics ................................................................7
3.1 Service Area ................................................................................................7 3.2 Bus Network Structure & Characteristics....................................................7 3.3 Days and Hours of Operation/Service Span ..............................................10 3.4 Headways and Layover..............................................................................17 3.5 Route Lengths/Running Times ..................................................................17 3.6 Route Descriptions.....................................................................................17 3.7 Schedule Convenience and Transfer Coordination....................................18 3.8 Fleet Inventory and Facilities Review .......................................................18 3.9 Vehicle Requirements................................................................................24 3.10 Fare Structure and Transfer Policy ............................................................24 3.11 Potential Policy Changes ...........................................................................26
Chapter 4 Operating and Financial Performance ...................................................28
4.1 System Ridership, Vehicle Miles, and Vehicle Hours Trends...................28 4.2 Ridership by Fare Type..............................................................................30 4.3 Operating Expenses and Revenues ............................................................32
Chapter 5 Performance Indicators............................................................................34
5.1 Productivity Indicators...............................................................................34 5.2 Cost Indicators ...........................................................................................34
Chapter 6 Ridership Analysis ...................................................................................36
6.1 Local Ridership .........................................................................................36 6.2 Express Ridership ......................................................................................41
Chapter 7 Time Point Analysis.................................................................................44
7.1 On-Time Performance ..............................................................................44 7.2 Running Time Analysis .............................................................................48
Chapter 8 Preliminary Issues ...................................................................................51

New York City Department of Transportation Bus Ridership and Route Analysis
ii
APPENDIX A Major Trip Generators in the Bronx and Queens APPENDIX B Route Profiles APPENDIX C Ridecheck Methodology APPENDIX D Sample Ridecheck Form APPENDIX E Monthly Passenger Totals by Route APPENDIX F On-Time Performance by Route
APPENDIX G Running Time

New York City Department of Transportation Bus Ridership and Route Analysis
iii
LIST OF TABLES
TABLE PAGE Table 2-1 Change in Total Population, 1990 and 2000-New York City, Bronx,
Queens..........................................................................................................2 Table 2-2 Population Change for the 25 Largest Cities in the US, 1990 to 2000
Ranked by Population Change, 1990 to 2000..............................................4 Table 3-1 Bus Company Service Areas and Routes.....................................................8 Table 3-2 Local/Limited Bus Route Span and Headways .........................................11 Table 3-3 Express Bus Route Span and Headways....................................................14 Table 3-4 Fleet Inventory and Average Fleet Age as of December 2002..................21 Table 3-5 Bus Facility Capital Projects......................................................................22 Table 3-6 New Vehicle Purchases for Private Franchised Carriers ...........................22 Table 3-7 Transit Vehicle Delivery Schedule 2004-2006..........................................23 Table 3-8 Peak Vehicle Requirements by Company..................................................24 Table 3-9 Fare Structure ............................................................................................26 Table 4-1 Ridership Trends .......................................................................................28 Table 4-2 Vehicle Mile Trends .................................................................................29 Table 4-3 Vehicle Hour Trends .................................................................................30 Table 4-4 Ridership by Fare Type (October 2002) ....................................................31 Table 4-5 Revenue and Expenses (FY 2001).............................................................32 Table 4-6 Operating Expense (FY 2001) ...................................................................33 Table 4-7 Revenue by Source (FY 2001)...................................................................33 Table 5-1 Productivity Indicators...............................................................................34

New York City Department of Transportation Bus Ridership and Route Analysis
iv
LIST OF TABLES (CONT.)
TABLE PAGE
Table 5-2 Cost Indicators ...........................................................................................35 Table 5-3 Cost Indicators (Operations Costs Only) ...................................................35 Table 6-1 Estimated Average Daily Local Ridership ................................................37 Table 6-2 Bus Stops with the Most Passenger Activity .............................................39 Table 6-3 Overcrowding on Local Sampled Trips.....................................................40 Table 6-4 Estimated Average Daily Express Ridership.............................................42 Table 6-5 Overcrowded Express Routes ....................................................................43 Table 7-1 Local Route On-Time Performance...........................................................45 Table 7-2 Express Route On-Time Performance .......................................................47 Table 7-3 Routes that Deviates from Scheduled Running Time by 10 Minutes or
More...........................................................................................................49

New York City Department of Transportation Bus Ridership and Route Analysis
v
LIST OF FIGURES FOLLOWS
FIGURE PAGE Figure 2-1 Change in Total Population by Census Tract Queens, 1990 to 2000 .. 3 Figure 2-2 Change in Total Population by Census Tract Bronx, 1990 to 2000 .... 3 Figure 2-3 Population Density by Census Tract Queens, 1990 to 2000................ 5 Figure 2-4 Population Density by Census Tract Bronx, 1990 to 2000.................. 5 Figure 2-5 Vehicles per Household by Census Tract Bronx, 2000 ....................... 5 Figure 2-6 Vehicles per Household by Census Tract Queens, 2000 ..................... 5 Figure 2-7 Major Trip Generators, Bronx ............................................................. 6 Figure 2-8 Major Trip Generators, Queens ........................................................... 6 Figure 3-1 Local Bus Route Network, Northern Queens ...................................... 7 Figure 3-2 Local Bus Route Network, Southern Queens ...................................... 7 Figure 3-3 Local Bus Route Network, Rockaway Peninsula ................................ 7 Figure 3-4 Express Bus Route Network, Bronx .................................................... 7 Figure 3-5 Express Bus Route Network, Northern Queens................................... 7 Figure 3-6 Express Bus Route Network, Southern Queens................................... 7 Figure 6-1 Green Bus Lines Weekday Local Route Boardings by Hour ............ 38 Figure 6-2 Jamaica Buses Weekday Local Route Boardings by Hour................ 38 Figure 6-3 Queens Surface Weekday Local Route Boardings by Hour.............. 38 Figure 6-4 Triboro Coach Weekday Local Route Boardings by Hour................ 38 Figure 6-5 Green Bus Lines Saturday Local Route Boardings by Hour ............. 38 Figure 6-6 Jamaica Buses Saturday Local Route Boardings by Hour................. 38 Figure 6-7 Queens Surface Saturday Local Route Boardings by Hour............... 38

New York City Department of Transportation Bus Ridership and Route Analysis
vi
LIST OF FIGURES (CONT.) FOLLOWS
FIGURE PAGE Figure 6-8 Triboro Coach Saturday Local Route Boardings by Hour................. 38 Figure 6-9 Green Bus Lines Sunday Local Route Boardings by Hour ............... 38 Figure 6-10 Jamaica Buses Sunday Local Route Boardings by Hour................... 38 Figure 6-11 Queens Surface Sunday Local Route Boardings by Hour ................. 38 Figure 6-12 Triboro Coach Sunday Local Route Boardings by Hour................... 38

New York City Department of Transportation Bus Ridership Survey and Route Analysis
1
Chapter 1 Introduction The franchised bus program administered by New York City Department of Transportation (NYCDOT) provides public transportation services through a number of private companies in New York City. In the Bronx, express bus service is provided by Liberty Lines and New York Bus Service. In Queens, both local and express bus services are provided. They are operated by Green Bus Lines, Jamaica Buses, Queens Surface, and Triboro Coach. Several of these routes also extend into Brooklyn, the Bronx, or Manhattan. Local and express bus service operated in Brooklyn by Command Bus were not included as part of this study. These services complement, and in many instances feed the bus and subway services operated by the Metropolitan Transportation Authority’s New York City Transit, as well as the Long Island Rail Road. The purpose of this first section is to provide an overview of the area that service is operated in, and an overview of the services provided, as well as the utilization of those services by the riding public. The information presented in this technical memorandum is important in providing the background data to assist in planning for service improvements for the areas of the Bronx and Queens where the franchise carriers currently operate. Chapter 2 of this document provides a demographic overview of the Bronx and Queens. Chapter 3 provides an overview of the services provided. Chapter 4 provides the operating and financial performance of the services provided by the six companies in the Bronx and Queens. Performance indicators are presented in Chapter 5. Chapter 6 presents ridership data collected during a ridership survey. Chapter 7 gives an overview of the on-time performance of the franchised bus services. Finally, chapter 8 provides a brief summary of issues raised in the previous chapters, which will be addressed in subsequent technical memorandums.
New York City Department of Transportation Bus Ridership Survey and Route Analysis
2
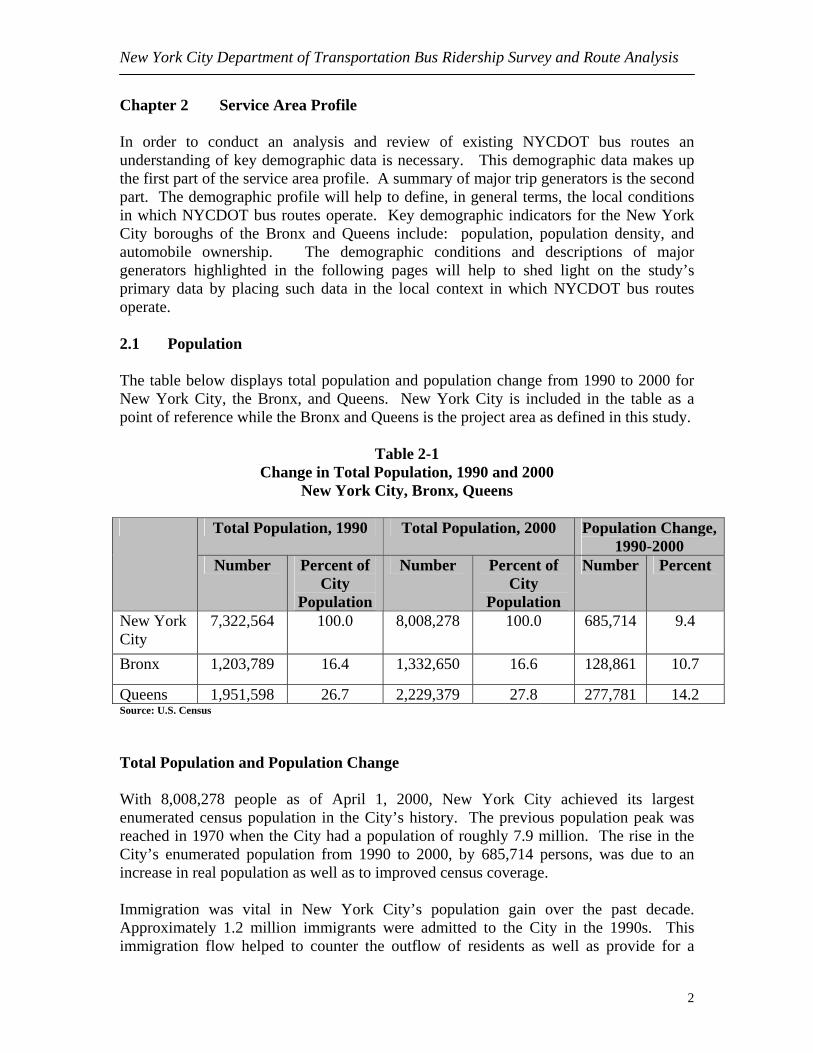
Chapter 2 Service Area Profile In order to conduct an analysis and review of existing NYCDOT bus routes an understanding of key demographic data is necessary. This demographic data makes up the first part of the service area profile. A summary of major trip generators is the second part. The demographic profile will help to define, in general terms, the local conditions in which NYCDOT bus routes operate. Key demographic indicators for the New York City boroughs of the Bronx and Queens include: population, population density, and automobile ownership. The demographic conditions and descriptions of major generators highlighted in the following pages will help to shed light on the study’s primary data by placing such data in the local context in which NYCDOT bus routes operate. 2.1 Population The table below displays total population and population change from 1990 to 2000 for New York City, the Bronx, and Queens. New York City is included in the table as a point of reference while the Bronx and Queens is the project area as defined in this study.
Table 2-1
Change in Total Population, 1990 and 2000 New York City, Bronx, Queens
Total Population, 1990 Total Population, 2000 Population Change,
1990-2000
Number Percent of City
Population
Number Percent of City
Population
Number Percent
New York City
7,322,564 100.0 8,008,278 100.0 685,714 9.4
Bronx 1,203,789 16.4 1,332,650 16.6 128,861 10.7
Queens 1,951,598 26.7 2,229,379 27.8 277,781 14.2 Source: U.S. Census Total Population and Population Change With 8,008,278 people as of April 1, 2000, New York City achieved its largest enumerated census population in the City’s history. The previous population peak was reached in 1970 when the City had a population of roughly 7.9 million. The rise in the City’s enumerated population from 1990 to 2000, by 685,714 persons, was due to an increase in real population as well as to improved census coverage. Immigration was vital in New York City’s population gain over the past decade. Approximately 1.2 million immigrants were admitted to the City in the 1990s. This immigration flow helped to counter the outflow of residents as well as provide for a

New York City Department of Transportation Bus Ridership Survey and Route Analysis
3
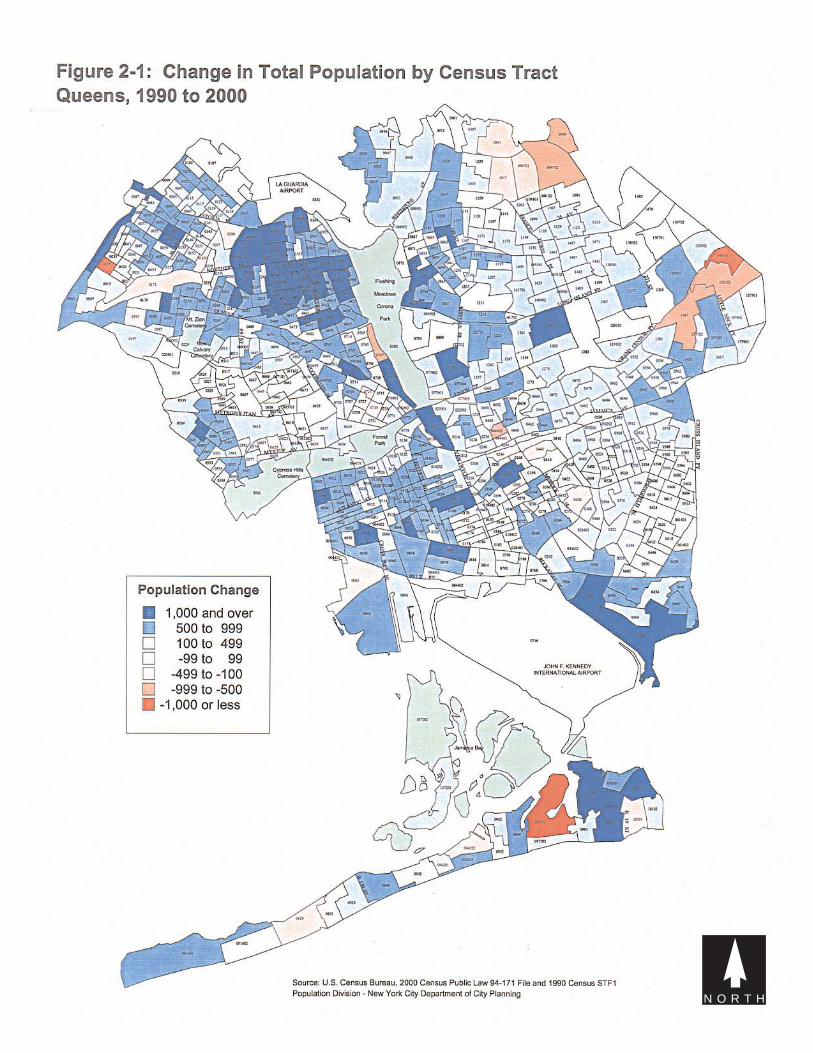
natural increase of births over deaths, as immigrants tend to be younger than other residents. Queens and the Bronx recorded even more impressive population change from 1990-2000. The Queens 2000 census population (2,229,379) represents a 14.2% increase in population from 1990 to 2000 and was the second highest for a New York City borough after Richmond County’s (Staten Island) rate of 17.1%. The Bronx increased its population to 1,332,650 in 2000. This is a 10.7% increase over the last decade. Despite having only 44 % of New York City’s 2000 population1, Queens and the Bronx accounted for 59% of the City’s population growth between 1990 and 2000. Figures 2-1 and 2-2 show population change by census tract for these two boroughs. In Queens some neighborhoods that saw that largest population increase between 1990 and 2000 include: Jackson Heights, Corona, western Flushing, Far Rockaway, Brookville, Fresh Meadows, and sections of Ozone Park, Briarwood, Kew Gardens, and Astoria. Neighborhoods in Queens with the largest population decrease include: Bay Terrace, Beechhurst, Glen Oaks, Edgemere, and sections of Jamaica, Lindenwood, and Forest Hills. Bronx neighborhoods that saw large population increases between 1990 and 2000 include: Morris Heights, High Bridge, Concourse, Eastchester, Edenwald, Wakefield, Parkchester, and Bedford Park. Those neighborhoods or parts of Bronx neighborhoods that saw the largest decline include Edgewater Park and Spuyten Duyvil. In general neighborhoods that registered the largest population increases for both boroughs are old, dense neighborhoods that include sizable minority populations. Neighborhoods that saw the largest decreases were characterized by more newer housing stock and tend to have non-minority populations. Factors that have contributed to large population increases for these neighborhoods in the Queens and the Bronx included high rates of immigration, excellent access to jobs in Manhattan, and relatively cheap and plentiful housing. In order to put the population numbers for New York City, Queens, and The Bronx in context it helps to compare city and borough population growth rates with national and New York metropolitan population figures. Table 2-2 lists population change between 1990 and 2000 for the 25 largest cities in the U.S. The population rates for Queens and the Bronx rank near the top third of all large U.S. cities and for older, northern cities at the top. When New York metropolitan region county population growth rates are evaluated Queens County has the fourth highest growth rate from 1990 to 2000 after Somerset County, NJ (23.8%), Ocean County, NJ (17.9%), and Richmond County (17.1%). Bronx County’s population growth rate is higher than almost two-thirds of the counties within the New York metro region.
1 Queens accounts for 27.8% of the 2000 population and the Bronx includes 16.6% of New York City’s population.
N O R T H

N O R T H

New York City Department of Transportation Bus Ridership Survey and Route Analysis
4
Table 2-2
Population Change for the 25 Largest Cities in the U.S, 1990 and 2000 Ranked by Population Change, 1990-2000
Geographic Area Total Population Population Change,
1990-2000 Rank City and Borough 1990 2000 Number Percent
1 Austin, TX 465,622 656,562 190,940 41.0 2 Phoenix, AZ 983,403 1,321,045 337,642 34.3 3 San Antonio, TX 935,933 1,144,646 208,713 22.3 4 Houston, TX 1,630,553 1,953,631 323,078 19.8 5 Denver, CO 467,610 554,636 87,026 18.6 6 Dallas, TX 1,006,877 1,188,580 181,703 18.0 7 Jacksonville, FL 635,230 735,617 100,387 15.8 8 San Jose, CA 782,248 894,943 112,695 14.4 Queens, NY 1,951,598 2,229,379 277,781 14.2 9 Columbus, OH 632,910 711,470 78,560 12.4 10 Nashville, TN 510,784 569,891 59,107 11.6 Bronx, NY 1,203,789 1,332,650 128,861 10.7
11 San Diego, CA 1,110,549 1,223,400 112,851 10.2 12 El Paso, TX 515,342 563,662 48,320 9.4 13 New York, NY 7,322,564 8,008,278 685,714 9.4 13 Seattle, WA 516,259 563,374 47,115 9.1 14 San Francisco, CA 723,959 776,733 52,774 7.3 Brooklyn, NY 2,300,664 2,465,326 164,662 7.2
15 Indianapolis, IN 741,952 791,926 49,974 6.7 16 Memphis, TN 610,337 650,100 39,763 6.5 17 Los Angeles, CA 3,485,398 3,694,820 209,422 6.0 18 Chicago, IL 2,783,726 2,896,016 112,290 4.0 19 Manhattan, NY 1,487,536 1,537,195 49,659 3.3 20 Boston, MA 574,283 589,141 14,858 2.6 21 Philadelphia, PA 1,585,577 1,517,550 (68,027) -4.3 22 Milwaukee, WI 628,088 596,974 (31,114) -5.0 23 Washington, D.C. 606,900 572,059 (34,841) -5.7 24 Detroit, MI 1,027,974 951,270 (76,704) -7.5 25 Baltimore, MD 736,014 651,154 (84,860) -11.5
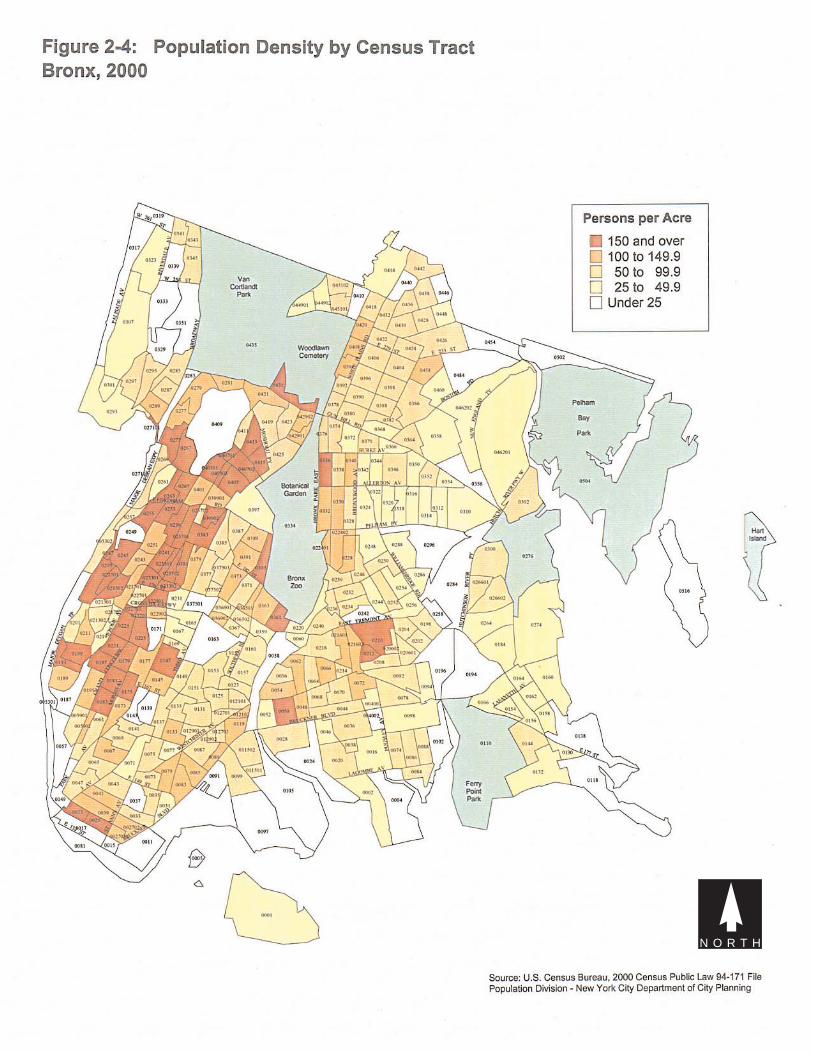
Source: New York City Department of City Planning Population Density Population density is a key indicator of transit demand. Measured in persons per acre population density can in part help to determine the nature, type, and feasibility of various types of transit service. Figures 2-3 and 2-4 show 2000 population density by census tract for Queens and the Bronx. Areas of highest residential density in Queens

New York City Department of Transportation Bus Ridership Survey and Route Analysis
5
include Jackson Heights, Flushing, and Sunnyside. In the Bronx these areas include Parkchester, Morris Heights, Concourse, Tremont, Bedford Park, Fordham, and Kingsbridge Heights. 2.2 Auto Ownership Figures 2-5 and 2-6 display Bronx and Queens household automobile statistics for the census tract level. Automobile ownership, next to population density, is one of the most important measures of potential transit ridership and demand. Households with low vehicle ownership rates tend to utilize public transportation more than households with higher rates of automobile ownership. There is a large difference in auto ownership between the south and west Bronx and the north and east Bronx. For most of the south/western Bronx households there is less than one vehicle per household. Mass transit is heavily utilized in these census tracts. A different picture is apparent in northern and eastern Bronx with vehicles per household rates averaging from 0.52 to 2.31. When one looks at both types of demographic information presented in this study (auto ownership and population density) two distinct regions can be classified in the Bronx. The South Bronx includes census tracts roughly west of the Bronx River Parkway and north up to Fordham Road up the west side of the Bronx. Census tracts in this area are densely populated and low rates of auto ownership predominate. The rest of the Bronx is quite different with much lower population densities and higher automobile ownership rates. Queens like the Bronx shows significant variation in census tract automobile ownership rates. Areas of Queens that have very low household auto ownership rates include Flushing, Jamaica, Jackson Heights, Corona, Astoria, Sunnyside, Long Island City, Far Rockaway, and Ridgewood. It is not surprising that some of these neighborhoods have the highest population density in Queens. Census tracts that have household automobile rates from 1.08 to 2.00 include large portions of northeastern Queens, far eastern Queens, and neighborhoods such as Middle Village, Glendale, and Forest Hills Gardens. Overall vehicle availability appears to be higher in Queens than the Bronx. Data from the 2000 US Census Transportation Planning Package indicates that 37.1% of Queens’s households have no vehicle available vs. 61.1% in the Bronx. The mean vehicles per household rate in Queens is 0.91 and in the Bronx the rate is 0.52. In addition Queens has roughly double the amount of households with two vehicles available. Seventeen percent of households in Queens have two cars available whereas only eight percent of households in the Bronx have two cars available. 2.3 Major Trip Generators Appendix A identifies major trip generators for the Bronx and Queens. These borough-wide activity centers serve as key travel destinations and are important for understanding travel patterns, including transit demand, in both Boroughs. Major trip generators include major educational, recreational, medical, commercial, industrial, and

N O R T H
N O R T H

N O R T H

N O R T H

New York City Department of Transportation Bus Ridership Survey and Route Analysis
6
governmental facilities. Refer to Figures 2-7 and 2-8 for the locations of these generators. The Queens and Bronx Offices of The New York City Planning Department assisted in compiling the data for this chapter.

N O R T H

N O R T H