Lagging Teen Employment in a Strong Bay State...
12
Lagging Teen Employment in a Strong Bay State Labor Market Ishwar Khatiwada Center for Labor Markets and Policy Drexel University Raija Vaisanen Commonwealth Corportation Boston, Massachusetts May 2017
-
Upload
truongkhue -
Category
Documents
-
view
216 -
download
2
Transcript of Lagging Teen Employment in a Strong Bay State...
1
Lagging Teen Employment in a Strong
Bay State Labor Market
Ishwar Khatiwada
Center for Labor Markets and Policy
Drexel University
Raija Vaisanen
Commonwealth Corportation
Boston, Massachusetts
May 2017
2
Introduction
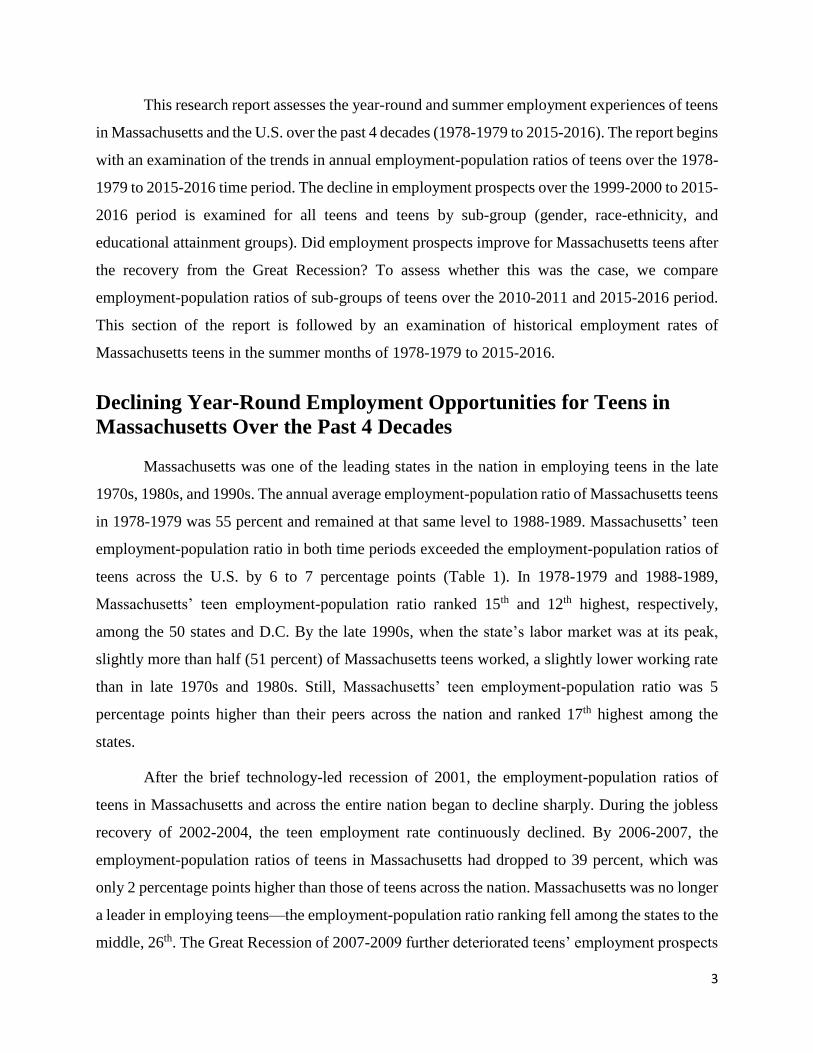
More than six years after the recovery from the Great Recession of 2007-2009,
Massachusetts’ overall economy and labor markets have improved markedly. Since 2010, the state
has added more than 400,000 non-farm payroll jobs. In the first three months of 2017, the
unemployment rate in the state has fallen to 4.4 percent, halved from a peak unemployment rate
of more than 8 percent in 2010. From the second quarter of 2009 to the third quarter of 2016, the
real GDP of the state has increased by $59.8 billion. In recent years, real wages have also started
to rise after remaining flat for many years since the Great Recession.1 The employment-population
ratios of working-age adults in the state have improved after reaching bottom in 2010-2011.
However, the gain in employment has not been uniform across age groups. The youngest workers
(16-to-19 years old) have not been able to capture the full benefits from an improved overall
economy and labor market. The employment-population ratio of teens has remained stagnant in
Massachusetts over the 2010-2011 and 2015-2016 period.
Part-time, year-round and summer month employment opportunities for teens are very
important. Work experience is a form of human capital investment that has favorable future
employment and earnings impacts. From early age employment, teens develop non-cognitive
employability skills such as punctuality, team work, problem solving, communication, working
under supervision, and customer service. These are very important skills at work. Teen
employment is highly path dependent—meaning the more teens work today, the more likely they
will work tomorrow. Evidence show that teens, particularly from poor families, who work during
the summer are more likely to work part-time after the summer, more likely to persist and finish
high school, more likely to enroll in college and graduate, and more likely to be employed with
higher earnings. This early employment experience gives them an advantage in the labor market.
Summer jobs are particularly crucial for teens from disadvantaged families. Some research shows
that teens from poor families who do not work in the summer are more likely to engage in
delinquent behavior and become involved in the criminal justice system. Female teens from poor
families who do not work are more likely to become teen mothers than those who work.
1 The Occupational Employment Statistics (OES) surveys from the U.S. Bureau of Labor Statistics show that the real
median hourly wages of workers in Massachusetts increased by 3.4 percent over the May 2014-May 2016 period.
3
This research report assesses the year-round and summer employment experiences of teens
in Massachusetts and the U.S. over the past 4 decades (1978-1979 to 2015-2016). The report begins
with an examination of the trends in annual employment-population ratios of teens over the 1978-
1979 to 2015-2016 time period. The decline in employment prospects over the 1999-2000 to 2015-
2016 period is examined for all teens and teens by sub-group (gender, race-ethnicity, and
educational attainment groups). Did employment prospects improve for Massachusetts teens after
the recovery from the Great Recession? To assess whether this was the case, we compare
employment-population ratios of sub-groups of teens over the 2010-2011 and 2015-2016 period.
This section of the report is followed by an examination of historical employment rates of
Massachusetts teens in the summer months of 1978-1979 to 2015-2016.
Declining Year-Round Employment Opportunities for Teens in
Massachusetts Over the Past 4 Decades
Massachusetts was one of the leading states in the nation in employing teens in the late
1970s, 1980s, and 1990s. The annual average employment-population ratio of Massachusetts teens
in 1978-1979 was 55 percent and remained at that same level to 1988-1989. Massachusetts’ teen
employment-population ratio in both time periods exceeded the employment-population ratios of
teens across the U.S. by 6 to 7 percentage points (Table 1). In 1978-1979 and 1988-1989,
Massachusetts’ teen employment-population ratio ranked 15th and 12th highest, respectively,
among the 50 states and D.C. By the late 1990s, when the state’s labor market was at its peak,
slightly more than half (51 percent) of Massachusetts teens worked, a slightly lower working rate
than in late 1970s and 1980s. Still, Massachusetts’ teen employment-population ratio was 5
percentage points higher than their peers across the nation and ranked 17th highest among the
states.
After the brief technology-led recession of 2001, the employment-population ratios of
teens in Massachusetts and across the entire nation began to decline sharply. During the jobless
recovery of 2002-2004, the teen employment rate continuously declined. By 2006-2007, the
employment-population ratios of teens in Massachusetts had dropped to 39 percent, which was
only 2 percentage points higher than those of teens across the nation. Massachusetts was no longer
a leader in employing teens—the employment-population ratio ranking fell among the states to the
middle, 26th. The Great Recession of 2007-2009 further deteriorated teens’ employment prospects
4
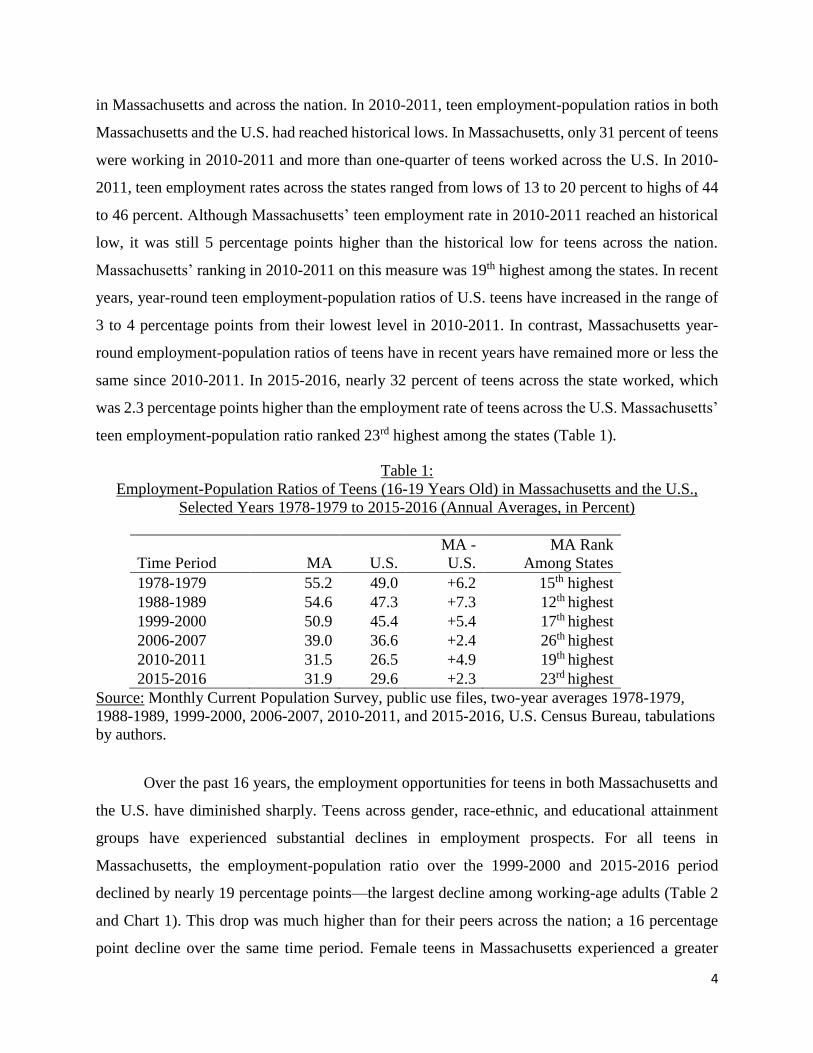
in Massachusetts and across the nation. In 2010-2011, teen employment-population ratios in both
Massachusetts and the U.S. had reached historical lows. In Massachusetts, only 31 percent of teens
were working in 2010-2011 and more than one-quarter of teens worked across the U.S. In 2010-
2011, teen employment rates across the states ranged from lows of 13 to 20 percent to highs of 44
to 46 percent. Although Massachusetts’ teen employment rate in 2010-2011 reached an historical
low, it was still 5 percentage points higher than the historical low for teens across the nation.
Massachusetts’ ranking in 2010-2011 on this measure was 19th highest among the states. In recent
years, year-round teen employment-population ratios of U.S. teens have increased in the range of
3 to 4 percentage points from their lowest level in 2010-2011. In contrast, Massachusetts year-
round employment-population ratios of teens have in recent years have remained more or less the
same since 2010-2011. In 2015-2016, nearly 32 percent of teens across the state worked, which
was 2.3 percentage points higher than the employment rate of teens across the U.S. Massachusetts’
teen employment-population ratio ranked 23rd highest among the states (Table 1).
Table 1:
Employment-Population Ratios of Teens (16-19 Years Old) in Massachusetts and the U.S.,
Selected Years 1978-1979 to 2015-2016 (Annual Averages, in Percent)
Time Period MA U.S.
MA -
U.S.
MA Rank
Among States
1978-1979 55.2 49.0 +6.2 15th highest
1988-1989 54.6 47.3 +7.3 12th highest
1999-2000 50.9 45.4 +5.4 17th highest
2006-2007 39.0 36.6 +2.4 26th highest
2010-2011 31.5 26.5 +4.9 19th highest
2015-2016 31.9 29.6 +2.3 23rd highest
Source: Monthly Current Population Survey, public use files, two-year averages 1978-1979,
1988-1989, 1999-2000, 2006-2007, 2010-2011, and 2015-2016, U.S. Census Bureau, tabulations
by authors.
Over the past 16 years, the employment opportunities for teens in both Massachusetts and
the U.S. have diminished sharply. Teens across gender, race-ethnic, and educational attainment
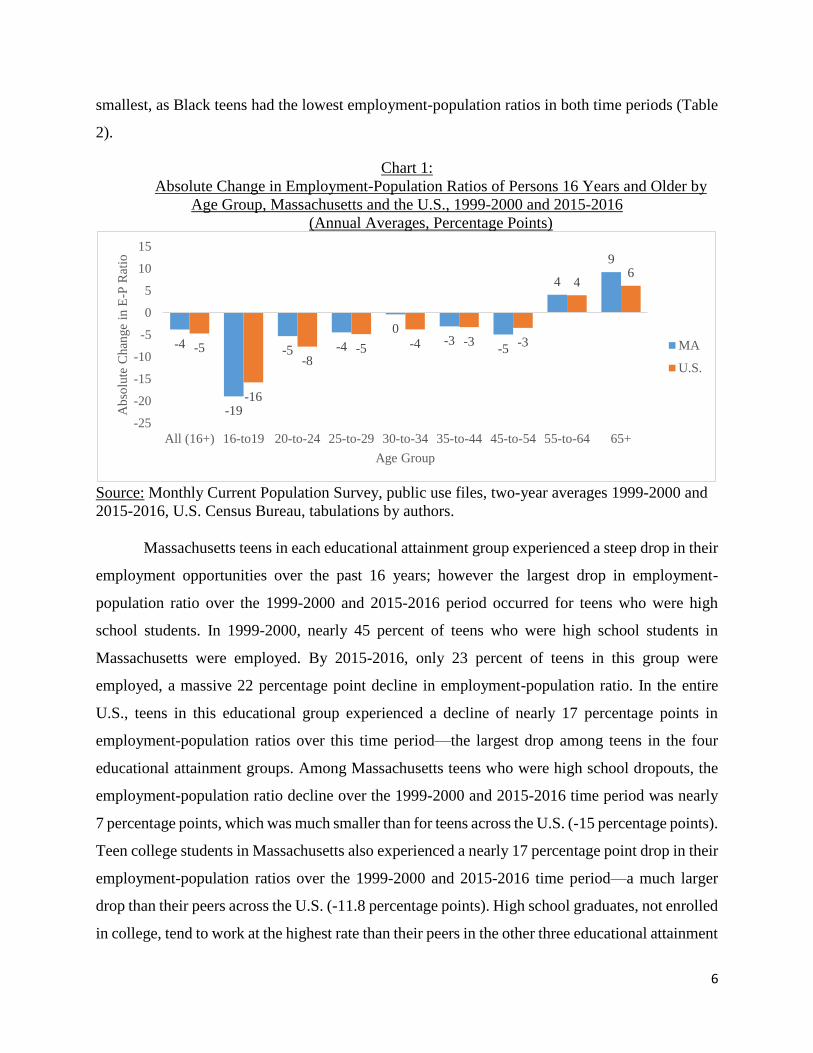
groups have experienced substantial declines in employment prospects. For all teens in
Massachusetts, the employment-population ratio over the 1999-2000 and 2015-2016 period
declined by nearly 19 percentage points—the largest decline among working-age adults (Table 2
and Chart 1). This drop was much higher than for their peers across the nation; a 16 percentage
point decline over the same time period. Female teens in Massachusetts experienced a greater
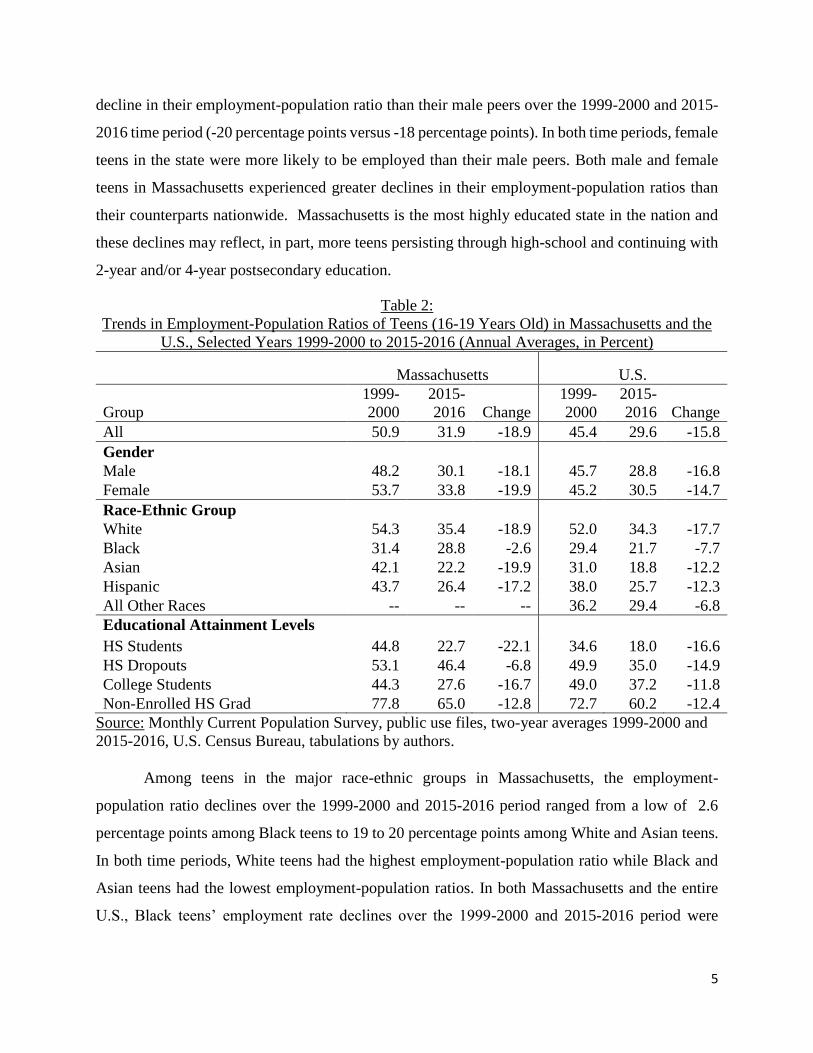
5
decline in their employment-population ratio than their male peers over the 1999-2000 and 2015-
2016 time period (-20 percentage points versus -18 percentage points). In both time periods, female
teens in the state were more likely to be employed than their male peers. Both male and female
teens in Massachusetts experienced greater declines in their employment-population ratios than
their counterparts nationwide. Massachusetts is the most highly educated state in the nation and
these declines may reflect, in part, more teens persisting through high-school and continuing with
2-year and/or 4-year postsecondary education.
Table 2:
Trends in Employment-Population Ratios of Teens (16-19 Years Old) in Massachusetts and the
U.S., Selected Years 1999-2000 to 2015-2016 (Annual Averages, in Percent)
Massachusetts U.S.
Group
1999-
2000
2015-
2016 Change
1999-
2000
2015-
2016 Change
All 50.9 31.9 -18.9 45.4 29.6 -15.8
Gender
Male 48.2 30.1 -18.1 45.7 28.8 -16.8
Female 53.7 33.8 -19.9 45.2 30.5 -14.7
Race-Ethnic Group
White 54.3 35.4 -18.9 52.0 34.3 -17.7
Black 31.4 28.8 -2.6 29.4 21.7 -7.7
Asian 42.1 22.2 -19.9 31.0 18.8 -12.2
Hispanic 43.7 26.4 -17.2 38.0 25.7 -12.3
All Other Races -- -- -- 36.2 29.4 -6.8
Educational Attainment Levels
HS Students 44.8 22.7 -22.1 34.6 18.0 -16.6
HS Dropouts 53.1 46.4 -6.8 49.9 35.0 -14.9
College Students 44.3 27.6 -16.7 49.0 37.2 -11.8
Non-Enrolled HS Grad 77.8 65.0 -12.8 72.7 60.2 -12.4
Source: Monthly Current Population Survey, public use files, two-year averages 1999-2000 and
2015-2016, U.S. Census Bureau, tabulations by authors.
Among teens in the major race-ethnic groups in Massachusetts, the employment-
population ratio declines over the 1999-2000 and 2015-2016 period ranged from a low of 2.6
percentage points among Black teens to 19 to 20 percentage points among White and Asian teens.
In both time periods, White teens had the highest employment-population ratio while Black and
Asian teens had the lowest employment-population ratios. In both Massachusetts and the entire
U.S., Black teens’ employment rate declines over the 1999-2000 and 2015-2016 period were
6
smallest, as Black teens had the lowest employment-population ratios in both time periods (Table
2).
Chart 1:
Absolute Change in Employment-Population Ratios of Persons 16 Years and Older by
Age Group, Massachusetts and the U.S., 1999-2000 and 2015-2016
(Annual Averages, Percentage Points)
Source: Monthly Current Population Survey, public use files, two-year averages 1999-2000 and
2015-2016, U.S. Census Bureau, tabulations by authors.
Massachusetts teens in each educational attainment group experienced a steep drop in their
employment opportunities over the past 16 years; however the largest drop in employment-
population ratio over the 1999-2000 and 2015-2016 period occurred for teens who were high
school students. In 1999-2000, nearly 45 percent of teens who were high school students in
Massachusetts were employed. By 2015-2016, only 23 percent of teens in this group were
employed, a massive 22 percentage point decline in employment-population ratio. In the entire
U.S., teens in this educational group experienced a decline of nearly 17 percentage points in
employment-population ratios over this time period—the largest drop among teens in the four
educational attainment groups. Among Massachusetts teens who were high school dropouts, the
employment-population ratio decline over the 1999-2000 and 2015-2016 time period was nearly
7 percentage points, which was much smaller than for teens across the U.S. (-15 percentage points).
Teen college students in Massachusetts also experienced a nearly 17 percentage point drop in their
employment-population ratios over the 1999-2000 and 2015-2016 time period—a much larger
drop than their peers across the U.S. (-11.8 percentage points). High school graduates, not enrolled
in college, tend to work at the highest rate than their peers in the other three educational attainment
-4
-19
-5 -4
0-3
-5
4
9
-5
-16
-8-5 -4 -3 -3
46
-25
-20
-15
-10
-5
0
5
10
15
All (16+) 16-to19 20-to-24 25-to-29 30-to-34 35-to-44 45-to-54 55-to-64 65+
Ab
solu
te C
han
ge
in E
-P R
atio
Age Group
MA
U.S.
7
groups. Nearly 77 percent of teens in this educational attainment group in Massachusetts worked
in 1999-2000. By 2015-2016, however, their employment-population ratio had declined by nearly
13 percentage points to 65 percent. Teens across the U.S. experienced a similar size decline in
employment over this time period, as well.
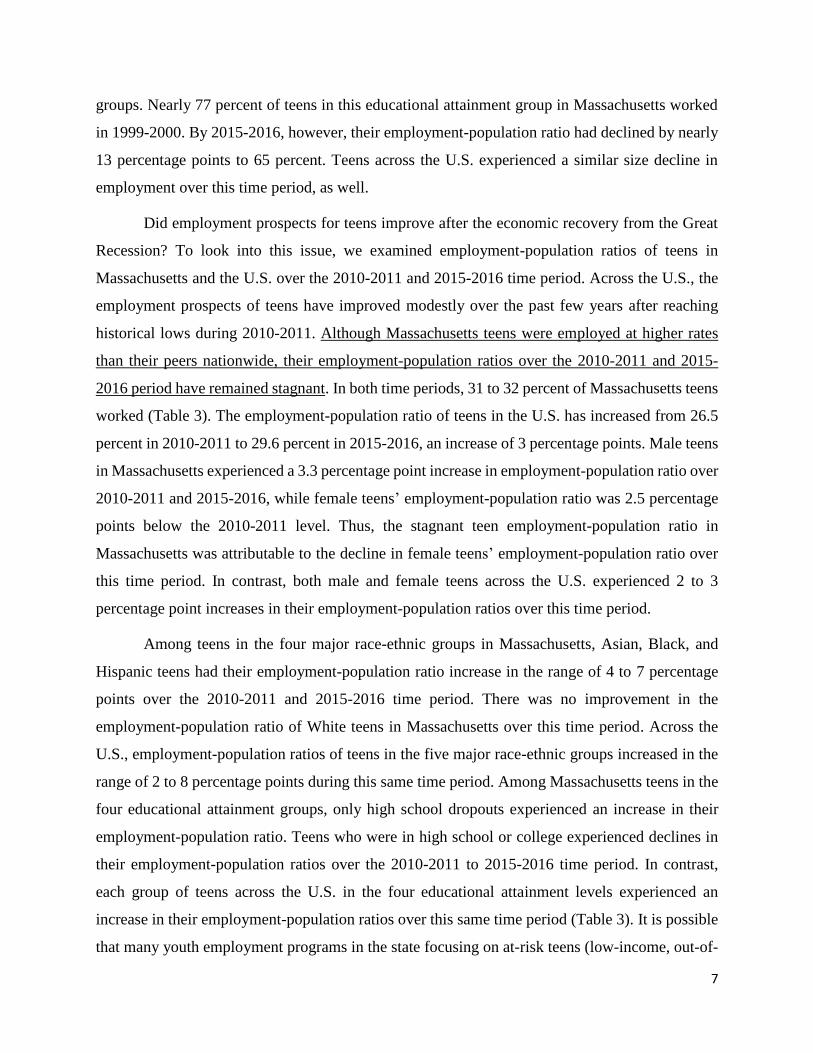
Did employment prospects for teens improve after the economic recovery from the Great
Recession? To look into this issue, we examined employment-population ratios of teens in
Massachusetts and the U.S. over the 2010-2011 and 2015-2016 time period. Across the U.S., the
employment prospects of teens have improved modestly over the past few years after reaching
historical lows during 2010-2011. Although Massachusetts teens were employed at higher rates
than their peers nationwide, their employment-population ratios over the 2010-2011 and 2015-
2016 period have remained stagnant. In both time periods, 31 to 32 percent of Massachusetts teens
worked (Table 3). The employment-population ratio of teens in the U.S. has increased from 26.5
percent in 2010-2011 to 29.6 percent in 2015-2016, an increase of 3 percentage points. Male teens
in Massachusetts experienced a 3.3 percentage point increase in employment-population ratio over
2010-2011 and 2015-2016, while female teens’ employment-population ratio was 2.5 percentage
points below the 2010-2011 level. Thus, the stagnant teen employment-population ratio in
Massachusetts was attributable to the decline in female teens’ employment-population ratio over
this time period. In contrast, both male and female teens across the U.S. experienced 2 to 3
percentage point increases in their employment-population ratios over this time period.
Among teens in the four major race-ethnic groups in Massachusetts, Asian, Black, and
Hispanic teens had their employment-population ratio increase in the range of 4 to 7 percentage
points over the 2010-2011 and 2015-2016 time period. There was no improvement in the
employment-population ratio of White teens in Massachusetts over this time period. Across the
U.S., employment-population ratios of teens in the five major race-ethnic groups increased in the
range of 2 to 8 percentage points during this same time period. Among Massachusetts teens in the
four educational attainment groups, only high school dropouts experienced an increase in their
employment-population ratio. Teens who were in high school or college experienced declines in
their employment-population ratios over the 2010-2011 to 2015-2016 time period. In contrast,
each group of teens across the U.S. in the four educational attainment levels experienced an
increase in their employment-population ratios over this same time period (Table 3). It is possible
that many youth employment programs in the state focusing on at-risk teens (low-income, out-of-
8
school, etc.) and young people of color are having the desired effect in improving or stabilizing
the employment prospects for these young adults.
Table 3:
Trends in Employment-Population Ratios of Teens (16-19 Years Old) in Massachusetts and the
U.S., Selected Years 2010-2011 to 2015-2016 (Annual Averages, in Percent)
Massachusetts U.S.
Group
2010-
2011
2015-
2016 Change
2010-
2011
2015-
2016 Change
All 31.5 31.9 +0.5 26.5 29.6 +3.1
Gender
Male 26.9 30.1 +3.3 25.3 28.8 +3.5
Female 36.2 33.8 -2.5 27.8 30.5 +2.7
Race-Ethnic Group
White 36.5 35.4 -1.1 32.0 34.3 +2.3
Black 23.7 28.8 +5.1 15.6 21.7 +6.1
Asian 14.6 22.2 +7.6 16.6 18.8 +2.2
Hispanic 22.9 26.4 +3.6 21.2 25.7 +4.4
All Other Races -- -- -- 21.2 29.4 +8.2
Educational Attainment Levels
HS Students 23.7 22.7 -1.0 16.2 18.0 +1.8
HS Dropouts 27.3 46.4 +19.1 29.6 35.0 +5.4
College Students 35.8 27.6 -8.3 36.1 37.2 +1.2
Non-Enrolled HS Grad 64.1 65.0 +0.9 53.7 60.2 +6.6
Source: Monthly Current Population Survey, public use files, two year averages 2010-2011 and
2015-2016, U.S. Census Bureau, tabulations by authors.
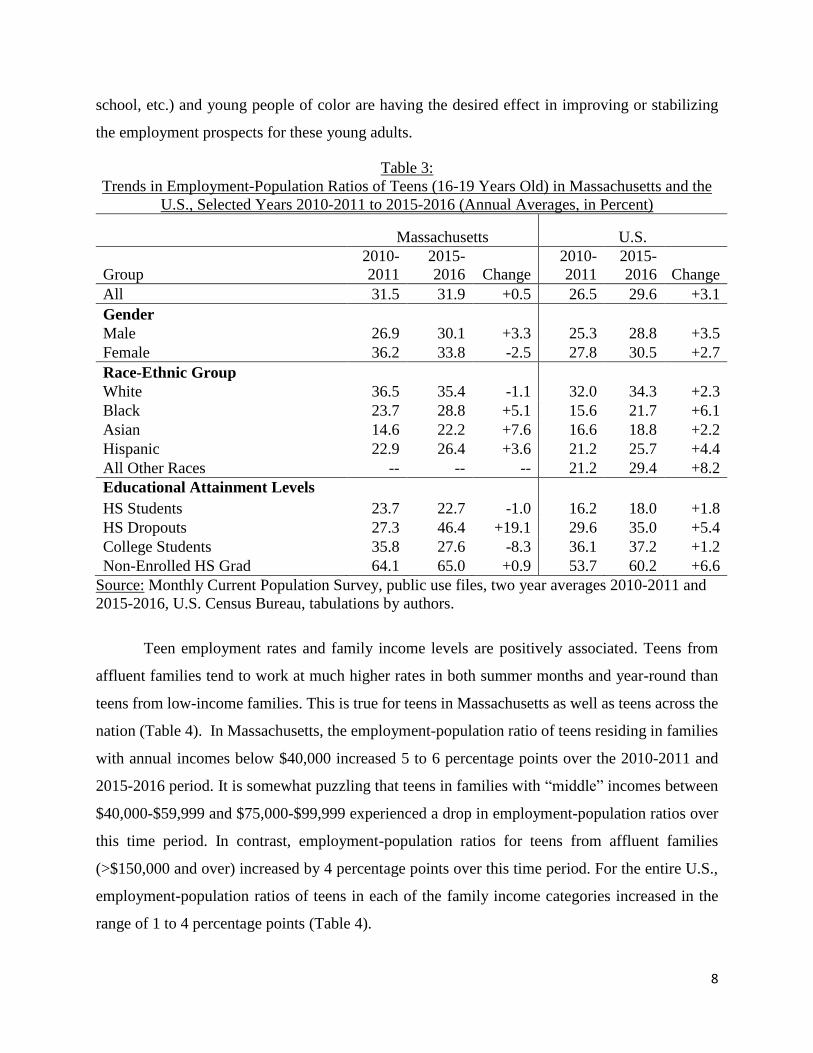
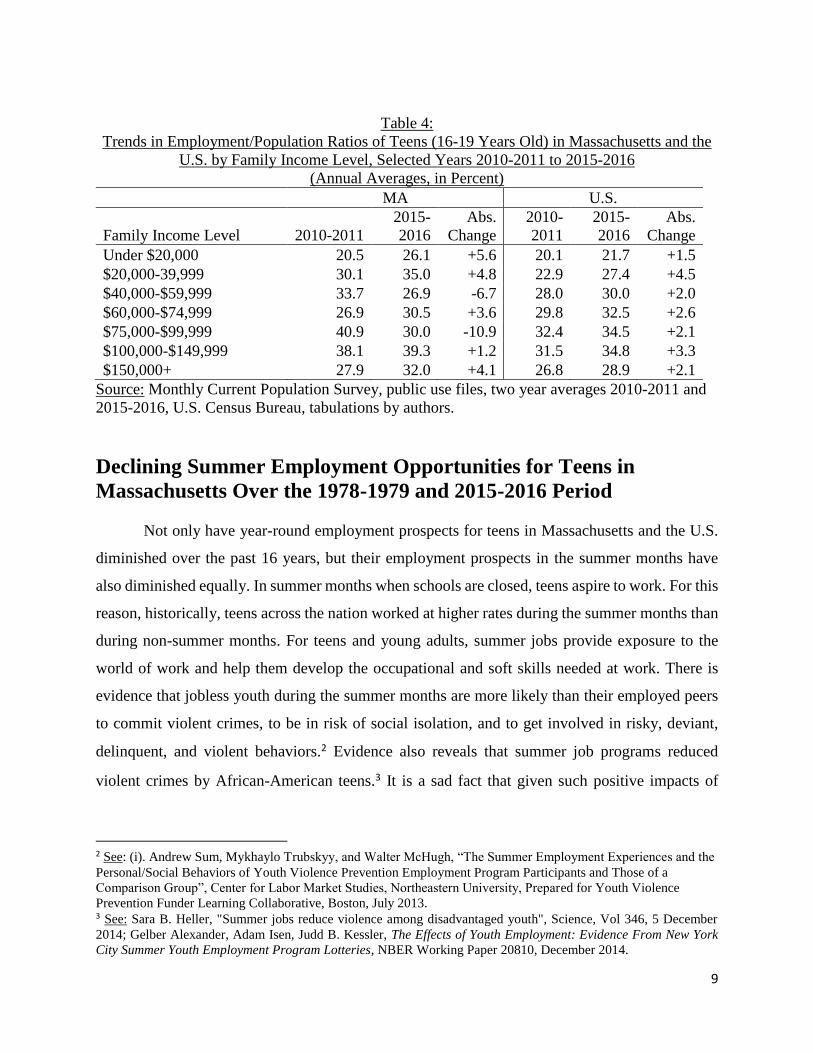
Teen employment rates and family income levels are positively associated. Teens from
affluent families tend to work at much higher rates in both summer months and year-round than
teens from low-income families. This is true for teens in Massachusetts as well as teens across the
nation (Table 4). In Massachusetts, the employment-population ratio of teens residing in families
with annual incomes below $40,000 increased 5 to 6 percentage points over the 2010-2011 and
2015-2016 period. It is somewhat puzzling that teens in families with “middle” incomes between
$40,000-$59,999 and $75,000-$99,999 experienced a drop in employment-population ratios over
this time period. In contrast, employment-population ratios for teens from affluent families
(>$150,000 and over) increased by 4 percentage points over this time period. For the entire U.S.,
employment-population ratios of teens in each of the family income categories increased in the
range of 1 to 4 percentage points (Table 4).
9
Table 4:
Trends in Employment/Population Ratios of Teens (16-19 Years Old) in Massachusetts and the
U.S. by Family Income Level, Selected Years 2010-2011 to 2015-2016
(Annual Averages, in Percent)
MA U.S.
Family Income Level 2010-2011
2015-
2016
Abs.
Change
2010-
2011
2015-
2016
Abs.
Change
Under $20,000 20.5 26.1 +5.6 20.1 21.7 +1.5
$20,000-39,999 30.1 35.0 +4.8 22.9 27.4 +4.5
$40,000-$59,999 33.7 26.9 -6.7 28.0 30.0 +2.0
$60,000-$74,999 26.9 30.5 +3.6 29.8 32.5 +2.6
$75,000-$99,999 40.9 30.0 -10.9 32.4 34.5 +2.1
$100,000-$149,999 38.1 39.3 +1.2 31.5 34.8 +3.3
$150,000+ 27.9 32.0 +4.1 26.8 28.9 +2.1
Source: Monthly Current Population Survey, public use files, two year averages 2010-2011 and
2015-2016, U.S. Census Bureau, tabulations by authors.
Declining Summer Employment Opportunities for Teens in
Massachusetts Over the 1978-1979 and 2015-2016 Period
Not only have year-round employment prospects for teens in Massachusetts and the U.S.
diminished over the past 16 years, but their employment prospects in the summer months have
also diminished equally. In summer months when schools are closed, teens aspire to work. For this
reason, historically, teens across the nation worked at higher rates during the summer months than
during non-summer months. For teens and young adults, summer jobs provide exposure to the
world of work and help them develop the occupational and soft skills needed at work. There is
evidence that jobless youth during the summer months are more likely than their employed peers
to commit violent crimes, to be in risk of social isolation, and to get involved in risky, deviant,
delinquent, and violent behaviors.2 Evidence also reveals that summer job programs reduced
violent crimes by African-American teens.3 It is a sad fact that given such positive impacts of
2 See: (i). Andrew Sum, Mykhaylo Trubskyy, and Walter McHugh, “The Summer Employment Experiences and the
Personal/Social Behaviors of Youth Violence Prevention Employment Program Participants and Those of a
Comparison Group”, Center for Labor Market Studies, Northeastern University, Prepared for Youth Violence
Prevention Funder Learning Collaborative, Boston, July 2013. 3 See: Sara B. Heller, "Summer jobs reduce violence among disadvantaged youth", Science, Vol 346, 5 December
2014; Gelber Alexander, Adam Isen, Judd B. Kessler, The Effects of Youth Employment: Evidence From New York
City Summer Youth Employment Program Lotteries, NBER Working Paper 20810, December 2014.
10
summer employment among teens, the summer job prospects have diminished in Massachusetts
and across the entire U.S. since 2000.
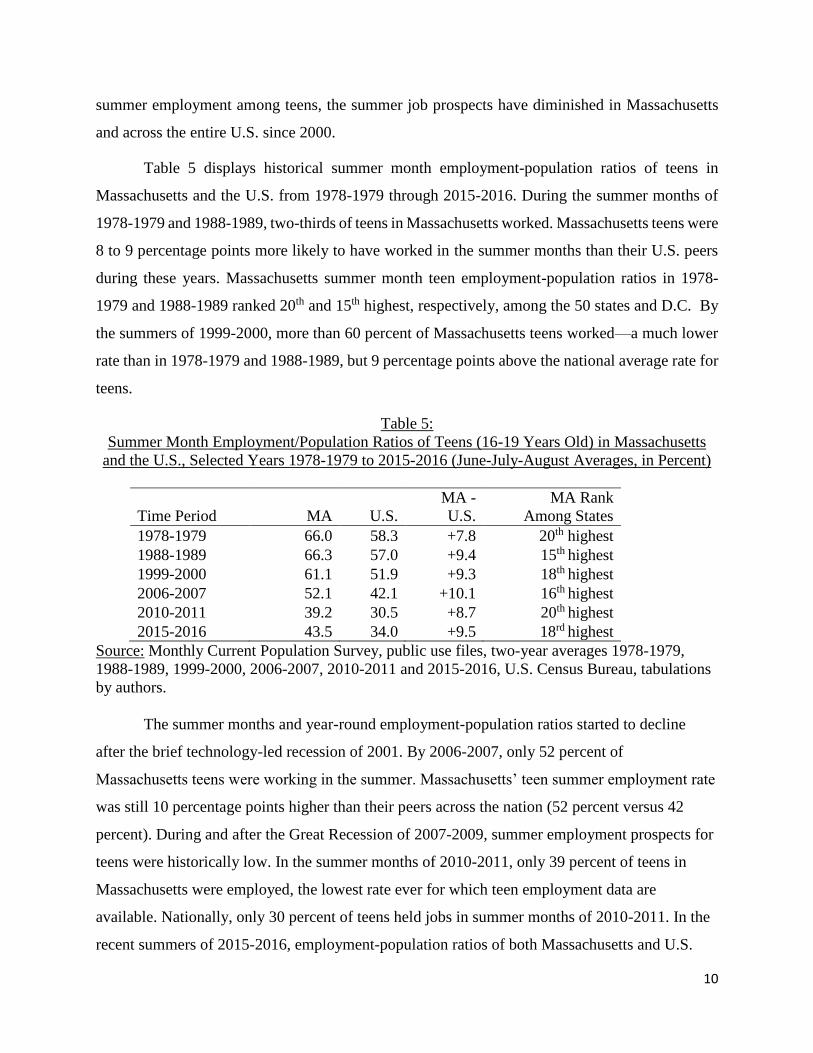
Table 5 displays historical summer month employment-population ratios of teens in
Massachusetts and the U.S. from 1978-1979 through 2015-2016. During the summer months of
1978-1979 and 1988-1989, two-thirds of teens in Massachusetts worked. Massachusetts teens were
8 to 9 percentage points more likely to have worked in the summer months than their U.S. peers
during these years. Massachusetts summer month teen employment-population ratios in 1978-
1979 and 1988-1989 ranked 20th and 15th highest, respectively, among the 50 states and D.C. By
the summers of 1999-2000, more than 60 percent of Massachusetts teens worked—a much lower
rate than in 1978-1979 and 1988-1989, but 9 percentage points above the national average rate for
teens.
Table 5:
Summer Month Employment/Population Ratios of Teens (16-19 Years Old) in Massachusetts
and the U.S., Selected Years 1978-1979 to 2015-2016 (June-July-August Averages, in Percent)
Time Period MA U.S.
MA -
U.S.
MA Rank
Among States
1978-1979 66.0 58.3 +7.8 20th highest
1988-1989 66.3 57.0 +9.4 15th highest
1999-2000 61.1 51.9 +9.3 18th highest
2006-2007 52.1 42.1 +10.1 16th highest
2010-2011 39.2 30.5 +8.7 20th highest
2015-2016 43.5 34.0 +9.5 18rd highest
Source: Monthly Current Population Survey, public use files, two-year averages 1978-1979,
1988-1989, 1999-2000, 2006-2007, 2010-2011 and 2015-2016, U.S. Census Bureau, tabulations
by authors.
The summer months and year-round employment-population ratios started to decline
after the brief technology-led recession of 2001. By 2006-2007, only 52 percent of
Massachusetts teens were working in the summer. Massachusetts’ teen summer employment rate
was still 10 percentage points higher than their peers across the nation (52 percent versus 42
percent). During and after the Great Recession of 2007-2009, summer employment prospects for
teens were historically low. In the summer months of 2010-2011, only 39 percent of teens in
Massachusetts were employed, the lowest rate ever for which teen employment data are
available. Nationally, only 30 percent of teens held jobs in summer months of 2010-2011. In the
recent summers of 2015-2016, employment-population ratios of both Massachusetts and U.S.
11
teens have improved modestly from their lowest levels in 2010-2011. Slightly more than 43
percent of Massachusetts teens were working in the summers of 2015-2016. Massachusetts teens
were 9 percentage points more likely than their peers across the nation to be employed in the
summer (Table 5). Massachusetts summer teen employment-population ratio ranked 18th highest
among the 50 states and D.C.
Employment prospects for teens in Massachusetts for the summer months of 2017 are
expected to be better than earlier years, particularly in the context of an overall low
unemployment rate in the state and tightening labor market. Nationally, more than 31 percent of
teens are projected to work in summer months of 2017.4
4 See annual summer employment outlook report from the Center for Labor Markets and Policy, Drexel University, “2017 Summer Employment Outlook for U.S. Teens”, link….
12
Data Sources and Methodology
Estimates of labor force statistics appearing in this report are based on the monthly Current
Population Survey (CPS), a national household survey, conducted by the U.S. Census Bureau for
the U.S. Department of Labor’s Bureau of Labor Statistics. Every month, the CPS survey is
conducted from the 19th to 25th of the month with a nationally representative sample of
approximately 60,000 households.5 The survey asks household members about their labor force
status in the “reference week”, the week prior to the day of interviews (12th to 19th of the month).
The CPS collects data on the current labor force activities of all household members 16 and older,
including their employment, unemployment status, hours worked, industry and occupation of
employment etc. The CPS survey is the official source of data on the labor force, income, and
poverty in the U.S. The monthly CPS also add supplemental questions to household members in
particular month to get detailed information on various important topics such as the annual social
and economic characteristics, education and school enrollment, food security, fertility and
marriage, tobacco use, computer and internet use, voting and registration, volunteering, veterans
etc. These CPS supplemental topics are known as CPS supplement surveys.
To assess the labor market well-being of the teenage (16-19) population in Massachusetts
and the U.S., we have relied primarily on the employment to population ratio measure in this paper.
The employment to population (E/P) ratio measures the percent of a population group (in this
instance 16 to19 year-olds) in the civilian, non-institutional population that were employed in an
average month during the year. The denominator excludes persons serving in the nation’s armed
forces and inmates of institutions, such as juvenile homes, jails, and prisons. Employment to
population ratio is the best available indicator to gauge the labor market success of teens.
5 For detail, see: U.S. Census Bureau. Current Population Survey: Interviews Reference Manual, April 2015,
retrieved, http://www2.census.gov/programs-surveys/cps/methodology/intman/CPS_Manual_April2015.pdf