Labour Market Profile: Latrobe Valley Region, Gippsland ...mams.rmit.edu.au/b7b301c16oxl.pdf ·...
26
Centre for Sustainable Organisations and Work & Gippsland Trades and Labour Council Inc Labour Market Profile: Latrobe Valley Region, Gippsland, Victoria People and the Economy Report No.1 2015 www.rmit.edu.au/research/csow www.gippslandtlc.com.au
Transcript of Labour Market Profile: Latrobe Valley Region, Gippsland ...mams.rmit.edu.au/b7b301c16oxl.pdf ·...
Centre for Sustainable
Organisations and Work
&
Gippsland Trades and
Labour Council Inc
Labour Market Profile:
Latrobe Valley Region,
Gippsland, Victoria
People and the Economy
Report No.1
2015
www.rmit.edu.au/research/csow
www.gippslandtlc.com.au

The Centre for Sustainable Organisations and Work
The Centre for Sustainable Organisations and Work (CSOW) brings together social science
research expertise across the RMIT College of Business and other areas of the University.
Research in the Centre focusses on people in the context of social, economic and organisational
change in order to produce theoretically informed analyses that lay the foundation for evidence-
based policy and practice. Research carried out by the Centre is interdisciplinary, covering
employment relations, organisational studies, industrial relations, gender studies, globalisation
and logistics, business and labour history, political economy and sociology, with particular
attention given to the Asia Pacific Region.
Gippsland Trades and Labour Council
The aim of the Gippsland Trades and Labour Council Inc (GTLC) is to achieve social and
economic justice for all workers in the Gippsland Region. The GTLC has 24 affiliated unions
that represent approximately 12,000 members. Formed by the GTLC in 2012, the Gippsland
Workers Transition and Support Centre Inc, aims to provide critical early intervention and
continuity of support for workers during the region’s economic and industrial restructuring. It
involves a wide range of people and organisations that are committed to assisting displaced,
disadvantaged and long-term unemployed workers and improving investment and employment
prospects for the region.
This report has been prepared by:
Dr Matthew Walker Research Associate Centre for Sustainable Organisations & Work RMIT University Phone: +61 3 9925 1140 Email: [email protected] Valerie Prokopiv Gippsland Trades & Labour Council Inc Phone: +61 3 5133 7684 Email: [email protected]
Professor Peter Fairbrother Director Centre for Sustainable Organisations & Work RMIT University Phone: +61 3 9925 5105 Email: [email protected]
People and the Economy Report No.1
Labour Market Profile: Latrobe Valley Region, Gippsland, Victoria
People and the Economy is an ongoing series of locality-based reports detailing
socio-demographic, industry and labour market issues and trends.
Availability and Citation: Walker, M., Fairbrother, P. & Prokopiv, V. 2015 Labour Market Profile: Latrobe Valley Region, Gippsland, Victoria, Centre for Sustainable Organisations and Work, RMIT University
www.rmit.edu.au/research/csow www.gippslandtlc.com.au
Centre for Sustainable Organisations and Work
RMIT University
GPO Box 2476
Melbourne, VIC, 3001, Australia
Tel (61) 3 9925 5940
Fax (61) 3 9925 5960
www.rmit.edu.au/research/csow
2015
ISSN 1839-8324
Key Findings
Between the years 2001-2011, population growth was very high in the Shire of Baw Baw,
moderate in Latrobe City, and small in the Shire of Wellington. These three
municipalities comprise the Latrobe Valley Region.
Labour force participation is slightly lower in the Latrobe Valley Region than the
Victorian average. Unemployment is higher than the Victorian average, skewed by
relatively high unemployment in Latrobe City. The unemployment rates are below the
state-average in Baw Baw and Wellington.
Rates of labour force participation are lower among Indigenous residents than among
non-Indigenous residents, while unemployment rates are higher.
Labour force participation is lower among established migrants (arrived before 2002)
than among recent migrants (arrived 2002-2011) or non-migrants. Unemployment rates
are higher among recent migrants, with significant variation by country and region of
origin. A number of recent migrant groups are concentrated in Latrobe City.
The Latrobe Valley Region workforce is ageing. There is substantial variation in the age
profile of the workforce between different industries.
The Latrobe Valley Region has a higher proportion of residents without non-school
qualifications or with certificate-level qualifications. The proportion of residents with
University level qualifications is substantially lower than the state average.
The five industries that individually employ the largest number of people also together
employ more than half the working residents of the Latrobe Valley Region. These are:
Health Care and Social Assistance, Retail Trade, Construction, Manufacturing, and
Education and Training.
The occupational categories that increased most in the 2001-2011 period include
Community and Personal Service Workers, Professionals, Labourers, and Technicians
and Trades Workers. Those occupations that had a minimal increase include Managers
and Machinery Operators and Drivers.
Employment across all industries grew by 18 per cent in the 2001-2011 period. The
industries that increased most include Mining, Construction, Public Administration and
Safety, and Health Care and Social Assistance. Industries that employed fewer people in
2011 than in 2001 include Agriculture, Forestry and Fishing, Wholesale Trade,
Manufacturing, and Information Media and Telecommunications.
The working population of Baw Baw are more outwardly mobile than those of Latrobe
City and Wellington, with a greater proportion of workers (at least a quarter) travelling to
other municipalities for employment.
Average incomes in the Latrobe valley Region are lower than the state average. Incomes
vary considerably by industry of employment. High income industries include Mining
and Electricity, Gas, Water, and Water Services. Incomes are lowest in Accommodation
and Food Services and Retail Trade.
1
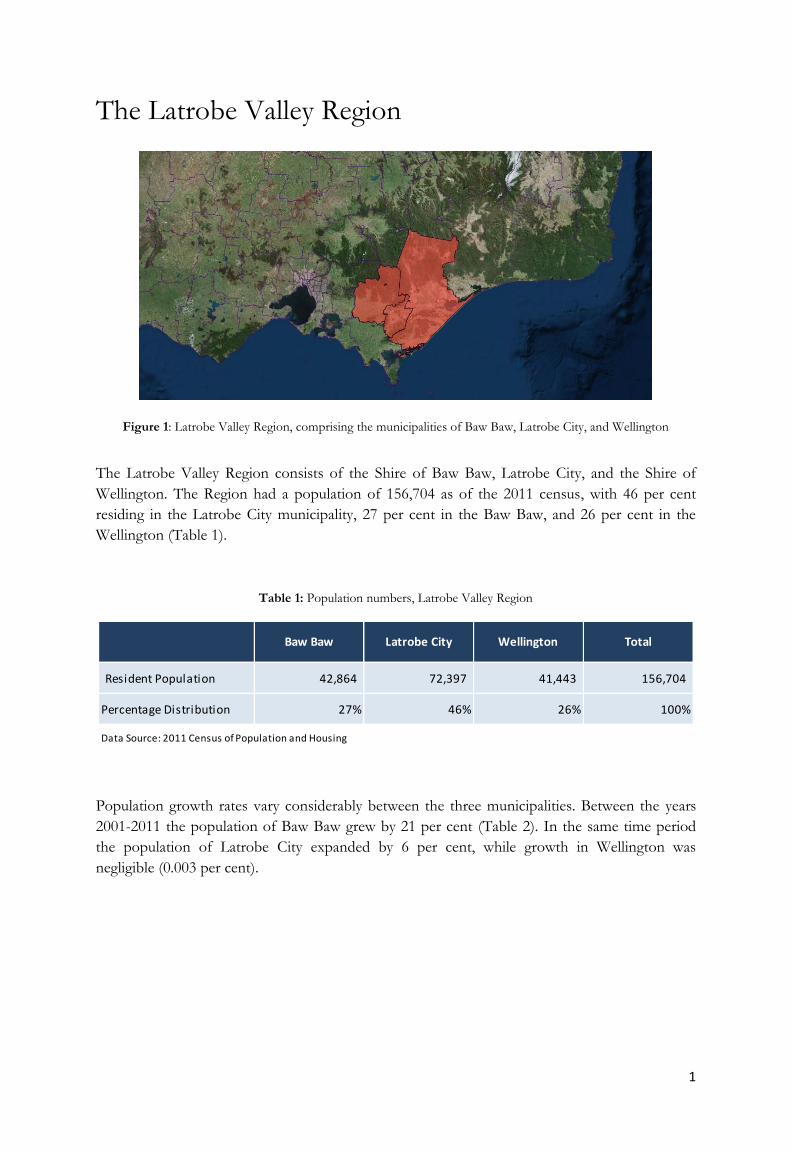
The Latrobe Valley Region
Figure 1: Latrobe Valley Region, comprising the municipalities of Baw Baw, Latrobe City, and Wellington
The Latrobe Valley Region consists of the Shire of Baw Baw, Latrobe City, and the Shire of
Wellington. The Region had a population of 156,704 as of the 2011 census, with 46 per cent
residing in the Latrobe City municipality, 27 per cent in the Baw Baw, and 26 per cent in the
Wellington (Table 1).
Table 1: Population numbers, Latrobe Valley Region
Population growth rates vary considerably between the three municipalities. Between the years
2001-2011 the population of Baw Baw grew by 21 per cent (Table 2). In the same time period
the population of Latrobe City expanded by 6 per cent, while growth in Wellington was
negligible (0.003 per cent).
Resident Population 42,864 72,397 41,443 156,704
Percentage Distribution 27% 46% 26% 100%
Baw Baw Latrobe City Wellington Total
Data Source: 2011 Census of Population and Housing
2
Table 2: Population change, 2001-2011
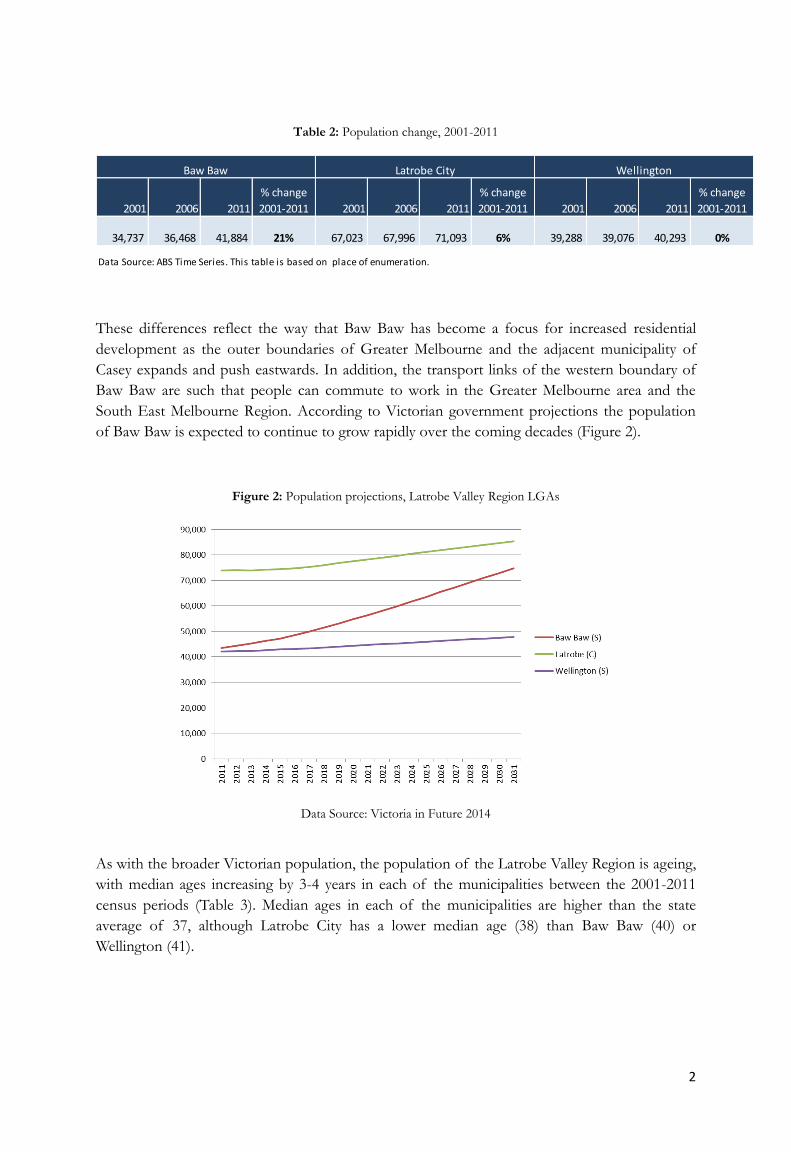
These differences reflect the way that Baw Baw has become a focus for increased residential
development as the outer boundaries of Greater Melbourne and the adjacent municipality of
Casey expands and push eastwards. In addition, the transport links of the western boundary of
Baw Baw are such that people can commute to work in the Greater Melbourne area and the
South East Melbourne Region. According to Victorian government projections the population
of Baw Baw is expected to continue to grow rapidly over the coming decades (Figure 2).
Figure 2: Population projections, Latrobe Valley Region LGAs
Data Source: Victoria in Future 2014
As with the broader Victorian population, the population of the Latrobe Valley Region is ageing,
with median ages increasing by 3-4 years in each of the municipalities between the 2001-2011
census periods (Table 3). Median ages in each of the municipalities are higher than the state
average of 37, although Latrobe City has a lower median age (38) than Baw Baw (40) or
Wellington (41).
2001 2006 2011
% change
2001-2011 2001 2006 2011
% change
2001-2011 2001 2006 2011
% change
2001-2011
34,737 36,468 41,884 21% 67,023 67,996 71,093 6% 39,288 39,076 40,293 0%
Data Source: ABS Time Series. This table is based on place of enumeration.
Baw Baw Latrobe City Wellington
3
Table 3: Median Age
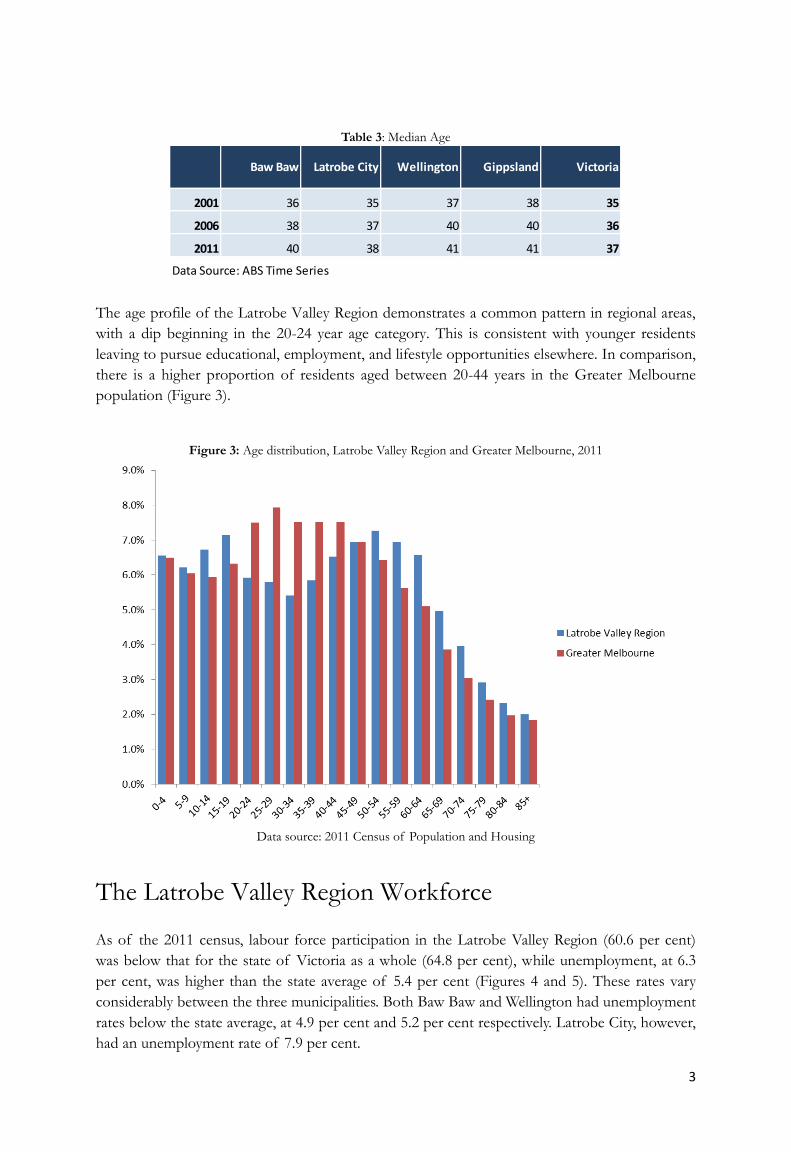
The age profile of the Latrobe Valley Region demonstrates a common pattern in regional areas,
with a dip beginning in the 20-24 year age category. This is consistent with younger residents
leaving to pursue educational, employment, and lifestyle opportunities elsewhere. In comparison,
there is a higher proportion of residents aged between 20-44 years in the Greater Melbourne
population (Figure 3).
Figure 3: Age distribution, Latrobe Valley Region and Greater Melbourne, 2011
Data source: 2011 Census of Population and Housing
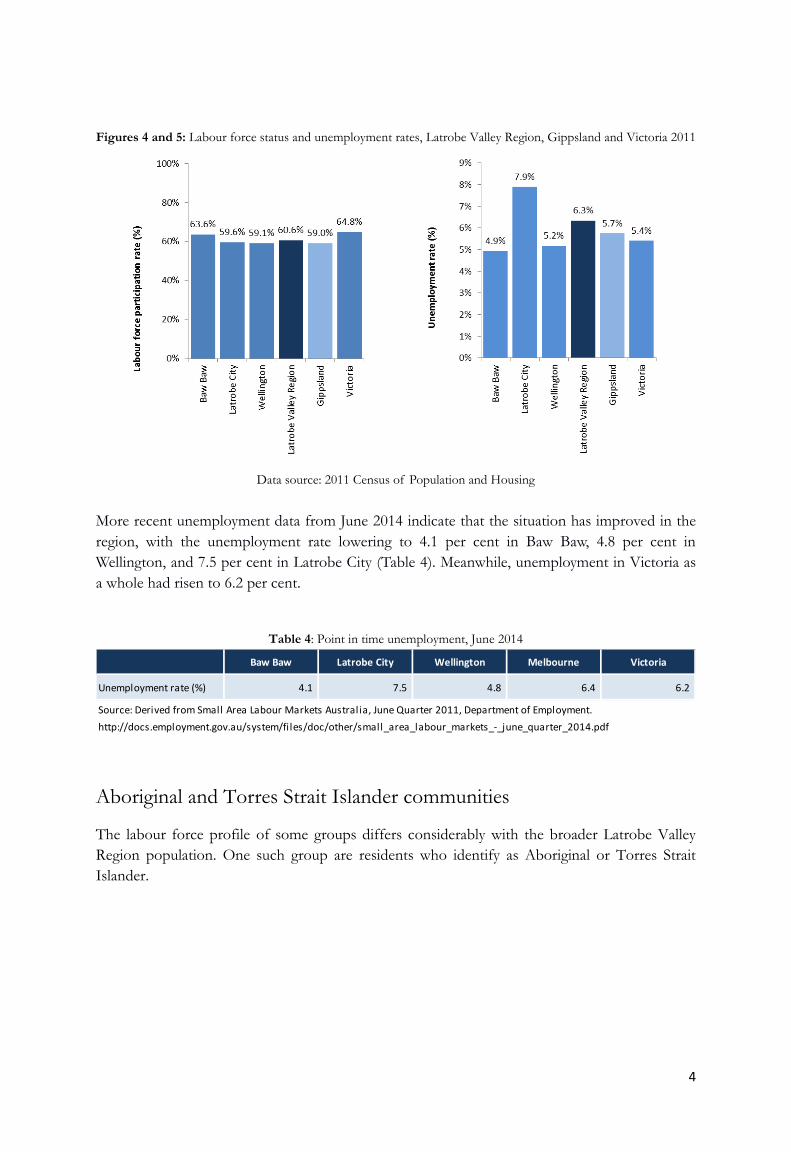
The Latrobe Valley Region Workforce As of the 2011 census, labour force participation in the Latrobe Valley Region (60.6 per cent)
was below that for the state of Victoria as a whole (64.8 per cent), while unemployment, at 6.3
per cent, was higher than the state average of 5.4 per cent (Figures 4 and 5). These rates vary
considerably between the three municipalities. Both Baw Baw and Wellington had unemployment
rates below the state average, at 4.9 per cent and 5.2 per cent respectively. Latrobe City, however,
had an unemployment rate of 7.9 per cent.
Baw Baw Latrobe City Wellington Gippsland Victoria
2001 36 35 37 38 35
2006 38 37 40 40 36
2011 40 38 41 41 37
Data Source: ABS Time Series
4
Figures 4 and 5: Labour force status and unemployment rates, Latrobe Valley Region, Gippsland and Victoria 2011
Data source: 2011 Census of Population and Housing
More recent unemployment data from June 2014 indicate that the situation has improved in the
region, with the unemployment rate lowering to 4.1 per cent in Baw Baw, 4.8 per cent in
Wellington, and 7.5 per cent in Latrobe City (Table 4). Meanwhile, unemployment in Victoria as
a whole had risen to 6.2 per cent.
Table 4: Point in time unemployment, June 2014
Aboriginal and Torres Strait Islander communities
The labour force profile of some groups differs considerably with the broader Latrobe Valley
Region population. One such group are residents who identify as Aboriginal or Torres Strait
Islander.
Baw Baw Latrobe City Wellington Melbourne Victoria
Unemployment rate (%) 4.1 7.5 4.8 6.4 6.2
Source: Derived from Small Area Labour Markets Australia, June Quarter 2011, Department of Employment.
http://docs.employment.gov.au/system/files/doc/other/small_area_labour_markets_-_june_quarter_2014.pdf
5
Table 5: Indigenous population of Latrobe Valley Region and Gippsland
Over one per cent (1.3) of residents (2,050 people) in the Latrobe Valley Region identify as
Aboriginal or Torres Strait Islander, with a slightly higher proportion in Latrobe City (1.5 per
cent) and Wellington (1.4 per cent) than in Baw Baw (0.9 per cent).
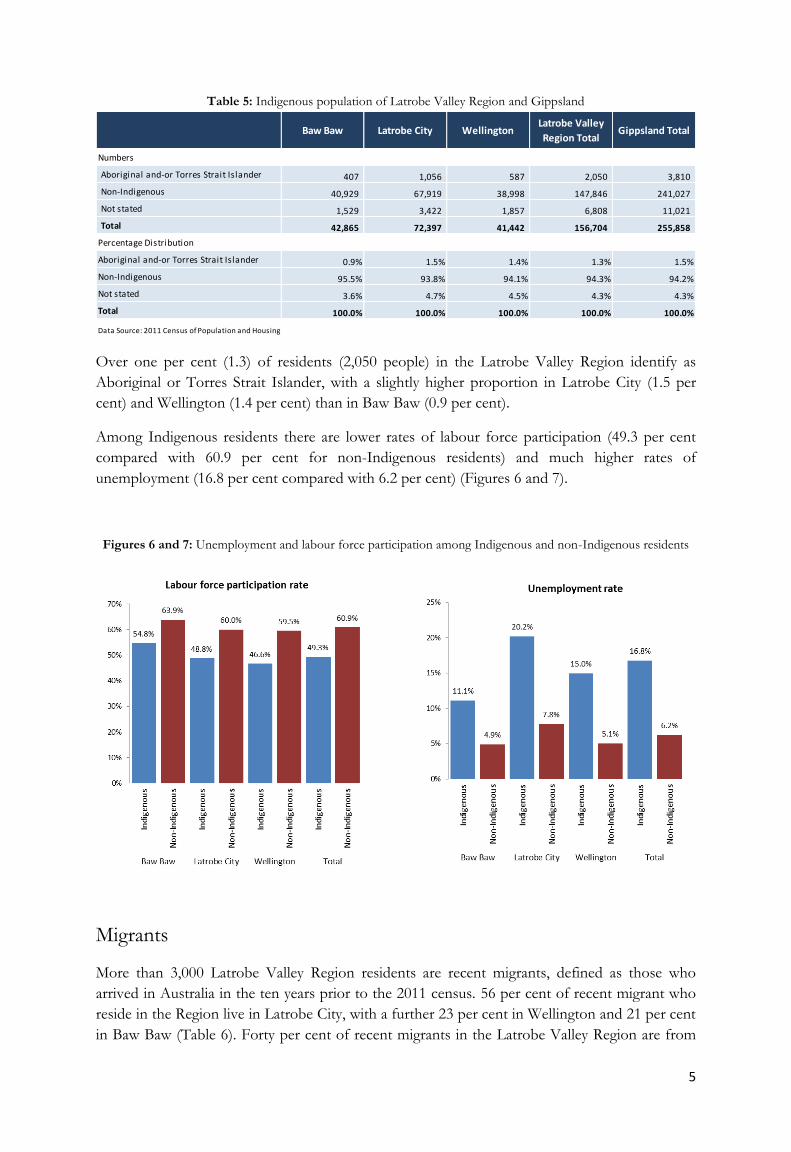
Among Indigenous residents there are lower rates of labour force participation (49.3 per cent
compared with 60.9 per cent for non-Indigenous residents) and much higher rates of
unemployment (16.8 per cent compared with 6.2 per cent) (Figures 6 and 7).
Figures 6 and 7: Unemployment and labour force participation among Indigenous and non-Indigenous residents
Migrants
More than 3,000 Latrobe Valley Region residents are recent migrants, defined as those who
arrived in Australia in the ten years prior to the 2011 census. 56 per cent of recent migrant who
reside in the Region live in Latrobe City, with a further 23 per cent in Wellington and 21 per cent
in Baw Baw (Table 6). Forty per cent of recent migrants in the Latrobe Valley Region are from
Baw Baw Latrobe City WellingtonLatrobe Valley
Region TotalGippsland Total
Numbers
Aboriginal and-or Torres Strait Islander 407 1,056 587 2,050 3,810
Non-Indigenous 40,929 67,919 38,998 147,846 241,027
Not stated 1,529 3,422 1,857 6,808 11,021
Total 42,865 72,397 41,442 156,704 255,858
Percentage Distribution
Aboriginal and-or Torres Strait Islander 0.9% 1.5% 1.4% 1.3% 1.5%
Non-Indigenous 95.5% 93.8% 94.1% 94.3% 94.2%
Not stated 3.6% 4.7% 4.5% 4.3% 4.3%
Total 100.0% 100.0% 100.0% 100.0% 100.0%
Data Source: 2011 Census of Population and Housing
6
Asia, 21 per cent from Europe, 19.4 per cent from Africa and the Middle East, 14.3 per cent
from Oceania, and 5 per cent from the Americas.
Table 6: Place of birth of recent migrants (2002-2011), Latrobe Valley Region
The most common countries of origin for recent migrants are New Zealand, England, India,
China, Philippines, South Africa and Sudan (Table 7). A number of recent migrant groups are
concentrated in Latrobe City, including 95 per cent of those from Sudan, 85 per cent of those
from China, and 90 per cent of those from Bangladesh.
Table 7: Country of birth of recent migrants (2002-2011), Latrobe Valley Region
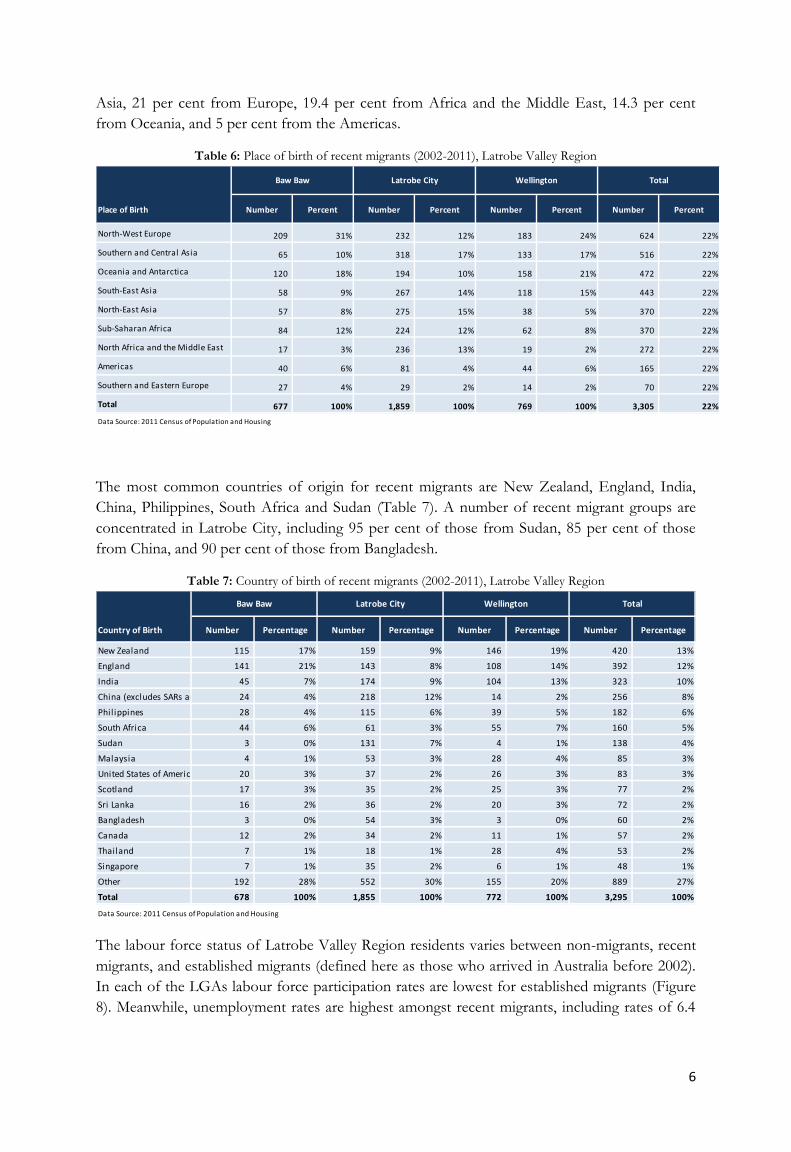
The labour force status of Latrobe Valley Region residents varies between non-migrants, recent
migrants, and established migrants (defined here as those who arrived in Australia before 2002).
In each of the LGAs labour force participation rates are lowest for established migrants (Figure
8). Meanwhile, unemployment rates are highest amongst recent migrants, including rates of 6.4
Place of Birth Number Percent Number Percent Number Percent Number Percent
North-West Europe 209 31% 232 12% 183 24% 624 22%
Southern and Central Asia 65 10% 318 17% 133 17% 516 22%
Oceania and Antarctica 120 18% 194 10% 158 21% 472 22%
South-East Asia 58 9% 267 14% 118 15% 443 22%
North-East Asia 57 8% 275 15% 38 5% 370 22%
Sub-Saharan Africa 84 12% 224 12% 62 8% 370 22%
North Africa and the Middle East 17 3% 236 13% 19 2% 272 22%
Americas 40 6% 81 4% 44 6% 165 22%
Southern and Eastern Europe 27 4% 29 2% 14 2% 70 22%
Total 677 100% 1,859 100% 769 100% 3,305 22%
Data Source: 2011 Census of Population and Housing
Baw Baw Latrobe City Wellington Total
Country of Birth Number Percentage Number Percentage Number Percentage Number Percentage
New Zealand 115 17% 159 9% 146 19% 420 13%
England 141 21% 143 8% 108 14% 392 12%
India 45 7% 174 9% 104 13% 323 10%
China (excludes SARs and Taiwan) 24 4% 218 12% 14 2% 256 8%
Philippines 28 4% 115 6% 39 5% 182 6%
South Africa 44 6% 61 3% 55 7% 160 5%
Sudan 3 0% 131 7% 4 1% 138 4%
Malaysia 4 1% 53 3% 28 4% 85 3%
United States of America 20 3% 37 2% 26 3% 83 3%
Scotland 17 3% 35 2% 25 3% 77 2%
Sri Lanka 16 2% 36 2% 20 3% 72 2%
Bangladesh 3 0% 54 3% 3 0% 60 2%
Canada 12 2% 34 2% 11 1% 57 2%
Thailand 7 1% 18 1% 28 4% 53 2%
Singapore 7 1% 35 2% 6 1% 48 1%
Other 192 28% 552 30% 155 20% 889 27%
Total 678 100% 1,855 100% 772 100% 3,295 100%
Data Source: 2011 Census of Population and Housing
Baw Baw Latrobe City Wellington Total
7
per cent in Baw Baw, 6.9 per cent in Wellington and a much higher figure of 15.7 per cent in
Latrobe City (Figure 9).
Figure 8: Labour force participation rate
Figure 9: Unemployment rate
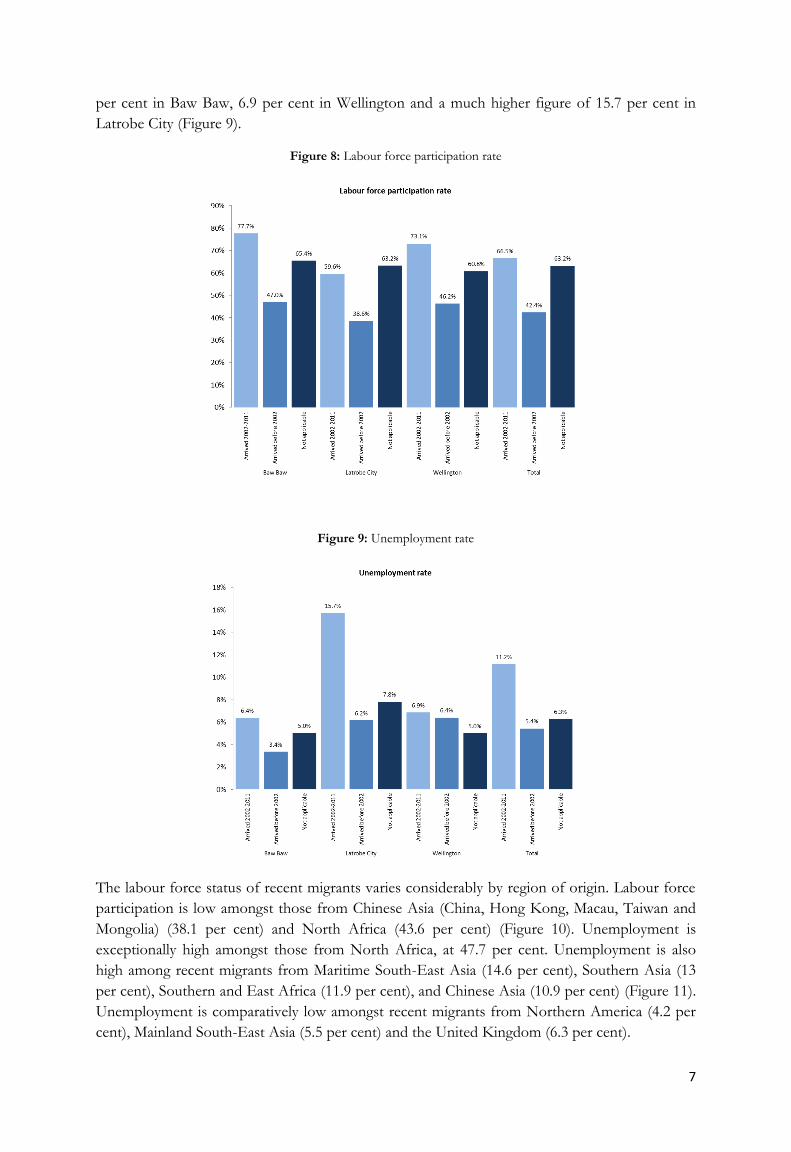
The labour force status of recent migrants varies considerably by region of origin. Labour force
participation is low amongst those from Chinese Asia (China, Hong Kong, Macau, Taiwan and
Mongolia) (38.1 per cent) and North Africa (43.6 per cent) (Figure 10). Unemployment is
exceptionally high amongst those from North Africa, at 47.7 per cent. Unemployment is also
high among recent migrants from Maritime South-East Asia (14.6 per cent), Southern Asia (13
per cent), Southern and East Africa (11.9 per cent), and Chinese Asia (10.9 per cent) (Figure 11).
Unemployment is comparatively low amongst recent migrants from Northern America (4.2 per
cent), Mainland South-East Asia (5.5 per cent) and the United Kingdom (6.3 per cent).
8
Figures 10 and 11: Labour force and unemployment rates, recent migrants by origin, Latrobe Valley Region
Workforce Profile
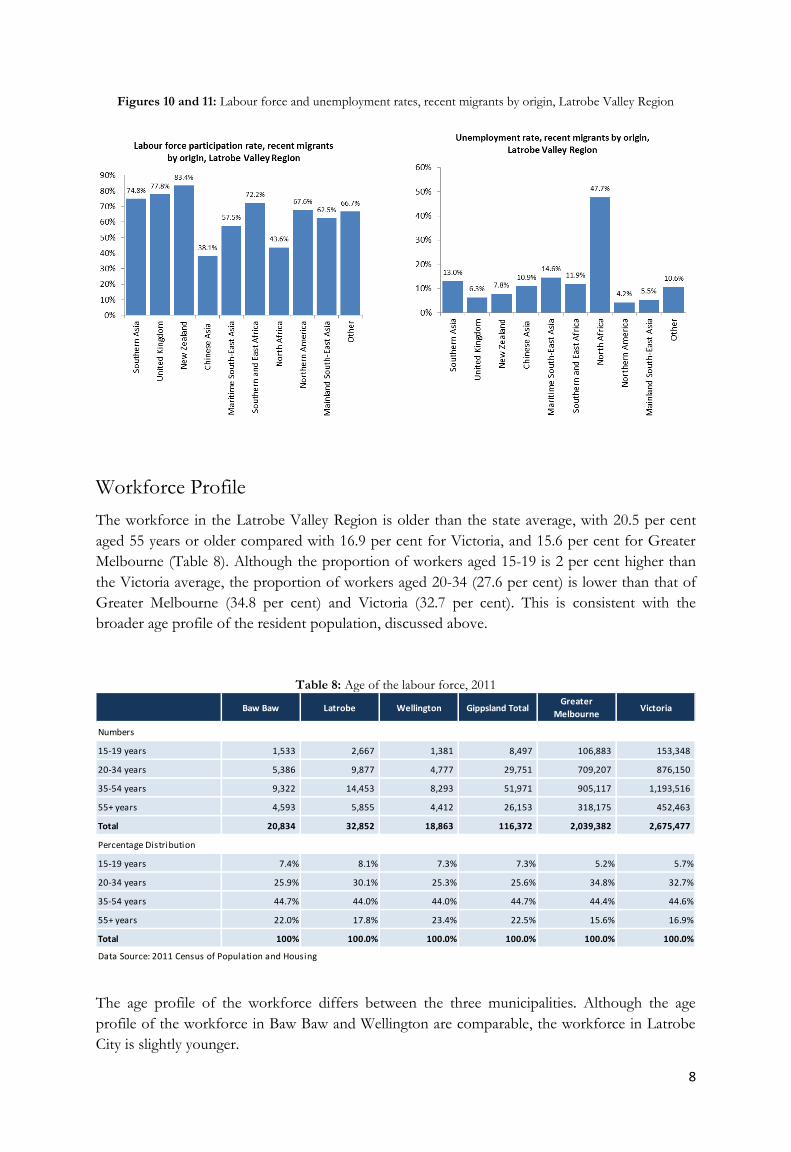
The workforce in the Latrobe Valley Region is older than the state average, with 20.5 per cent
aged 55 years or older compared with 16.9 per cent for Victoria, and 15.6 per cent for Greater
Melbourne (Table 8). Although the proportion of workers aged 15-19 is 2 per cent higher than
the Victoria average, the proportion of workers aged 20-34 (27.6 per cent) is lower than that of
Greater Melbourne (34.8 per cent) and Victoria (32.7 per cent). This is consistent with the
broader age profile of the resident population, discussed above.
Table 8: Age of the labour force, 2011
The age profile of the workforce differs between the three municipalities. Although the age
profile of the workforce in Baw Baw and Wellington are comparable, the workforce in Latrobe
City is slightly younger.
Baw Baw Latrobe Wellington Gippsland TotalGreater
MelbourneVictoria
Numbers
15-19 years 1,533 2,667 1,381 8,497 106,883 153,348
20-34 years 5,386 9,877 4,777 29,751 709,207 876,150
35-54 years 9,322 14,453 8,293 51,971 905,117 1,193,516
55+ years 4,593 5,855 4,412 26,153 318,175 452,463
Total 20,834 32,852 18,863 116,372 2,039,382 2,675,477
Percentage Distribution
15-19 years 7.4% 8.1% 7.3% 7.3% 5.2% 5.7%
20-34 years 25.9% 30.1% 25.3% 25.6% 34.8% 32.7%
35-54 years 44.7% 44.0% 44.0% 44.7% 44.4% 44.6%
55+ years 22.0% 17.8% 23.4% 22.5% 15.6% 16.9%
Total 100% 100.0% 100.0% 100.0% 100.0% 100.0%
Data Source: 2011 Census of Population and Housing
9
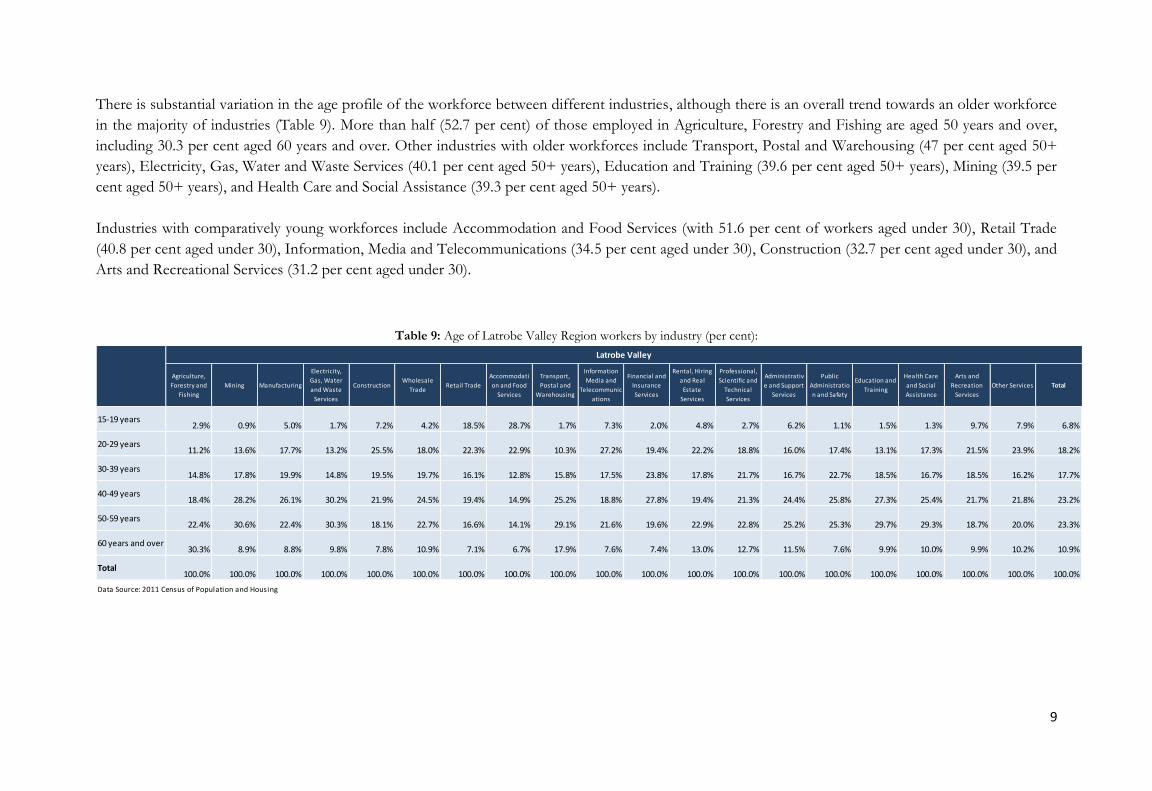
There is substantial variation in the age profile of the workforce between different industries, although there is an overall trend towards an older workforce
in the majority of industries (Table 9). More than half (52.7 per cent) of those employed in Agriculture, Forestry and Fishing are aged 50 years and over,
including 30.3 per cent aged 60 years and over. Other industries with older workforces include Transport, Postal and Warehousing (47 per cent aged 50+
years), Electricity, Gas, Water and Waste Services (40.1 per cent aged 50+ years), Education and Training (39.6 per cent aged 50+ years), Mining (39.5 per
cent aged 50+ years), and Health Care and Social Assistance (39.3 per cent aged 50+ years).
Industries with comparatively young workforces include Accommodation and Food Services (with 51.6 per cent of workers aged under 30), Retail Trade
(40.8 per cent aged under 30), Information, Media and Telecommunications (34.5 per cent aged under 30), Construction (32.7 per cent aged under 30), and
Arts and Recreational Services (31.2 per cent aged under 30).
Table 9: Age of Latrobe Valley Region workers by industry (per cent):
Agriculture,
Forestry and
Fishing
Mining Manufacturing
Electricity,
Gas, Water
and Waste
Services
ConstructionWholesale
TradeRetail Trade
Accommodati
on and Food
Services
Transport,
Postal and
Warehousing
Information
Media and
Telecommunic
ations
Financial and
Insurance
Services
Rental, Hiring
and Real
Estate
Services
Professional,
Scientific and
Technical
Services
Administrativ
e and Support
Services
Public
Administratio
n and Safety
Education and
Training
Health Care
and Social
Assistance
Arts and
Recreation
Services
Other Services Total
15-19 years2.9% 0.9% 5.0% 1.7% 7.2% 4.2% 18.5% 28.7% 1.7% 7.3% 2.0% 4.8% 2.7% 6.2% 1.1% 1.5% 1.3% 9.7% 7.9% 6.8%
20-29 years11.2% 13.6% 17.7% 13.2% 25.5% 18.0% 22.3% 22.9% 10.3% 27.2% 19.4% 22.2% 18.8% 16.0% 17.4% 13.1% 17.3% 21.5% 23.9% 18.2%
30-39 years14.8% 17.8% 19.9% 14.8% 19.5% 19.7% 16.1% 12.8% 15.8% 17.5% 23.8% 17.8% 21.7% 16.7% 22.7% 18.5% 16.7% 18.5% 16.2% 17.7%
40-49 years18.4% 28.2% 26.1% 30.2% 21.9% 24.5% 19.4% 14.9% 25.2% 18.8% 27.8% 19.4% 21.3% 24.4% 25.8% 27.3% 25.4% 21.7% 21.8% 23.2%
50-59 years22.4% 30.6% 22.4% 30.3% 18.1% 22.7% 16.6% 14.1% 29.1% 21.6% 19.6% 22.9% 22.8% 25.2% 25.3% 29.7% 29.3% 18.7% 20.0% 23.3%
60 years and over30.3% 8.9% 8.8% 9.8% 7.8% 10.9% 7.1% 6.7% 17.9% 7.6% 7.4% 13.0% 12.7% 11.5% 7.6% 9.9% 10.0% 9.9% 10.2% 10.9%
Total100.0% 100.0% 100.0% 100.0% 100.0% 100.0% 100.0% 100.0% 100.0% 100.0% 100.0% 100.0% 100.0% 100.0% 100.0% 100.0% 100.0% 100.0% 100.0% 100.0%
Latrobe Valley
Data Source: 2011 Census of Population and Housing
10
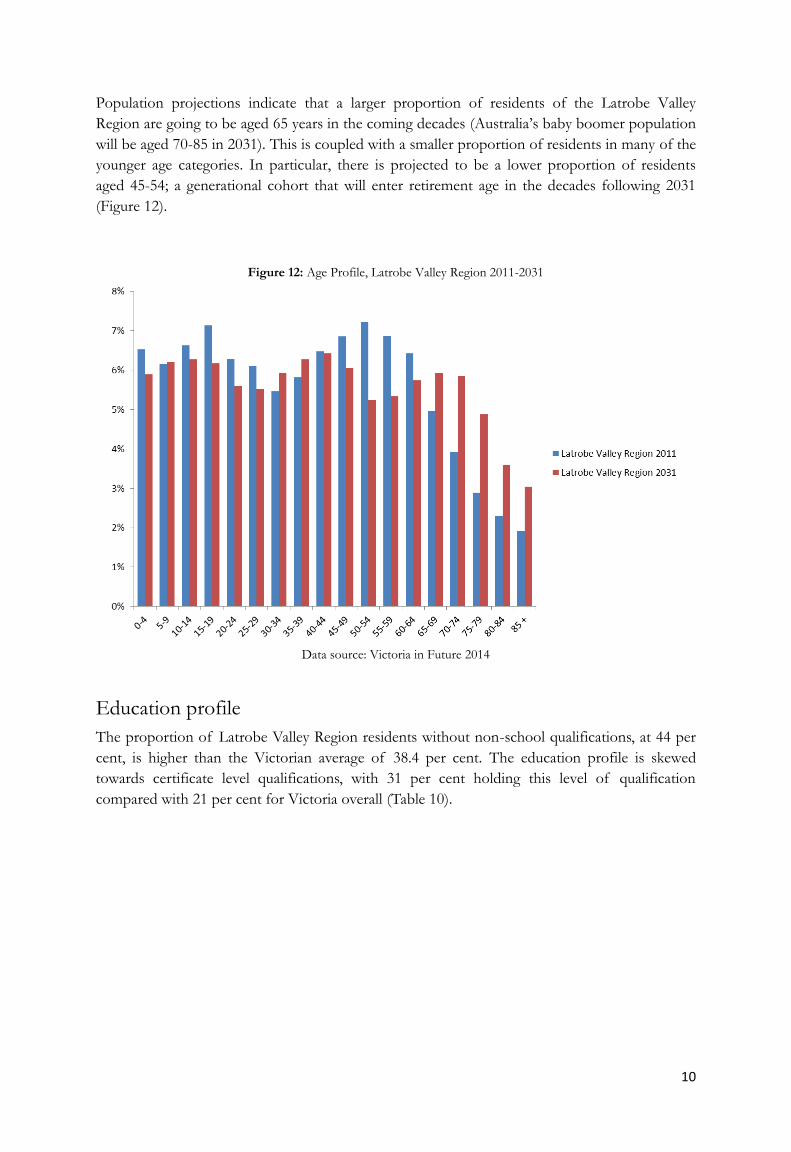
Population projections indicate that a larger proportion of residents of the Latrobe Valley
Region are going to be aged 65 years in the coming decades (Australia’s baby boomer population
will be aged 70-85 in 2031). This is coupled with a smaller proportion of residents in many of the
younger age categories. In particular, there is projected to be a lower proportion of residents
aged 45-54; a generational cohort that will enter retirement age in the decades following 2031
(Figure 12).
Figure 12: Age Profile, Latrobe Valley Region 2011-2031
Data source: Victoria in Future 2014
Education profile
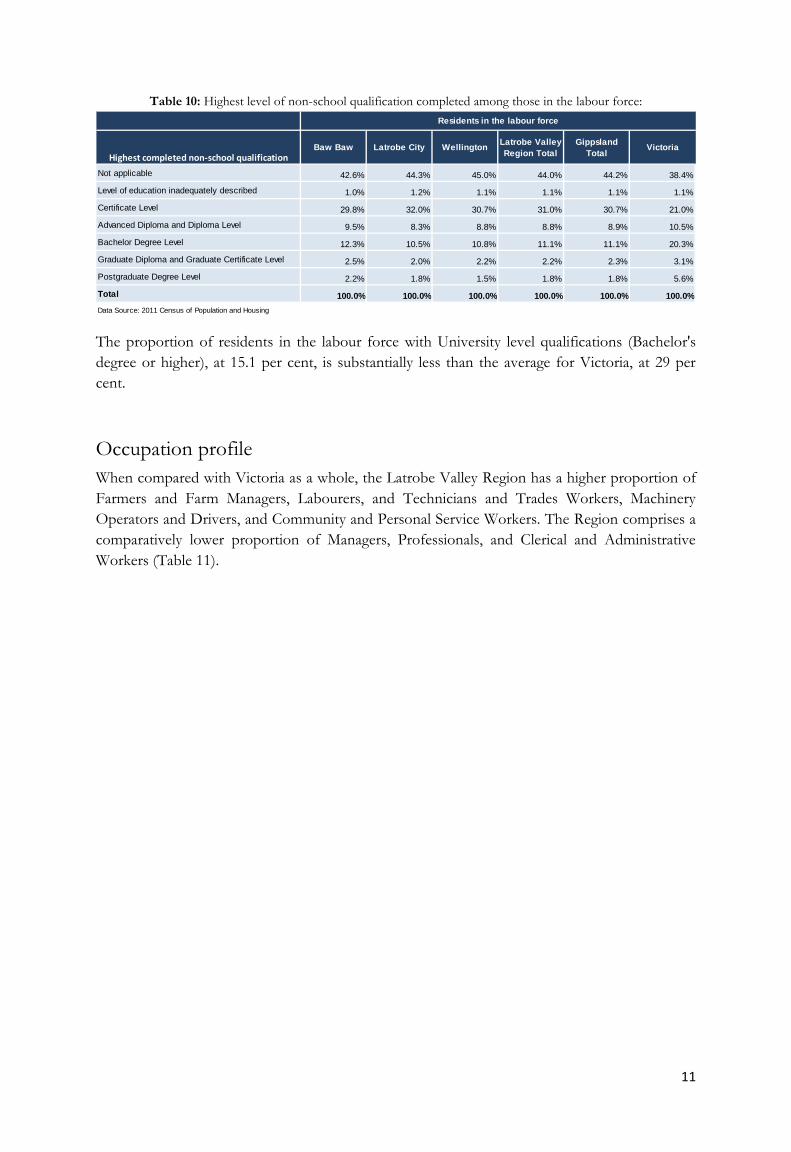
The proportion of Latrobe Valley Region residents without non-school qualifications, at 44 per
cent, is higher than the Victorian average of 38.4 per cent. The education profile is skewed
towards certificate level qualifications, with 31 per cent holding this level of qualification
compared with 21 per cent for Victoria overall (Table 10).
11
Table 10: Highest level of non-school qualification completed among those in the labour force:
The proportion of residents in the labour force with University level qualifications (Bachelor's
degree or higher), at 15.1 per cent, is substantially less than the average for Victoria, at 29 per
cent.
Occupation profile
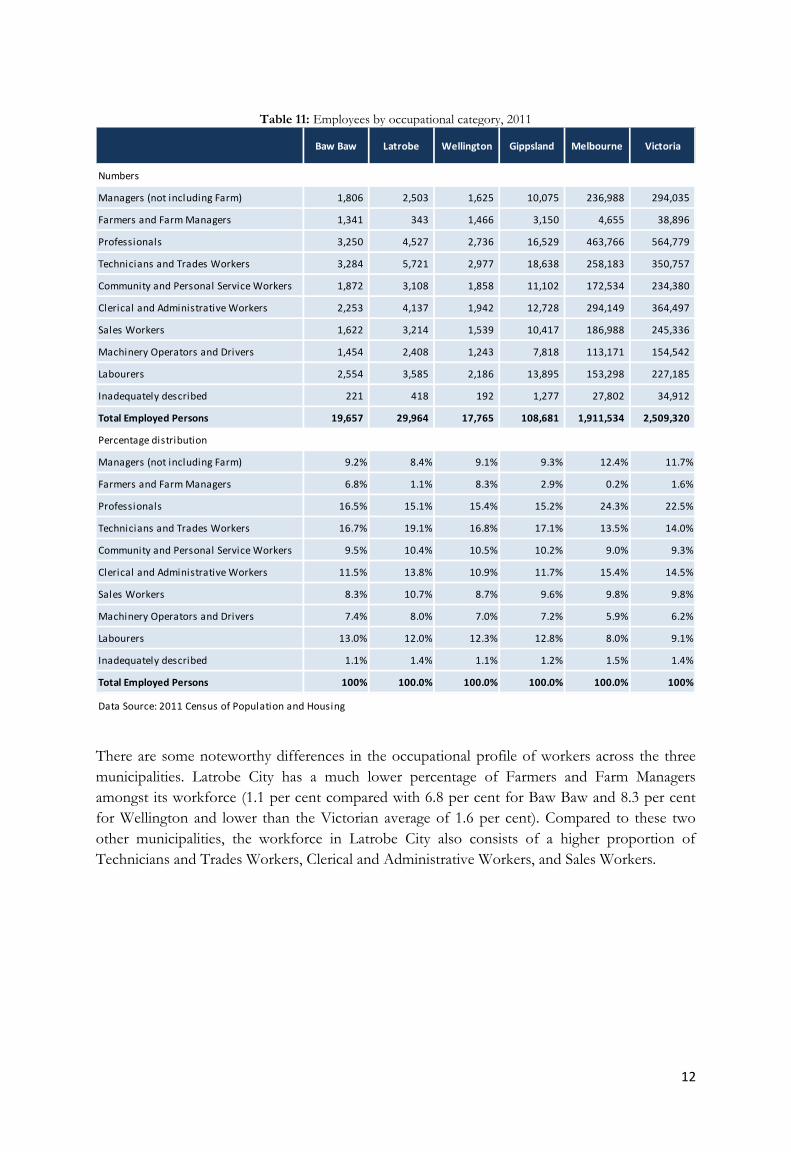
When compared with Victoria as a whole, the Latrobe Valley Region has a higher proportion of
Farmers and Farm Managers, Labourers, and Technicians and Trades Workers, Machinery
Operators and Drivers, and Community and Personal Service Workers. The Region comprises a
comparatively lower proportion of Managers, Professionals, and Clerical and Administrative
Workers (Table 11).
Not applicable 42.6% 44.3% 45.0% 44.0% 44.2% 38.4%
Level of education inadequately described 1.0% 1.2% 1.1% 1.1% 1.1% 1.1%
Certificate Level 29.8% 32.0% 30.7% 31.0% 30.7% 21.0%
Advanced Diploma and Diploma Level 9.5% 8.3% 8.8% 8.8% 8.9% 10.5%
Bachelor Degree Level 12.3% 10.5% 10.8% 11.1% 11.1% 20.3%
Graduate Diploma and Graduate Certificate Level 2.5% 2.0% 2.2% 2.2% 2.3% 3.1%
Postgraduate Degree Level 2.2% 1.8% 1.5% 1.8% 1.8% 5.6%
Total 100.0% 100.0% 100.0% 100.0% 100.0% 100.0%
Data Source: 2011 Census of Population and Housing
Highest completed non-school qualificationBaw Baw Latrobe City Wellington
Latrobe Valley
Region TotalVictoria
Gippsland
Total
Residents in the labour force
12
Table 11: Employees by occupational category, 2011
There are some noteworthy differences in the occupational profile of workers across the three
municipalities. Latrobe City has a much lower percentage of Farmers and Farm Managers
amongst its workforce (1.1 per cent compared with 6.8 per cent for Baw Baw and 8.3 per cent
for Wellington and lower than the Victorian average of 1.6 per cent). Compared to these two
other municipalities, the workforce in Latrobe City also consists of a higher proportion of
Technicians and Trades Workers, Clerical and Administrative Workers, and Sales Workers.
Baw Baw Latrobe Wellington Gippsland Melbourne Victoria
Numbers
Managers (not including Farm) 1,806 2,503 1,625 10,075 236,988 294,035
Farmers and Farm Managers 1,341 343 1,466 3,150 4,655 38,896
Professionals 3,250 4,527 2,736 16,529 463,766 564,779
Technicians and Trades Workers 3,284 5,721 2,977 18,638 258,183 350,757
Community and Personal Service Workers 1,872 3,108 1,858 11,102 172,534 234,380
Clerical and Administrative Workers 2,253 4,137 1,942 12,728 294,149 364,497
Sales Workers 1,622 3,214 1,539 10,417 186,988 245,336
Machinery Operators and Drivers 1,454 2,408 1,243 7,818 113,171 154,542
Labourers 2,554 3,585 2,186 13,895 153,298 227,185
Inadequately described 221 418 192 1,277 27,802 34,912
Total Employed Persons 19,657 29,964 17,765 108,681 1,911,534 2,509,320
Percentage distribution
Managers (not including Farm) 9.2% 8.4% 9.1% 9.3% 12.4% 11.7%
Farmers and Farm Managers 6.8% 1.1% 8.3% 2.9% 0.2% 1.6%
Professionals 16.5% 15.1% 15.4% 15.2% 24.3% 22.5%
Technicians and Trades Workers 16.7% 19.1% 16.8% 17.1% 13.5% 14.0%
Community and Personal Service Workers 9.5% 10.4% 10.5% 10.2% 9.0% 9.3%
Clerical and Administrative Workers 11.5% 13.8% 10.9% 11.7% 15.4% 14.5%
Sales Workers 8.3% 10.7% 8.7% 9.6% 9.8% 9.8%
Machinery Operators and Drivers 7.4% 8.0% 7.0% 7.2% 5.9% 6.2%
Labourers 13.0% 12.0% 12.3% 12.8% 8.0% 9.1%
Inadequately described 1.1% 1.4% 1.1% 1.2% 1.5% 1.4%
Total Employed Persons 100% 100.0% 100.0% 100.0% 100.0% 100%
Data Source: 2011 Census of Population and Housing
13
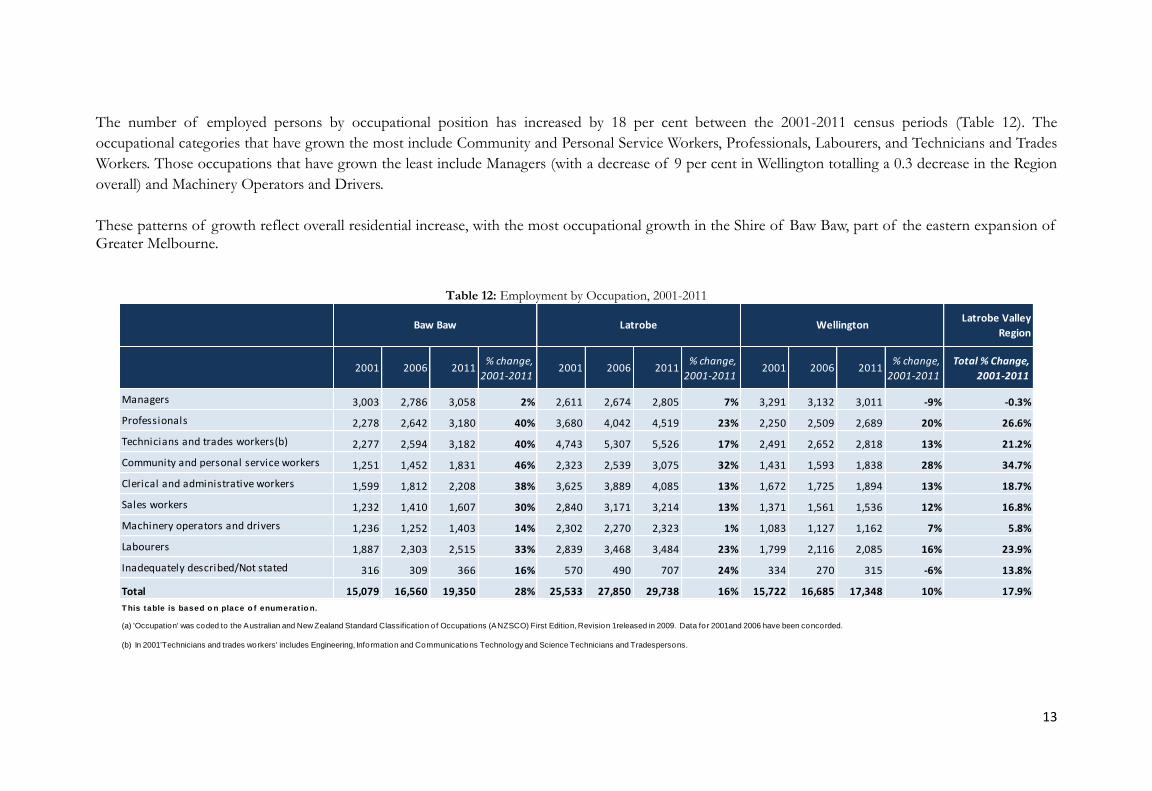
The number of employed persons by occupational position has increased by 18 per cent between the 2001-2011 census periods (Table 12). The
occupational categories that have grown the most include Community and Personal Service Workers, Professionals, Labourers, and Technicians and Trades
Workers. Those occupations that have grown the least include Managers (with a decrease of 9 per cent in Wellington totalling a 0.3 decrease in the Region
overall) and Machinery Operators and Drivers.
These patterns of growth reflect overall residential increase, with the most occupational growth in the Shire of Baw Baw, part of the eastern expansion of Greater Melbourne.
Table 12: Employment by Occupation, 2001-2011
Latrobe Valley
Region
2001 2006 2011% change,
2001-20112001 2006 2011
% change,
2001-20112001 2006 2011
% change,
2001-2011
Total % Change,
2001-2011
Managers 3,003 2,786 3,058 2% 2,611 2,674 2,805 7% 3,291 3,132 3,011 -9% -0.3%
Professionals 2,278 2,642 3,180 40% 3,680 4,042 4,519 23% 2,250 2,509 2,689 20% 26.6%
Technicians and trades workers(b) 2,277 2,594 3,182 40% 4,743 5,307 5,526 17% 2,491 2,652 2,818 13% 21.2%
Community and personal service workers 1,251 1,452 1,831 46% 2,323 2,539 3,075 32% 1,431 1,593 1,838 28% 34.7%
Clerical and administrative workers 1,599 1,812 2,208 38% 3,625 3,889 4,085 13% 1,672 1,725 1,894 13% 18.7%
Sales workers 1,232 1,410 1,607 30% 2,840 3,171 3,214 13% 1,371 1,561 1,536 12% 16.8%
Machinery operators and drivers 1,236 1,252 1,403 14% 2,302 2,270 2,323 1% 1,083 1,127 1,162 7% 5.8%
Labourers 1,887 2,303 2,515 33% 2,839 3,468 3,484 23% 1,799 2,116 2,085 16% 23.9%
Inadequately described/Not stated 316 309 366 16% 570 490 707 24% 334 270 315 -6% 13.8%
Total 15,079 16,560 19,350 28% 25,533 27,850 29,738 16% 15,722 16,685 17,348 10% 17.9%
T his table is based o n place o f enumerat io n.
(a) 'Occupation' was coded to the Australian and New Zealand Standard Classification of Occupations (ANZSCO) First Edition, Revision 1 released in 2009. Data for 2001 and 2006 have been concorded.
(b) In 2001 'Technicians and trades workers' includes Engineering, Information and Communications Technology and Science Technicians and Tradespersons.
Baw Baw Latrobe Wellington
14
Employment by industry
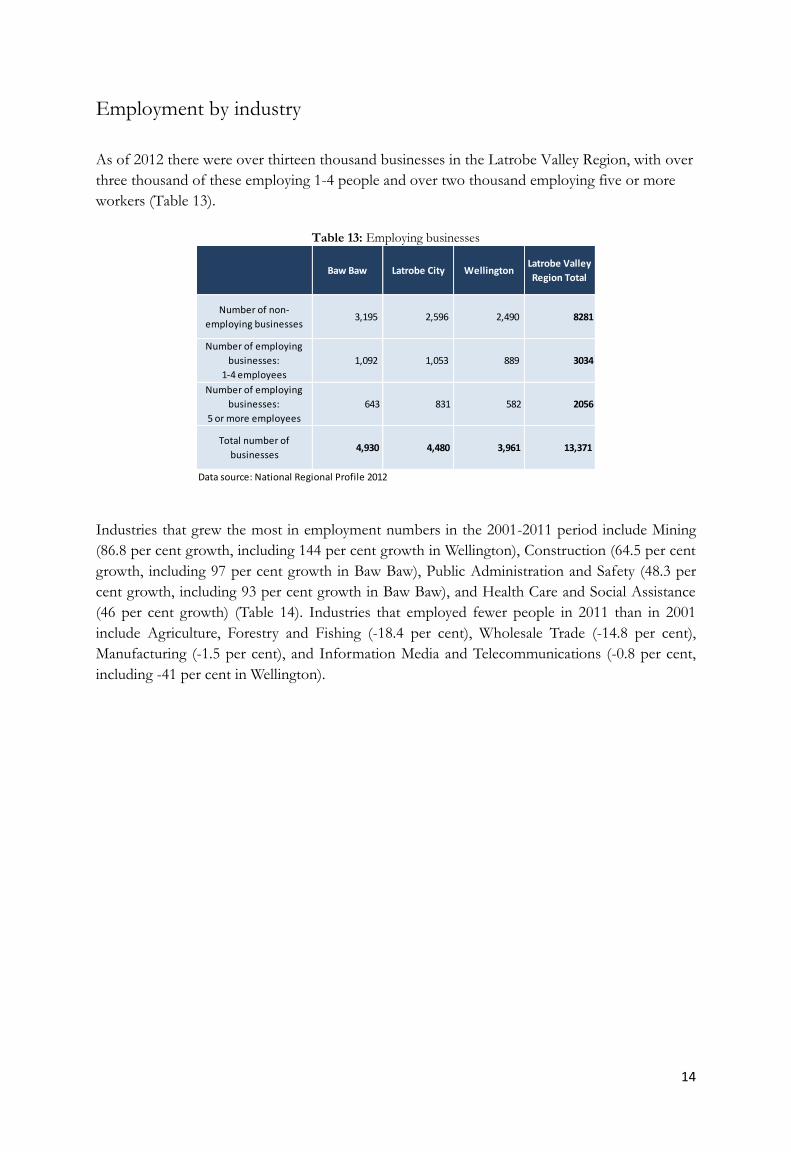
As of 2012 there were over thirteen thousand businesses in the Latrobe Valley Region, with over
three thousand of these employing 1-4 people and over two thousand employing five or more
workers (Table 13).
Table 13: Employing businesses
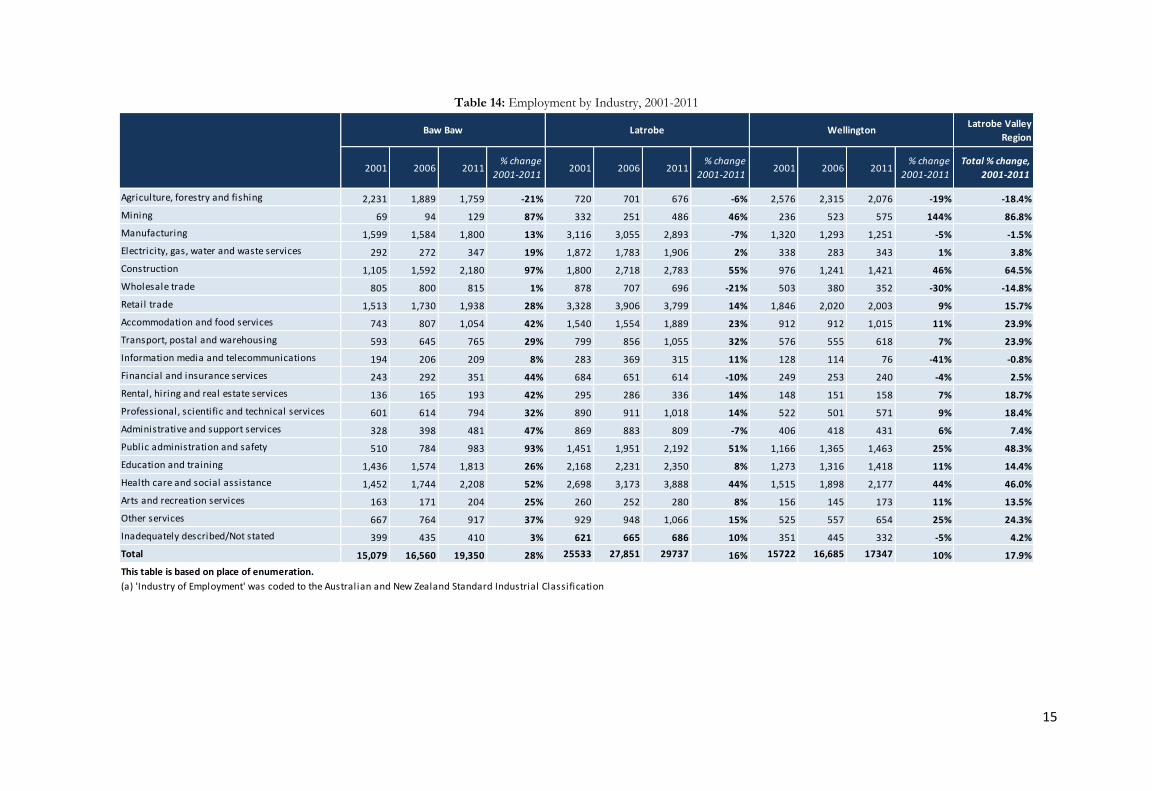
Industries that grew the most in employment numbers in the 2001-2011 period include Mining
(86.8 per cent growth, including 144 per cent growth in Wellington), Construction (64.5 per cent
growth, including 97 per cent growth in Baw Baw), Public Administration and Safety (48.3 per
cent growth, including 93 per cent growth in Baw Baw), and Health Care and Social Assistance
(46 per cent growth) (Table 14). Industries that employed fewer people in 2011 than in 2001
include Agriculture, Forestry and Fishing (-18.4 per cent), Wholesale Trade (-14.8 per cent),
Manufacturing (-1.5 per cent), and Information Media and Telecommunications (-0.8 per cent,
including -41 per cent in Wellington).
Baw Baw Latrobe City WellingtonLatrobe Valley
Region Total
Number of non-
employing businesses3,195 2,596 2,490 8281
Number of employing
businesses:
1-4 employees
1,092 1,053 889 3034
Number of employing
businesses:
5 or more employees
643 831 582 2056
Total number of
businesses 4,930 4,480 3,961 13,371
Data source: National Regional Profile 2012
15
Table 14: Employment by Industry, 2001-2011
Latrobe Valley
Region
2001 2006 2011% change
2001-20112001 2006 2011
% change
2001-20112001 2006 2011
% change
2001-2011
Total % change,
2001-2011
Agriculture, forestry and fishing 2,231 1,889 1,759 -21% 720 701 676 -6% 2,576 2,315 2,076 -19% -18.4%
Mining 69 94 129 87% 332 251 486 46% 236 523 575 144% 86.8%
Manufacturing 1,599 1,584 1,800 13% 3,116 3,055 2,893 -7% 1,320 1,293 1,251 -5% -1.5%
Electricity, gas, water and waste services 292 272 347 19% 1,872 1,783 1,906 2% 338 283 343 1% 3.8%
Construction 1,105 1,592 2,180 97% 1,800 2,718 2,783 55% 976 1,241 1,421 46% 64.5%
Wholesale trade 805 800 815 1% 878 707 696 -21% 503 380 352 -30% -14.8%
Retail trade 1,513 1,730 1,938 28% 3,328 3,906 3,799 14% 1,846 2,020 2,003 9% 15.7%
Accommodation and food services 743 807 1,054 42% 1,540 1,554 1,889 23% 912 912 1,015 11% 23.9%
Transport, postal and warehousing 593 645 765 29% 799 856 1,055 32% 576 555 618 7% 23.9%
Information media and telecommunications 194 206 209 8% 283 369 315 11% 128 114 76 -41% -0.8%
Financial and insurance services 243 292 351 44% 684 651 614 -10% 249 253 240 -4% 2.5%
Rental, hiring and real estate services 136 165 193 42% 295 286 336 14% 148 151 158 7% 18.7%
Professional, scientific and technical services 601 614 794 32% 890 911 1,018 14% 522 501 571 9% 18.4%
Administrative and support services 328 398 481 47% 869 883 809 -7% 406 418 431 6% 7.4%
Public administration and safety 510 784 983 93% 1,451 1,951 2,192 51% 1,166 1,365 1,463 25% 48.3%
Education and training 1,436 1,574 1,813 26% 2,168 2,231 2,350 8% 1,273 1,316 1,418 11% 14.4%
Health care and social assistance 1,452 1,744 2,208 52% 2,698 3,173 3,888 44% 1,515 1,898 2,177 44% 46.0%
Arts and recreation services 163 171 204 25% 260 252 280 8% 156 145 173 11% 13.5%
Other services 667 764 917 37% 929 948 1,066 15% 525 557 654 25% 24.3%
Inadequately described/Not stated 399 435 410 3% 621 665 686 10% 351 445 332 -5% 4.2%
Total 15,079 16,560 19,350 28% 25533 27,851 29737 16% 15722 16,685 17347 10% 17.9%
This table is based on place of enumeration.
WellingtonBaw Baw
(a) 'Industry of Employment' was coded to the Australian and New Zealand Standard Industrial Classification
(ANZSIC) 2006, Revision 1 released in 2008. Data for 2001 and 2006 have been concorded.
Latrobe
16
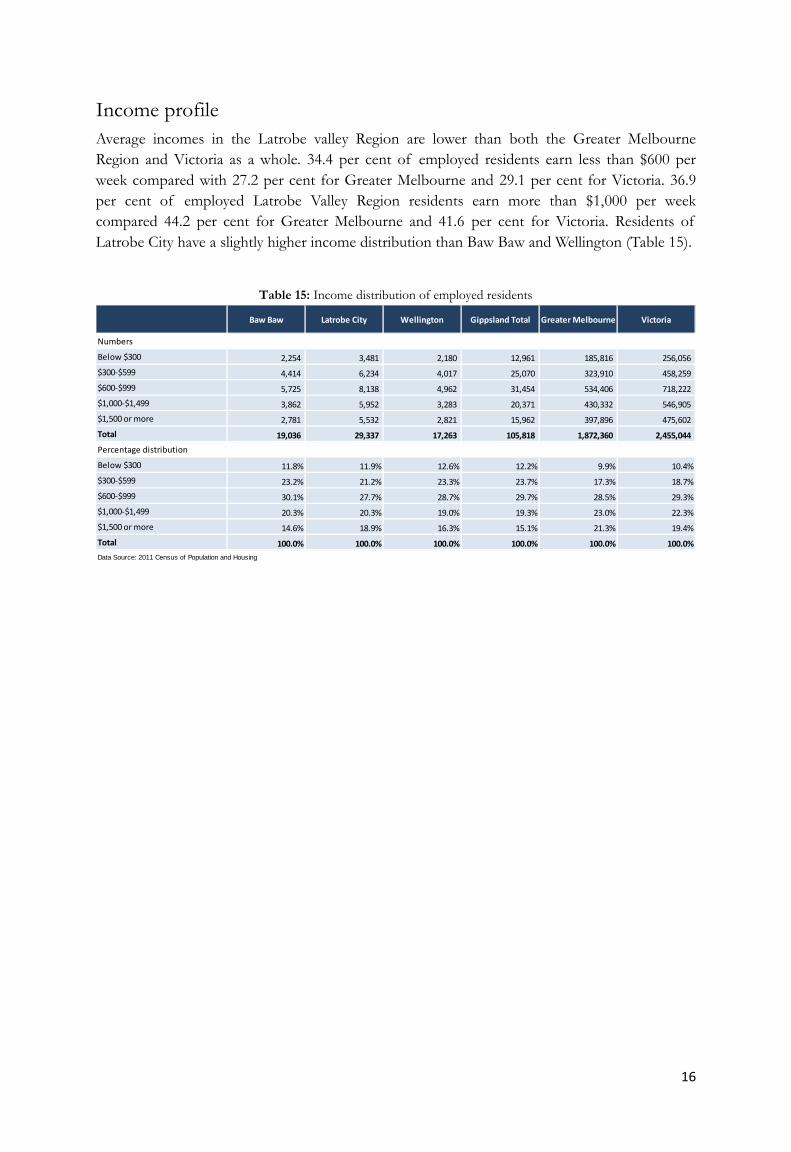
Income profile
Average incomes in the Latrobe valley Region are lower than both the Greater Melbourne
Region and Victoria as a whole. 34.4 per cent of employed residents earn less than $600 per
week compared with 27.2 per cent for Greater Melbourne and 29.1 per cent for Victoria. 36.9
per cent of employed Latrobe Valley Region residents earn more than $1,000 per week
compared 44.2 per cent for Greater Melbourne and 41.6 per cent for Victoria. Residents of
Latrobe City have a slightly higher income distribution than Baw Baw and Wellington (Table 15).
Table 15: Income distribution of employed residents
Baw Baw Latrobe City Wellington Gippsland Total Greater Melbourne Victoria
Numbers
Below $300 2,254 3,481 2,180 12,961 185,816 256,056
$300-$599 4,414 6,234 4,017 25,070 323,910 458,259
$600-$999 5,725 8,138 4,962 31,454 534,406 718,222
$1,000-$1,499 3,862 5,952 3,283 20,371 430,332 546,905
$1,500 or more 2,781 5,532 2,821 15,962 397,896 475,602
Total 19,036 29,337 17,263 105,818 1,872,360 2,455,044
Percentage distribution
Below $300 11.8% 11.9% 12.6% 12.2% 9.9% 10.4%
$300-$599 23.2% 21.2% 23.3% 23.7% 17.3% 18.7%
$600-$999 30.1% 27.7% 28.7% 29.7% 28.5% 29.3%
$1,000-$1,499 20.3% 20.3% 19.0% 19.3% 23.0% 22.3%
$1,500 or more 14.6% 18.9% 16.3% 15.1% 21.3% 19.4%
Total 100.0% 100.0% 100.0% 100.0% 100.0% 100.0%
Data Source: 2011 Census of Population and Housing
17
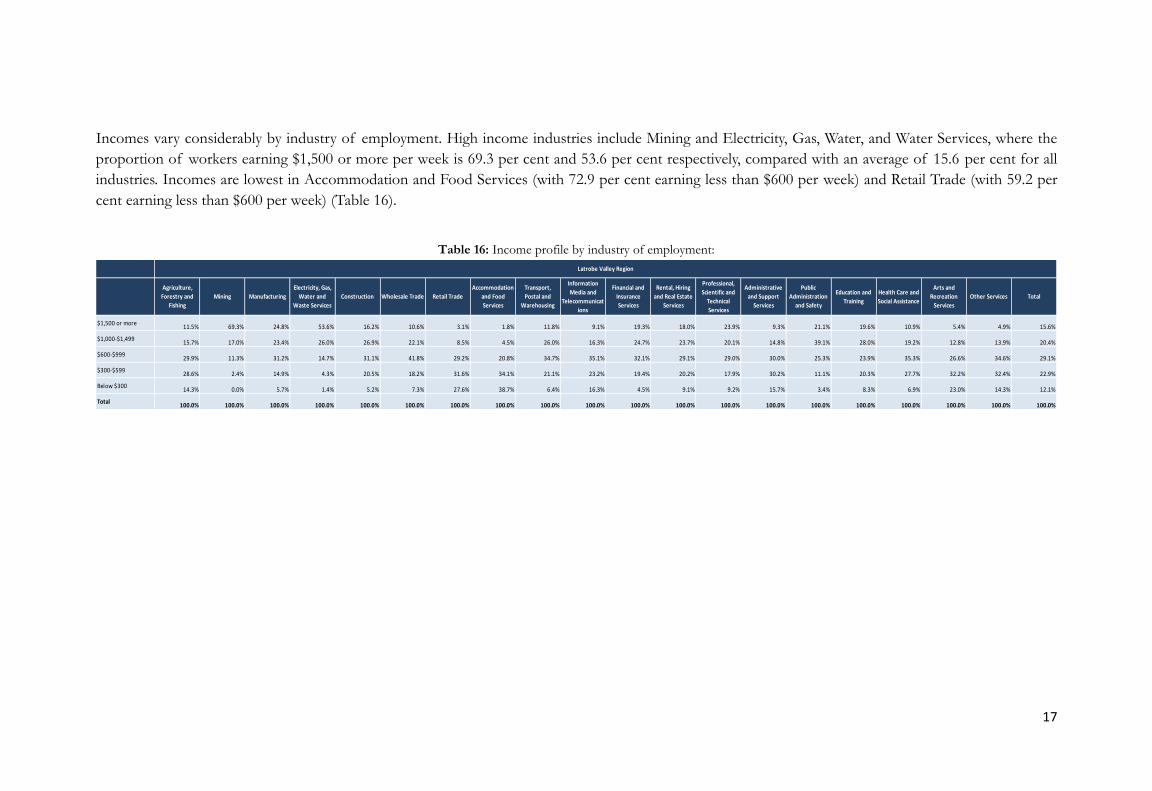
Incomes vary considerably by industry of employment. High income industries include Mining and Electricity, Gas, Water, and Water Services, where the
proportion of workers earning $1,500 or more per week is 69.3 per cent and 53.6 per cent respectively, compared with an average of 15.6 per cent for all
industries. Incomes are lowest in Accommodation and Food Services (with 72.9 per cent earning less than $600 per week) and Retail Trade (with 59.2 per
cent earning less than $600 per week) (Table 16).
Table 16: Income profile by industry of employment:
11.5% 69.3% 24.8% 53.6% 16.2% 10.6% 3.1% 1.8% 11.8% 9.1% 19.3% 18.0% 23.9% 9.3% 21.1% 19.6% 10.9% 5.4% 4.9% 15.6%
15.7% 17.0% 23.4% 26.0% 26.9% 22.1% 8.5% 4.5% 26.0% 16.3% 24.7% 23.7% 20.1% 14.8% 39.1% 28.0% 19.2% 12.8% 13.9% 20.4%
29.9% 11.3% 31.2% 14.7% 31.1% 41.8% 29.2% 20.8% 34.7% 35.1% 32.1% 29.1% 29.0% 30.0% 25.3% 23.9% 35.3% 26.6% 34.6% 29.1%
28.6% 2.4% 14.9% 4.3% 20.5% 18.2% 31.6% 34.1% 21.1% 23.2% 19.4% 20.2% 17.9% 30.2% 11.1% 20.3% 27.7% 32.2% 32.4% 22.9%
14.3% 0.0% 5.7% 1.4% 5.2% 7.3% 27.6% 38.7% 6.4% 16.3% 4.5% 9.1% 9.2% 15.7% 3.4% 8.3% 6.9% 23.0% 14.3% 12.1%
100.0% 100.0% 100.0% 100.0% 100.0% 100.0% 100.0% 100.0% 100.0% 100.0% 100.0% 100.0% 100.0% 100.0% 100.0% 100.0% 100.0% 100.0% 100.0% 100.0%
$300-$599
Below $300
Total
Other Services Total
$1,500 or more
$1,000-$1,499
$600-$999
Administrative
and Support
Services
Public
Administration
and Safety
Education and
Training
Health Care and
Social Assistance
Arts and
Recreation
Services
Latrobe Valley Region
Agriculture,
Forestry and
Fishing
Mining Manufacturing
Electricity, Gas,
Water and
Waste Services
Construction Wholesale Trade Retail Trade
Accommodation
and Food
Services
Transport,
Postal and
Warehousing
Information
Media and
Telecommunicat
ions
Financial and
Insurance
Services
Rental, Hiring
and Real Estate
Services
Professional,
Scientific and
Technical
Services
18
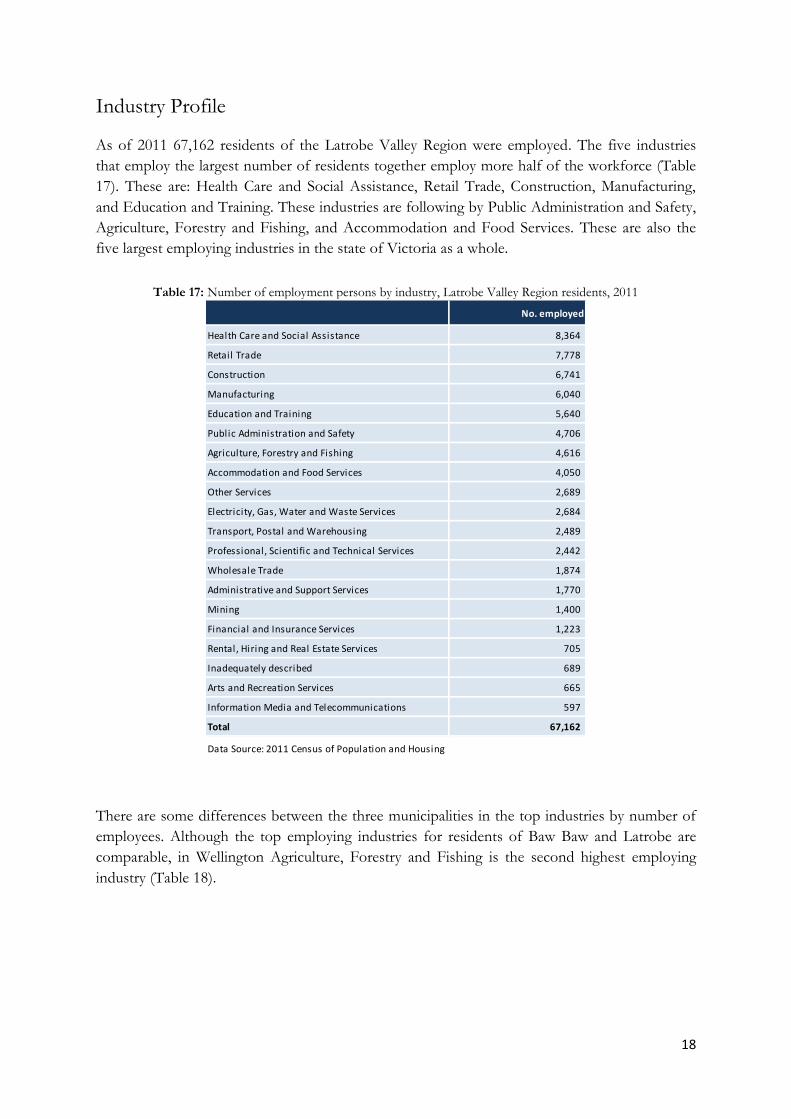
Industry Profile As of 2011 67,162 residents of the Latrobe Valley Region were employed. The five industries
that employ the largest number of residents together employ more half of the workforce (Table
17). These are: Health Care and Social Assistance, Retail Trade, Construction, Manufacturing,
and Education and Training. These industries are following by Public Administration and Safety,
Agriculture, Forestry and Fishing, and Accommodation and Food Services. These are also the
five largest employing industries in the state of Victoria as a whole.
Table 17: Number of employment persons by industry, Latrobe Valley Region residents, 2011
There are some differences between the three municipalities in the top industries by number of
employees. Although the top employing industries for residents of Baw Baw and Latrobe are
comparable, in Wellington Agriculture, Forestry and Fishing is the second highest employing
industry (Table 18).
No. employed
Health Care and Social Assistance 8,364
Retail Trade 7,778
Construction 6,741
Manufacturing 6,040
Education and Training 5,640
Public Administration and Safety 4,706
Agriculture, Forestry and Fishing 4,616
Accommodation and Food Services 4,050
Other Services 2,689
Electricity, Gas, Water and Waste Services 2,684
Transport, Postal and Warehousing 2,489
Professional, Scientific and Technical Services 2,442
Wholesale Trade 1,874
Administrative and Support Services 1,770
Mining 1,400
Financial and Insurance Services 1,223
Rental, Hiring and Real Estate Services 705
Inadequately described 689
Arts and Recreation Services 665
Information Media and Telecommunications 597
Total 67,162
Data Source: 2011 Census of Population and Housing

19
Table 18: Top industries by number of employed residents, 2011
The above tables present the top employing industries of Latrobe Valley Region residents. This
includes those residents who travel outside the Region for employment, and is therefore not an
accurate indicator of actual industry in the Region. In contrast, Place of Work data covers those
who work in the Latrobe Valley Region, and gives a slightly different picture of industry (Table
19).
It should be noted that Place of Work data typically undercounts actual workers in a region and
that this varies by industry. This is because this data includes only those who give both their
occupational information and also give their work address. Categories that add to an undercount
in this data include those who have no fixed work address (this will affect counts in some
industries, such as construction, more than others), and those whose work address is undefined
but can be placed at a broader capital city or state level.
With these caveats in mind, Place of Work data do not show Construction in the top five
employing industries in any of the three municipalities. Agriculture, Forestry and Fishing
becomes the second highest employing industry in Baw Baw, and the highest employing industry
in Wellington.
Table 19: Top industries by number of employees, 2011
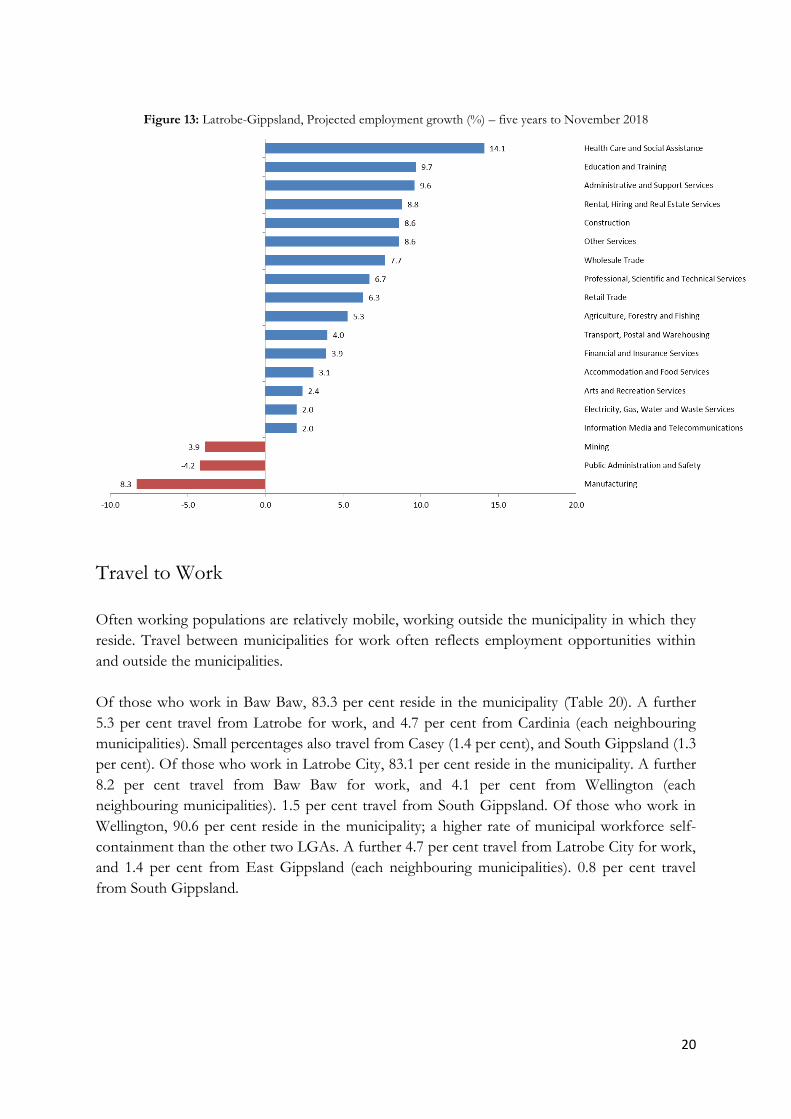
According to projections made by the Department of Employment, over the five years to 2018
Health Care and Social Assistance will have the greatest employment growth of all industries in
the Gippsland Region, at 14.1 per cent. This is followed by Education and Training (9.7 per
cent), Administration and Support Services (9.6 per cent), Rental, Hiring and Real Estate
Services (8.8. per cent), and Construction (8.6 per cent). Employment in some industries is
projected to fall in this time period, including Manufacturing (-8.3 per cent), Public
Administration and Safety (-4.2 per cent) and Mining (-3.9 per cent) (Figure 13).
Rank Baw Baw Latrobe Wellington Gippsland Victoria
1 Health Care and Social Assistance Health Care and Social Assistance Health Care and Social Assistance Health Care and Social Assistance Health Care and Social Assistance
2 Construction Retail Trade Agriculture, Forestry and Fishing Retail Trade Retail Trade
3 Retail Trade Construction Retail Trade Construction Manufacturing
4 Manufacturing Manufacturing Construction Manufacturing Construction
5 Education and Training Education and Training Public Administration and Safety Education and Training Education and Training
Data Source: 2011 Census of Population and Housing
Rank Baw Baw Latrobe Wellington Gippsland Victoria
1 Health Care and Social Assistance Health Care and Social Assistance Agriculture, Forestry and Fishing Health Care and Social Assistance Health Care and Social Assistance
2 Agriculture, Forestry and Fishing Retail Trade Health Care and Social Assistance Retail Trade Retail Trade
3 Retail Trade Manufacturing Retail Trade Construction Manufacturing
4 Education and Training Education and Training Public Administration and Safety Education and Training Construction
5 Manufacturing Public Administration and Safety Education and Training Manufacturing Education and Training
Data Source: 2011 Census of Population and Housing
20
Figure 13: Latrobe-Gippsland, Projected employment growth (%) – five years to November 2018
Travel to Work
Often working populations are relatively mobile, working outside the municipality in which they
reside. Travel between municipalities for work often reflects employment opportunities within
and outside the municipalities.
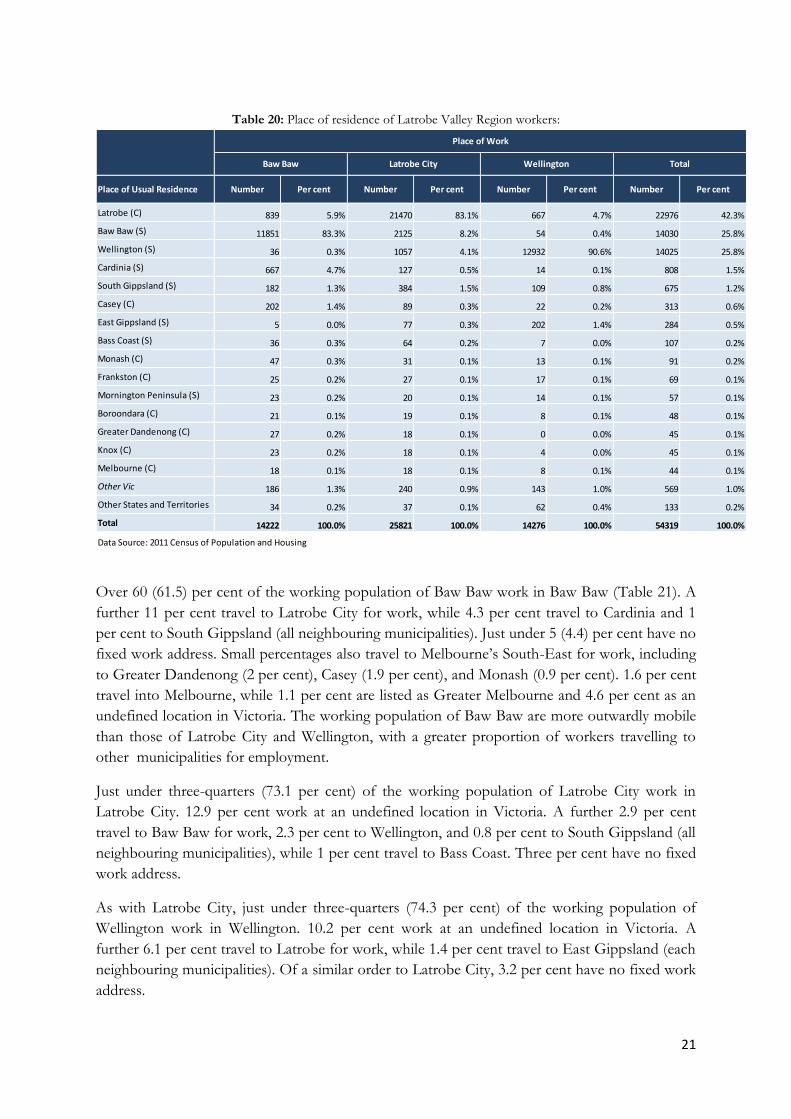
Of those who work in Baw Baw, 83.3 per cent reside in the municipality (Table 20). A further
5.3 per cent travel from Latrobe for work, and 4.7 per cent from Cardinia (each neighbouring
municipalities). Small percentages also travel from Casey (1.4 per cent), and South Gippsland (1.3
per cent). Of those who work in Latrobe City, 83.1 per cent reside in the municipality. A further
8.2 per cent travel from Baw Baw for work, and 4.1 per cent from Wellington (each
neighbouring municipalities). 1.5 per cent travel from South Gippsland. Of those who work in
Wellington, 90.6 per cent reside in the municipality; a higher rate of municipal workforce self-
containment than the other two LGAs. A further 4.7 per cent travel from Latrobe City for work,
and 1.4 per cent from East Gippsland (each neighbouring municipalities). 0.8 per cent travel
from South Gippsland.
21
Table 20: Place of residence of Latrobe Valley Region workers:
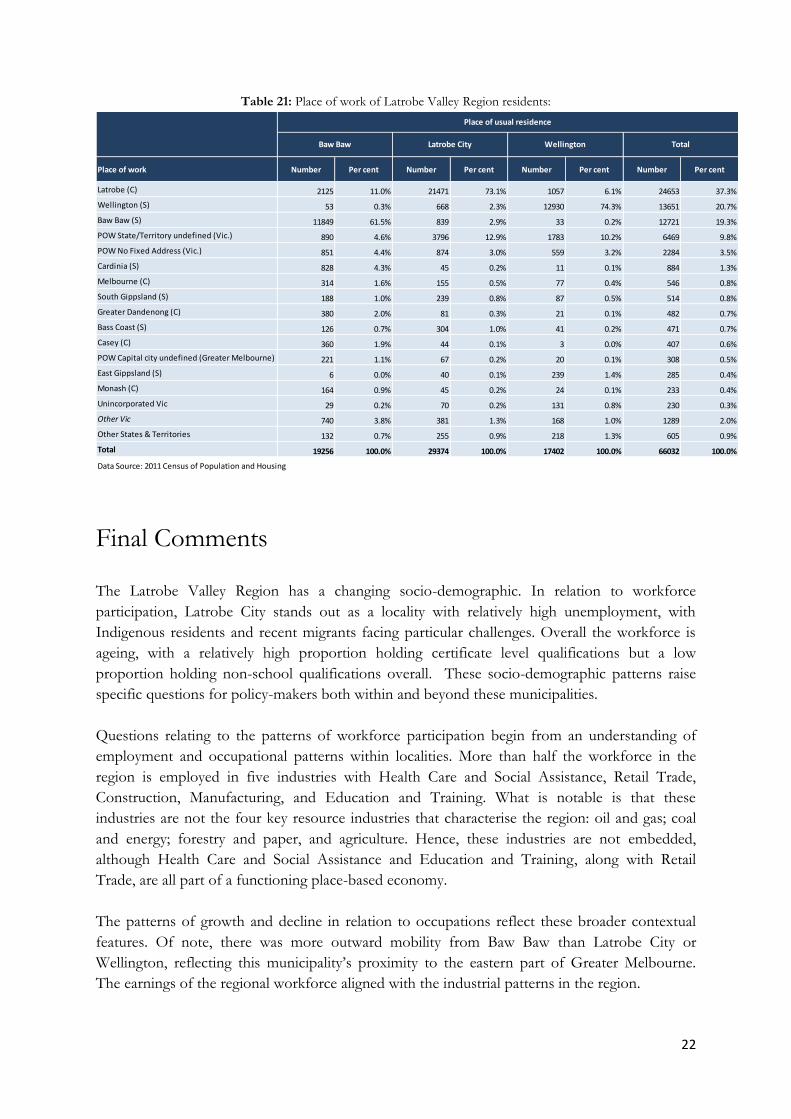
Over 60 (61.5) per cent of the working population of Baw Baw work in Baw Baw (Table 21). A
further 11 per cent travel to Latrobe City for work, while 4.3 per cent travel to Cardinia and 1
per cent to South Gippsland (all neighbouring municipalities). Just under 5 (4.4) per cent have no
fixed work address. Small percentages also travel to Melbourne’s South-East for work, including
to Greater Dandenong (2 per cent), Casey (1.9 per cent), and Monash (0.9 per cent). 1.6 per cent
travel into Melbourne, while 1.1 per cent are listed as Greater Melbourne and 4.6 per cent as an
undefined location in Victoria. The working population of Baw Baw are more outwardly mobile
than those of Latrobe City and Wellington, with a greater proportion of workers travelling to
other municipalities for employment.
Just under three-quarters (73.1 per cent) of the working population of Latrobe City work in
Latrobe City. 12.9 per cent work at an undefined location in Victoria. A further 2.9 per cent
travel to Baw Baw for work, 2.3 per cent to Wellington, and 0.8 per cent to South Gippsland (all
neighbouring municipalities), while 1 per cent travel to Bass Coast. Three per cent have no fixed
work address.
As with Latrobe City, just under three-quarters (74.3 per cent) of the working population of
Wellington work in Wellington. 10.2 per cent work at an undefined location in Victoria. A
further 6.1 per cent travel to Latrobe for work, while 1.4 per cent travel to East Gippsland (each
neighbouring municipalities). Of a similar order to Latrobe City, 3.2 per cent have no fixed work
address.
Place of Usual Residence Number Per cent Number Per cent Number Per cent Number Per cent
Latrobe (C) 839 5.9% 21470 83.1% 667 4.7% 22976 42.3%
Baw Baw (S) 11851 83.3% 2125 8.2% 54 0.4% 14030 25.8%
Wellington (S) 36 0.3% 1057 4.1% 12932 90.6% 14025 25.8%
Cardinia (S) 667 4.7% 127 0.5% 14 0.1% 808 1.5%
South Gippsland (S) 182 1.3% 384 1.5% 109 0.8% 675 1.2%
Casey (C) 202 1.4% 89 0.3% 22 0.2% 313 0.6%
East Gippsland (S) 5 0.0% 77 0.3% 202 1.4% 284 0.5%
Bass Coast (S) 36 0.3% 64 0.2% 7 0.0% 107 0.2%
Monash (C) 47 0.3% 31 0.1% 13 0.1% 91 0.2%
Frankston (C) 25 0.2% 27 0.1% 17 0.1% 69 0.1%
Mornington Peninsula (S) 23 0.2% 20 0.1% 14 0.1% 57 0.1%
Boroondara (C) 21 0.1% 19 0.1% 8 0.1% 48 0.1%
Greater Dandenong (C) 27 0.2% 18 0.1% 0 0.0% 45 0.1%
Knox (C) 23 0.2% 18 0.1% 4 0.0% 45 0.1%
Melbourne (C) 18 0.1% 18 0.1% 8 0.1% 44 0.1%
Other Vic 186 1.3% 240 0.9% 143 1.0% 569 1.0%
Other States and Territories 34 0.2% 37 0.1% 62 0.4% 133 0.2%
Total 14222 100.0% 25821 100.0% 14276 100.0% 54319 100.0%
Data Source: 2011 Census of Population and Housing
Place of Work
Baw Baw Latrobe City Wellington Total
22
Table 21: Place of work of Latrobe Valley Region residents:
Final Comments
The Latrobe Valley Region has a changing socio-demographic. In relation to workforce
participation, Latrobe City stands out as a locality with relatively high unemployment, with
Indigenous residents and recent migrants facing particular challenges. Overall the workforce is
ageing, with a relatively high proportion holding certificate level qualifications but a low
proportion holding non-school qualifications overall. These socio-demographic patterns raise
specific questions for policy-makers both within and beyond these municipalities.
Questions relating to the patterns of workforce participation begin from an understanding of
employment and occupational patterns within localities. More than half the workforce in the
region is employed in five industries with Health Care and Social Assistance, Retail Trade,
Construction, Manufacturing, and Education and Training. What is notable is that these
industries are not the four key resource industries that characterise the region: oil and gas; coal
and energy; forestry and paper, and agriculture. Hence, these industries are not embedded,
although Health Care and Social Assistance and Education and Training, along with Retail
Trade, are all part of a functioning place-based economy.
The patterns of growth and decline in relation to occupations reflect these broader contextual
features. Of note, there was more outward mobility from Baw Baw than Latrobe City or
Wellington, reflecting this municipality’s proximity to the eastern part of Greater Melbourne.
The earnings of the regional workforce aligned with the industrial patterns in the region.
Place of work Number Per cent Number Per cent Number Per cent Number Per cent
Latrobe (C) 2125 11.0% 21471 73.1% 1057 6.1% 24653 37.3%
Wellington (S) 53 0.3% 668 2.3% 12930 74.3% 13651 20.7%
Baw Baw (S) 11849 61.5% 839 2.9% 33 0.2% 12721 19.3%
POW State/Territory undefined (Vic.) 890 4.6% 3796 12.9% 1783 10.2% 6469 9.8%
POW No Fixed Address (Vic.) 851 4.4% 874 3.0% 559 3.2% 2284 3.5%
Cardinia (S) 828 4.3% 45 0.2% 11 0.1% 884 1.3%
Melbourne (C) 314 1.6% 155 0.5% 77 0.4% 546 0.8%
South Gippsland (S) 188 1.0% 239 0.8% 87 0.5% 514 0.8%
Greater Dandenong (C) 380 2.0% 81 0.3% 21 0.1% 482 0.7%
Bass Coast (S) 126 0.7% 304 1.0% 41 0.2% 471 0.7%
Casey (C) 360 1.9% 44 0.1% 3 0.0% 407 0.6%
POW Capital city undefined (Greater Melbourne) 221 1.1% 67 0.2% 20 0.1% 308 0.5%
East Gippsland (S) 6 0.0% 40 0.1% 239 1.4% 285 0.4%
Monash (C) 164 0.9% 45 0.2% 24 0.1% 233 0.4%
Unincorporated Vic 29 0.2% 70 0.2% 131 0.8% 230 0.3%
Other Vic 740 3.8% 381 1.3% 168 1.0% 1289 2.0%
Other States & Territories 132 0.7% 255 0.9% 218 1.3% 605 0.9%
Total 19256 100.0% 29374 100.0% 17402 100.0% 66032 100.0%
Data Source: 2011 Census of Population and Housing
Total
Place of usual residence
WellingtonLatrobe CityBaw Baw