
Laboratory Report Electronic Motors
11
ES2B1 Energy Conservation & Power Systems Laboratory Report Electronic Motors Student Number 1321854 Table of Contents Abstract Summary ....................................................................................................................................... 2 Introduction ................................................................................................................................................... 2 Theory .............................................................................................................................................................. 2 Calculations .................................................................................................................................................... 4 Method ............................................................................................................................................................. 4 Results .............................................................................................................................................................. 5 AC Induction Motor ................................................................................................................................................. 5 DC Motor ..................................................................................................................................................................... 6 Diagrams and Equipment .......................................................................................................................... 7 AC Power .................................................................................................................................................................... 7 DC Power .................................................................................................................................................................... 8 Observations of the Starting Characteristics of the Motors ........................................................... 8 Discussion ....................................................................................................................................................... 9 Conclusions ................................................................................................................................................. 10 Bibliography ............................................................................................................................................... 10 Appendices and References ................................................................................................................... 11
-
Upload
chloe-jones -
Category
Documents
-
view
229 -
download
1
description
This study investigates how induction and DC motors vary, their efficiency and their operation. Results show DC motors are more efficient at a higher output power than induction motors. The motor speed has more of an effect on the torque in an induction motor than a DC motor, DC motors show an inverse linear relationship, with motor speed and torque where as an Induction motor exhibits less of these qualities. Both motors use the same current to start the motor then return back to their starting current.
Transcript of Laboratory Report Electronic Motors

ES2B1
Energy Conservation & Power Systems
Laboratory Report - Electronic Motors
Student Number - 1321854
Table of Contents
Abstract Summary .......................................................................................................................................2 Introduction...................................................................................................................................................2 Theory..............................................................................................................................................................2 Calculations....................................................................................................................................................4 Method .............................................................................................................................................................4 Results..............................................................................................................................................................5 AC Induction Motor .................................................................................................................................................5 DC Motor .....................................................................................................................................................................6
Diagrams and Equipment..........................................................................................................................7 AC Power ....................................................................................................................................................................7 DC Power ....................................................................................................................................................................8
Observations of the Starting Characteristics of the Motors...........................................................8 Discussion.......................................................................................................................................................9 Conclusions ................................................................................................................................................. 10 Bibliography ............................................................................................................................................... 10 Appendices and References................................................................................................................... 11
Abstract Summary This study investigates how induction and DC motors vary, their efficiency and their operation. Results show DC motors are more efficient at a higher output power than induction motors. The motor speed has more of an effect on the torque in an induction motor than a DC motor, DC motors show an inverse linear relationship, with motor speed and torque where as an Induction motor exhibits less of these qualities. Both motors use the same current to start the motor then return back to their starting current.
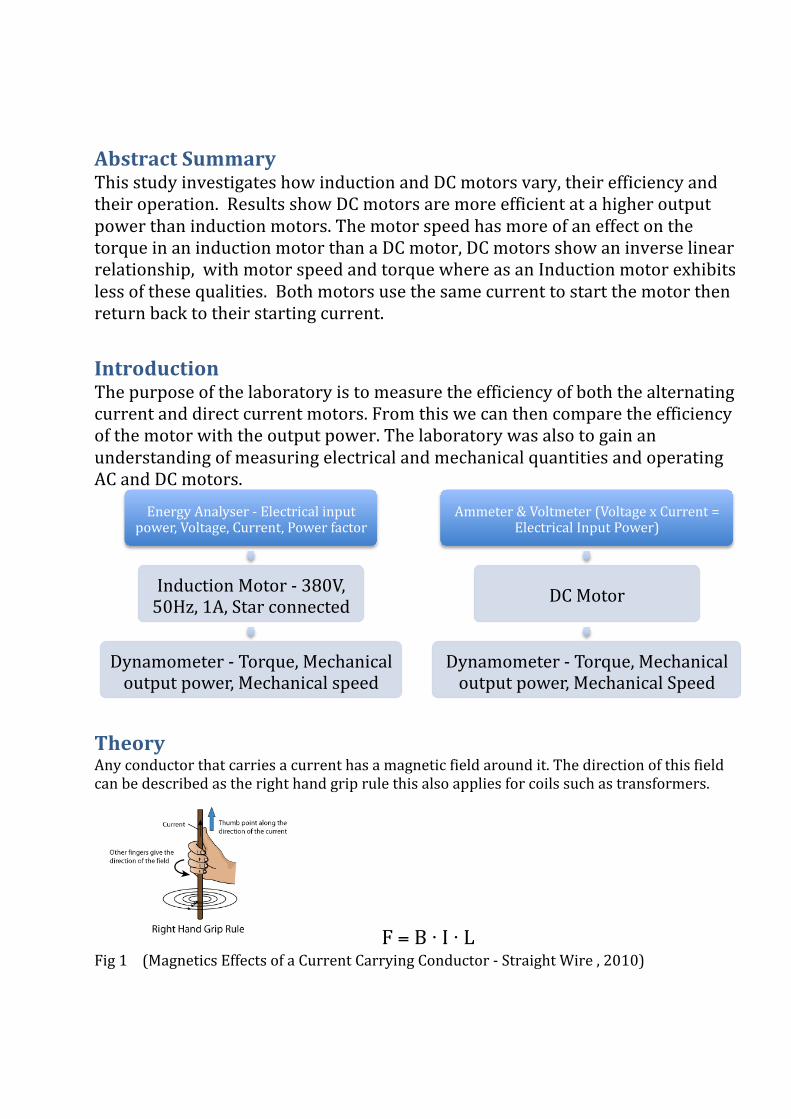
Introduction The purpose of the laboratory is to measure the efficiency of both the alternating current and direct current motors. From this we can then compare the efficiency of the motor with the output power. The laboratory was also to gain an understanding of measuring electrical and mechanical quantities and operating AC and DC motors.
Theory Any conductor that carries a current has a magnetic field around it. The direction of this field can be described as the right hand grip rule this also applies for coils such as transformers.
F = B ⋅ I ⋅ L Fig 1 (Magnetics Effects of a Current Carrying Conductor -‐ Straight Wire , 2010)
Energy Analyser -‐ Electrical input power, Voltage, Current, Power factor
Induction Motor -‐ 380V, 50Hz, 1A, Star connected
Dynamometer -‐ Torque, Mechanical output power, Mechanical speed
Ammeter & Voltmeter (Voltage x Current = Electrical Input Power)
DC Motor
Dynamometer -‐ Torque, Mechanical output power, Mechanical Speed
Where F is the force exerted, B is the magnetic flux density (T), I is the current and L is the length of the wire. As the magnetic field and length of wire stays constant the current exerted from the energy analyser directly affects the force and therefore the output torque.
Electromagnetic induction is introduced when a magnet is moved through a coil, this induces an EMF causing a current to flow through the conductor within the magnetic field, and this in turn generates a magnetic flux that opposes the change of the original flux. This process mimics that of a transformer. (Mias, Electromagnetism and Machienes)
A motor converts electrical energy to mechanical energy and generators convert mechanical energy to electrical energy. Both machines are similar comprising of 2 electromagnets. An electromagnet is formed of a coil with a current carrying conductor that produces magnetic field and magnetic flux.
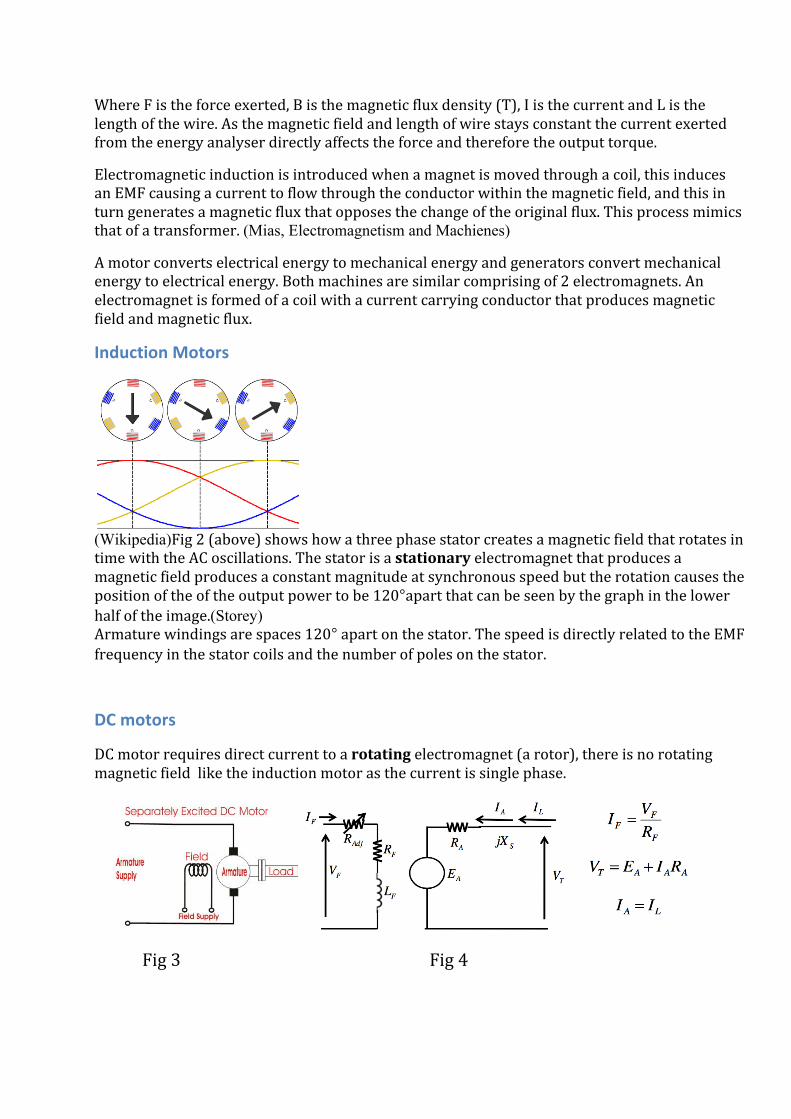
Induction Motors
(Wikipedia)Fig 2 (above) shows how a three phase stator creates a magnetic field that rotates in time with the AC oscillations. The stator is a stationary electromagnet that produces a magnetic field produces a constant magnitude at synchronous speed but the rotation causes the position of the of the output power to be 120°apart that can be seen by the graph in the lower half of the image.(Storey) Armature windings are spaces 120° apart on the stator. The speed is directly related to the EMF frequency in the stator coils and the number of poles on the stator.
DC motors
DC motor requires direct current to a rotating electromagnet (a rotor), there is no rotating magnetic field like the induction motor as the current is single phase.
Fig 3 Fig 4
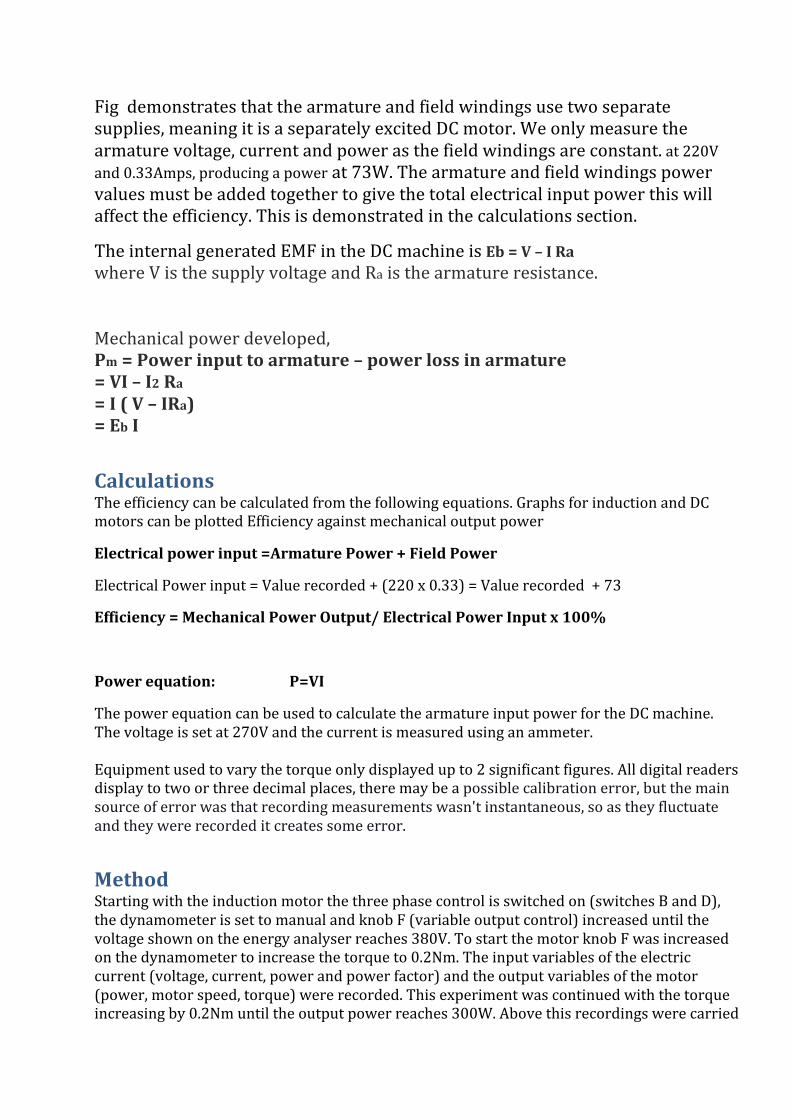
Fig demonstrates that the armature and field windings use two separate supplies, meaning it is a separately excited DC motor. We only measure the armature voltage, current and power as the field windings are constant. at 220V and 0.33Amps, producing a power at 73W. The armature and field windings power values must be added together to give the total electrical input power this will affect the efficiency. This is demonstrated in the calculations section.
The internal generated EMF in the DC machine is Eb = V – I Ra where V is the supply voltage and Ra is the armature resistance. Mechanical power developed, Pm = Power input to armature – power loss in armature = VI – I2 Ra = I ( V – IRa) = Eb I
Calculations The efficiency can be calculated from the following equations. Graphs for induction and DC motors can be plotted Efficiency against mechanical output power
Electrical power input =Armature Power + Field Power
Electrical Power input = Value recorded + (220 x 0.33) = Value recorded + 73
Efficiency = Mechanical Power Output/ Electrical Power Input x 100%
Power equation: P=VI
The power equation can be used to calculate the armature input power for the DC machine. The voltage is set at 270V and the current is measured using an ammeter. Equipment used to vary the torque only displayed up to 2 significant figures. All digital readers display to two or three decimal places, there may be a possible calibration error, but the main source of error was that recording measurements wasn't instantaneous, so as they fluctuate and they were recorded it creates some error.
Method Starting with the induction motor the three phase control is switched on (switches B and D), the dynamometer is set to manual and knob F (variable output control) increased until the voltage shown on the energy analyser reaches 380V. To start the motor knob F was increased on the dynamometer to increase the torque to 0.2Nm. The input variables of the electric current (voltage, current, power and power factor) and the output variables of the motor (power, motor speed, torque) were recorded. This experiment was continued with the torque increasing by 0.2Nm until the output power reaches 300W. Above this recordings were carried

out quickly in steps of 0.4Nm, this was continued until the motor overloaded. Switches B, C and D were turned off after 5 minutes to allow the motor to cool.
For the DC motor only switch B, C and D were switched on and knob F set to zero. Knob F was slowly increased to 30V where the voltage, motor speed and current were measured. Thiese recordings were continued up in steps of 30V up to the rated voltage of 270V.
The ‘manu’ knob on the dynamometer was turned to increase the torque to 0.1Nm. The input current was measured using an ammeter and the armature voltage was set at 270V and field set at 240V. From this we could calculate the electrical input power from the power formula; P=IV. The output torque, output power and motor speed were also recorded. These recorded were repeated at intervals of 0.1Nm until the motor reaches its output power of 180W. The test was increased quickly in intervals 0f 0.2Nm until the motor reached 2A.
Results
AC Induction Motor
Input Output
Voltage (V)
Current (A)
Electrical Input Power
(W) Power Factor
Output Torque (Nm)
Output Power (W)
Mechanical Motor Speed
(RPM) Efficiency
(%) 383 0.6 80 0.2 0 1.5 1480 0.19 381 0.605 100 0.2 0.2 20.6 1478 20.6 380 0.615 139 0.34 0.4 54.5 1473 39.2 380 0.642 181 0.43 0.6 89.6 1467 49.5 380 0.668 217 0.48 0.8 119.4 1460 55 380 0.698 249 0.54 1 145.2 1454 58.3 380 0.731 283 0.59 1.2 170 1449 60.1 380 0.772 326 0.64 1.4 199.7 1442 61.3 380 0.82 327 0.69 1.6 235.7 1431 72.1 380 0.888 422 0.72 1.8 266.7 1424 63.2 380 0.946 466 0.75 2 295.1 1414 63.3 380 0.99 500 0.77 2.2 316.1 1407 63.2 380 1.15 610 0.81 2.6 370.2 1382 60.7 379 1.33 727 0.83 3 420.6 1352 57.9 379 1.56 870 0.85 3.4 461.5 1310 53 379 1.87 1008 0.86 3.8 476.4 1223 47.3
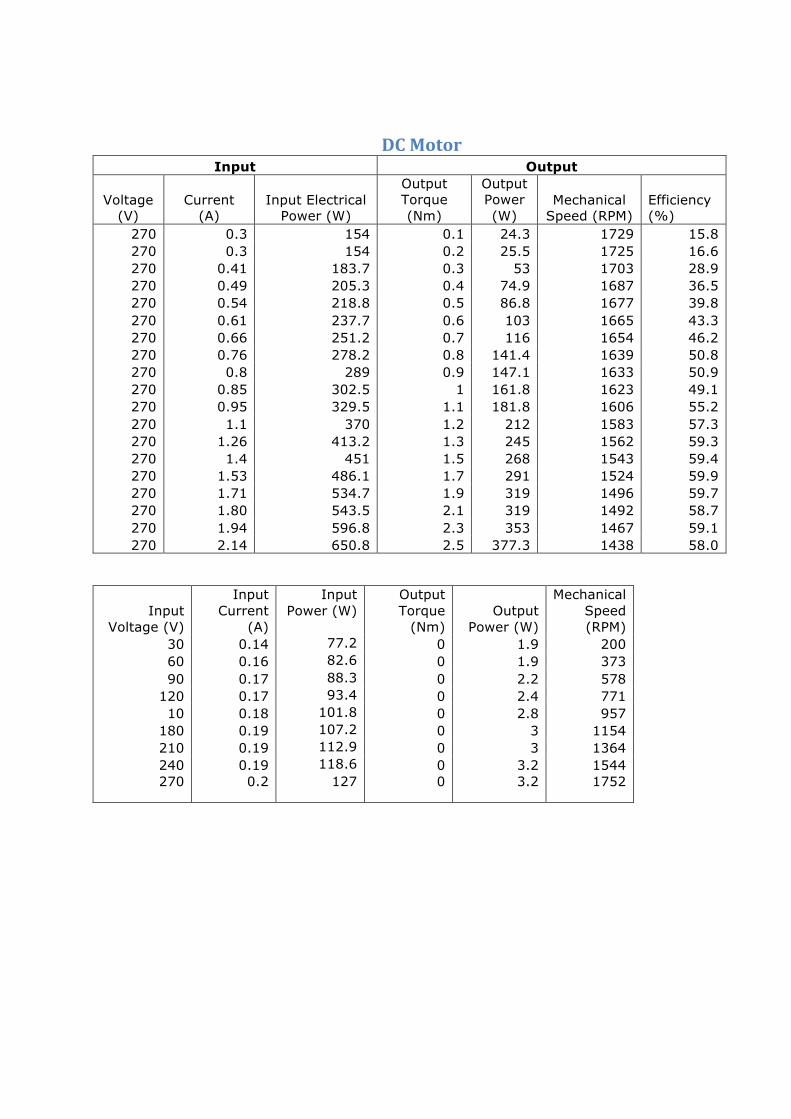
DC Motor Input Output
Voltage (V)
Current (A)
Input Electrical Power (W)
Output Torque (Nm)
Output Power (W)
Mechanical Speed (RPM)
Efficiency (%)
270 0.3 154 0.1 24.3 1729 15.8 270 0.3 154 0.2 25.5 1725 16.6 270 0.41 183.7 0.3 53 1703 28.9 270 0.49 205.3 0.4 74.9 1687 36.5 270 0.54 218.8 0.5 86.8 1677 39.8 270 0.61 237.7 0.6 103 1665 43.3 270 0.66 251.2 0.7 116 1654 46.2 270 0.76 278.2 0.8 141.4 1639 50.8 270 0.8 289 0.9 147.1 1633 50.9 270 0.85 302.5 1 161.8 1623 49.1 270 0.95 329.5 1.1 181.8 1606 55.2 270 1.1 370 1.2 212 1583 57.3 270 1.26 413.2 1.3 245 1562 59.3 270 1.4 451 1.5 268 1543 59.4 270 1.53 486.1 1.7 291 1524 59.9 270 1.71 534.7 1.9 319 1496 59.7 270 1.80 543.5 2.1 319 1492 58.7 270 1.94 596.8 2.3 353 1467 59.1 270 2.14 650.8 2.5 377.3 1438 58.0
Input Voltage (V)
Input Current
(A)
Input Power (W)
Output Torque
(Nm) Output
Power (W)
Mechanical Speed (RPM)
30 0.14 77.2 0 1.9 200 60 0.16 82.6 0 1.9 373 90 0.17 88.3 0 2.2 578
120 0.17 93.4 0 2.4 771 10 0.18 101.8 0 2.8 957
180 0.19 107.2 0 3 1154 210 0.19 112.9 0 3 1364 240 0.19 118.6 0 3.2 1544 270 0.2 127 0 3.2 1752
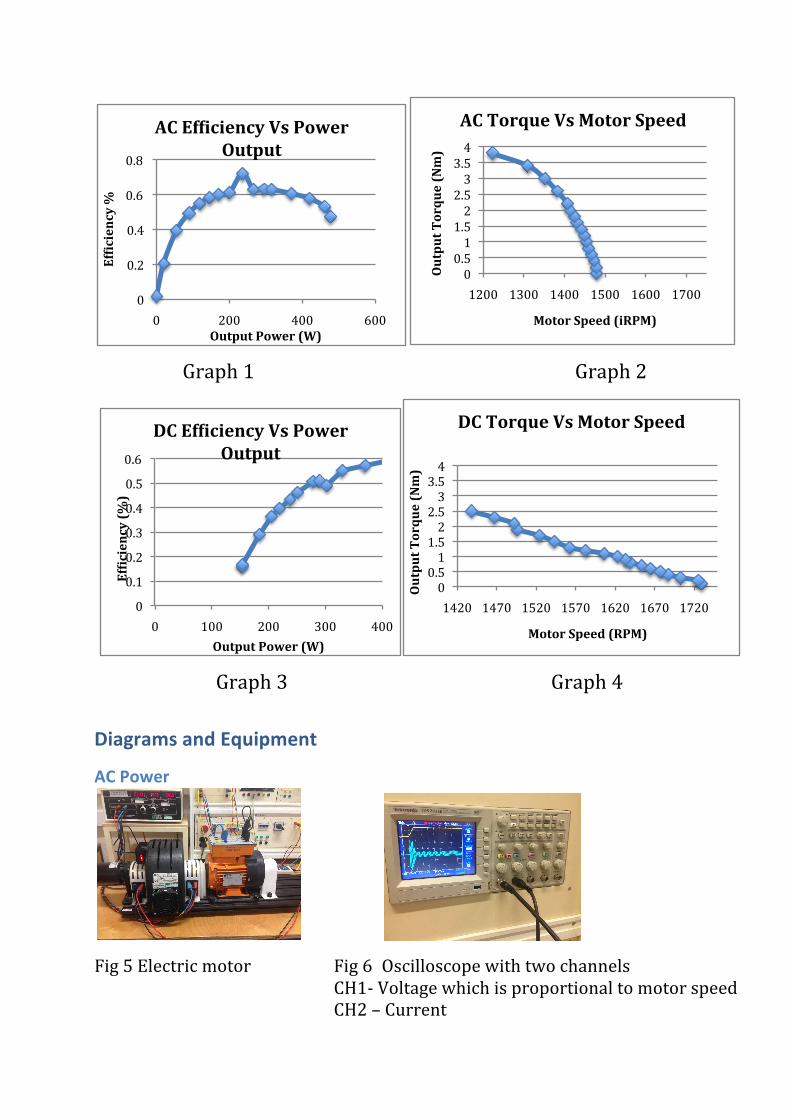
Graph 1 Graph 2
Graph 3 Graph 4
Diagrams and Equipment
AC Power
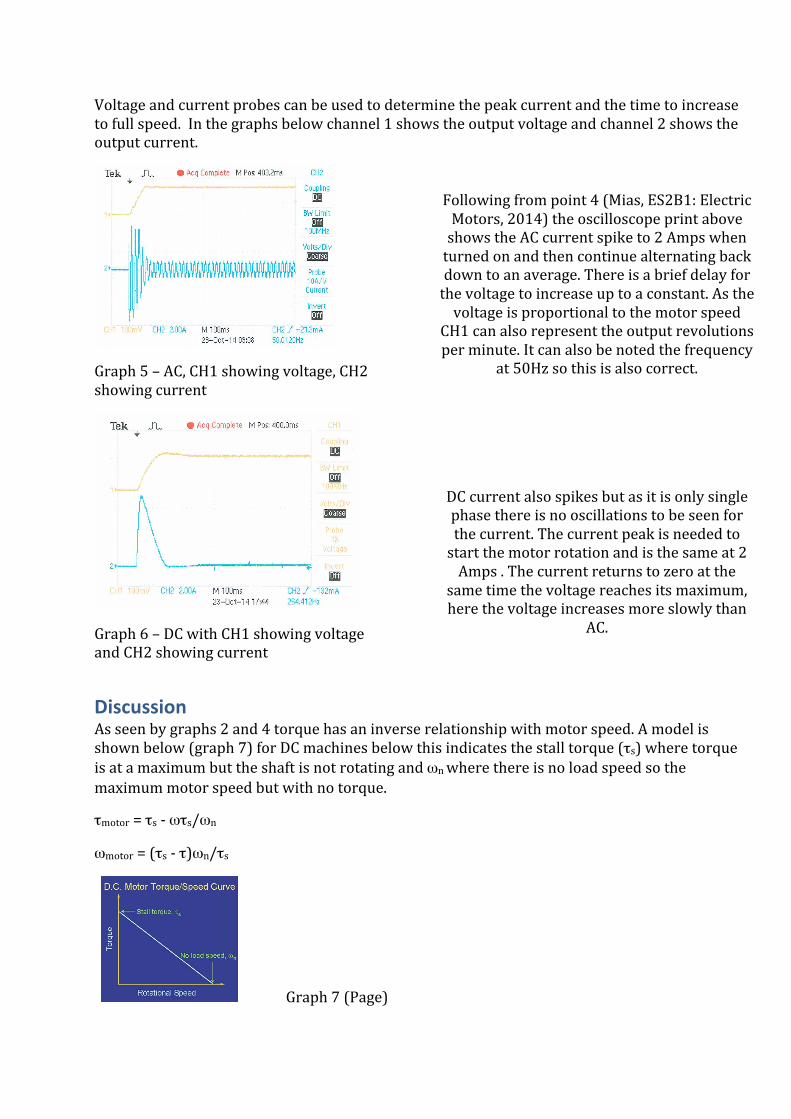
Fig 5 Electric motor Fig 6 Oscilloscope with two channels CH1-‐ Voltage which is proportional to motor speed CH2 – Current
0
0.2
0.4
0.6
0.8
0 200 400 600
Ef^iciency %
Output Power (W)
AC Ef^iciency Vs Power Output
0 0.5 1
1.5 2
2.5 3
3.5 4
1200 1300 1400 1500 1600 1700
Output Torque (Nm)
Motor Speed (iRPM)
AC Torque Vs Motor Speed
0
0.1
0.2
0.3
0.4
0.5
0.6
0 100 200 300 400
Ef^iciency (%)
Output Power (W)
DC Ef^iciency Vs Power Output
0 0.5 1
1.5 2
2.5 3
3.5 4
1420 1470 1520 1570 1620 1670 1720
Output Torque (Nm)
Motor Speed (RPM)
DC Torque Vs Motor Speed
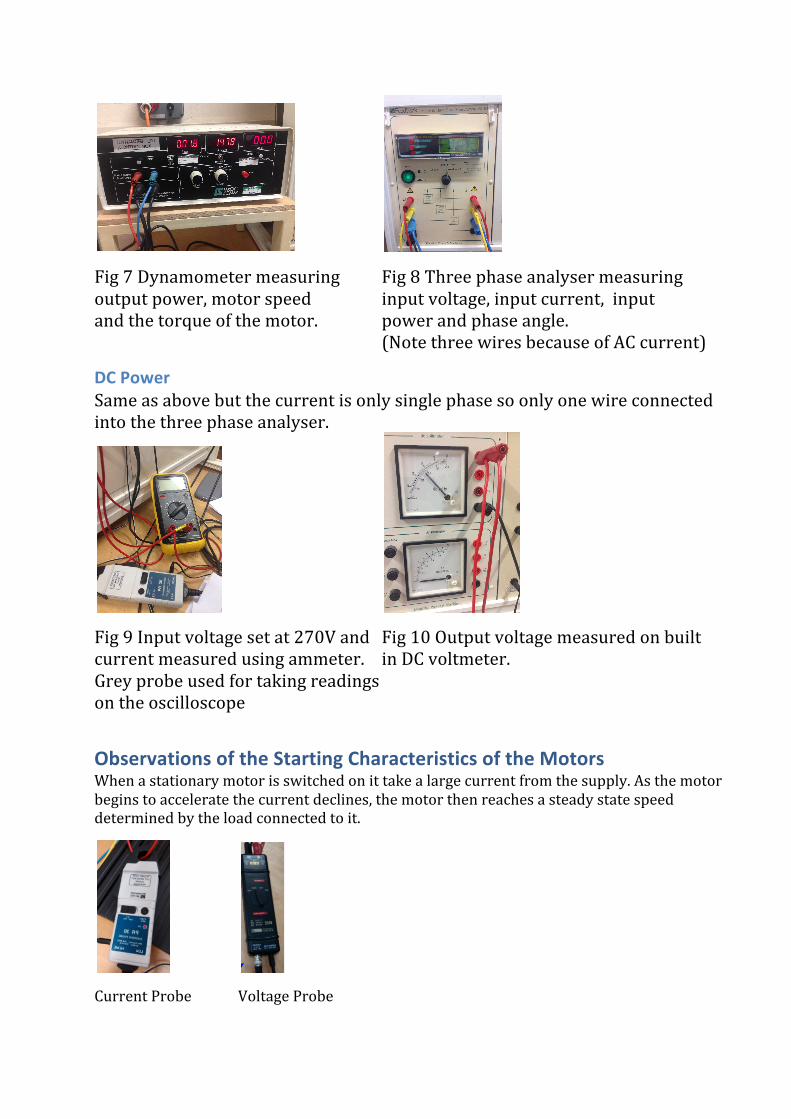
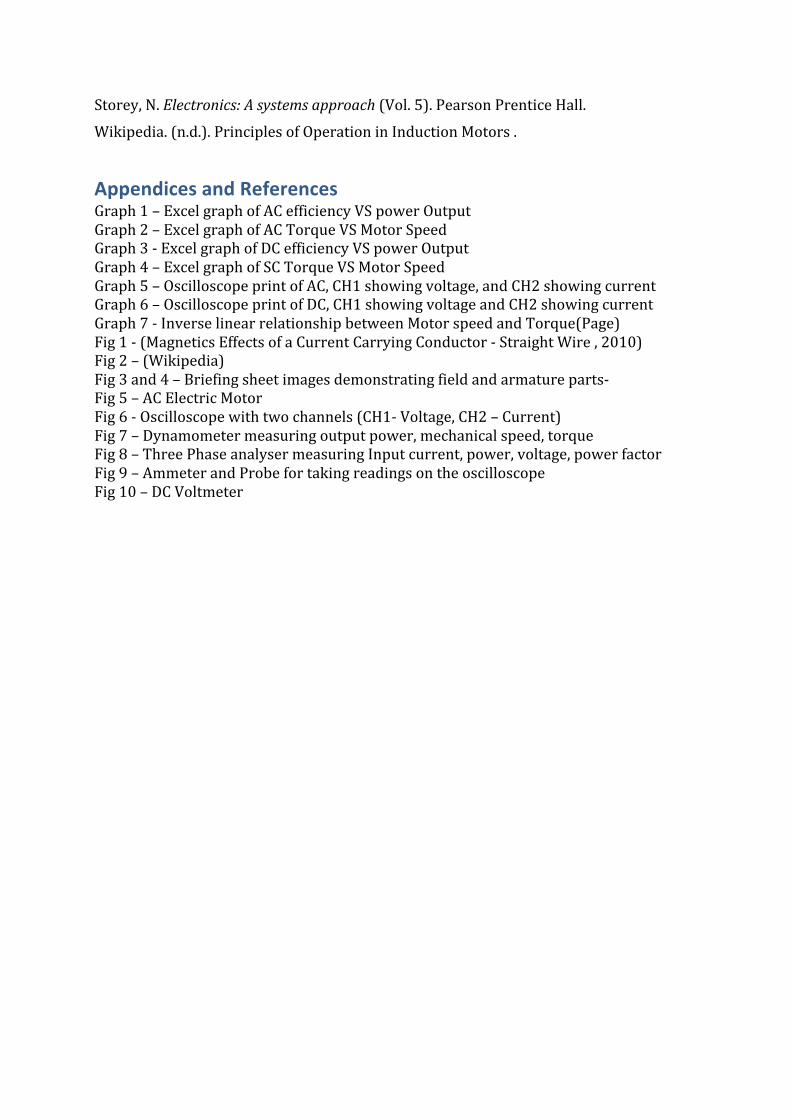
Fig 7 Dynamometer measuring Fig 8 Three phase analyser measuring output power, motor speed input voltage, input current, input and the torque of the motor. power and phase angle. (Note three wires because of AC current)
DC Power Same as above but the current is only single phase so only one wire connected into the three phase analyser.
Fig 9 Input voltage set at 270V and Fig 10 Output voltage measured on built current measured using ammeter. in DC voltmeter. Grey probe used for taking readings on the oscilloscope
Observations of the Starting Characteristics of the Motors When a stationary motor is switched on it take a large current from the supply. As the motor begins to accelerate the current declines, the motor then reaches a steady state speed determined by the load connected to it.
Current Probe Voltage Probe
Voltage and current probes can be used to determine the peak current and the time to increase to full speed. In the graphs below channel 1 shows the output voltage and channel 2 shows the output current.
Graph 5 – AC, CH1 showing voltage, CH2 showing current
Graph 6 – DC with CH1 showing voltage and CH2 showing current
Discussion As seen by graphs 2 and 4 torque has an inverse relationship with motor speed. A model is shown below (graph 7) for DC machines below this indicates the stall torque (τs) where torque is at a maximum but the shaft is not rotating and ωn where there is no load speed so the maximum motor speed but with no torque.
τmotor = τs -‐ ωτs/ωn
ωmotor = (τs -‐ τ)ωn/τs
Graph 7 (Page)
Following from point 4 (Mias, ES2B1: Electric Motors, 2014) the oscilloscope print above shows the AC current spike to 2 Amps when turned on and then continue alternating back down to an average. There is a brief delay for the voltage to increase up to a constant. As the voltage is proportional to the motor speed
CH1 can also represent the output revolutions per minute. It can also be noted the frequency
at 50Hz so this is also correct.
DC current also spikes but as it is only single phase there is no oscillations to be seen for the current. The current peak is needed to start the motor rotation and is the same at 2 Amps . The current returns to zero at the
same time the voltage reaches its maximum, here the voltage increases more slowly than
AC.

Induction Motors have a very low cost due to their simple design. Their speed can be varied by the number of fixed winding sets and also by the frequency of the AC line voltage. They also have a high power factor so more real power to be used. Induction motors are much more reliable than DC motors as there are no brushes to replace. However induction motors do struggle at low speeds due to their thermal considerations
The DC motor provides excellent speed control as the power supply directly controls the field of the motor, which allows for precise voltage control that is necessary with speed and torque control applications e.g. shunt motor. DC motors also have an easy to understand design with only a single phase due to the direct current. However they require high maintenance to maintain the brushes and the mechanical interface used for the current to reach the rotating field. Dust also decreases its performance so is unsuitable in a dust environment. (Ali, 2013)
Conclusions AC current has a much rounder curve indicating that it has a greater range of efficiency it can work at with different powers. These range from between 120 – 400W where it can work at 60% efficiency. The DC motor efficiency increases with output speed up to a maximum of 60% efficiency. This could be an exponential relationship but more recordings would have to be carried out. Both motors experience their peaks at similar mechanical output power, with the DC peak efficiency at 290W and induction peak efficiency at 236W. From looking at the graph you can see the peak for induction motors could be an anomaly reading, the graph is a smooth curve apart from this peak that would more likely be around 63% efficiency.
Both torque vs peed graphs (graph 2 and 4) are inversely proportional with the induction motor being the least proportional having a speed curve. The torque of the induction motor increases from zero to 4Nm, this has a greater range than the DC motor only to 2.5Nm. The induction motor has a steeper curve, as the motor speed is slower. At 0Nm the highest motor speed is 1500 revolutions per minute whereas the DC motor highest speed is 1730 rotations per minute.
So as both motors have similar efficiencies the induction motor is likely to be a better machine as it performs at 60% efficiency between a larger range of power, 120-‐400W.
Bibliography Ali, Z. A. (2013, 12 20). Dv and AC Motor Model. Uet Peshawar. Magnetics Effects of a Current Carrying Conductor - Straight Wire . (2010). Retrieved 12 02, 2014, from Physics 503: http://physics503.one-‐school.net/2008/06/magnetics-‐effects-‐of-‐current-‐carrying.html Mias, D. C. (n.d.). Electromagnetism and Machienes. Retrieved 11 02, 2014, from School of Engineering, Warwick: http://www2.warwick.ac.uk/fac/sci/eng/eso/modules/year2/es2b1/resources/es2b1_lecture_8_dc_machines.pdf Mias, D. C. (2014). ES2B1: Electric Motors. University of Warwick, School of Engineering . Page, M. (n.d.). DC Motor Characteristics . Simple AC induction Motor . (n.d.). Retrieved 12 02, 2014, from Hyperphysics : http://hyperphysics.phy-‐astr.gsu.edu/hbase/magnetic/indmot.html#c3
Storey, N. Electronics: A systems approach (Vol. 5). Pearson Prentice Hall. Wikipedia. (n.d.). Principles of Operation in Induction Motors .
Appendices and References Graph 1 – Excel graph of AC efficiency VS power Output Graph 2 – Excel graph of AC Torque VS Motor Speed Graph 3 -‐ Excel graph of DC efficiency VS power Output Graph 4 – Excel graph of SC Torque VS Motor Speed Graph 5 – Oscilloscope print of AC, CH1 showing voltage, and CH2 showing current Graph 6 – Oscilloscope print of DC, CH1 showing voltage and CH2 showing current Graph 7 -‐ Inverse linear relationship between Motor speed and Torque(Page) Fig 1 -‐ (Magnetics Effects of a Current Carrying Conductor -‐ Straight Wire , 2010) Fig 2 – (Wikipedia) Fig 3 and 4 – Briefing sheet images demonstrating field and armature parts-‐ Fig 5 – AC Electric Motor Fig 6 -‐ Oscilloscope with two channels (CH1-‐ Voltage, CH2 – Current) Fig 7 – Dynamometer measuring output power, mechanical speed, torque Fig 8 – Three Phase analyser measuring Input current, power, voltage, power factor Fig 9 – Ammeter and Probe for taking readings on the oscilloscope Fig 10 – DC Voltmeter