Labor Market Trends in North America – Has Economic Well-being improved ? Lars Osberg Department...
25
Labor Market Trends in North America – Has Economic Well-being improved? Lars Osberg Department of Economics, Dalhousie University Halifax, Nova Scotia Andrew Sharpe Center for the Study of Living Standards Ottawa, Ontario Conference on “Labour in a Globalising World: The Challenge for Asia” City University of Hong Kong, Hong Kong, China, January 4-6, 2001
-
date post
20-Dec-2015 -
Category
Documents
-
view
218 -
download
0
Transcript of Labor Market Trends in North America – Has Economic Well-being improved ? Lars Osberg Department...

Labor Market Trends in North America – Has Economic Well-being improved?
Lars OsbergDepartment of Economics, Dalhousie University
Halifax, Nova Scotia
Andrew SharpeCenter for the Study of Living Standards
Ottawa, Ontario
Conference on “Labour in a Globalising World: The Challenge for Asia” City University of Hong Kong, Hong Kong, China, January 4-6, 2001
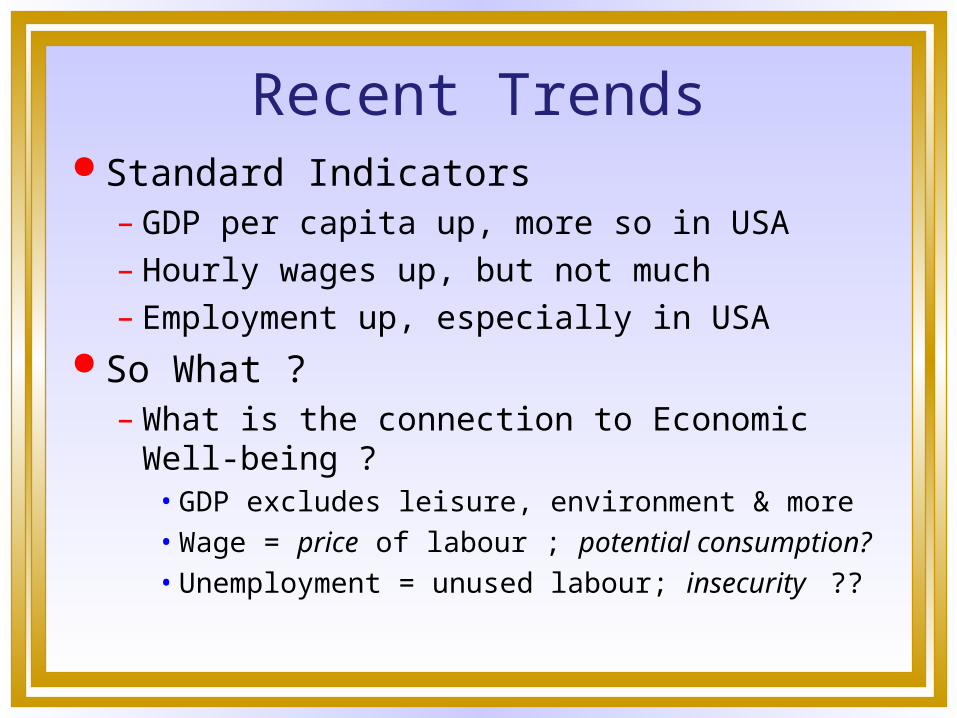
Recent Trends Standard Indicators
– GDP per capita up, more so in USA– Hourly wages up, but not much– Employment up, especially in USA
So What ? – What is the connection to Economic Well-
being ?• GDP excludes leisure, environment & more• Wage = price of labour ; potential consumption?• Unemployment = unused labour; insecurity ??

Questions Has economic well being increased or
decreased ?
How “productive” is economic growth for economic well-being?
What social policy changes are desirable?

Outline of Paper Standard Indicator Trends
– GDP per capita, Unemployment, Hourly Wages Index of Economic Well Being
– Consumption flows– Stocks of wealth– Distribution: inequality & poverty– Economic Insecurity
Compare trends in the index and its components to GDP per capita trends
What is the role of Social Policy ?
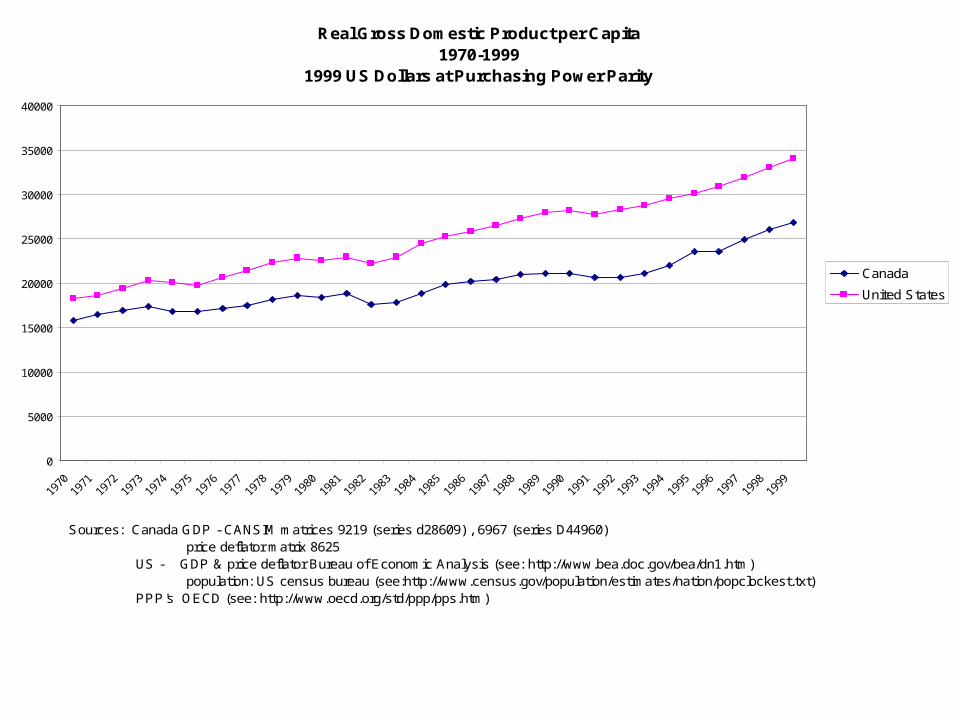
Real Gross Domestic Product per Capita1970-1999
1999 US Dollars at Purchasing Power Parity
0
5000
10000
15000
20000
25000
30000
35000
40000
Canada
United States
Sources: Canada GDP - CANSIM matrices 9219 (series d28609) , 6967 (series D44960) price deflator matrix 8625 US - GDP & price deflator Bureau of Economic Analysis (see: http://www.bea.doc.gov/bea/dn1.htm) population: US census bureau (see:http://www.census.gov/population/estimates/nation/popclockest.txt) PPP's OECD (see: http://www.oecd.org/std/ppp/pps.htm)

GDP per capita GDP rigorously standardized across countries
(SNA) Strong Implicit assumptions when used as
measure of economic well-being– aggregate share of income devoted to accumulation (including
value of unpriced environmental assets) automatically optimal– poverty, inequality & economic insecurity do not matter– changes in leisure time, length of life, family size, costs of
commuting, pollution & crime - all irrelevant
poor match to popular perceptions of trends in economic well-being

Unemployment & Employment
Canada & USA diverged in 1980s & 1990s – 1980s: greater increase in labour force
participation in Canada - employment growth was similar
– 1990s: anti inflation zealotry in Canada produced collapse in aggregate demand & deeper, longer recession
Decade ended with tightening labour markets in both countries

Unemployment Rates Canada and the United States
1970-1999
0.0
2.0
4.0
6.0
8.0
10.0
12.0
14.0
1970
1971
1972
1973
1974
1975
1976
1977
1978
1979
1980
1981
1982
1983
1984
1985
1986
1987
1988
1989
1990
1991
1992
1993
1994
1995
1996
1997
1998
1999
Canada
United States
Sources: Canada: CANSIM matrices 9219 (series d28599) and 6967 (series d44950) United States CANSIM matrix 2537 (series b53106)

Figure 3Employment / Population Ratio Canada and the United States
48
50
52
54
56
58
60
62
64
66
19
70
19
71
19
72
19
73
19
74
19
75
19
76
19
77
19
78
19
79
19
80
19
81
19
82
19
83
19
84
19
85
19
86
19
87
19
88
19
89
19
90
19
91
19
92
19
93
19
94
19
95
19
96
19
97
19
98
19
99
pe
rce
nt
CANADA
UNITED STATES
source: U.S. Bureau of Labor Statistics, International Comparisons of Foreign Labor Statistics (see: http://stats.bls.gov/special.requests/ForeignLabor/flslforc.pdf )

Trends in Wages
Rising Inequality in earnings 1980-97; little change in real wages for
median worker, but rapid rise at top Canada / USA level comparisons
– use PPP or exchange rate ??– Living standards of production workers
higher in Canada

Hourly Direct Pay for Production Workers in ManufacturingCanada and the US 1975-1990
0
5
10
15
20
25
1975
1976
1977
1978
1979
1980
1981
1982
1983
1984
1985
1986
1987
1988
1989
1990
1991
1992
1993
1994
1995
1996
1997
1998
1999
1999
US
$
Canada-PPP
United States
Canada-Exchange rate
Hourly direct pay includes (a) pay for time worked (basic time and piece rates plus overtime premiums, shift differentials, other premiums and bonuses paid regularly each pay period, and cost-of-living adjustments) and (b) other direct pay (pay for time not worked (vacations, holidays, and other leave, except sick leave), seasonal or irregular bonuses and other special payments, selected social allowances, and the cost of payments in kind), before payroll deductions of any kind. Direct pay is also measured on an hours-worked basis for every country. source : US Bureau of Labor Statistics (ftp://ftp.bls.gov/pub/special.requests/ForeignLabor/supptab.txt)

Presumably Economic & Social Policy aim at improving Economic Well-Being
Consumption & Leisure are enjoyable – But Employment & Unemployment refer to
supply of Labour– Leisure is not counted in GDP
To know if policy is successful, should measure target variable
But what does this have to do with Economic Well-Being ?
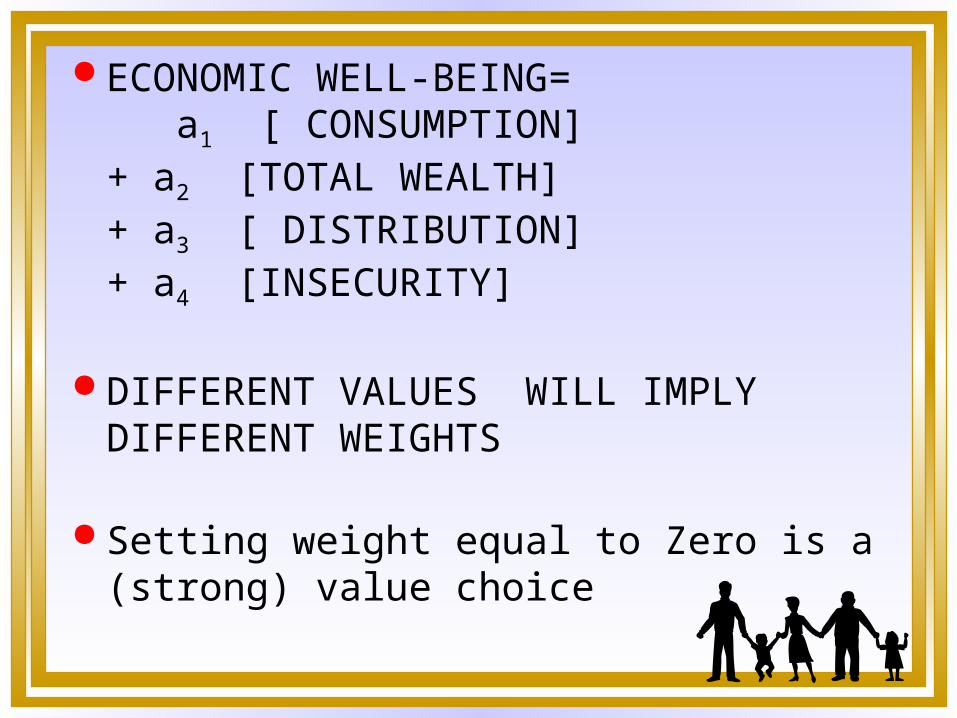
ECONOMIC WELL-BEING= a1 [ CONSUMPTION]+ a2 [TOTAL WEALTH]+ a3 [ DISTRIBUTION]+ a4 [INSECURITY]
DIFFERENT VALUES WILL IMPLY DIFFERENT WEIGHTS
Setting weight equal to Zero is a (strong) value choice
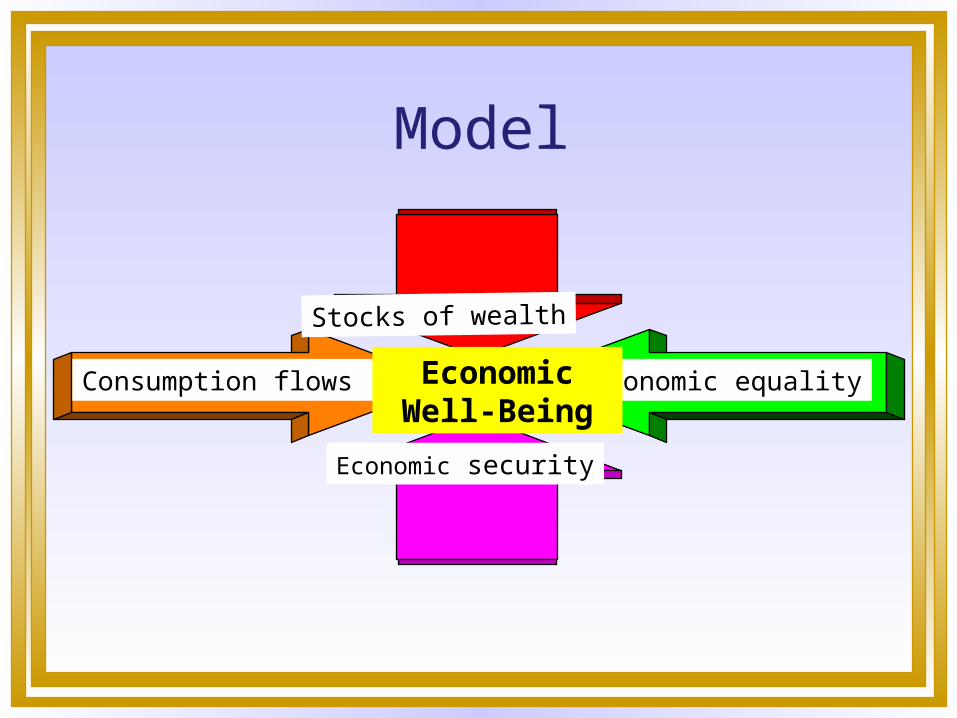
Model
Consumption flows
Stocks of wealth
Economic equality
Economic security
EconomicWell-Being

Average Consumption Flows $ Marketed real consumption per capita
– Adjustments • underground economy• value of increased longevity
– health-adjusted life expectancy• reduced economies of scale in household consumption• regrettables and intermediate goods
– increase in costs of commuting, crime, pollution abatement
• changes in working hours - leisure

Average Consumption Flows $
Government services– provision of non-marketed or heavily
subsidized services• includes defense and capital consumption
allowances
– excludes debt service charges and transfer payments
Unpaid work
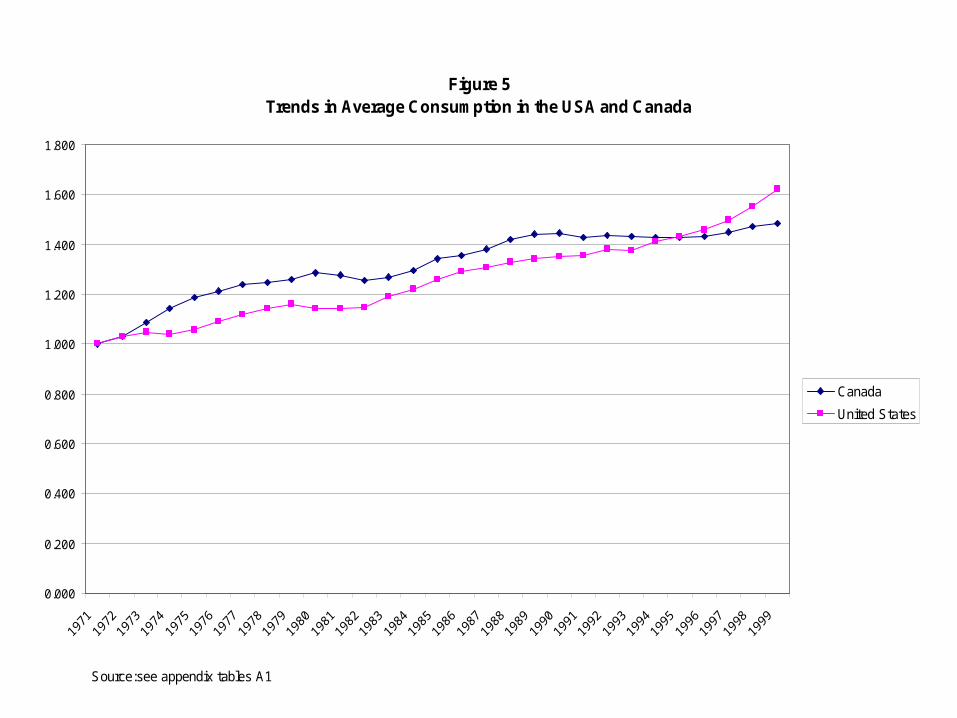
Figure 5 Trends in Average Consumption in the USA and Canada
0.000
0.200
0.400
0.600
0.800
1.000
1.200
1.400
1.600
1.800
Canada
United States
Source:see appendix tables A1

Wealth Stocks, Sustainability and Intergenerational Bequest $
Physical capital stock Research and development capital stock Value of natural resource stocks
– price + quantity change Stocks of human capital (@ cost education) Net foreign indebtedness (-) State of environment and national heritage
(degradation -)
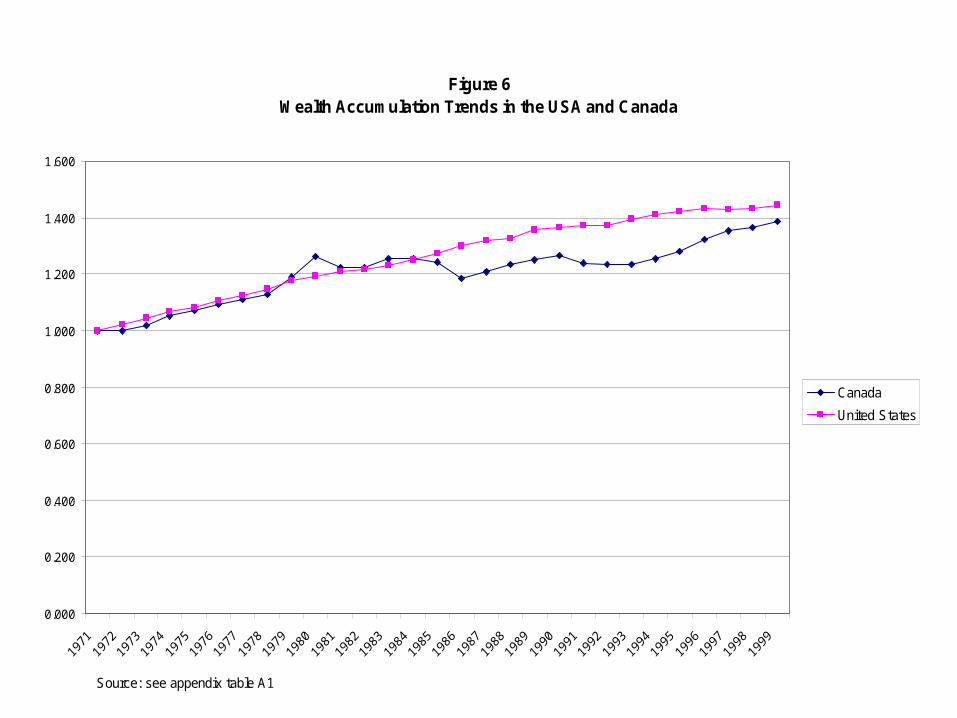
Figure 6Wealth Accumulation Trends in the USA and Canada
0.000
0.200
0.400
0.600
0.800
1.000
1.200
1.400
1.600
Canada
United States
Source: see appendix table A1

Distribution
Inequality– Gini coefficient
• After-tax & transfer household income• Equivalence scale =
Poverty– Sen-Shorrocks-Thon measure
• Rate• Average poverty gap ratio• Intensity = rate x gap
familysize

Figure 7 Trends in Income Equality
0.0000
0.2000
0.4000
0.6000
0.8000
1.0000
1.2000
1971
1972
1973
1974
1975
1976
1977
1978
1979
1980
1981
1982
1983
1984
1985
1986
1987
1988
1989
1990
1991
1992
1993
1994
1995
1996
1997
1998
1999
Canada
United States
Source: see appendix table A1

“Economic Security” Risk income loss due to unemployment
– changes in employment rate x UI coverage x UI replacement rate
Risk of illness– medical expenses as share of disposable income
Risk of single parent poverty– poverty rate & gap for single women with children
– divorce rate of legally married couples
Risk of poverty in old age– chance x depth of elderly poverty

Economic Security weights for 1997
Figure 8 Trends in Economic Security
0.0000
0.2000
0.4000
0.6000
0.8000
1.0000
1.2000
1.4000
Canada
United States
Source: see appendix table A1

Figure 9 Trends in Economic Well-Being in Canada and the USA
[Equal weighting of Consumption, Accumulation, Distribution and Economic Security
0.0000
0.2000
0.4000
0.6000
0.8000
1.0000
1.2000
1.4000
Canada
United States
Source: see table A1

Policy Implications ? Much less gain in economic well-being than
in real GDP per capita 1970-99 Major reason has been growth in inequality
& insecurity – Reducing Inequality & Insecurity has been the
major objective of social programmes – de-emphasized in recent years
Social Policy Design should aim at increasing Well-Being