
KPI - August 21, 2014, vl2 - DealersEdge · Consultant, she worked in ... Average Customer Labor...
18
by by Brooke Samples, president Brooke Samples, president Profit Blueprints, LLC Profit Blueprints, LLC Benchmarks & Key Performance Benchmarks & Key Performance Indicators... Indicators... Profit Management Tools for Every Profit Management Tools for Every Manager! Manager! Over the course of her career, today’s presenter, Brooke Samples, has analyzed over 15,000 Dealership financial statements. Over the past 15 years, Brooke Samples has coached and motivated hundreds of Dealership Managers in all departments across North America. Using her monthly financial analysis - Profit Blueprints - she compares Dealers’ financial statements to key Benchmarks. She then uses her previous dealership experience, plus feedback from 15 years of Coaching & Consulting her Clients, to help Managers utilize over 150 Action Plans. By implementing customized processes, her clients reach their full Net Profit potential. She’s proven that with good people, consistent training, the right plans, and a little good- natured "nudging“; her Dealership clients become very successful. In 2012 & 2013 she worked with VW University, training their people to understand the opportunities hidden in their dealerships’ financial statements. Before becoming a Consultant, she worked in Dealerships in a variety of upper management positions. She expanded her automotive knowledge while working for Lloyd Schiller’s Dealer Service Corporation and later as part of NCM Associates. Your Presenter, Brooke Samples President Profit Blueprints,LLC [email protected] 1.866.316.7418 BEN CHMA RK S BEN CHMA RK S KEY KEY PERFORMANCE/ PERFORMANCE/ Success Success Indicators Indicators TARGETS TARGETS G RADES GOALS Stand ards
Transcript of KPI - August 21, 2014, vl2 - DealersEdge · Consultant, she worked in ... Average Customer Labor...
byby Brooke Samples, presidentBrooke Samples, presidentProfit Blueprints, LLCProfit Blueprints, LLC
Benchmarks & Key PerformanceBenchmarks & Key PerformanceIndicators...Indicators...
Profit Management Tools for EveryProfit Management Tools for EveryManager!Manager!
Over the course of her career, today’s presenter, BrookeSamples, has analyzed over 15,000 Dealership financial
statements. Over the past 15 years, Brooke Samples hascoached and motivated hundreds of Dealership Managers inall departments across North America. Using her monthlyfinancial analysis - Profit Blueprints - she compares Dealers’financial statements to key Benchmarks. She then uses herprevious dealership experience, plus feedback from 15 yearsof Coaching & Consulting her Clients, to help Managers utilizeover 150 Action Plans.
By implementing customized processes, her clients reachtheir full Net Profit potential. She’s proven that with goodpeople, consistent training, the right plans, and a little good-natured "nudging“; her Dealership clients become verysuccessful.
In 2012 & 2013 she worked with VW University, training theirpeople to understand the opportunities hidden in theirdealerships’ financial statements. Before becoming aConsultant, she worked in Dealerships in a variety of uppermanagement positions. She expanded her automotiveknowledge while working for Lloyd Schiller’s Dealer ServiceCorporation and later as part of NCM Associates.
Your Presenter,
Brooke SamplesPresident
Profit Blueprints,LLC
1.866.316.7418
BENCHMARKS
BENCHMARKS
KEYKEY
PERFORMANCE/
PERFORMANCE/
SuccessSuccess
Indicators
Indicators
TARGETSTARGETS
GRADES
GOALS
Standards
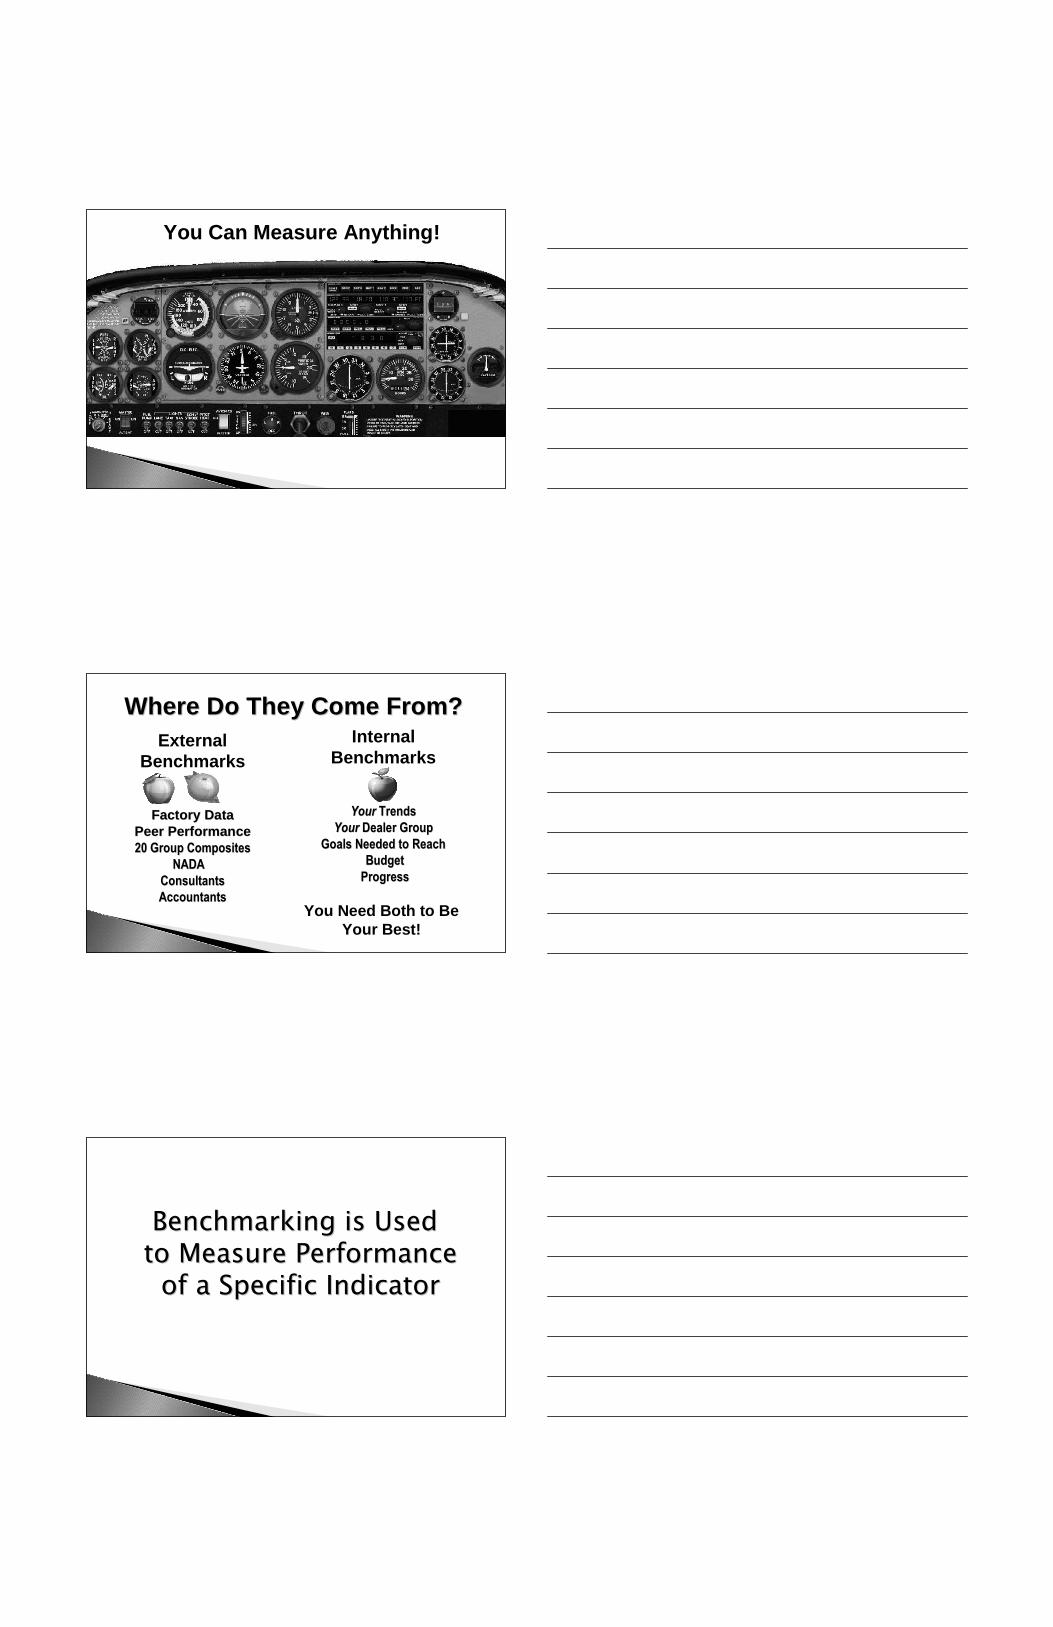
You Can Measure Anything!
Where Do They Come From?Where Do They Come From?
ExternalBenchmarks
Factory DataFactory DataPeer PerformancePeer Performance20 Group Composites20 Group Composites
NADANADAConsultantsConsultantsAccountantsAccountants
InternalBenchmarks
YourYour TrendsTrendsYourYour Dealer GroupDealer Group
Goals Needed to ReachGoals Needed to ReachBudgetBudget
ProgressProgress
You Need Both to BeYour Best!
Benchmarking is UsedBenchmarking is Usedto Measure Performanceto Measure Performance
of a Specific Indicatorof a Specific Indicator
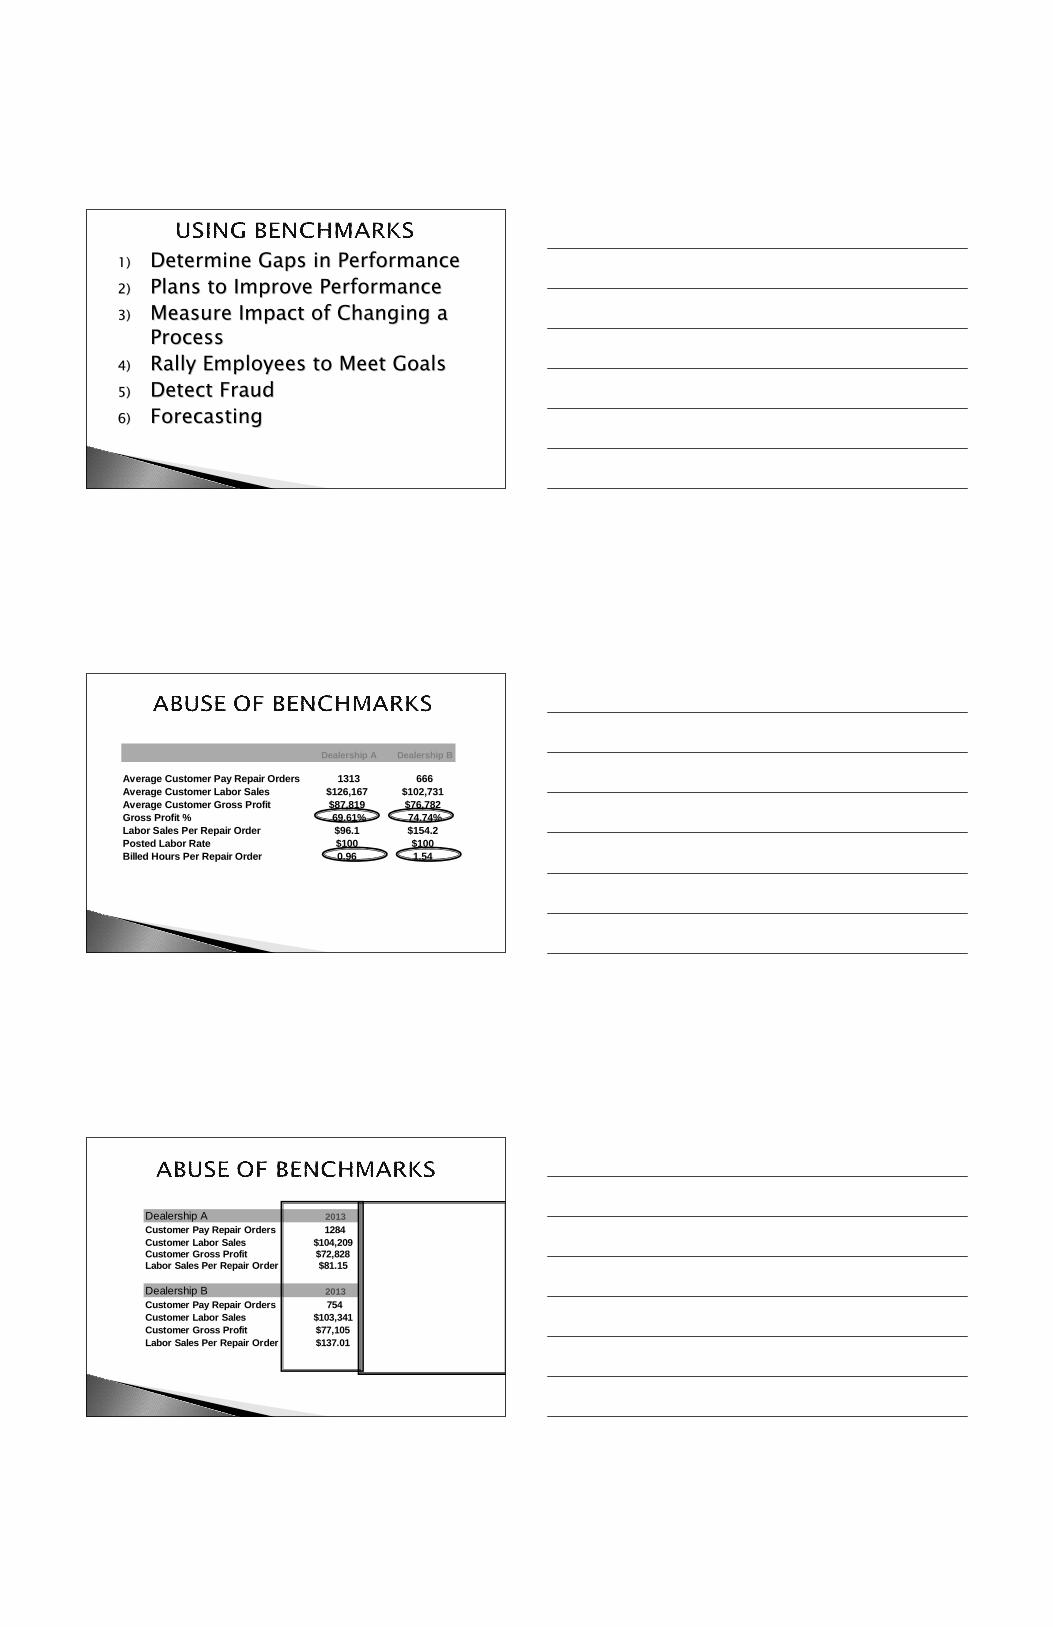
1)1) Determine Gaps in PerformanceDetermine Gaps in Performance
2)2) Plans to Improve PerformancePlans to Improve Performance
3)3) Measure Impact of Changing aMeasure Impact of Changing aProcessProcess
4)4) Rally Employees to Meet GoalsRally Employees to Meet Goals
5)5) Detect FraudDetect Fraud
6)6) ForecastingForecasting
Dealership A Dealership B
Average Customer Pay Repair Orders 1313 666
Average Customer Labor Sales $126,167 $102,731
Average Customer Gross Profit $87,819 $76,782
Gross Profit % 69.61% 74.74%
Labor Sales Per Repair Order $96.1 $154.2
Posted Labor Rate $100 $100
Billed Hours Per Repair Order 0.96 1.54
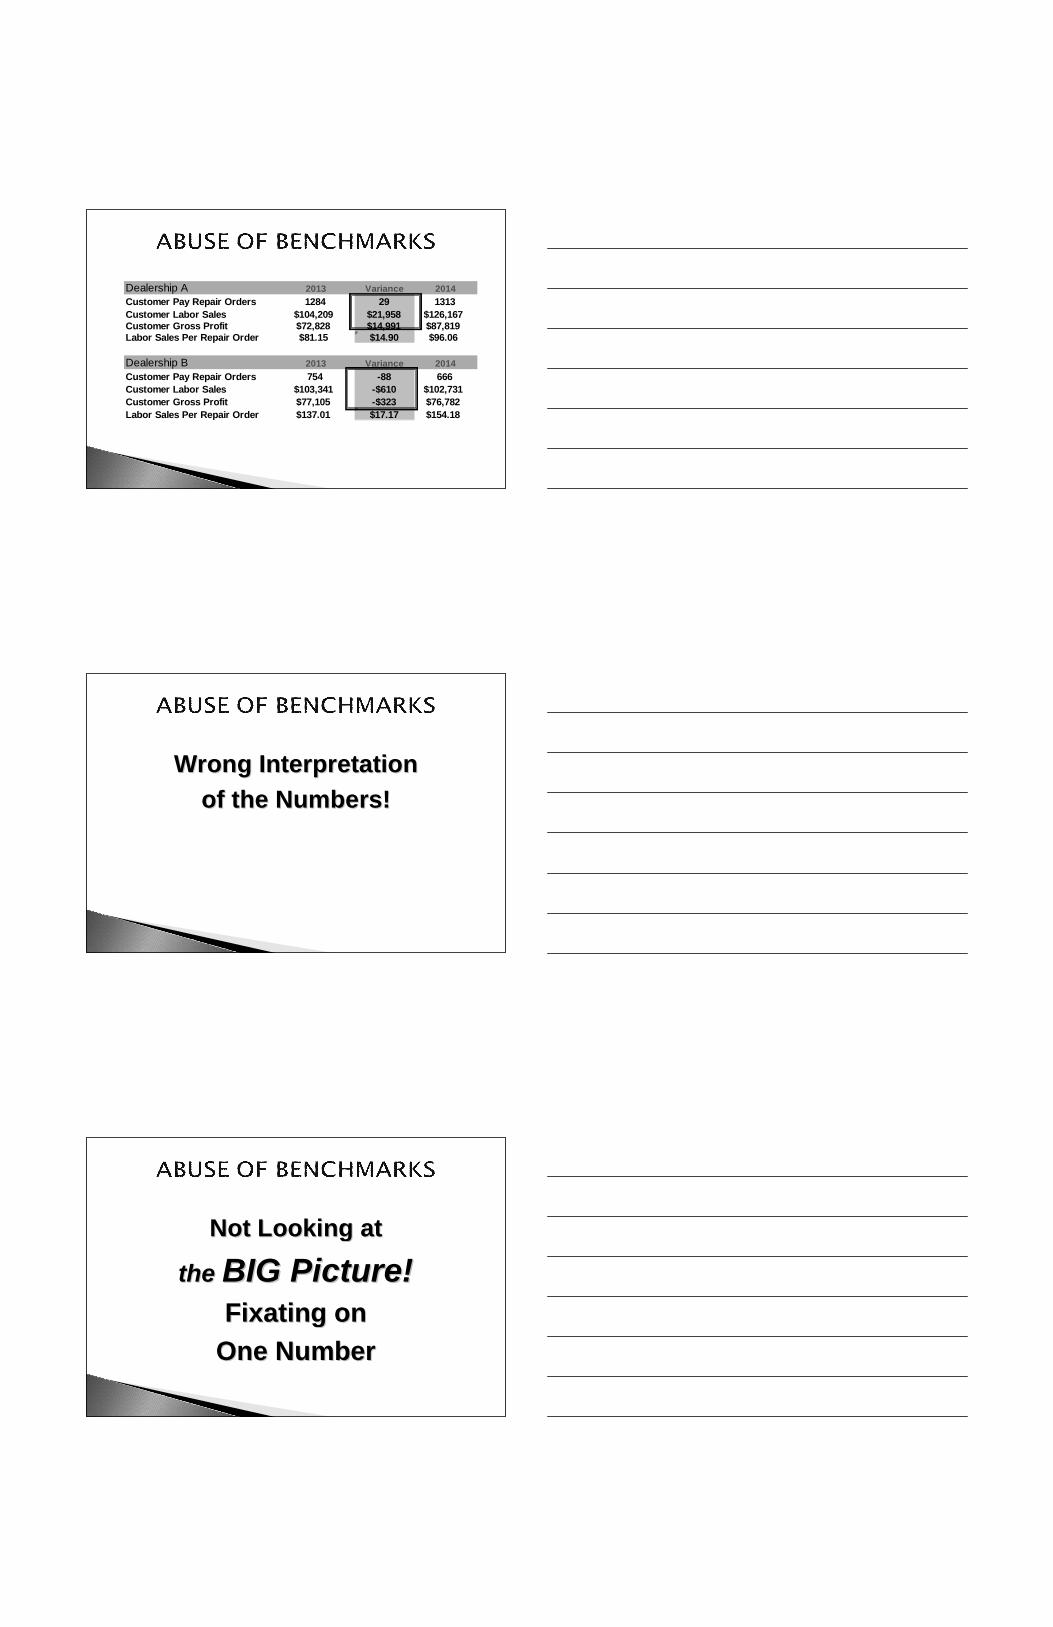
Dealership A 2013 Variance 2014
Customer Pay Repair Orders 1284 29 1313
Customer Labor Sales $104,209 $21,958 $126,167Customer Gross Profit $72,828 $14,991 $87,819Labor Sales Per Repair Order $81.15 $14.90 $96.06
Dealership B 2013 Variance 2014
Customer Pay Repair Orders 754 -88 666
Customer Labor Sales $103,341 -$610 $102,731
Customer Gross Profit $77,105 -$323 $76,782
Labor Sales Per Repair Order $137.01 $17.17 $154.18
Wrong InterpretationWrong Interpretation
of the Numbers!of the Numbers!
Not Looking atNot Looking at
thethe BIG Picture!BIG Picture!Fixating onFixating on
One NumberOne Number
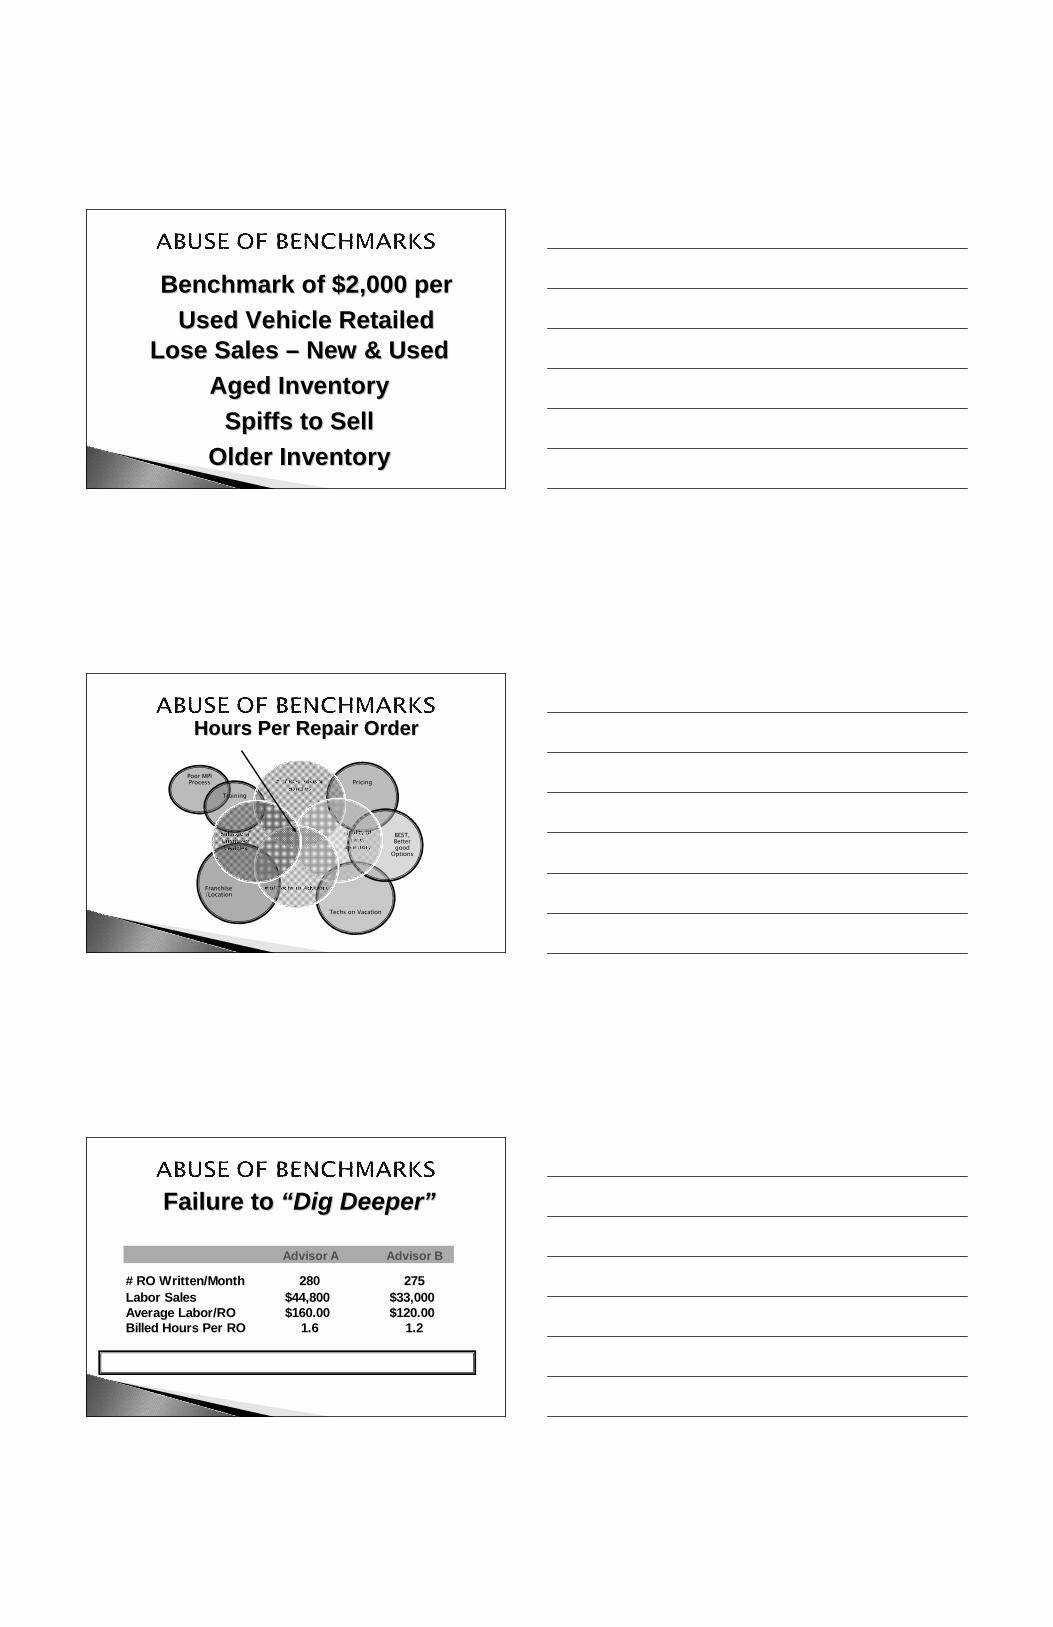
Lose SalesLose Sales –– New & UsedNew & Used
Aged InventoryAged Inventory
Spiffs to SellSpiffs to Sell
Older InventoryOlder Inventory
Benchmark of $2,000 perBenchmark of $2,000 per
Used Vehicle RetailedUsed Vehicle Retailed
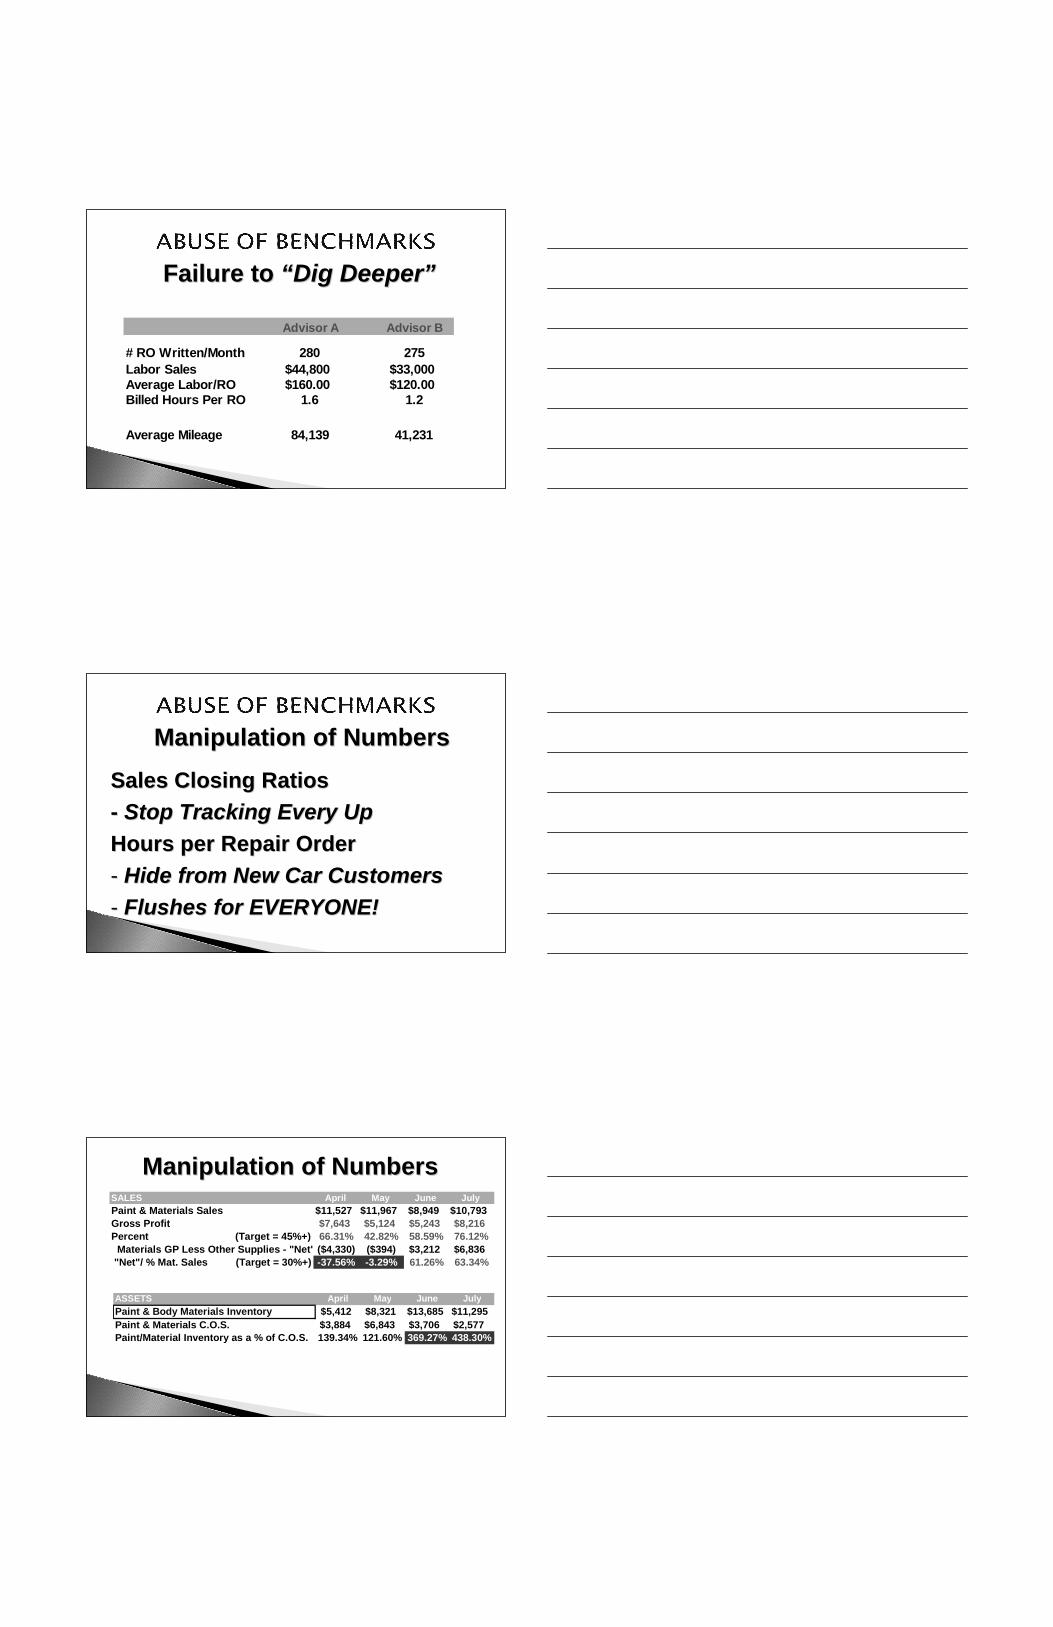
Poor MPIProcess
Training
Pricing
Franchise/Location
Techs on Vacation
BEST,Bettergood
Options
Hours Per Repair OrderHours Per Repair Order
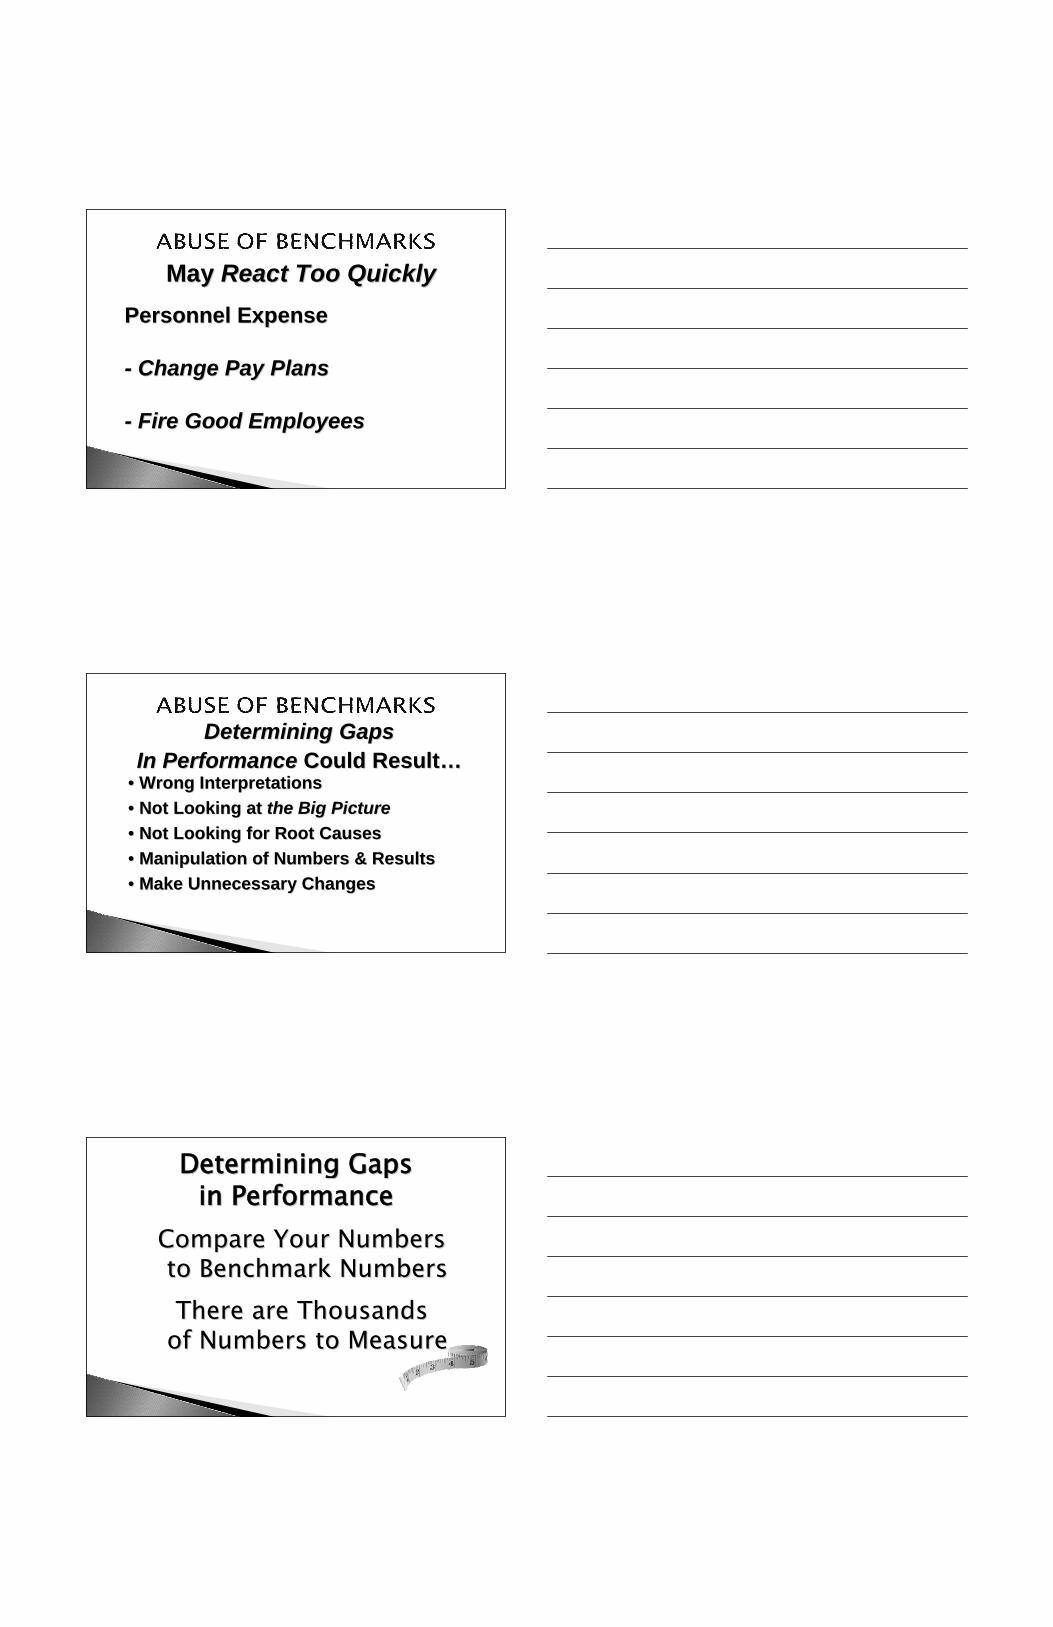
Failure toFailure to ““Dig DeeperDig Deeper””
Advisor A Advisor B
# RO Written/Month 280 275
Labor Sales $44,800 $33,000Average Labor/RO $160.00 $120.00Billed Hours Per RO 1.6 1.2
Average Mileage 84,139 41,231
Failure toFailure to ““Dig DeeperDig Deeper””
Advisor A Advisor B
# RO Written/Month 280 275
Labor Sales $44,800 $33,000Average Labor/RO $160.00 $120.00Billed Hours Per RO 1.6 1.2
Average Mileage 84,139 41,231
Manipulation of NumbersManipulation of Numbers
Sales Closing RatiosSales Closing Ratios
-- Stop Tracking Every UpStop Tracking Every Up
Hours per Repair OrderHours per Repair Order
-- Hide from New Car CustomersHide from New Car Customers
-- Flushes for EVERYONE!Flushes for EVERYONE!
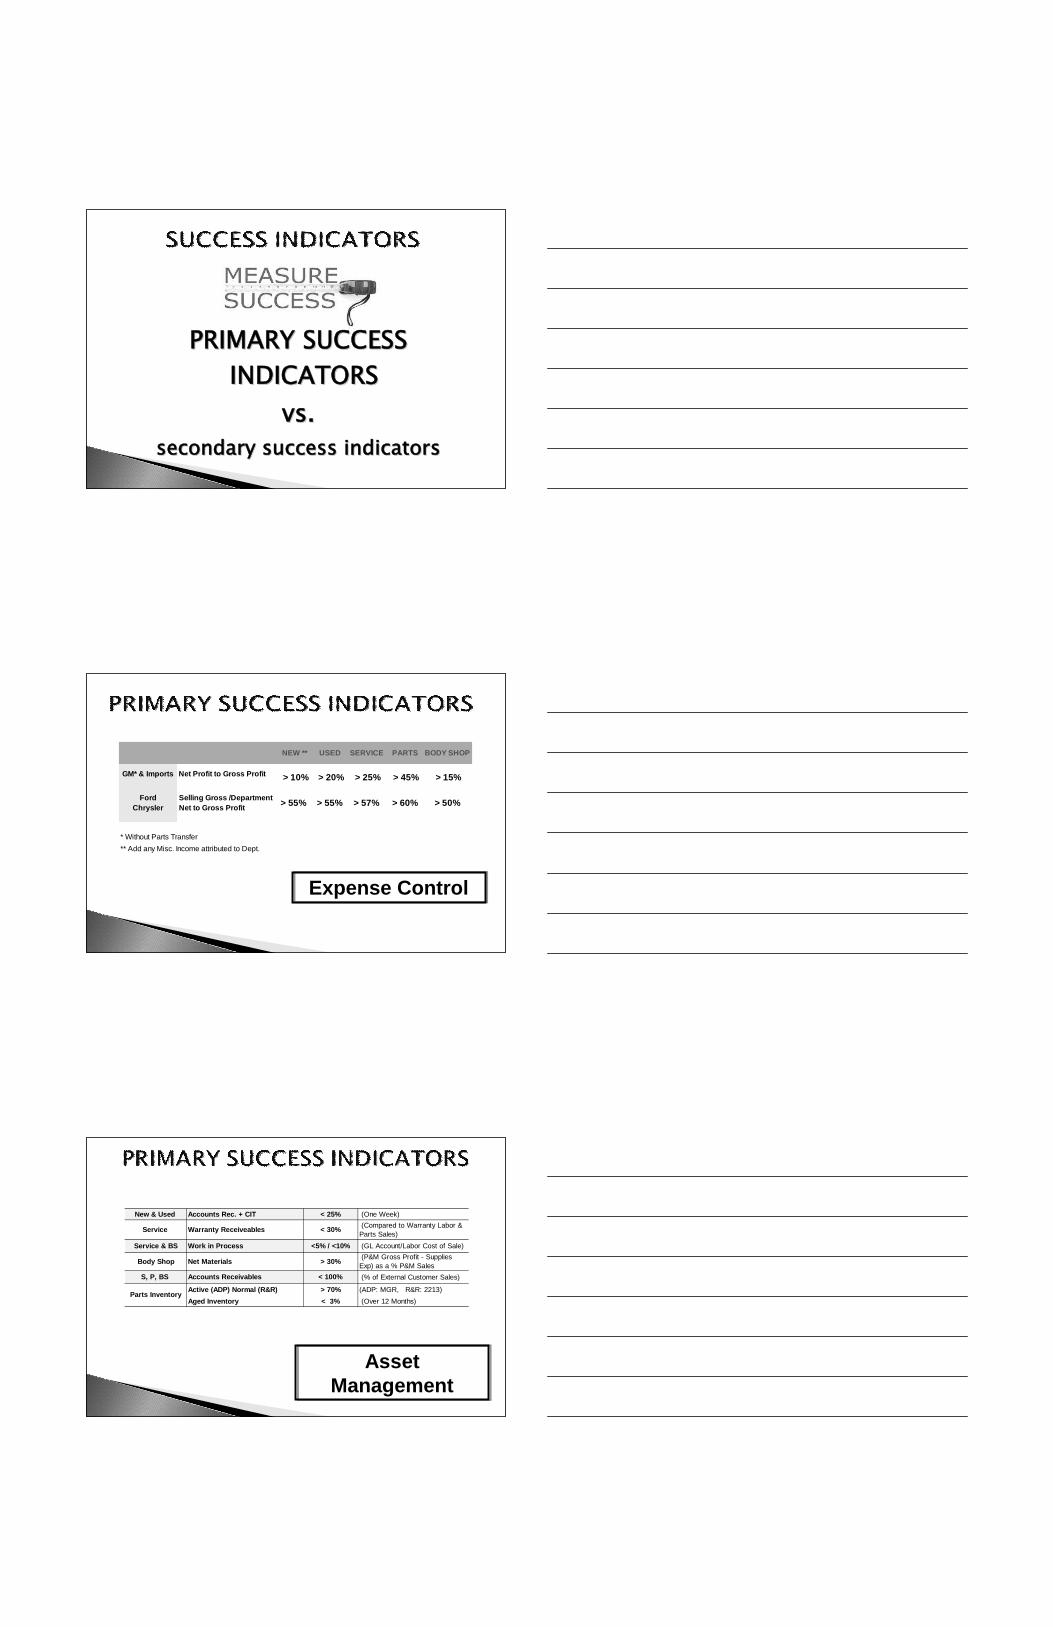
SALES April May June July
Paint & Materials Sales $11,527 $11,967 $8,949 $10,793
Gross Profit $7,643 $5,124 $5,243 $8,216
Percent (Target = 45%+) 66.31% 42.82% 58.59% 76.12%
Materials GP Less Other Supplies - "Net" ($4,330) ($394) $3,212 $6,836
"Net"/ % Mat. Sales (Target = 30%+) -37.56% -3.29% 61.26% 63.34%
ASSETS April May June July
Paint & Body Materials Inventory $5,412 $8,321 $13,685 $11,295
Paint & Materials C.O.S. $3,884 $6,843 $3,706 $2,577
Paint/Material Inventory as a % of C.O.S. 139.34% 121.60% 369.27% 438.30%
Manipulation of NumbersManipulation of Numbers
MayMay React Too QuicklyReact Too Quickly
Personnel ExpensePersonnel Expense
-- Change Pay PlansChange Pay Plans
-- Fire Good EmployeesFire Good Employees
Determining GapsDetermining Gaps
In PerformanceIn Performance Could ResultCould Result……•• Wrong InterpretationsWrong Interpretations
•• Not Looking atNot Looking at the Big Picturethe Big Picture
•• Not Looking for Root CausesNot Looking for Root Causes
•• Manipulation of Numbers & ResultsManipulation of Numbers & Results
•• Make Unnecessary ChangesMake Unnecessary Changes
Determining GapsDetermining Gapsin Performancein Performance
There are ThousandsThere are Thousandsof Numbers to Measureof Numbers to Measure
Compare Your NumbersCompare Your Numbersto Benchmark Numbersto Benchmark Numbers
PRIMARY SUCCESSPRIMARY SUCCESS
INDICATORSINDICATORS
vs.vs.
secondary success indicatorssecondary success indicators
NEW ** USED SERVICE PARTS BODY SHOP
GM* & Imports Net Profit to Gross Profit > 10% > 20% > 25% > 45% > 15%
Ford
Chrysler
Selling Gross /Department
Net to Gross Profit> 55% > 55% > 57% > 60% > 50%
* Without Parts Transfer
** Add any Misc. Income attributed to Dept.
Expense Control
AssetManagement
New & Used Accounts Rec. + CIT < 25% (One Week)
Service Warranty Receiveables < 30%
Service & BS Work in Process <5% / <10% (GL Account/Labor Cost of Sale)
Body Shop Net Materials > 30%
S, P, BS Accounts Receivables < 100% (% of External Customer Sales)
Active (ADP) Normal (R&R) > 70%
Aged Inventory < 3% (Over 12 Months)
(P&M Gross Profit - Supplies
Exp) as a % P&M Sales
(Compared to Warranty Labor &
Parts Sales)
(ADP: MGR, R&R: 2213)Parts Inventory
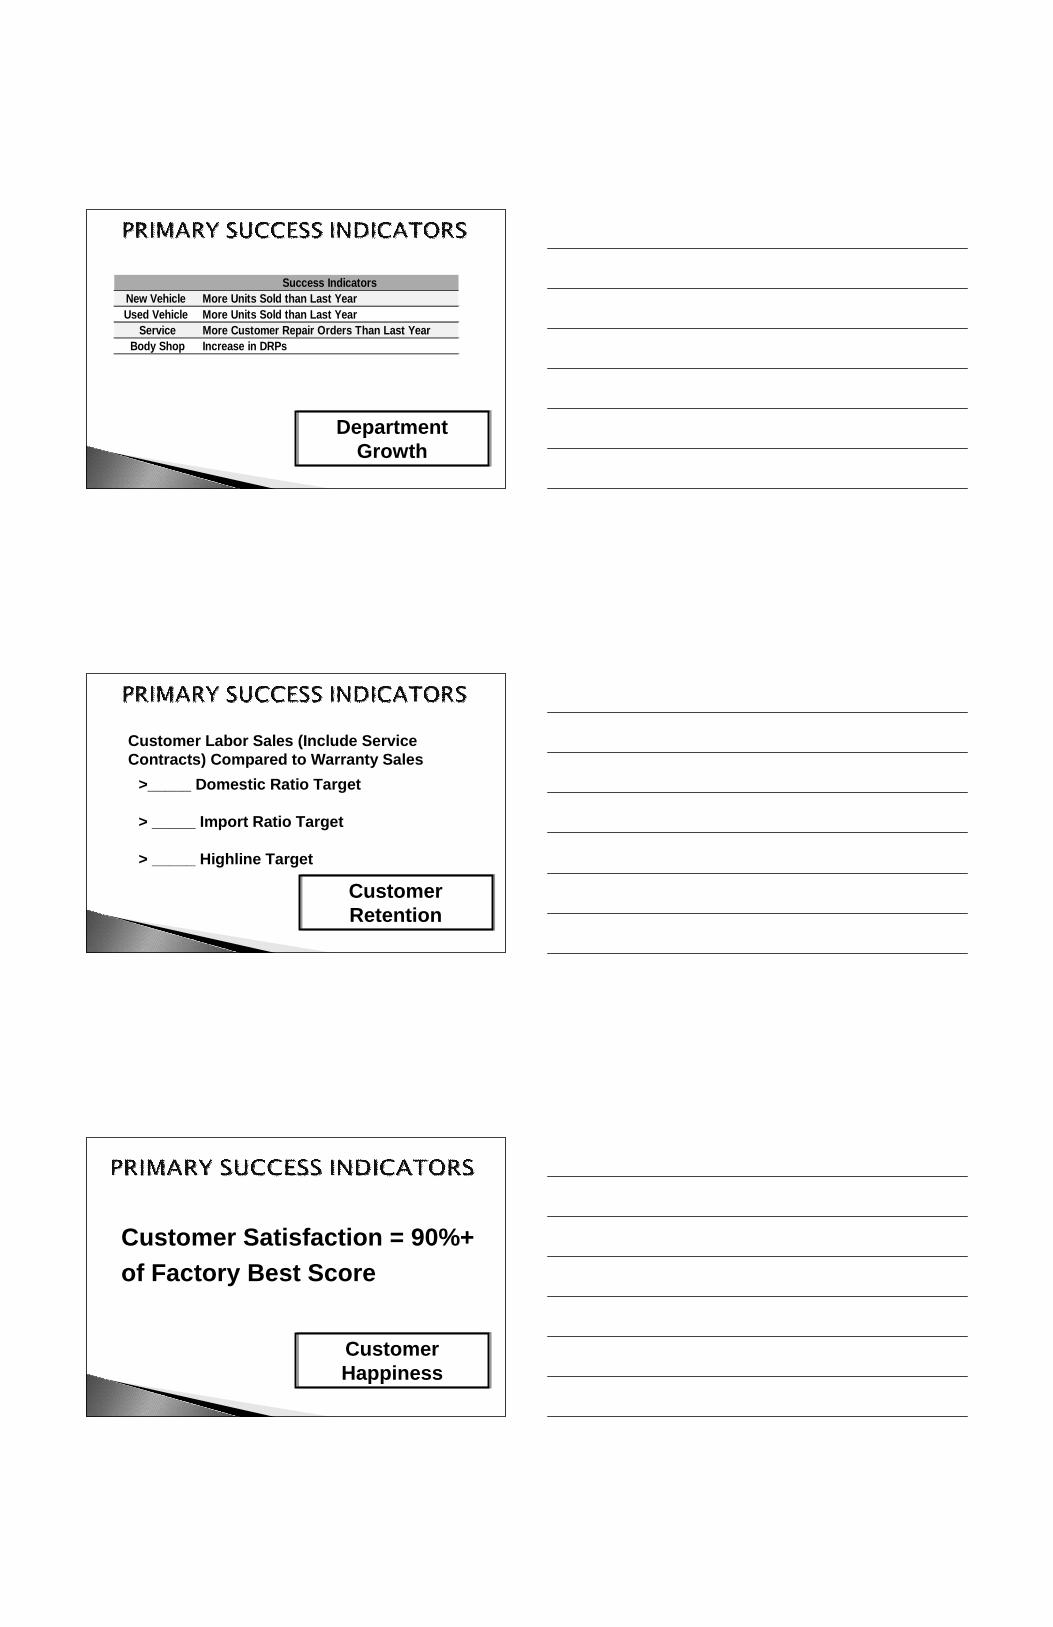
DepartmentGrowth
Success Indicators
New Vehicle More Units Sold than Last Year
Used Vehicle More Units Sold than Last Year
Service More Customer Repair Orders Than Last Year
Body Shop Increase in DRPs
CustomerRetention
Customer Labor Sales (Include ServiceContracts) Compared to Warranty Sales
>_____ Domestic Ratio Target
> _____ Import Ratio Target
> _____ Highline Target
CustomerHappiness
Customer Satisfaction = 90%+
of Factory Best Score
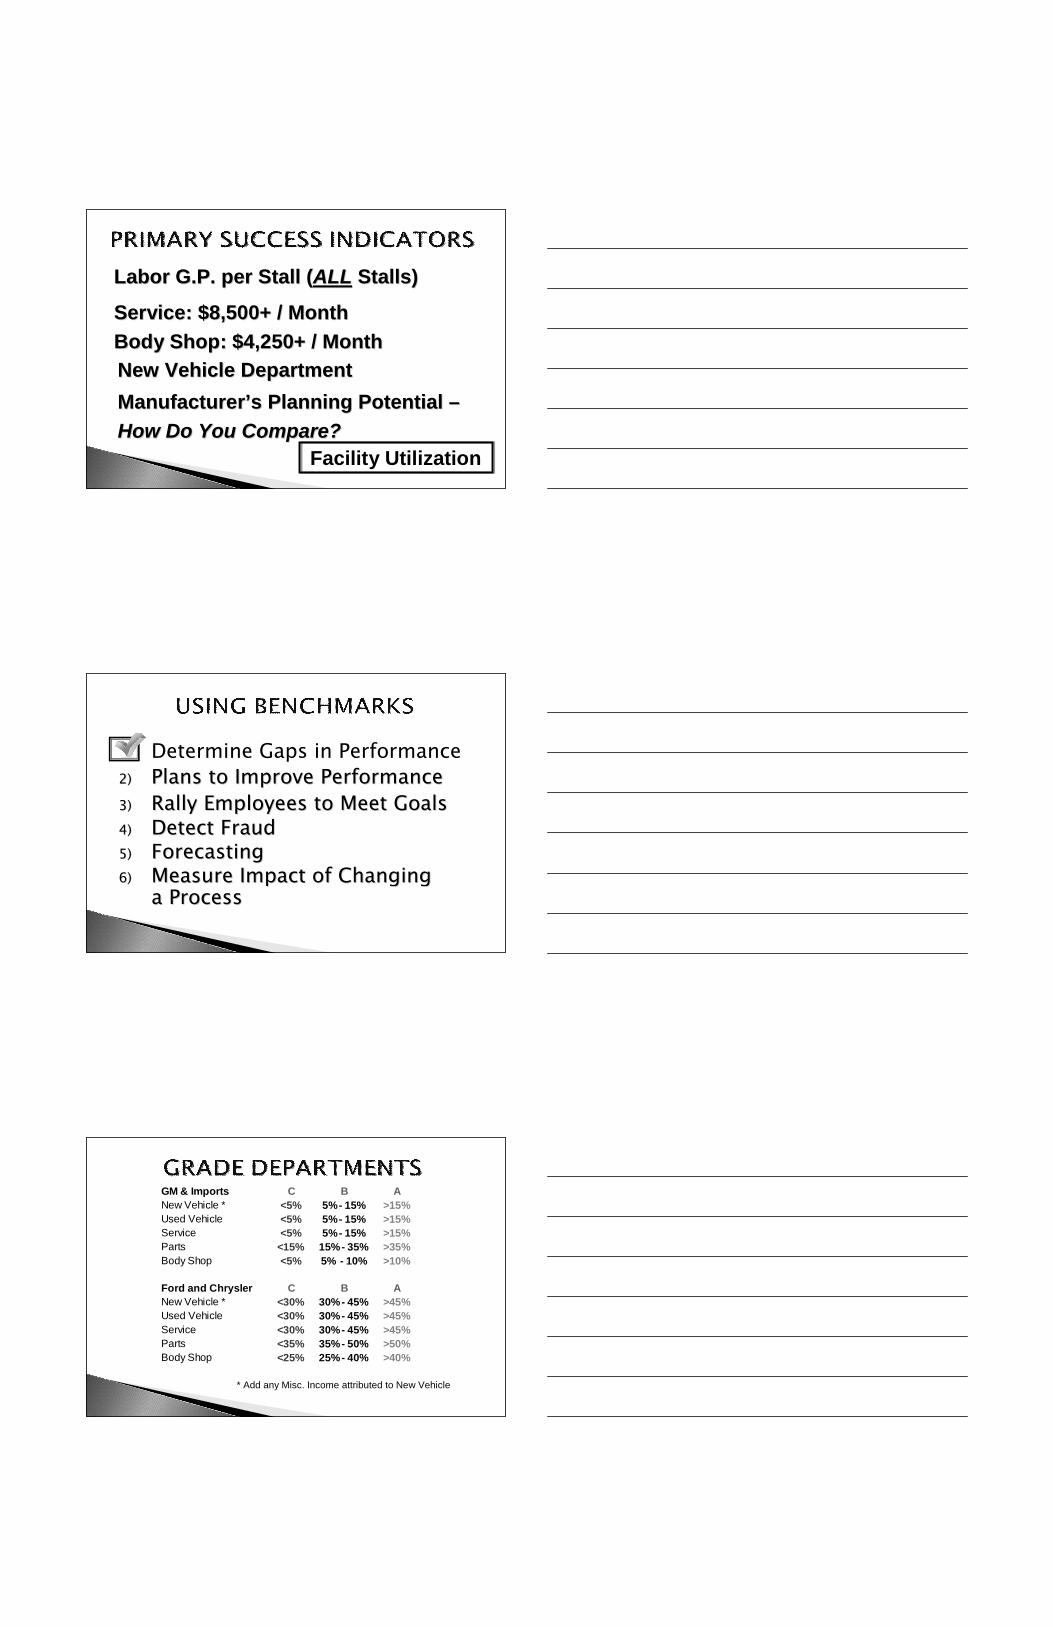
Facility Utilization
Labor G.P. per Stall (Labor G.P. per Stall (ALLALL Stalls)Stalls)
Service: $8,500+ / MonthService: $8,500+ / Month
Body Shop: $4,250+ / MonthBody Shop: $4,250+ / Month
New Vehicle DepartmentNew Vehicle Department
ManufacturerManufacturer’’s Planning Potentials Planning Potential ––
How Do You Compare?How Do You Compare?
1) Determine Gaps in Performance
2)2) Plans to Improve PerformancePlans to Improve Performance
3)3) Rally Employees to Meet GoalsRally Employees to Meet Goals4)4) Detect FraudDetect Fraud5)5) ForecastingForecasting6)6) Measure Impact of ChangingMeasure Impact of Changing
a Processa Process
GM & Imports C B A
New Vehicle * <5% 5%- 15% >15%
Used Vehicle <5% 5%- 15% >15%
Service <5% 5%- 15% >15%
Parts <15% 15%- 35% >35%
Body Shop <5% 5% - 10% >10%
Ford and Chrysler C B A
New Vehicle * <30% 30%- 45% >45%
Used Vehicle <30% 30%- 45% >45%
Service <30% 30%- 45% >45%
Parts <35% 35%- 50% >50%
Body Shop <25% 25%- 40% >40%
* Add any Misc. Income attributed to New Vehicle
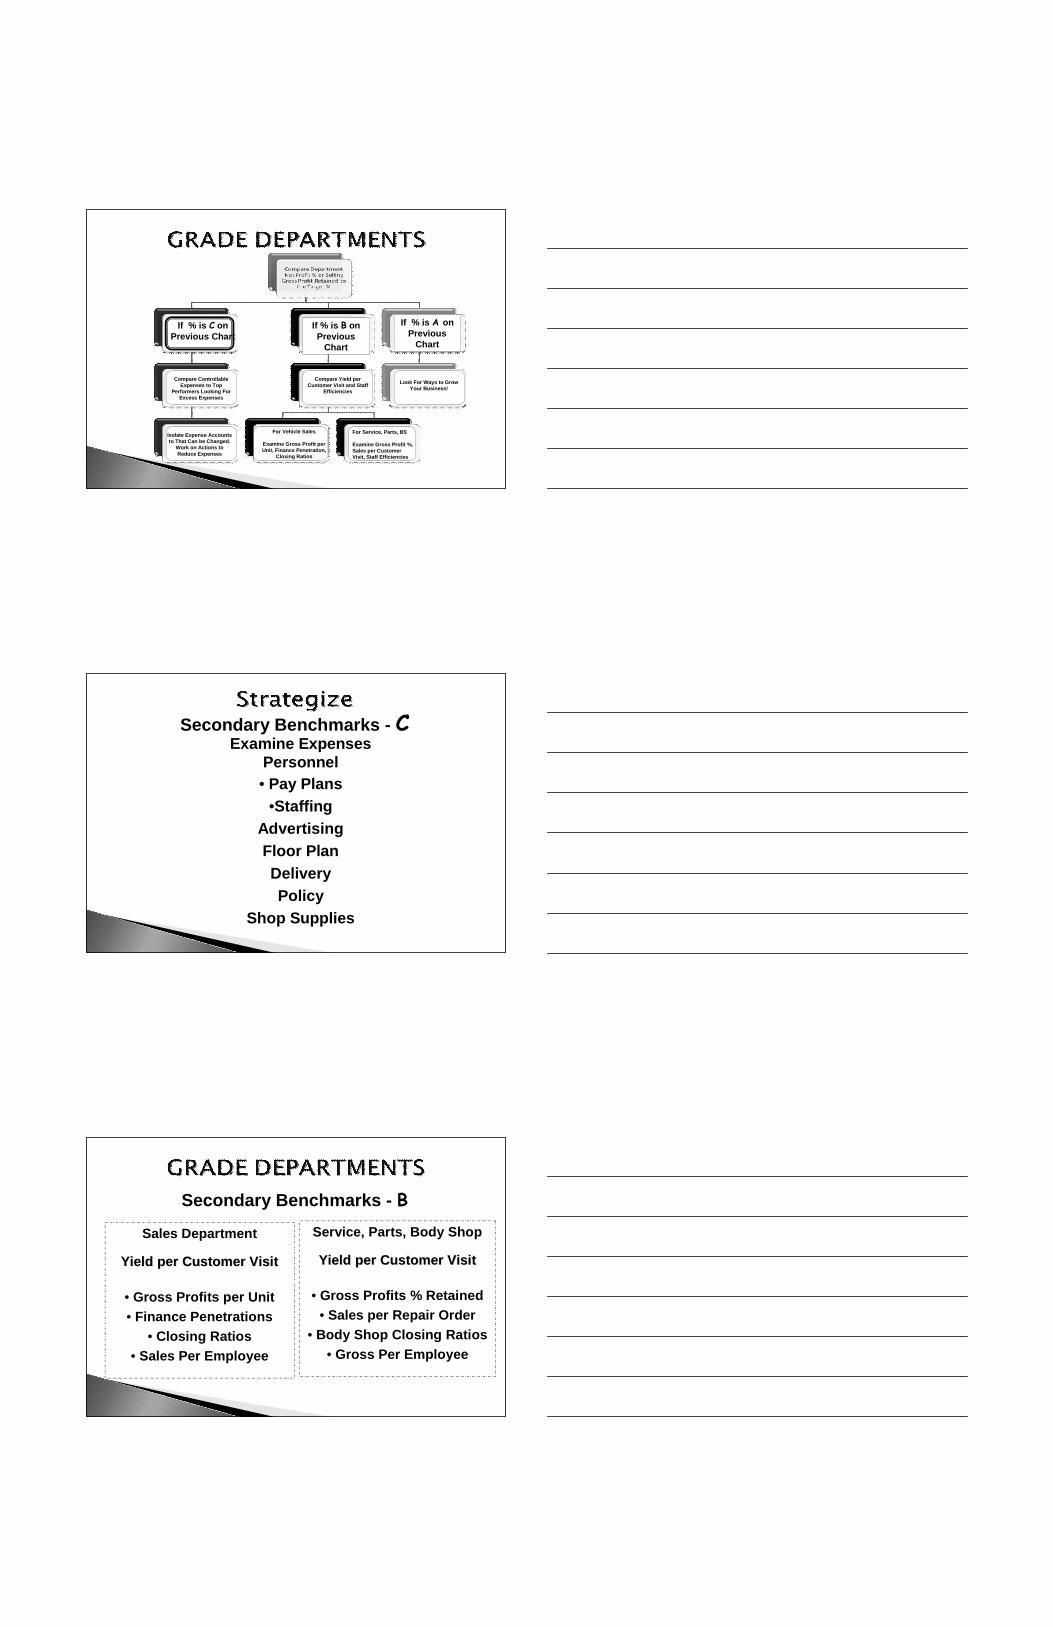
If % is C onPrevious Chart
If % is B onPrevious
Chart
If % is A onPrevious
Chart
For Vehicle Sales
Examine Gross Profit perUnit, Finance Penetration,
Closing Ratios
For Service, Parts, BS
Examine Gross Profit %,Sales per CustomerVisit, Staff Efficiencies
Isolate Expense Accountsto That Can be Changed.
Work on Actions toReduce Expenses
Compare ControllableExpenses to Top
Performers Looking ForExcess Expenses
Compare Yield perCustomer Visit and Staff
Efficiencies
Look For Ways to GrowYour Business!
Secondary Benchmarks - CExamine Expenses
Personnel
• Pay Plans
•Staffing
Advertising
Floor Plan
Delivery
Policy
Shop Supplies
Secondary Benchmarks - B
Sales Department
Yield per Customer VisitYield per Customer Visit
• Gross Profits per Unit
• Finance Penetrations
• Closing Ratios
• Sales Per Employee
Service, Parts, Body Shop
Yield per Customer VisitYield per Customer Visit
• Gross Profits % Retained
• Sales per Repair Order
• Body Shop Closing Ratios
• Gross Per Employee
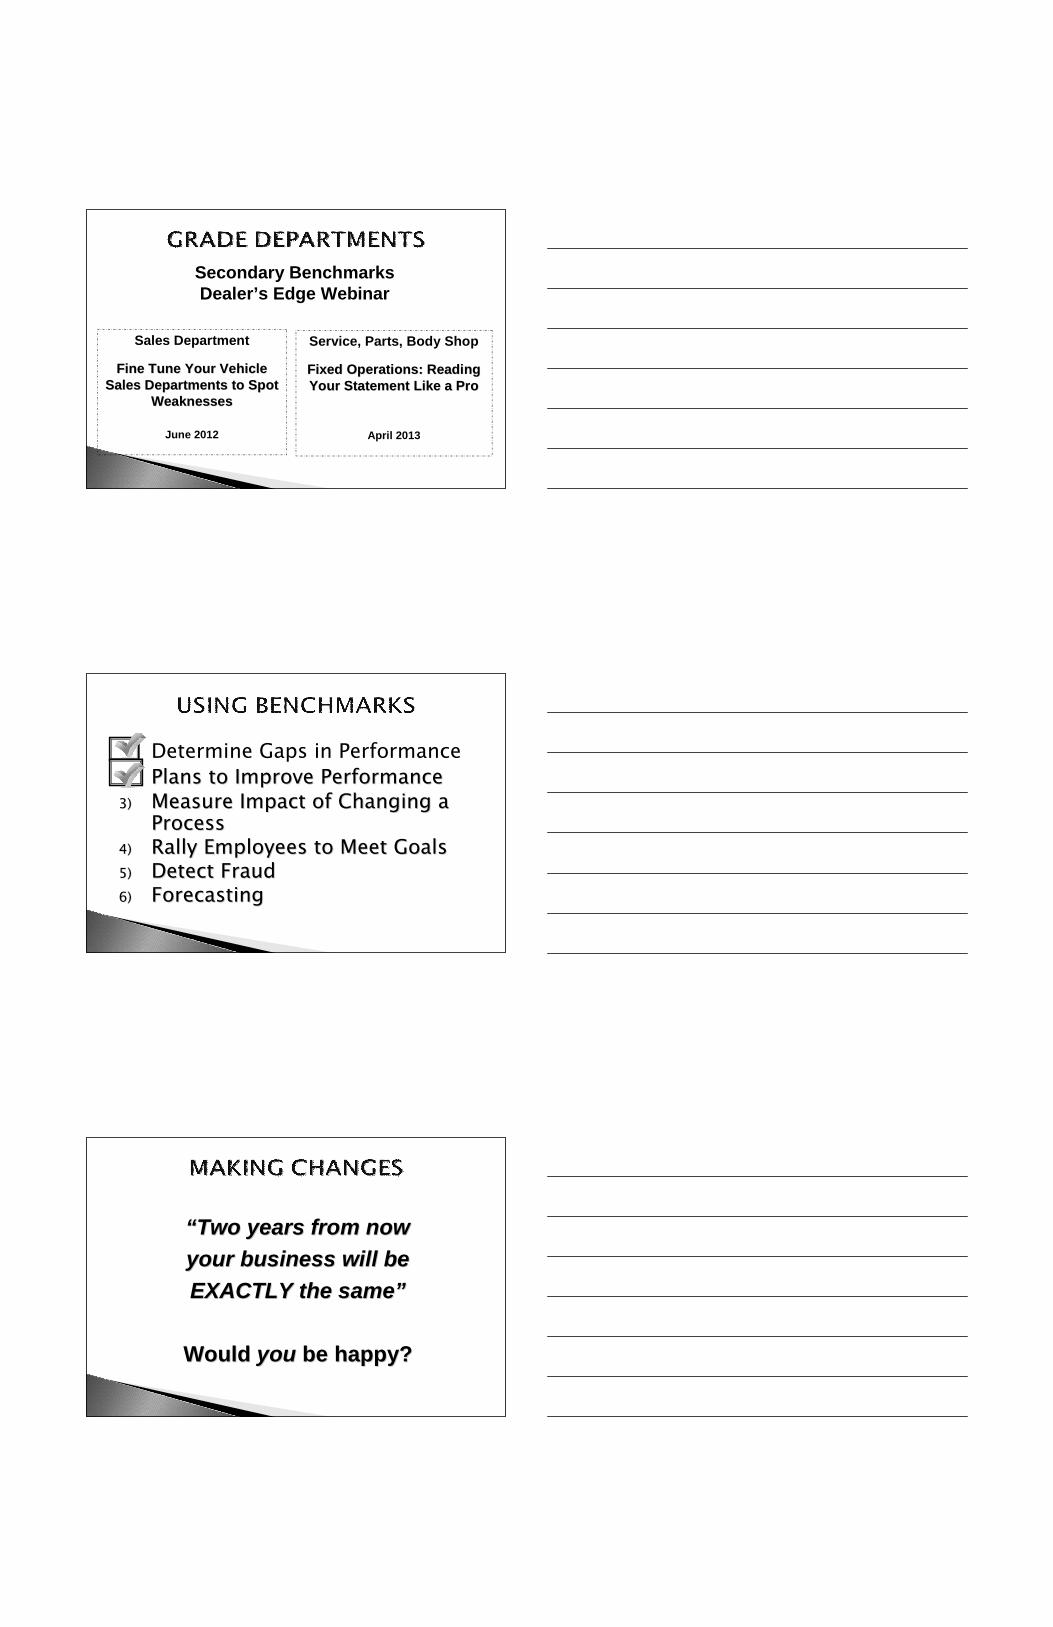
Secondary BenchmarksDealer’s Edge Webinar
Sales Department
Fine Tune Your VehicleFine Tune Your VehicleSales Departments to SpotSales Departments to Spot
WeaknessesWeaknesses
June 2012
Service, Parts, Body Shop
Fixed Operations: ReadingFixed Operations: ReadingYour Statement Like a ProYour Statement Like a Pro
April 2013
1) Determine Gaps in Performance
2)2) Plans to Improve PerformancePlans to Improve Performance3)3) Measure Impact of Changing aMeasure Impact of Changing a
ProcessProcess4)4) Rally Employees to Meet GoalsRally Employees to Meet Goals5)5) Detect FraudDetect Fraud6)6) ForecastingForecasting
““Two years from nowTwo years from now
your business will beyour business will be
EXACTLY the sameEXACTLY the same””
WouldWould youyou be happy?be happy?
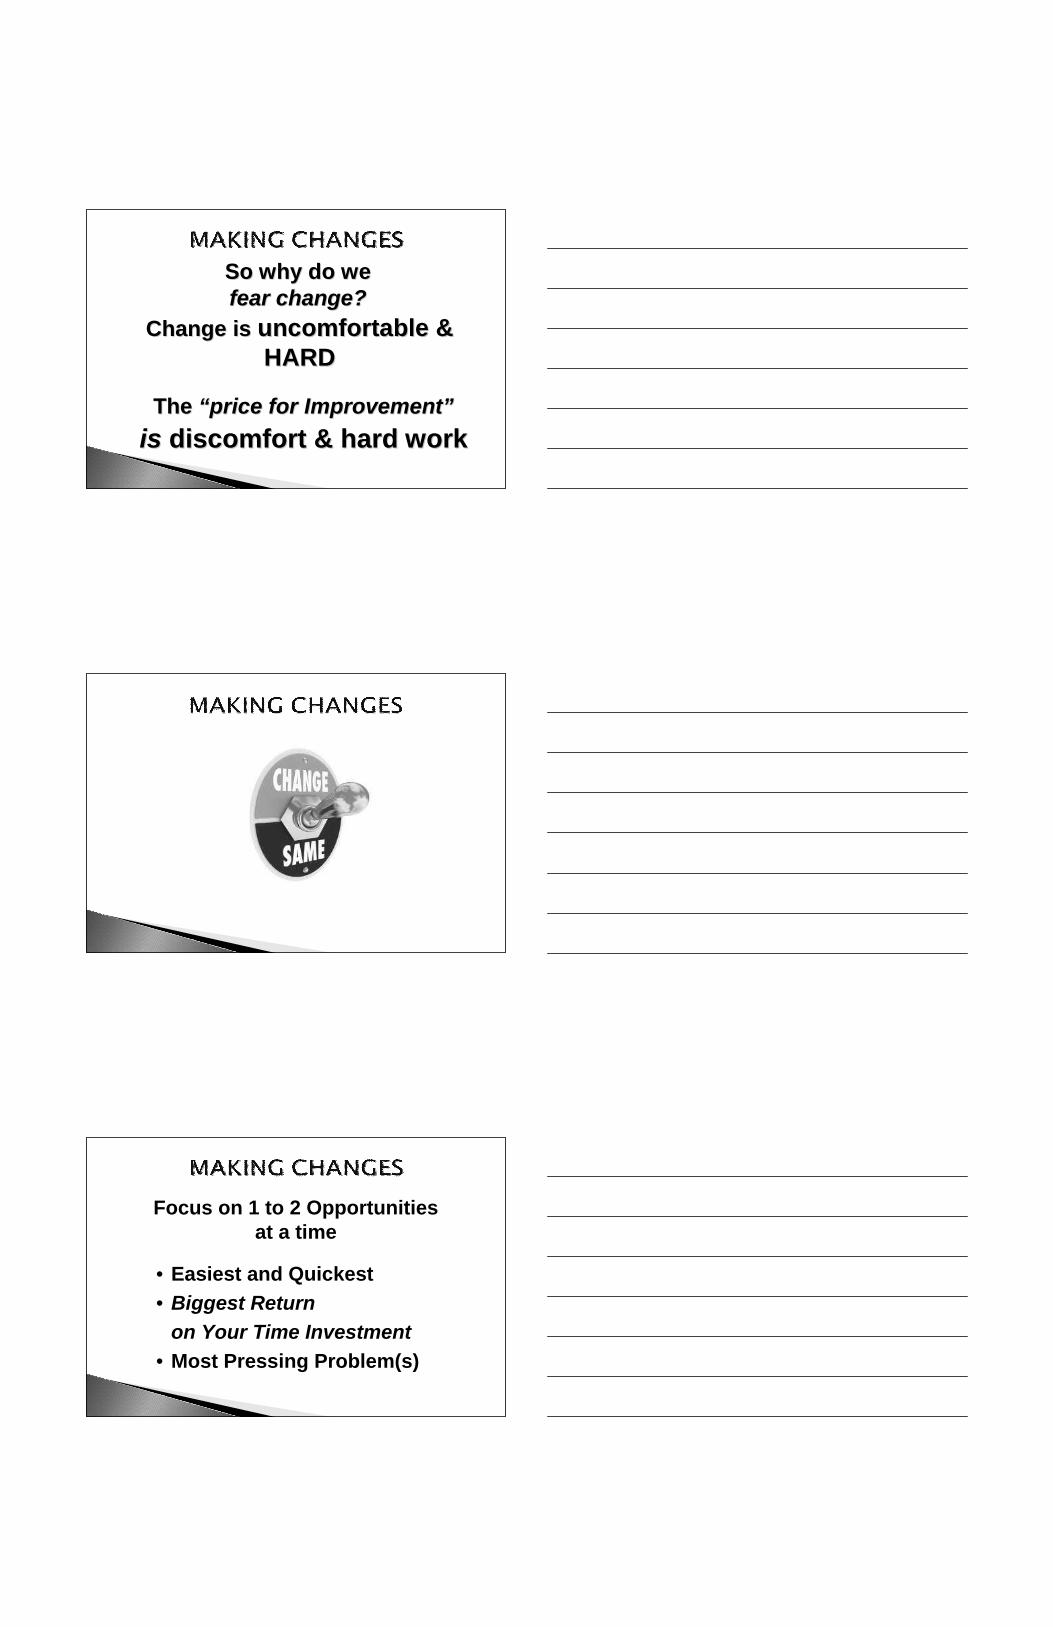
So why do weSo why do wefear change?fear change?
Change isChange is uncomfortable &uncomfortable &HARDHARD
TheThe ““price for Improvementprice for Improvement””
isis discomfort & hard workdiscomfort & hard work
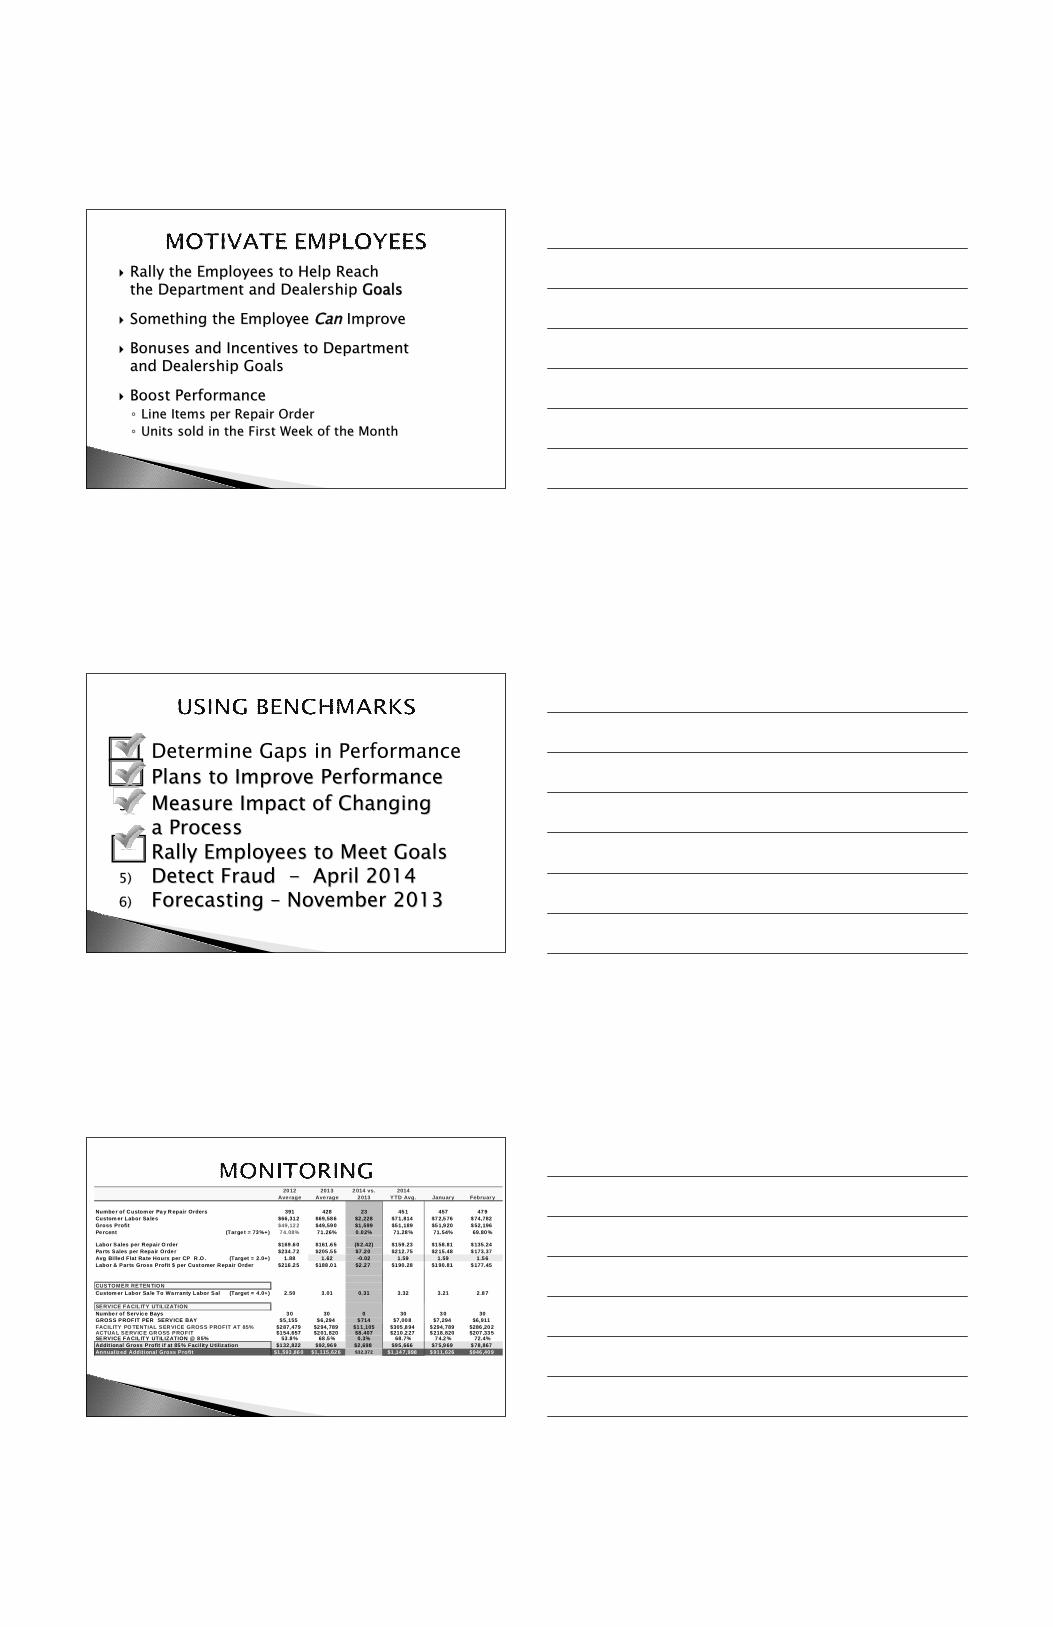
Focus on 1 to 2 Opportunitiesat a time
• Easiest and Quickest
• Biggest Return
on Your Time Investment
• Most Pressing Problem(s)
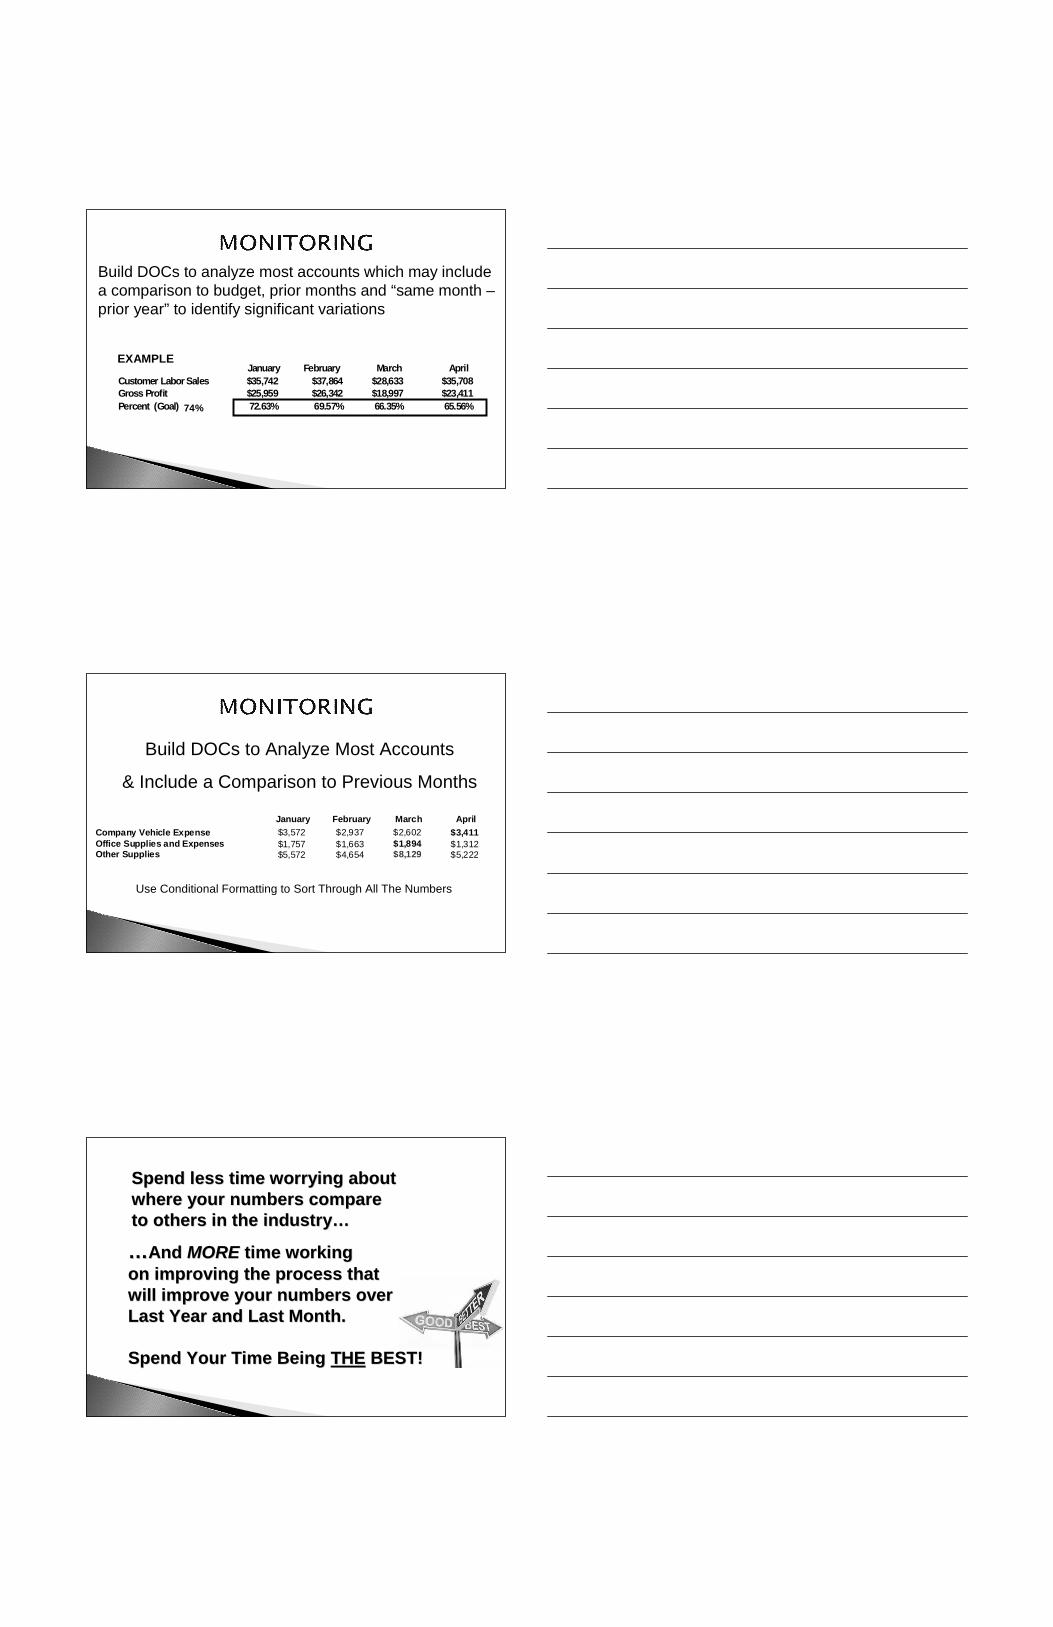
Set a TargetSet a Target –– Gauge ResultsGauge ResultsExternal
Benchmarks
20 Group Composites20 Group CompositesFactory DataFactory Data
NADANADAConsultantsConsultantsAccountantsAccountants
InternalBenchmarks
YourYour TrendsTrendsYourYour Dealer GroupDealer Group
Goals Needed to Reach:Goals Needed to Reach:•• BudgetBudget
•• ProgressProgress
1) Determine Gaps in Performance
2)2) Plans to Improve PerformancePlans to Improve Performance3)3) Measure Impact of ChangingMeasure Impact of Changing
a Processa Process4)4) Rally Employees to Meet GoalsRally Employees to Meet Goals5)5) Detect FraudDetect Fraud6)6) ForecastingForecasting
We Need To Find New Ways To Motivate the Employees
Isn’t NOT firingthem enough?
Rally the Employees to Help ReachRally the Employees to Help Reachthe Department and Dealershipthe Department and Dealership GoalsGoals
Something the EmployeeSomething the Employee CanCan ImproveImprove
Bonuses and Incentives to DepartmentBonuses and Incentives to Departmentand Dealership Goalsand Dealership Goals
Boost PerformanceBoost Performance◦◦ Line Items per Repair OrderLine Items per Repair Order
◦◦ Units sold in the First Week of the MonthUnits sold in the First Week of the Month
1) Determine Gaps in Performance
2)2) Plans to Improve PerformancePlans to Improve Performance
3)3) Measure Impact of ChangingMeasure Impact of Changinga Processa Process
4)4) Rally Employees to Meet GoalsRally Employees to Meet Goals5)5) Detect FraudDetect Fraud -- April 2014April 20146)6) ForecastingForecasting –– November 2013November 2013
20 12 201 3 2 014 vs. 2014
Ave rage Ave rage 2013 YTD Avg. January February
Numbe r of Custom er Pa y R epair Orders 391 428 23 45 1 457 47 9
Custom er Labor Sa les $66,31 2 $69,58 6 $2,228 $71,814 $7 2,5 76 $ 74,782
Gross Profit $49,12 2 $49,59 0 $1,599 $51,189 $5 1,9 20 $ 52,196
Pe rcent (Targe t = 73 %+) 74.08% 71.26% 0 .02% 71.28 % 71.54% 69.80 %
Labor Sales per Repair O rder $169 .6 0 $161 .6 5 ($ 2.42) $159.23 $1 58.81 $ 135.24
Pa rts Sales per Repa ir Orde r $234 .7 2 $205 .5 5 $7 .20 $212.75 $2 15.48 $ 173.37
Avg Billed Flat Rate Hours per CP R .O . (Target = 2.0+) 1.88 1.62 -0.02 1.59 1.59 1 .5 6
Labor & Par ts Gross Profit $ per Customer Repair Order $216 .2 5 $188 .0 1 $2 .27 $190.28 $1 90.81 $ 177.45
CUSTOMER RETEN TION
Custom er Labor Sa le To Wa rranty Labor Sales (Target = 4.0+) 2.50 3.01 0.31 3.32 3.21 2 .8 7896 33.126 9 61 406.885 $99,386 175 130.1999 8391 7.84086
SERVICE FACILITY UTILIZATION
Numbe r of Servic e Bays 3 0 30 0 30 3 0 30GROSS PROFIT PER SERVICE BAY $5,155 $6,294 $714 $7,00 8 $7,294 $6,911
FACILITY PO TENTIAL SERVICE GROSS PROFIT AT 85% $287,479 $294,789 $1 1,105 $305 ,8 94 $ 294,789 $286,20 2ACTUA L SERVICE GR OSS PROFIT $154,657 $201,820 $8,407 $210 ,2 27 $ 218,820 $207,33 5SERVICE FACILITY UTILIZATION @ 8 5% 53 .8 % 68 .5 % 0.3% 68.7% 7 4.2 % 72.4%
Additional Gross Profit if at 85 % Facility Utilization $132,822 $92,96 9 $2,698 $95,666 $7 5,9 69 $ 78,867
Annualized Additional Gross Profit $1,593 ,86 0 $1,115,62 6 $32,372 $1 ,14 7,998 $ 911,626 $946,40 9
Build DOCs to analyze most accounts which may includea comparison to budget, prior months and “same month –prior year” to identify significant variations
January February March April
Customer Labor Sales $35,742 $37,864 $28,633 $35,708Gross Profit $25,959 $26,342 $18,997 $23,411
Percent (Goal) 72.63% 69.57% 66.35% 65.56%
EXAMPLE
74%
Build DOCs to Analyze Most Accounts
& Include a Comparison to Previous Months
January February March April
Company Vehicle Expense $3,572 $2,937 $2,602 $3,411Office Supplies and Expenses $1,757 $1,663 $1,894 $1,312Other Supplies $5,572 $4,654 $8,129 $5,222
Use Conditional Formatting to Sort Through All The Numbers
Spend less time worrying aboutSpend less time worrying aboutwhere your numbers comparewhere your numbers compareto others in the industryto others in the industry……
……AndAnd MOREMORE time workingtime working
on improving the process thaton improving the process thatwill improve your numbers overwill improve your numbers overLast Year and Last Month.Last Year and Last Month.
Spend Your Time BeingSpend Your Time Being THETHE BEST!BEST!
Your Dealership is Unique!Your Dealership is Unique!
Understand the NumbersUnderstand the NumbersBeforeBefore You Leap Into Action!You Leap Into Action!
Brooke Samples, President
Profit Blueprints,LLC
1.866.316.7418
www.blueprintforprofits.com
Net Profit Improvement
Dealership-Proven Plans for
Profit Blueprints, LLCProfit Blueprints, LLC
TS S
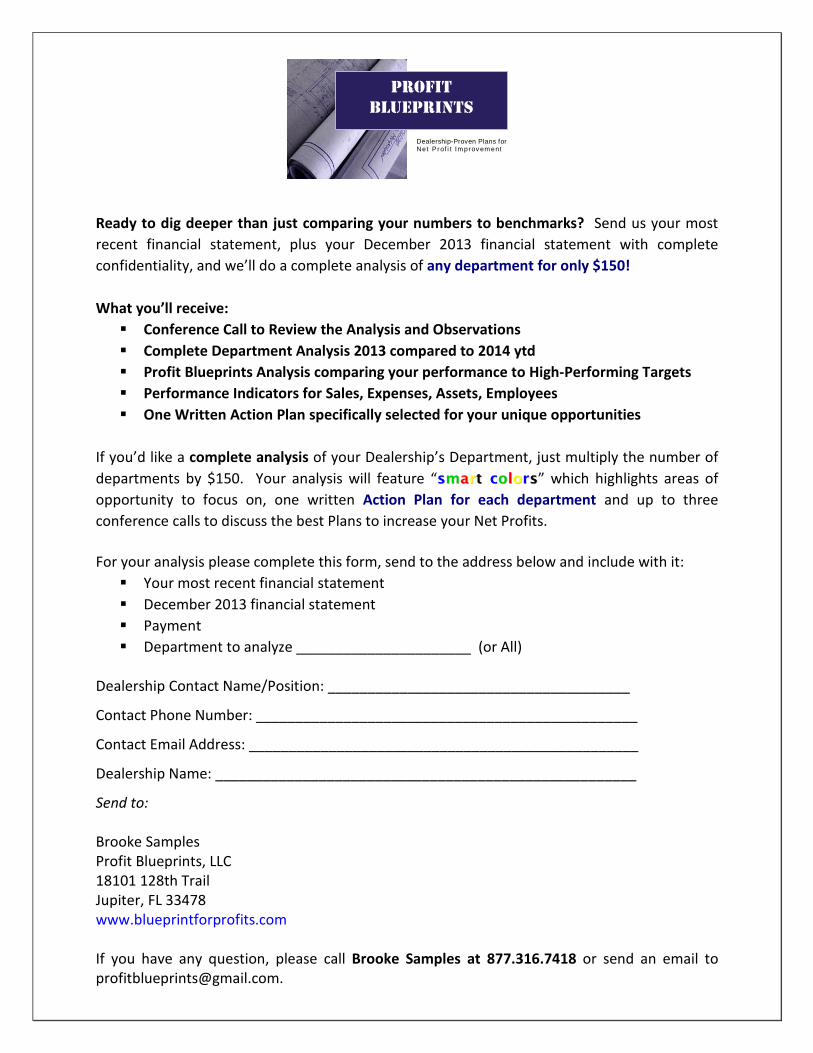
Ready to dig deeper than just comparing your numbers to benchmarks? Send us your most
recent financial statement, plus your December 2013 financial statement with complete
confidentiality, and we’ll do a complete analysis of any department for only $150!
What you’ll receive:
Conference Call to Review the Analysis and Observations
Complete Department Analysis 2013 compared to 2014 ytd
Profit Blueprints Analysis comparing your performance to High-Performing Targets
Performance Indicators for Sales, Expenses, Assets, Employees
One Written Action Plan specifically selected for your unique opportunities
If you’d like a complete analysis of your Dealership’s Department, just multiply the number of
departments by $150. Your analysis will feature “ssmmaarrtt ccoolloorrss” which highlights areas of
opportunity to focus on, one written Action Plan for each department and up to three
conference calls to discuss the best Plans to increase your Net Profits.
For your analysis please complete this form, send to the address below and include with it:
Your most recent financial statement
December 2013 financial statement
Payment
Department to analyze ______________________ (or All)
Dealership Contact Name/Position: ______________________________________
Contact Phone Number: ________________________________________________
Contact Email Address: _________________________________________________
Dealership Name: _____________________________________________________
Send to:
Brooke SamplesProfit Blueprints, LLC18101 128th TrailJupiter, FL 33478www.blueprintforprofits.com
If you have any question, please call Brooke Samples at 877.316.7418 or send an email [email protected].
PROFITBLUEPRINTS
Dealership-Proven Plans forNet Prof i t Im prov em ent


