
Kinetic Modeling And Functional Parameters Evaluation Of ... · International Journal of Basic &...
15
International Journal of Basic & Applied Sciences IJBAS-IJENS Vol:13 No:03 33 138903-4747- IJBAS-IJENS @ June 2013 IJENS I J E N S Kinetic Modeling And Functional Parameters Evaluation Of Mass Transfer Rate On Bio Coagulant Interface In Pharmaceutical Industry Effluent. *Ugonabo V.I 1 , Menkiti, M.C. 2 . Osoka, E.C 3 , Atuanya, C.U. 4 and Onukwuli, O.D 5 . 1,2,5 Department of Chemical Engineering, Nnamdi Azikiwe University, Awka, Nigeria. 3 Department of Chemical Engineering, Federal University of Technology, Owerri , Nigeria. 4 Department of Metallurgical And Materials Engineering, Nnamdi Azikiwe University, Awka, Nigeria. *E-mail:[email protected]: Telephone: +23408033481851 Abstract -- The kinetic modeling and functional parameters evaluation of mass transfer rate on bio coagulant interface in pharmaceutical industry effluent has been investigated at room temperature. To remove the mass particles (in form of total dissolved and suspended solids, TDSS) from the effluent sample. The experiments were carried out using standard Jar test method at varying pH and coagulant doses respectively, while the bio coagulant processing was based on the work reported by [13]. The functional parameters generated indicate the optimum conditions to be 7, 0.6g/l and 40 minutes for pH, dosage and time, respectively. At the optimal pH, TDSS reduced from 1380 to 218.04 mg/l, equivalent to 84.20% removal efficiency at rate constant (k) of 6.332E – 05 l/g.min and corresponding coagulation period ( 1/2 ) of 0.38mins. Thus confirming the biocoagulant as effective bioflocculant . In comparative terms, the biocoagulant was found to be more effective for TDSS removal than Alum at the conditions of the experiment. Index Term-- Bio coagulant, Effluent, Mass transfer, kinetics, Coag- flocculation. 1.0 INT RODUCT ION Pharmaceutical Industry Effluent (PIE) is a major Waste product from production of pharmaceutical products. It is an objectionable pollutant deleterious to the water networks of the pharmaceutical host communities in Nigeria. Waste water disposal from pharmaceutical activities and other sources are the major problem being faced by most developing countries like Nigeria because of lack of wherewithal; modern technologies, and to greater extent stringent measures on the part of government. The most common problem in disposal of wastewaters is their color, and turbidity. Finely dispersed total dissolved and suspended solid particles are responsible for color and turbidity of the wastewaters [12],[25]. Coagulation and flocculation has been found to be effective in the removal of color, turbidity inherent in wastewaters [8],[9],[17],[20][25]. The total dissolved and suspended solid particles inherent in wastewaters generally, carry a negative electrical charge. These particles are surrounded by an electrical double layer as a result of sorption of positively charged ions from the sample medium, which now prevents the rate of approaching each other [23]. Coagulation process is employed by the addition of positively electrical charge coagulant into the waste water rich in dissolved and suspended solid particles, resulting in compression of the double layer and neutralization of electrostatic surface potential of the particles. This phenomenon enables the destabilized particles to stick together when in contact with each order to form microscopic coagulated particles. In the other hand flocculation process is the aggregation of these microscopic coagulated particles to form larger flocs for easy removal from wastewater medium. Readily, coagulation –flocculation has been accomplished through aluminum and iron salts as synthetic coagulants. Though, they are very effective, but the production of large volume of insoluble sludge and other negative attributes undermines their effectiveness. To avert these inherent problems, focus is hereby given to the study of coag-floculation performance of plant origin, corchorus olitorus seed - biocoagulant. Corchorus olitorus, a herbaceous plant of the family tiliaceae, are edible, non- toxic, biogradable and biocompatible substances with some medicinal values are found in large quantity in western Nigeria. The seed kernels of corchorus olitorus contains reasonable amount of positively charged soluble proteins which bind with negatively charged dissolved and suspended solid particles in wastewater to encourage floc formation [18]. Previous results obtained from coag- flocculation performance in pharmaceutical wastewater using corchorus olitorus seed coagulant was impressive [27]. Against this backdrop, this work intend to compare the coag-flocculation performance of corchorus olitorus
Transcript of Kinetic Modeling And Functional Parameters Evaluation Of ... · International Journal of Basic &...

International Journal of Basic & Applied Sciences IJBAS-IJENS Vol:13 No:03 33
138903-4747- IJBAS-IJENS @ June 2013 IJENS I J E N S
Kinetic Modeling And Functional Parameters
Evaluation Of Mass Transfer Rate
On Bio Coagulant Interface In Pharmaceutical Industry Effluent.
*Ugonabo V.I1, Menkiti, M.C.
2. Osoka, E.C
3, Atuanya, C.U.
4 and Onukwuli, O.D
5.
1,2,5 Department of Chemical Engineering, Nnamdi Azikiwe University, Awka, Nigeria.
3 Department of Chemical Engineering, Federal University of Technology, Owerri , Nigeria.
4 Department of Metallurgical And Materials Engineering, Nnamdi Azikiwe University, Awka, Nigeria.
*E-mail:[email protected]: Telephone: +23408033481851
Abstract-- The kinetic modeling and functional parameters
evaluation of mass transfer rate on bio coagulant interface in pharmaceutical industry effluent has been investigated at room
temperature. To remove the mass particles (in form of total
dissolved and suspended solids, TDSS) from the effluent
sample. The experiments were carried out using standard Jar
test method at varying pH and coagulant doses respectively, while the bio coagulant processing was based on the work
reported by [13]. The functional parameters generated indicate
the optimum conditions to be 7, 0.6g/l and 40 minutes for pH,
dosage and time, respectively. At the optimal pH, TDSS
reduced from 1380 to 218.04 mg/l, equivalent to 84.20% removal efficiency at rate constant (k) of 6.332E – 05 l/g.min
and corresponding coagulation period (1/2) of 0.38mins. Thus
confirming the biocoagulant as effective bioflocculant . In
comparative terms, the biocoagulant was found to be more
effective for TDSS removal than Alum at the conditions of the experiment.
Index Term-- Bio coagulant, Effluent, Mass transfer, kinetics,
Coag- flocculation.
1.0 INTRODUCTION
Pharmaceutical Industry Effluent (PIE) is a major Waste
product from production of pharmaceutical products. It is an
objectionable pollutant deleterious to the water networks of
the pharmaceutical host communities in Nigeria.
Waste water disposal from pharmaceutical activities and
other sources are the major problem being faced by most
developing countries like Nigeria because of lack of
wherewithal; modern technologies, and to greater extent
stringent measures on the part of government.
The most common problem in disposal of wastewaters is
their color, and turbidity. Finely dispersed total dissolved
and suspended solid particles are responsible for color and
turbidity of the wastewaters [12],[25]. Coagulation and
flocculation has been found to be effective in the removal of
color, turbidity inherent in wastewaters [8],[9],[17],[20][25].
The total dissolved and suspended solid particles inherent in
wastewaters generally, carry a negative electrical charge.
These particles are surrounded by an electrical double layer
as a result of sorption of positively charged ions from the
sample medium, which now prevents the rate of
approaching each other [23]. Coagulation process is
employed by the addition of positively electrical charge
coagulant into the waste water rich in dissolved and
suspended solid particles, resulting in compression of the
double layer and neutralization of electrostatic surface
potential of the particles. This phenomenon enables the
destabilized particles to stick together when in contact with
each order to form microscopic coagulated particles. In the
other hand flocculation process is the aggregation of these
microscopic coagulated particles to form larger flocs for
easy removal from wastewater medium.
Readily, coagulation–flocculation has been
accomplished through aluminum and iron salts as synthetic
coagulants. Though, they are very effective, but the
production of large volume of insoluble sludge and other
negative attributes undermines their effectiveness. To avert
these inherent problems, focus is hereby given to the study
of coag-floculation performance of plant origin, corchorus
olitorus seed - biocoagulant. Corchorus olitorus, a
herbaceous plant of the family tiliaceae, are edible, non-
toxic, biogradable and biocompatible substances with some
medicinal values are found in large quantity in western
Nigeria. The seed kernels of corchorus olitorus contains
reasonable amount of positively charged soluble proteins
which bind with negatively charged dissolved and
suspended solid particles in wastewater to encourage floc
formation [18]. Previous results obtained from coag-
flocculation performance in pharmaceutical wastewater
using corchorus olitorus seed coagulant was impressive
[27].
Against this backdrop, this work intend to compare
the coag-flocculation performance of corchorus olitorus
International Journal of Basic & Applied Sciences IJBAS-IJENS Vol:13 No:03 34
138903-4747- IJBAS-IJENS @ June 2013 IJENS I J E N S
seed coagulant with aluminum sulphate (Alum) under
varying pH of pharmaceutical effluent, dosage, settling time
at the same experimental conditions. The result obtained
from this work, will determine whether corchorus olitorus
seed coagulant can be applied in large scale water treatment
technology as a good substitute for aluminum sulphate
which has dominated the exercise in the past. Ultimately if
found effective and efficient, the post usage handling and
health challenges associated with aluminum sulphate
coagulant can be ameliorated. Hence determining the rate
of adsorption of total dissolved and suspended particles on
the coagulant interface.
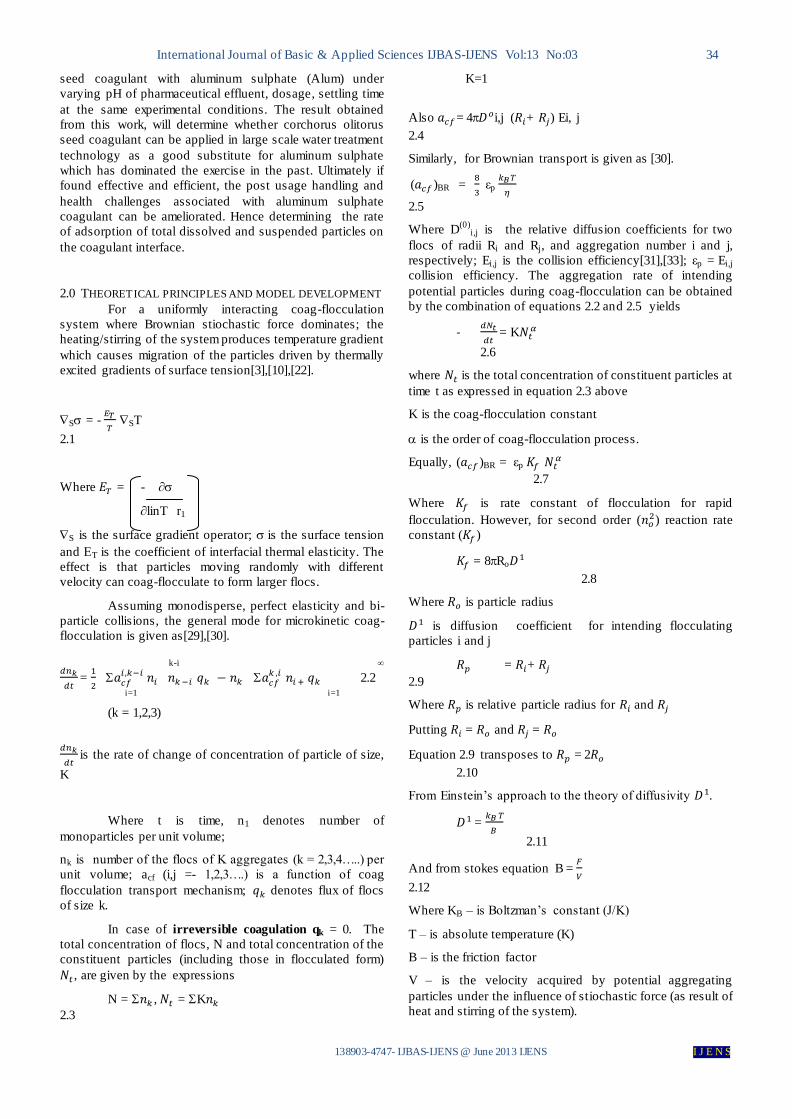
2.0 THEORETICAL PRINCIPLES AND MODEL DEVELOPMENT
For a uniformly interacting coag-flocculation
system where Brownian stiochastic force dominates; the
heating/stirring of the system produces temperature gradient
which causes migration of the particles driven by thermally
excited gradients of surface tension[3],[10],[22].
S = -
ST
2.1
Where = -
linT r1
S is the surface gradient operator; is the surface tension
and T is the coefficient of interfacial thermal elasticity. The
effect is that particles moving randomly with different
velocity can coag-flocculate to form larger flocs.
Assuming monodisperse, perfect elasticity and bi-
particle collisions, the general mode for microkinetic coag-
flocculation is given as[29],[30].
k-i ∞
=
2.2
i=1 i=1
(k = 1,2,3)
is the rate of change of concentration of particle of size,
K
Where t is time, n1 denotes number of
monoparticles per unit volume;
nk is number of the flocs of K aggregates (k = 2,3,4…..) per
unit volume; acf (i,j =- 1,2,3….) is a function of coag
flocculation transport mechanism; denotes flux of flocs
of size k.
In case of irreversible coagulation qk = 0. The
total concentration of flocs, N and total concentration of the
constituent particles (including those in flocculated form)
, are given by the expressions
N = , = K
2.3
K=1
Also = 4 i,j ( + ) Ei, j
2.4
Similarly, for Brownian transport is given as [30].
( )BR =
εp
2.5
Where D(0)
i,j is the relative diffusion coefficients for two
flocs of radii Ri and Rj, and aggregation number i and j,
respectively; Ei,j is the collision efficiency[31],[33]; εp = Ei,j
collision efficiency. The aggregation rate of intending
potential particles during coag-flocculation can be obtained
by the combination of equations 2.2 and 2.5 yields
-
= K
2.6
where is the total concentration of constituent particles at
time t as expressed in equation 2.3 above
K is the coag-flocculation constant
is the order of coag-flocculation process.
Equally, ( )BR = εp
2.7
Where is rate constant of flocculation for rapid
flocculation. However, for second order ( ) reaction rate
constant ( )
= 8Ro
2.8
Where is particle radius
is diffusion coefficient for intending flocculating
particles i and j
= +
2.9
Where is relative particle radius for and
Putting = and =
Equation 2.9 transposes to = 2
2.10
From Einstein’s approach to the theory of diffusivity .
=
2.11
And from stokes equation B =
2.12
Where KB – is Boltzman’s constant (J/K)
T – is absolute temperature (K)
B – is the friction factor
V – is the velocity acquired by potential aggregating
particles under the influence of stiochastic force (as result of
heat and stirring of the system).

International Journal of Basic & Applied Sciences IJBAS-IJENS Vol:13 No:03 35
138903-4747- IJBAS-IJENS @ June 2013 IJENS I J E N S
But for a solid sphere of radius Ro, the stokes equation gives
B = 6 Ro
2.13
where, - is the viscosity of the coag-flocculating fluid.
Substituting equation 2.11, 2.13 into 2.8 yields
Kf =
2.14
Combining equations 2.7 to 2.14 gives:
K =
(acf)BR
2.15
Substituting equations 2.5 and 2.15 into 2.6 yields
-
=
εp
Nt
2.16
For microkinetic aggregation, theoretically equals 2 as
given, [18].
From Ficks first law; number of particles entering sphere
with radius RP per unit time Jt.
= 4Rp2 D
1
2.17
where is flux (number of particles per unit surface and
unit time at position Rp) integrating equation 2.16 at initial
conditions = 0, = 2 .
∫
= ∫
2.18
Thus = 8D1
2.19
Generally, for particle of same size under the
influence of Brownian motion. The initial rate of coag-
flocculation is
-
= εp
2.20
Substituting equations 2.12, 2.13 and 2.19 into 2.20 yields
-
=
εp
2.21
Similarly
-
=
εp
at t > o
Hence, from 2.20 putting, = 2; equation 2.6 transposed to
-
= - K
2.22
Integrating
∫
= - K∫
2.23
Thus
= Kt +
2.24
Plot of
vs t gives a slope of K and intercept of
On evaluation of equation 2.24, 1/2 (Coagulation period) can
be determined.
=
2.25
1 +
Where =
2.26
Substituting equation 2.26 into 2.25 yields
= 2.27
1 +
As t = equation 2.26 transpose to;
=
2.28
Similarly
= 0.5
As 0.5 ;
,
Hence equation 2.25 becomes
= (0.5 )
-1
2.29

International Journal of Basic & Applied Sciences IJBAS-IJENS Vol:13 No:03 36
138903-4747- IJBAS-IJENS @ June 2013 IJENS I J E N S
For a coagulation period, where total number of
concentration is halves, solving equation 2.2 results in
the general expression for particle of mth
order.
(t) = [
]m-1
[1 +
]
m + 1
2.30
Recall;
=
or (0.5 )
-1
For single particle (m = 1)
= 1
2.31
1 +
2
t = 1
2.32
1 +
2
For double particles (m = 2)
= [
]2
1 +
3
2.33
= [
]2
1 +
3
2.34
For triple particles (m = 3)
= [
]3
1 +
4
2.35
= [
]3
2.36
1 +
4
Finally, the evaluation of coag-flocculation efficiency or
coag-flocculant performance of the process was obtained by
applying the relation below.
E i, j (%) = - x 100
2.37
3.0 MATERIALS AND METHODS
3.1 Material sampling, preparation and characterization
3.1.1. Pharmaceutical Industry effluent:
The effluent was taken from pharmaceutical
industry located in Anambra State, Nigeria. The effluent
was characterized in accordance with standard procedure for
examination of water and wastewater analysis[2],[32], and
presented in table 1.
3.1.2 Corchorus Olitorus seed sample.
The seed sample was sourced from Dugbe Market, Ibadan,
Nigeria and processed to bio-coagulant, based on the work
reported by [27]. Subsequently, the sample was
characterized on the basis of [1] AOAC standard method
and presented in table 2.
3.1.3 Coag-Flocculation Experiments
Experiments were conducted using conventional
Jar test apparatus. Appropriate dose of bio-coagulant in the
range of (0.1 to 0.7) g/l was added to 250ml of
pharmaceutical effluent. The suspension tuned to pH range 1
– 13 by addition of 10MHCL/NaOH was subjected to 2
mins rapid mixing (120 rpm), 20mins of flow mixing
(20rpm) and followed by 40mins settling time. During
settling, sample were withdrawn from 2cm depth and
change in total dissolved and suspended solid particle (in
mg/l) measured for aggregation kinetics using lab-tech.
model 212R turbid meter at 2, 4, 6,10, 20, 30 and 40
minutes under room temperature. The same procedure was
repeated using aluminum sulphate as a coagulant for
comparative purposes. The data were subsequently fitted in
appropriate kinetic models for performance evaluations.
International Journal of Basic & Applied Sciences IJBAS-IJENS Vol:13 No:03 37
138903-4747- IJBAS-IJENS @ June 2013 IJENS I J E N S
T ABLE I
CHARACTERISTIC OF PHARMACEUTICAL INDUSTRY EFFLUENT SAMPLE BEFORE TREATMENT
Parameter Values
Temperature (oC) 28
Electrical conductivity (µs/cm) 4.9 x 10²
pH 3.87
Phenol (mg/l) Nil
Odor acidic
Total hardness (mg/l) 6,000
Calcium (mg/l) 594
Magnesium (mg/l) 250
Chlorides (mg/l) 100
Dissolved oxygen (mg/l) 20
Biochemical oxygen Demand (mg/l) 50
Turbidity (mg/l) 1256
Iron (mg/l) Nil
Nitrate (mg/l) Nil
Total acidity (mg/l) 250
Total dissolved solids (mg/l) 225
Total suspended solids (mg/l) 57.25
Total viable court (cfu/mil) 9 x 101
Total coliform MPN/ 100ml Nil
Total coliform count, cfu/nil 1 x 101
Faecal count MPN/mL Nil
Clostridium perfrigens MPN/ml Nil
T ABLE II CHARACTERISTICS OF BIO-CAOGULANT PRECURSOR (CORCHORUS OLITORUS SEED)
Parameter Value
Moisture content % 10
Ash content % 10
Fat content % 8.00
Crude fibre % 20
Crude protein % 29.5
Carbohydrate % 22.43

International Journal of Basic & Applied Sciences IJBAS-IJENS Vol:13 No:03 38
138903-4747- IJBAS-IJENS @ June 2013 IJENS I J E N S
T ABLE III
COAG-FLOCCULATION KINETIC PARAMETERS AND LINEAR REGRESSION COEFFICIENT OF COSC AT VARYING DOSAGE AND PH1
Parameters 0.1g/l 0.2g/l 0.3g/l 0.4g/l 0.5g/l 0.6g/l 0.7g/l
2.000 2.000 2.000 2.000 2.000 2.000 2.000
R2 0.655 0.917 0.703 0.924 0.861 0.817 0.859
K(l/g.min) 1.0E-05 7.34E-06 8.837E-06 1.095E-05 2.03E-05 1.150E-05 8.08E-06
Kf(l3/min) 1.5468E-19 1.5468E-19 1.5468E-19 1.5479E-19 1.5479E-19 1.5484E-19 1.5484E-19
(acf)BR(l3/g.min)2.0E-05 1.468E-05 1.7674E-05 2.19E-05 4.06E-05 2.3E-05 1.616E-05
p(g -1
) 1.2930E+13 9.4906E+13 1.1426E+14 1.4148E+14 2.6229E+14 1.4854E+14 1.0437E+14
1/2(min) 144.93 197.45 164.00 132.35 71.39 126.02 179.37
(-r) 1.0E-05Nt2
7.34E-06Nt2
8.837E-06Nt2
1.095E-05Nt2
2.03E-05Nt2
1.150E-05Nt2
8.08E-06Nt2
N0(g/l3) 873.0574 853.2423 818.0628 931.5324 105.3060 904.56807 1162.7907
T ABLE IV
COAG-FLOCCULATION KINETIC PARAMETERS AND LINEAR REGRESSION COEFFICIENT OF COSC AT VARYING DOSAGE ANDPH3
Parameters 0.1g/l 0.2g/l 0.3g/l 0.4g/l 0.5g/l 0.6g/l 0.7g/l
2.000 2.000 2.000 2.000 2.000 2.000 2.000
R2 0.932 0.722 0.976 0.839 0.847 0.931 0.800
K(l3/g.min) 1.2E-05 7.49E-06 2.145E-05 8.287E-06 9.86E-06 1.030E-05 8.29E-06
Kf(l3/min) 1.5443E-19 1.5443E-19 1.5443E-19 1.5448E-19 1.5448E-19 1.5448E-19 1.5448E-19
(acf)BR(l3/g.min)2.4E-05 1.498E-05 4.29E-05 1.6574E-05 1.972E-05 2.063E-05 1.658E-05
p(g -1
) 1.5541E+14 9.7002E+13 2.7780E+14 1.0729E+14 1.2765E+14 1.3335E+14 1.07337E+14
1/2(min) 90.58 145.12 50.67 131.16 110.24 105.53 131.12
(-r) 1.02E-05Nt2
7.49E-06Nt2
2.145-05Nt2
8.287-06Nt2
9.86E-065Nt2
1.030E-05Nt2
8.29E-06Nt2
N0(g/l3) 973.7098 1057.0825 1138.0448 1157.5414 1368.1762 1203.5143 1251.5645
International Journal of Basic & Applied Sciences IJBAS-IJENS Vol:13 No:03 39
138903-4747- IJBAS-IJENS @ June 2013 IJENS I J E N S
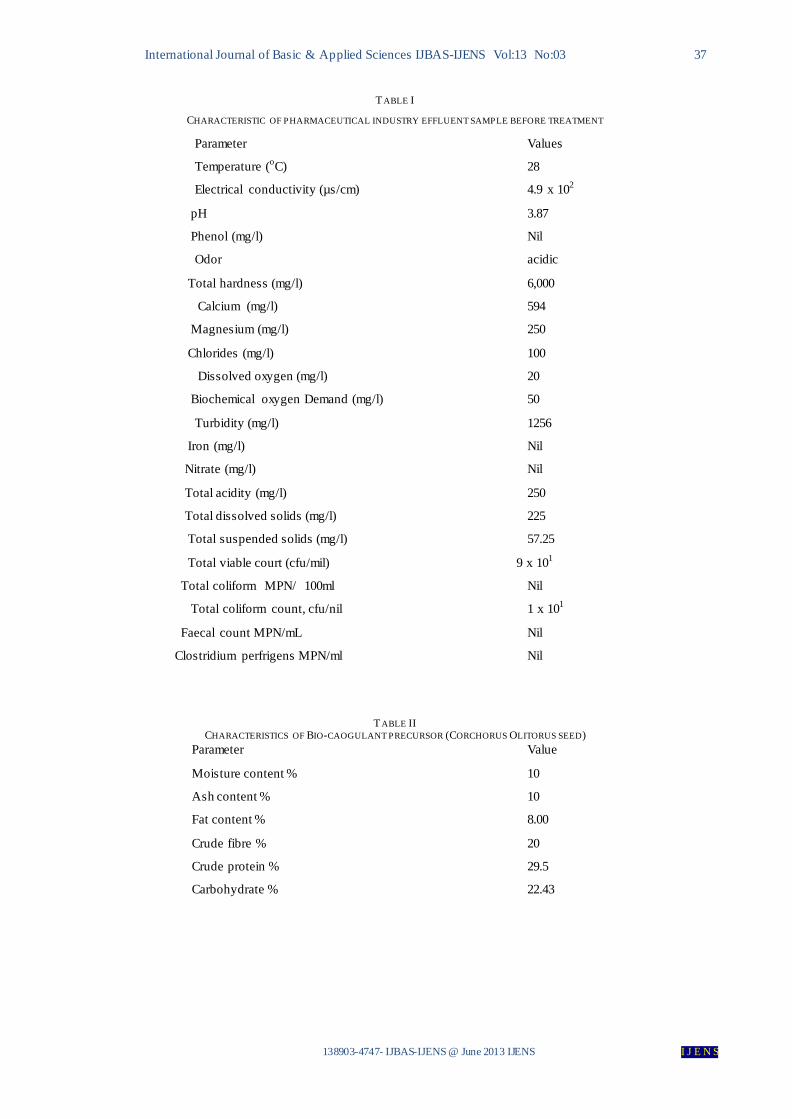
T ABLE V
COAG-FLOCCULATION KINETIC PARAMETERS AND LINEARREGRESSION COEFFICIENT OF COSC AT VARYING DOSAGE AND PH 5
Parameters 0.1g/l 0.2g/l 0.3g/l 0.4g/l 0.5g/l 0.6g/l 0.7g/l
2.000 2.000 2.000 2.000 2.000 2.000 2.000
R2 0.851 0.844 0.689 0.919 0.871 0.806 0.850
K(l3/g.min) 6E-06 5.83E-06 7.437E-06 9.751E-06 1.26E-05 9.7E-06 1.4E-05
Kf(l3/min) 1.5750E-19 1.5750E-19 1.5775E-19 1.5775E-19 1.5775E-19 1.5775E-19 1.5801E-19
(acf)BR(l3/g.min)1.2E-05 1.166E-05 1.4874E-05 1.9502E-05 2.52E-05 1.94E-05 2.80E-05
p(g -1
) 7.6190E+13 7.4032E+13 1.4288E+13 1.2363E+14 1.25975E+14 1.2298E+14 2.7720E+14
1/2(min) 241.55 248.59 194.87 148.63 115.02 149.41 103.52
(-r) 6E-06Nt2
5.83E-06Nt2
7.437E-06Nt2
9.751E-06Nt2
1.26E-05Nt2
9.7E-06Nt2
1.4E-05Nt2
N0(g/l3) 622.6650 914.9131 955.6575 929.0227 922.5943 1042.9704 1126.1261
T ABLE VI
COAG-FLOCCULATION KINETIC PARAMETERS AND LINEARREGRESSION COEFFICIENT OF COSC AT VARYING DOSAGE AND pH 7
Parameters 0.1g/l 0.2g/l 0.3g/l 0.4g/l 0.5g/l 0.6g/l 0.7g/l
2.000 2.000 2.000 2.000 2.000 2.000 2.000
R2 0.836 0.847 0.762 0.828 0.823 0.860 0.757
K(l3/g.min) 4.0E-05 4.43E-05 5.155E-05 3.305E-05 3.38E-05 6.322E-05 3.39E-05
Kf(l3/min) 1.5417E-19 1.5417E-19 1.5417E-19 1.5417E-19 1.5443E-19 1.5443E-19 1.5443E-19
(acf)BR(l3/g.min)8.0E-05 8.86E-05 5.155E-05 6.61E-05 6.76E-05 1.2644E-04 6.78E-05
p(g -1
) 7.1891E+14 5.746E+14 3.343E+14 4.2875E+14 4.3774E+14 8.1875E+14 4.309E+14
1/2(min) 36.23 32.72 28.11 43.85 42.88 22.92 42.75
(-r) 4.0-05Nt2
4.43E-05Nt2
5.155E-05Nt2
3.305E-05Nt2
3.38E-05Nt2
16.322E-05Nt2
3.39E-05Nt2
N0(g/l3) 317.6620 502.7652 444.1681 589.5531 815.8603 1097.3335 739.6450

International Journal of Basic & Applied Sciences IJBAS-IJENS Vol:13 No:03 40
138903-4747- IJBAS-IJENS @ June 2013 IJENS I J E N S
T ABLE VII
COAG-FLOCCULATION KINETIC PARAMETERS AND LINEARREGRESSION COEFFICIENT OF COSC AT VARYING DOSAGE AND PH10
Parameters 0.1g/l 0.2g/l 0.3g/l 0.4g/l 0.5g/l 0.6g/l 0.7g/l
2.000 2.000 2.000 2.000 2.000 2.000 2.000
R2 0.743 0.827 0.848 0.866 0.84 0.922 0.967
K(l3/g.min) 4.4E-05 4.02E-05 5.741E-05 1.822E-05 1.60E-05 1.163E-05 2.90E-05
Kf(l3/min) 1.5622E-19 1.5647E-19 1.5647E-19 1.5647E-19 1.5673E-19 1.5673E-19 1.5673E-19
(acf)BR(l3/g.min) 8.8E-05 8.04E-05 1.1482E-05 3.644E-05 3.2E-05 2.326E-05 5.8E-05
p(g -1
) 5.6331E+14 5.1384E+14 7.3381E+13 2.3289E+14 2.0417E+14 1.4841E+14 3.7006E+14
1/2(min) 32.94 36.05 252.44 79.54 90.58 124.62 49.98
(-r) 4.4E-05Nt2
4.02E-05Nt2
85.741E-06Nt2
1.822E-05Nt2
1.60E-05Nt2
1.163E-05Nt2
2.90E-05Nt2
N0(glL3) 280.1905 440.1408 970.6853 931.0987 1018.0189 1399.5801 1310.6160
T ABLE VIII
COAG-FLOCCULATION KINETIC PARAMETERS AND LINEARREGRESSION COEFFICIENT OF COC AT VARYING DOSAGE ANDPH13
Parameters 0.1g/l 0.2g/l 0.3g/l 0.4g/l 0.5g/l 0.6g/l 0.7g/l
2.000 2.000 2.000 2.000 2.000 2.000 2.000
R2 0.490 0.324 0.579 0.621 0.626 0.881 0.904
K(l3/g.min) 2.7E-05 1.35E-05 1.050E-05 9089E-06 1.71E-06 4.518E-06 1.10E-06
KR(l3/min) 1.5647E-19 1.5647E-19 1.5647E-19 1.5673E-19 1.5673E-19 1.5673E-19 1.5673E-19
(acf)BR(l3/g.min)5.4E-05 2.7E-05 2.1E-05 1.8178E-05 3.42E-06 9.036E-06 2.20E-06
p(g -1
) 3.4511E+14 1.7256E+14 1.3421E+14 1.1598E+14 2.1821E+14 5.7653E+13 1.4037E+13
1/2(min) 40.26 80.52 103.52 119.58 635.65 240.48 988.14
(-r) 2.7E-05Nt2
1.35E-05Nt2
1.050E-06Nt2
9.089E-06Nt2
1.71E-06Nt2
4.518E-06Nt2
1.10E-06Nt2
N0(g/l3) 695.8941 758.7253 935.1038 1072.5011 1186.9436 1325.2054 1317.5231

International Journal of Basic & Applied Sciences IJBAS-IJENS Vol:13 No:03 41
138903-4747- IJBAS-IJENS @ June 2013 IJENS I J E N S
Fig. 1. Representative rate Linear Plot of 1/TDSS Vs T ime for pH=7
Fig. 2. Plot of Efficiency (E%) Vs T ime for pH 1 and varying COSC dosages
Fig. 3. Plot of Efficiency (E%) Vs T ime For pH 3 and varying COSC dosages
00.00050.001
0.00150.002
0.00250.003
0.00350.004
0.00450.005
0 10 20 30 40 50
1/T
DSP
(l
/g)
Time (mins)
0.1g/l
0.2g/l
0.3g/l
0.4g/l
0.5g/l
0.6g/l
0.7g/l
0
10
20
30
40
50
60
70
2 4 6 10 20 30 40
Effi
cie
ncy
(E%
)
Time (mins)
0.1g/l
0.2g/l
0.3g/l
0.4g/l
0.5g/l
0.6g/l
0.7g/l
0
10
20
30
40
50
60
70
80
2 4 6 10 20 30 40
Effi
cie
ncy
(E%
)
Time (mins)
0.1g/l
0.2g/l
0.3g/l
0.4g/l
0.5g/l
0.6g/l
0.7g/l

International Journal of Basic & Applied Sciences IJBAS-IJENS Vol:13 No:03 42
138903-4747- IJBAS-IJENS @ June 2013 IJENS I J E N S
Fig. 4. Plot of Efficiency Vs T ime for pH 5 and varying COSC dosages
Fig. 5. Plot of Efficiency (E%) Vs T ime for pH 7 and varying COSC dosages.
Fig. 6. Plot of Efficiency (E%) Vs T ime for pH 10 and varying COSC dosages
0
10
20
30
40
50
60
70
2 4 6 10 20 30 40
Effi
cie
ncy
(E%
)
Time (mins)
0.1g/l
0.2g/l
0.3g/l
0.4g/l
0.5g/l
0.6g/l
0.7g/l
0
10
20
30
40
50
60
70
80
90
2 4 6 10 20 30 40
0.1g/l
0.2g/l
0.3g/l
0.4g/l
0.5g/l
0.6g/l
0.7g/l
0
10
20
30
40
50
60
70
80
90
2 4 6 10 20 30 40
Effi
cie
ncy
(E%
)
Time (mins)
0.1g/l
0.2g/l
0.3g/l
0.4g/l
0.5g/l
0.6g/l
0.7g/l

International Journal of Basic & Applied Sciences IJBAS-IJENS Vol:13 No:03 43
138903-4747- IJBAS-IJENS @ June 2013 IJENS I J E N S
Fig. 7. Plot of Efficiency (E%) Vs T ime for pH 13 and varying COSC dosages
Fig. 8. Plot of Efficiency (E%) Vs Dosage at 40mins
Fig. 9. Plot of Efficiency (E%) Vs pH at 40mins
0
10
20
30
40
50
60
70
80
2 4 6 10 20 30 40
Effi
cie
ncy
(E%
)
Time (mins)
0.1g/l
0.2g/l
0.3g/l
0.4g/l
0.5g/l
0.6g/l
0.7g/l
0
10
20
30
40
50
60
70
80
90
0.1 0.2 0.3 0.4 0.5 0.6 0.7
Effi
cie
ncy
(E%
)
Dosage (g/l)
pH=1
pH=3
pH=5
pH=7
pH=10
pH=13
0
10
20
30
40
50
60
70
80
90
1 3 5 7 10 13
Effi
cie
ncy
(E%
)
pH
0.1g/l
0.2g/l
0.3g/l
0.4g/l
0.5g/l
0.6g/l
0.7g/l
International Journal of Basic & Applied Sciences IJBAS-IJENS Vol:13 No:03 44
138903-4747- IJBAS-IJENS @ June 2013 IJENS I J E N S
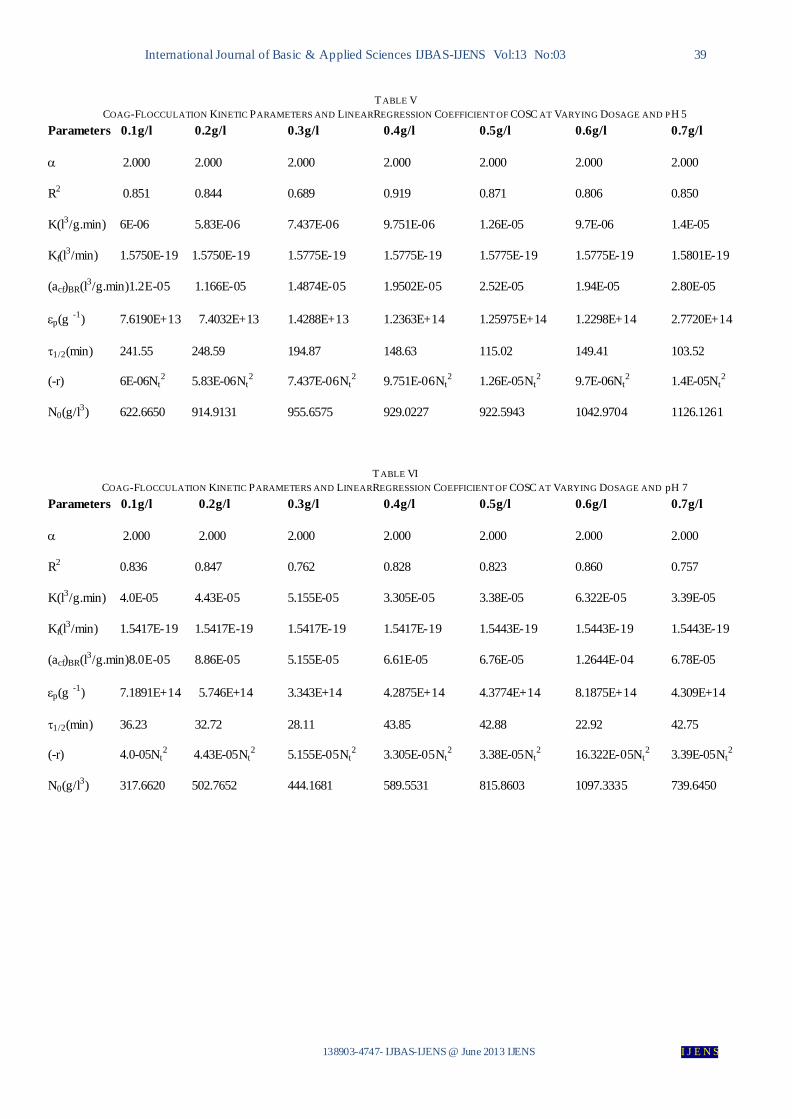
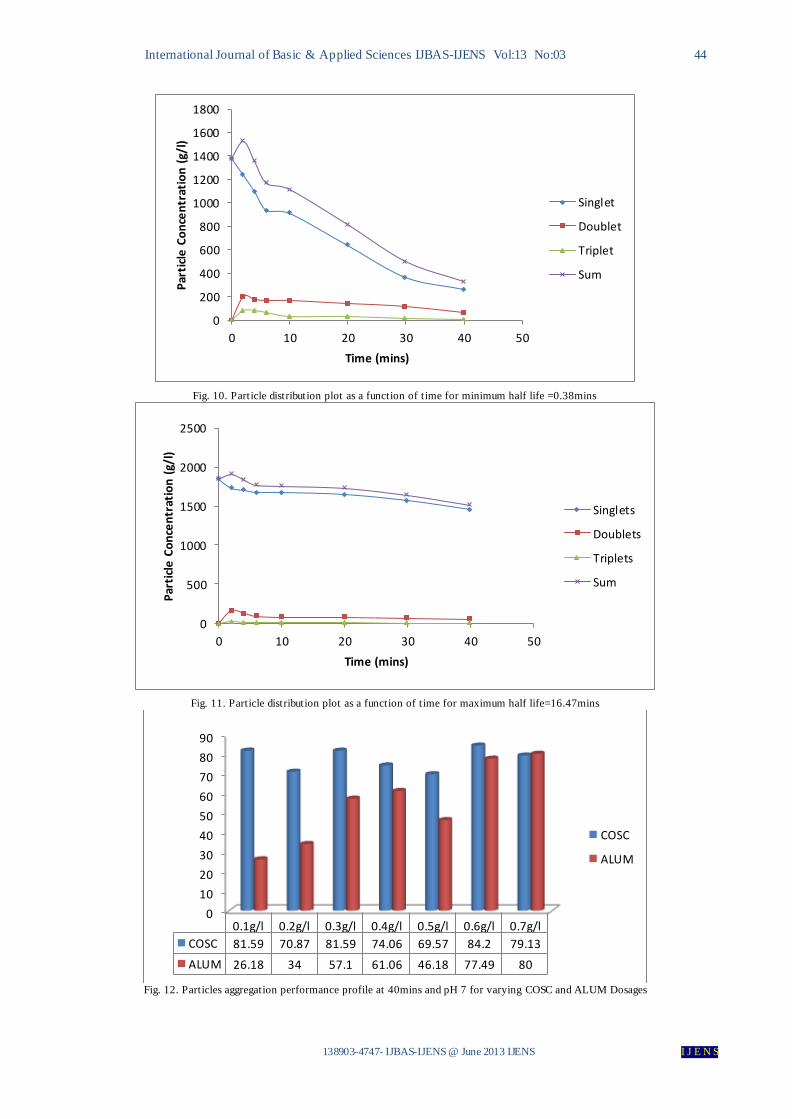
Fig. 10. Particle distribution plot as a function of time for minimum half life =0.38mins
Fig. 11. Particle distribution plot as a function of time for maximum half life=16.47mins
Fig. 12. Particles aggregation performance profile at 40mins and pH 7 for varying COSC and ALUM Dosages
0
200
400
600
800
1000
1200
1400
1600
1800
0 10 20 30 40 50
Par
ticl
e C
on
cen
trat
ion
(g/
l)
Time (mins)
Singlet
Doublet
Triplet
Sum
0
500
1000
1500
2000
2500
0 10 20 30 40 50
Par
ticl
e C
on
cen
trat
ion
(g/
l)
Time (mins)
Singlets
Doublets
Triplets
Sum
0
10
20
30
40
50
60
70
80
90
0.1g/l 0.2g/l 0.3g/l 0.4g/l 0.5g/l 0.6g/l 0.7g/l
COSC 81.59 70.87 81.59 74.06 69.57 84.2 79.13
ALUM 26.18 34 57.1 61.06 46.18 77.49 80
COSC
ALUM

International Journal of Basic & Applied Sciences IJBAS-IJENS Vol:13 No:03 45
138903-4747- IJBAS-IJENS @ June 2013 IJENS I J E N S
4.0 RESULTS AND DISCUSSION
4.1 Characterization Results
These are presented in tables 1 and 2. From the
results in table 1, the pH value (3.87) obtained indicated that
the PIE is acidic which apparently resulted to the acidic odor
. This attributes suggest the presence of high level of
biological organisms (total viable count, total coliform count
etc) . In addition, the relatively high values of turbidity
(1256mg/l), biochemical oxygen demand (50mg/l) total
dissolved solids (225mg/l) total suspended solids
(57.25mg/l), respectively, show that the PIE has high
pollution potentials, providing a condition for this study.
The relatively high electrical conductivity value (490
µs/cm), indicates that the PIE sample contains charged ions,
suggesting that coagulation and flocculation treatment
method can be applied to this end. Also, levels of nutrients
(Ca, mg) and absence of heavy metal, implies that the PIE
can be recycled for agricultural purposes (as a soil
conditioner). In table 2, the presence of crude protein extract
from COSC, a water-soluble cationic peptide with
isoelectric point has been shown to be responsible for the
coagulating property inherent in it and other natural
coagulants of this type [11]. It can also be deduced from the
characterization results after treatment, though not shown,
that the acidic odor of PIE sample drastically reduced after
40mins of treatment. This is indication that COSC, has
antimicrobial effect too, in line with previous works
[4],[24].
4.2 Coag-flocculation functional parameters.
The values of coag-flocculation parameters generated from
the representative rate plot of 1/Nt (1/TDSS) vs time for
varying dosages and 40 mins settling time are presented in
tables 3 – 8. The squared linear regression coefficient R2
generated from figure 1, was employed to determine the
accuracy of fit of experimental results on the generalized
model equation 2.24. the values of R2 presented in tables 3 –
8 show that the experimental results obtained at PH 7 (table
6) were adequately described by the linearised form of
equation 2.22 (with R2 > 75), which was subsequently
expressed as equation 2.24 (putting = 2). Hence pH 7 is
the optimum, at the condition of this experiment . From the
graphical representation of equation 2.24 1/TDSS vs time
(figure 1), k is determined from the slope. However, K can
also be evaluated from the mathematical relation (K = 0.5
(acf)BR) expressed as equation 2.7 and posted in tables 3 – 8.
Also, tables 3 – 8, show that the maximum and minimum K
values are 6.322E-05l/g.min, 1.10 E-06 l/g .min obtained at
pH 7 (0.6g/l dose) and pH 13 (0.7 g/l dose) respectively.
This is in support of the fact that pH 7 is the optimum at the
condition of this experiment. This phenomenon indicates
that at high dosage more adsorption sites were made
available on the COSC interface for TDSS attachments and
subsequently leading to formation of inter particle bridges,
hence increasing the chances of COSC to initiate particle
sweep, though more effective at lower pH.
The value of 1/2 obtained from equation 2.29 and solved for
0.6g/l dosage (1/2 = 0.38 mins), confirms the authenticity of
the optimal value of K recorded at 0.6g/l dosage. The period
of 1/2 = 0.38min can be deduced from tables 3 – 8, as the
lowest, which is an indication of best coag-flocculation
performance at the corresponding dosage and pH .
Particularly, the results posted in table 6, show that high K
corresponds to the, least 1/2 obtained in this experiment, a
phenomenon that amplified a strong relationship among, K,
1/2 and rate of aggregation, which is in line with previous
work[19]. The optimal 1/2 (0.38mins) is relatively
satisfactory, though milliseconds had been reported.
Invariably, the optimum k value obtained at 0.6g/l dosage
from figure 1, is in agreement with the results presented in
table 6. The K, value is a very big determinant on the
efficacy of applying coag-flocculation process in water and
wastewater purifications.
Observation from equation 2.29, show that 1/2 is a function
of initial TDSS and K. The implication is that the higher the
No and K, the lesser the period. This explains the high
purification rate obtained in water and wastewater with high
initial TDSS load and high coagulation rate constant.(acf)BR
and Kf were obtained from equations 2.5 and 2.14
respectively. Kf is obtained on substitution of equations
2.11, 2.13 into 2.8.
Moreover, Kf = fn (T, ), and in this experiment there is
negligible change in the values of temperature and viscosity
of the effluent medium, consequently resulted to minimal
variations of Kf values as presented in tables 3 – 8. In the
vicinity near constant value of Kf, (acf)BR relates to k
proportionally, i.e 2K = (acf)BR expressed as equation 2.15).
Apparently, high (acf)BR result in high kinetic energy to
overcome the electrostatic barrier translating to fast
coagulation, generally, obtainable in practical terms in coag-
flocculation processes. From theoretical considerations, the
following parameters, (acf)BR, 1/2, and kf are understood to
be the prerequisite factors for coagulation efficiency prior to
flocculation.
Furthermore, the No determined from the model equation
expressed as equation 2.24 as the exponential value of the
intercept obtained from figure 1, though it did not follow
any observable trend. Finally, the mass transfer rate of
TDSS (dNt/dt or(-r) is evaluated from equation 2.22. This
accounts for the mass transfer of TDSS on the bio-coagulant
interface in PIE at varying dosages and pH. It is
understandable that more TDSS will be removed at the
maximum K value and lowest 1/2. Hence, high TDSS
depletion rate is a necessary condition for high K value and
low 1/2. In generally, the discrepancies observed in the
results of the kinetic parameters as presented in tables 3 – 8
may be attributed to the following:-
i. Unattainable assumptions; that there is perfect
homogeneity of PIE particles and COSC throughout
dispersion before particle aggregation [19],[26].
ii.The interplay between vander wall’s and hydrodynamic
instabilities which is capable of altering theoretical predicted
values.
iii.Coagulant dosage, low or high could have effect on the
results, because high coagulant dosage may results to
particle redispersion, leading to generation of outrageous
International Journal of Basic & Applied Sciences IJBAS-IJENS Vol:13 No:03 46
138903-4747- IJBAS-IJENS @ June 2013 IJENS I J E N S
value. On the hand low dosage may result in the provision
of insufficient adsorption sites for TDSS attachments.
4.3 Effect of TDSS removal efficiency with settling
time.
This is a time dependent removal efficiency profile for
evaluating the effectiveness of given dosage of COSC at a
particular pH and settling time in removing TDSS from PIE.
The data obtained from efficiency relation expressed as
equation 2.37 are demonstrated in figures 2 – 9 (for 0.1 – 0.7
g/l doses, pH 1, 3, 5, 7, 10, 13 and settling time
2,4,6,10,20,30 and 40). The best performance is achieved at
0.1g/l, at the optimal pH 7 with initial TDSS of 1380 mg/l
reduced by 74.20% and 84.20% at the end of 2 and 40mins
settling time respectively. The least recorded E% > 69% for
all the dosage considered at pH 7, at the end of coag-
flocculation period of 40mins. This phenomenon indicate
the effectiveness of COSC to remove TDSS (in form of
turbidity) from the PIE neutral effluent condition after
maximum treatment period. It is also worthy to mention that
TDSS removal efficiency results shown in figures 6 and 7
are satisfactory for 0.1g/l COSC dose, pH 10 and 13
respectively at the end of 2 and 40mins coag-flocculation.
This establishes the fact that at the condition of the
experiment, COSC has also high potency in removing
turbidity from alkaline rich PIE medium.
4.4 Effect of TDSS removal efficiency with dosage.
This is presented in figure 8. It actually displayed how
dosage affected the TDSS removal efficiency from PIE
varying pH medium. Thus confirming the observations
made from figures 2 – 9. The significant feature of figure 8
show that increase in COSC dosage (0.1 – 0.7 g/l) has
negligible effect on the TDSS removal efficiency after
40mins for all the pH studied at the condition of the
experiment. The optimum performance is recorded at pH 7
for all dosages after maximum coag-flocculation interval.
Also, the level of performance achieved at pH of 10 and 13
are demonstrated. The results obtained indicate that the
turbidity removal efficiency values recorded after 40mins,
for all the dosages considered are impressive. The best
performance recorded at the optimal pH 7, suggest that the
effect of pH on TDSS removal efficiency is related to the
solubility of COSC in PIE sample, which apparently has
high degree of solubility (a measure of high degree of
protonation at the neutral region). Also, the satisfactory
performance recorded in the alkaline region might be
adduced to the greater affinity of cationic ions from the
COSC chain to react with hydroxyl ion from sodium
hydroxide to form stable hydroxide flocs which can also
serve as sorption site for TDSS in PIE. This can
subsequently be removed from the system via gravitational
principles. However, the performance exhibited by COSC at
0.1g/l can be adopted for effective treatment especially
when complete charge destabilization is not
required[5],[17].
4.5 Effect of TDSS removal Efficiency with PH.
This is presented in figure 9. It shows the performance of
various doses of COSC at varying effluent pH. Observation
from figure 9, indicate that maximum TDSS are recorded at
the optimal pH 7 for all doses, followed by pH of 10 and 13.
In general terms, it can be deduced that high doses of COSC
has insignificant affect on TDSS removal efficiency at the
condition of the experiment.
4.6 Time evolution of the cluster size distribution
On the substitution of K, values obtained from equation 2.24
into 2.30, the time evolution of particle aggregates (singlets,
doublets, triplets for m = 1,2,3, respectively) is predicted.
The graphical representation of the results obtained from
equation 2.30 in response to period of 1/2 = 0.38mins and
1/2 = 16.47 mins are shown in figures 10 and 11. In figure
10, the sum of particles (singlet, doublets, triplets) reached
the peak at 2 mins. The implication is that at 2 mins of coag
– flocculation process, there is maximum aggregation of
TDSS (made up of various class of particles). This
phenomenon could be attributed to the absence of zeta
potential between the particles, prevailing in a system where
attractive force dominates. However, at 2mins, the primary
particles (singlets) and sum of particles are seen to decrees
linearly downwards with respect to time. With the absence
of zeta potential among the particles (sum of particles and
singlets) at 2 mins, the COSC instantly sweeps away the
TDSS from the system[18],[21].Though there is little space
in between them indicating existence of minimal shear
force. On the other hand, the pair of doublets and triplets is
seen to aggregate at zero particle concentration at t = 0 (i.e
prior to coag-flocculation). However, at 30mins, the triplets
tends to infinity at zero particle concentration. This is an
evidence of high rate of coag-flocculation demonstrated at
low 1/2 of 0.38mins.
Figure 11, depicts a case where the values of the sum of
particles and singlets are close such that their variation with
time is near same. Also, a similar trend is exhibited by the
pair of doublets and triplets. The curves in figure 11,
indicate existence of wide space between the pairs of
particles, attributable to the wide margin difference in
concentration of particles between the pairs of (singlets and
sum) and (doublets and triplets). This phenomenon could be
linked to the existence of high shear force causing high
resistance to particle collision. It is worthy to mention that
this phenomenon applies to pair of the curves in figure 10
but not as pronounced as we have in figure 11.
4.7 Comparative TDSS Removal Efficiency (E%) of
COSC and Alum.
The coag-flocculation activities of COSC and alum
was compared at the same experimental conditions as
presented in figure 12, at the optimal pH of 7 and varying
doses 0.1 – 0.7 g/l. The results indicate that COSC
performed better than alum at the prevailing pH and all
dosages considered except dosage of 0.7g/l were alum
recorded a slightly higher performance value than COSC,
though comparable. It could be argued that the operating pH
is outside the optimal region of alum since alum is known to
perform best at alkaline range [6]. In addition, even at the
optimal pH domain of alum, though not shown, COSC
performed better than alum at all dosages except (0.1, 02
and 0.3) g/l. however, in the general analysis, it can be
deduced that the performance of COSC at pH 7 is better for
International Journal of Basic & Applied Sciences IJBAS-IJENS Vol:13 No:03 47
138903-4747- IJBAS-IJENS @ June 2013 IJENS I J E N S
all doses, but comparable to that of alum for 0.6 – 0.7g/l
doses.
The major advantages of COSC over alum are the
production of low volume biodegradable sludge,
environmentally friendly, capable of achieving efficient
operation over a wide range of dosages, relatively cheap,
with simple preparation procedure.
5. CONCLUSION
Within the ambits of this experiment, the
generalized model equation 2.24 developed, significantly
predicts the coag-flocculation behavior of COSC at the
optimal pH. From the results, maximum settling time, high
dosage and pH(neutral region) had the most significant
effects on the process operation at the conditions of the
experiment. The computed experimental results agrees with
previous similar works [7],[14],[15][16],[28].
NOMENCLATURE
K: th order coag-flocculation constant
(acf)BR: Collision factor for Brownian Transport
εp: Collision Efficiency
1/2: Coagulation period/half life
Eij: Coag-flocculation Efficiency for i and j particles.
R2: Coefficient of Determination
: Coag-flocculation reaction order
-r: Coag-flocculation mass transfer rate
Biocoagulant: Corchorus Olitorus seed coagulant (COSC)
TDSS: Total dissolved and suspended solids.
Kf : Rate Constant for rapid Flocculation
REFERENCES [1] AOAC, official methods of Analysis . association of official
analytical chemist (14th
ed.) USA 1993. [2] AWWA. American water works association, standard methods
for the examination of water and waste water effluent, New
York, U.S.A., 2005. [3] Barton, K.D. and Subramanian, R.S. J Colloid interface sci
1989, 133:214, [4] Broin, M., Santaella, C. Cuine, S., Kokou, K., Pelterier, G, Joet,
T . Flocculant activity of a recombinant protein from moringa Oliefera, seeds. Appl. Micrbiol. Biotechnol, 2002, 60, 114 – 119.
[5] Chatterjee, T., Chatterjee, S., Woo, S,.H. Enhanced coagulation of bentonite particles in water by modified chitosan biopolymer. Chemical Engineering journal, 2008, 148, 414 – 419.
[6] Clesceri, L.S., Greenberg, A.E., Eaton, A.O. Standard methods
for the examination of water and waste water. 20th
edition. APHA. USA, 1999.
[7] Danov, K.D, Kralchevsky, P.A. and Ivanov, I.B. Dynamic processes in sufracetant stabilized Emulsions. Published as
chapter 26 in Encyclopedic Hand book of Emulsion Technology (J. Sjoblom, Ed.), Marcel Dckker, New York, 2001, 621 – 659.
[8] Diterlizzi, S.D. Introduction to coagulation and flocculation of waste water, environmental system project, 1994, USA.
[9] Edzwald, J.K .Coagulation – sedimentation filtration process for removing organic substances in drinking and waste water. Noyes data corporation, park Bridge, New Jersey, 1987.
[10] Feuillebois, F. J. Colloid inferface sci, 1989, 131:267 [11] Gassenschmidt, U., Jany, K.K., Tauscher, B., Niebergall, H.
Isolation and characterization of a flocculating protein from moringa oleifera lam. BBA Bio-chemica et Biophysica Acta.
1995, 1243, 477 – 481
[12] Ghebremichael, A.K. Moringa seeds and pumice as alternative natural materials for drinking water treatment TRITA LWR
PHD 1013 KTH land and water Resources Engineering, 2004. [13] Gunaratna, K.R, Garcia, B., Anderson, S. Dalhammar, G.
Screening and evaluation of natural coagulants for wat er treatment. Water science and Technology – water supply, 2007,
7 (5/6), 19. [14] Holthof, H., Egelhaff, S.U, Schurtenberger, P., Sticher, H.,
Borkovec, M. Coagulation Rate measurement of colloidal particles by simultaneous static and Dynamic light scattering.
Langmuir, American Chemical society, 1996, 12, 5541 – 5549. [15] Ize-Iyamu, O.K, Eguavoen, O., Osuide, M., Egbon, E.E., Ize-
Iyamu O.C, Akpoveta, V.O, Ibizubge, O.O. Characterisation and Treatment of sludge from the brewery using chitosan. The
pacific journal of science and technology, 2011, 12 (1), 542 – 547.
[16] Jin, Y. Use of high resolution photographic technique for
studying coagulation/flocculation in water treatment. M.SC. Thesis. University of Saskatchewan, Saskatoon, Canada, 2005.
[17] Menkiti M.C., Onyechi, C.A. Onukwuli, O.D. Evaluation of perikinetics compliance for the coag-flocculation of brewery
effluent by Brachystegia Enrycoma seed Extract. International Journal of Multi disciplinary Sciences and Engineering, 2011, 2 (6), 73 – 80
[18] Menkiti, M.C. and Onukwuli, O.D. Coag-flocculation studies of
Moringa Oleifera Coagulant (MOC) in brewery effluent: Nephelometric approach. Journal of American Science, 2010, 6 (12), 788 - 806.
[19] Menkiti, M.C. Aneke, M.C., Onukwuli, O.D. Optimization and
kinetics of coag-flocculation of coal effluent by crab extract via response surface methodological analysis. Journal of Nigeria society of chemical Engineers, 2012, 27 (1), 61 – 80
[20] Ugonabo, V.I., Menkiti, M.C., Onukwuli, D.O., Igbokwe, P.K. Kinetics and functional parameters response of Aluminum Sulphate coagulant to variation in coag-flocculation variables in Turbid pharmaceutical industry effluent. International journal of
Engineering and innovative Technology (IJEIT), 2013, 2 (9), 25 – 35.
[21] Menkiti, M.C. and Onukwuli, O.D. single and Multi angle nephelometric approach to the study of coag-flocculation of coal
effluent medium using Brachystegia enrycoma coagulant. World journal of Engineering, 2011b, 8 (1), 66 – 76.
[22] Merrtt , R.M and Subramanian, R.S. J. Colloid Interface Sci., 1989, 131:514
[23] Rao, N. Use of plan material as natural coagulants for treatment of waste water. An article describing the coagulation process, plant material as natural coagulant and its use for water treatment; Environment: Waste managements, 2012.
[24] Suarez, M., Entenza, J.M, Doerries, C., Meyer, E., Bourquina, L., Sutherland, J., Marrison, I., Movellon, P., Mermod, N. Expression of a plant -derived peptide Harbouring water-
cleaning and antimicrobial activities. Biotechnol Bioeng, 2003, 81 (1) 13 – 20
[25] Ugonabo, V.I, Menkiti, M.C , Onukwuli, O.D. Kinetics and coagulation performance of snail shell bioiness in
pharmaceutical effluent. IOSR journal of Engineering (IOSRJEN), 2012, 2(7), 38 – 49.
[26] Ugonabo, V.I, Menkiti, M.C., Atuanya, C.U, Onukwuli, O.D. Comparative studies on coag-flocculation kinetics of
pharmaceutical industry effluent by Achatina Maginata shell biomass and Aluminum sulphate. International journal of Engineering & Technology IJET-IJENS,2013,13(02), 134-147.
[27] Ugonabo, V.I, Menkiti, M.C., Onukwuli, O.D. Coagulation
kinetics and performance evaluation of corchorus olitorus seed in pharmaceutical effluent. International journal of multidisciplinary sciences and Engineering,2012,3(7).
[28] Van Zanten, J.H and Elimelech, M. Determination of Rate constants by multi angle light scattering. Journal of colloid and interface, 1992, 154 (1) 1 – 7.
[29] Von smoluchowski, M. phys. Z 1916, 17:557
[30] Von smoluchowski, M.Z. Phys chem.. 1917, 92:129 [31] Wang, H and Davis, R.H. Journal of colloid interface sci 1993,
159:108. [32] WST About coagulation and flocculation, information bulleting,
USA. [33] Zhang and Davis, R.H. Journal of fluid mech. 1991, 230:479
![IJENS-RPG [IJENS Researchers Promotion Group] ID: IJENS ...](https://static.fdocuments.net/doc/165x107/618a6dc694f3a56f7344ade0/ijens-rpg-ijens-researchers-promotion-group-id-ijens-.jpg)


![CURRICULUM VITAE : Prof. dr.sc. ISAK KARABEGOVIĆ · IJENS-RPG [IJENS Researchers Promotion Group] ID: IJENS-1020-Isak International Journals of Engineering & Sciences IJENS](https://static.fdocuments.net/doc/165x107/5b52a96e7f8b9ac4368ddc3f/curriculum-vitae-prof-drsc-isak-karabegovic-ijens-rpg-ijens-researchers.jpg)


![IJENS-RPG [IJENS Researchers Promotion Group] … · IJENS-RPG [IJENS Researchers Promotion Group] ... [IJENS Researchers Promotion Group] ID: ... 1 Hardeep Singh, Jai](https://static.fdocuments.net/doc/165x107/5b6048217f8b9a07548badcf/ijens-rpg-ijens-researchers-promotion-group-ijens-rpg-ijens-researchers-promotion.jpg)
