Key Findings from the 2016 Association Email Marketing Benchmark Report
35
2016 Informz Benchmark Report June 22, 2016 #AssnBenchmark16
Transcript of Key Findings from the 2016 Association Email Marketing Benchmark Report

2016 Informz Benchmark Report
June 22, 2016
#AssnBenchmark16

Presented by….
Tracy SolarekExecutive Advisor
Vivian SwertinskiSr. Digital Marketing Strategist

Webinar Agenda
2016 Email Marketing Benchmark Report
Industry Marketing Trends
Recommended Next Steps

• 6th consecutive year produced
• Over 1,300 Associations and Nonprofits
• 12 months of data
• Over 1 billion emails
• US, Australia, New Zealand, Canada, UK

How Do You Measure Email Performance?
Source: 2015 Association Technology Study, Lehman Associates, LLC

Open Rates – a deeper dive
• HTML email with images enabled
• Text or HTML email with click activity
• Unique Open by Subscriber
Click Through Rates
Openers that clicked on a tracked link
Better yet…Insights about your users behaviors and interests.
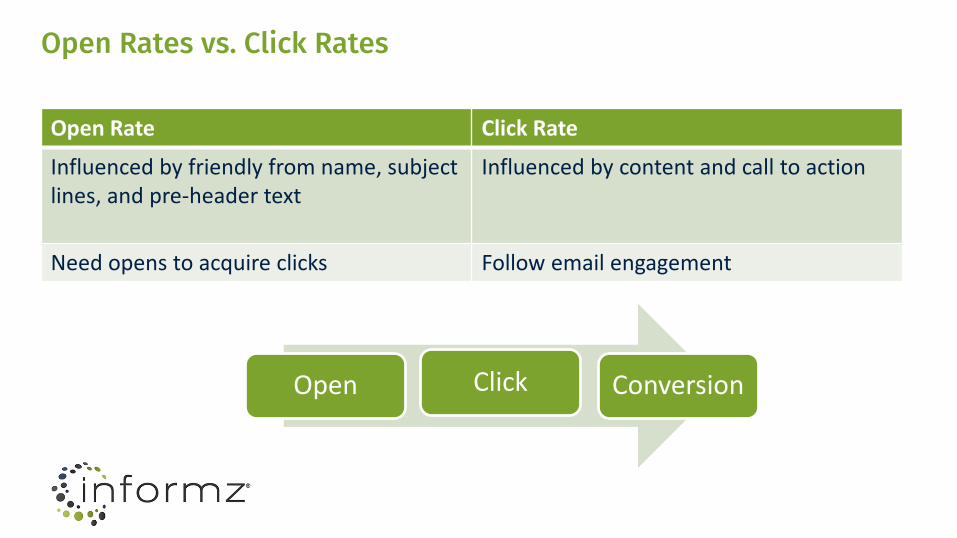
Open Rates vs. Click Rates
Open Rate Click Rate
Influenced by friendly from name, subject lines, and pre-header text
Influenced by content and call to action
Need opens to acquire clicks Follow email engagement
Open Click Conversion

Overall Benchmark Email Metrics

Open Rate by Subscription Size

Engagement by Subject Line Length

Short and Sweet Subject Lines
Are you in?OMG, HMF!!
Thank you
APA News

Results by Frequency

Engagement by Number of Links

Profile by target audience

Results by Target Audience

Duration of time spent “reading” the email

Day of Week

Time of Day

Email Client Type
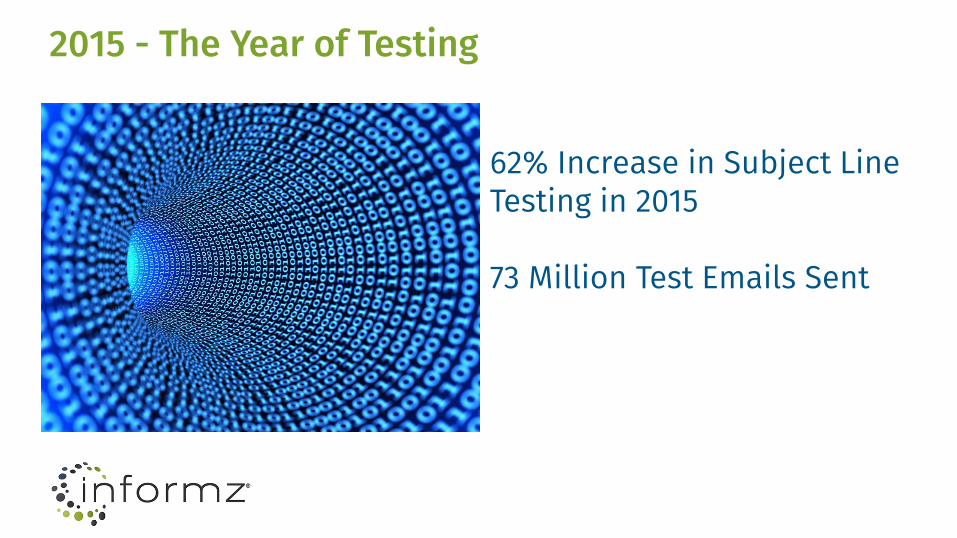
2015 - The Year of Testing
62% Increase in Subject Line Testing in 2015
73 Million Test Emails Sent

What to Test?
• Friendly From
• Subject Line
• Pre-header Text
• Banner Image
• Message
• Call to Action

Effective Tests Options
Traditional Split (50 -50) or A/B Send to Winner

Industry Trends

Trend – Measure ROI after the Click
Source: 2015 Association Technology Study, Lehman Associates, LLC
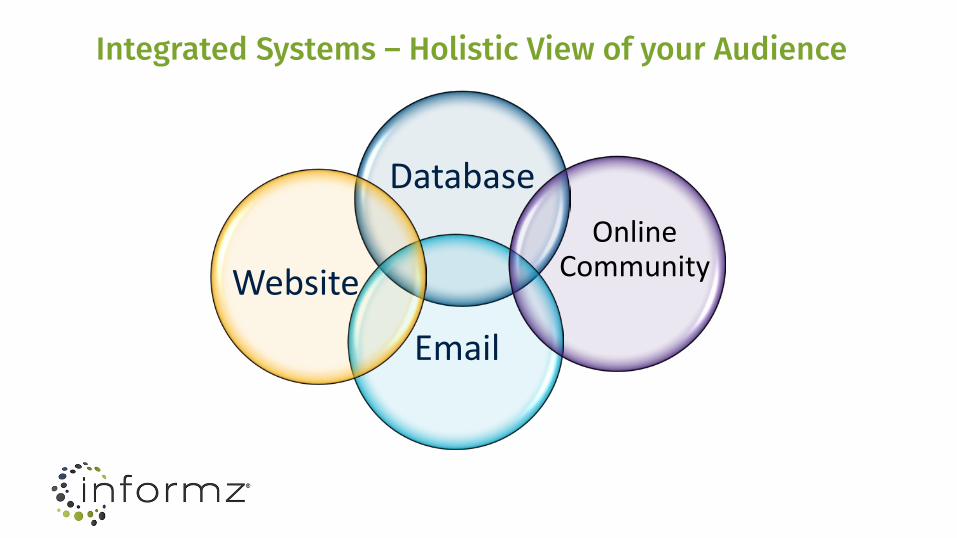
Integrated Systems – Holistic View of your Audience
Database
WebsiteOnline
Community
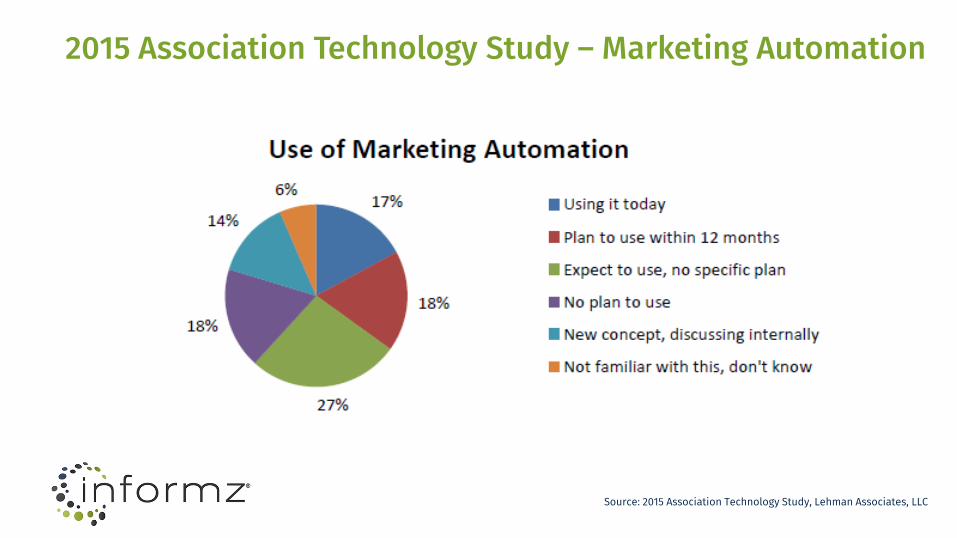
2015 Association Technology Study – Marketing Automation
Source: 2015 Association Technology Study, Lehman Associates, LLC

What is your experience with Marketing Automation?
Using it Today
Considering within 6-12 months
Have awareness, no specific plans
New Concept

Why Automate?
• Efficiency
• Effectiveness
• Relevancy
• Customized Experience

Customize the experience

Web tracking – Insight and “ACTION” tool

Target “known” audiences
Create action based target groups
Session Trends for Known and Anonymous Users

Automated Campaigns

Next Steps
• Take time to create and send targeted mailings• Know your mobile audience - Enhance the user experience • Measure performance after each individual mailing• Monitor/benchmark reports by category• Create a test plan• Provide ample, prominent calls to action• Create a follow up plan to decreased missed opportunities • Higher Education Administrators, check out your specific Higher
Education benchmark report