Kerala State Strategic Statistical...
191
Government of Kerala Kerala State Strategic Statistical Plan Department of Economics and Statistics Thiruvananthapuram Final Report March 31, 2011
Transcript of Kerala State Strategic Statistical...

Government of Kerala
Kerala State Strategic Statistical Plan
Department of Economics and Statistics Thiruvananthapuram
Final Report March 31, 2011

Preface The India Statistical Strengthening Project (ISSP) launched by the Govt. of India as a follow up measure of the National Statistical Commission (NSC) chaired by Dr. C.Rangarajan is a very important project as far as the State Statistical System (SSS) is concerned. The objective of the project is to strengthen the SSS on the lines of National Strategic Statistical Plan(NSSP). The State Strategic Statistical Plan (SSSP) is expected to provide a strategy for strengthening the statistical capacity across the entire SSS. As per the guidelines for the preparation of SSSP and implementation of the plan, the State Govt. have constituted a High Level Steering Committee (HLSC) under my chairmanship. Necessary steps have been taken to prepare the SSSP after the first HLSC meeting held on 16/07/2010. The Project Management Team (PMT) have been reconstituted and formed Core Team and Specialized Teams for the successful preparation of the SSSP. The draft SSSP prepared by the Department of Economics & Statistics with assistance of the two Consultants appointed by the Govt., under the guidance of the PMT, was approved by the HLSC on 31.03.2011. For the preparation of the SSSP, consultative workshops, meetings, interactions with all the stakeholders including service organisations have been carried out. During the course of preparation of the SSSP, the officials of the Ministry of Statistics and Programme Implementation (MoSPI), Government of India have extended all support and co-operation. Each member of the HLSC has contributed valuable suggestions for the preparation of the report. The PMT under the chairmanship of the Secretary, Planning and Economic Affairs Dept. has rendered necessary guidance to the Dept. of Economics and Statistics for preparing such a good report. I would like to place on record the valuable services and co-operation rendered by the members of the HLSC and the PMT. I would also appreciate the efforts put in by the officials of the Department of Economics & Statistics especially the core team and the two Consultants for preparing such a good report. The support and cooperation extended by the officials of the MoSPI, Government of India need special mention. Above all, the whole hearted cooperation from the staff of the Dept. of Economics and Statistics, experts in the field, need to be appreciated without which this report could not have been prepared within a reasonable period. Sd/-
(Dr.P. Prabhakaran) Chief Secretary to Government of Kerala

Contents Abbreviations i-iv
Glossary v-xii
Executive Summary xiii-xiv
Summary of Findings and Recommendations xv-xxv
Chapter 1 - Introduction 1 - 8
1.1 The Rationale 1
1.2 Formation of Department of Economics & Statistics 2
1.3 Functions of Department of Economics & Statistics 2
1.4 India Statistical Strengthening Project (ISSP) 4
1.5 State Strategic Statistical Plan (SSSP) 6
Chapter 2 - Statistical System of Kerala 9 - 32
2.1 The System 9
2.2 The Structure and Functions of DES 9
2.2.1 Department of Agriculture 11
2.2.2 Animal Husbandry 12
2.2.3 Department of Fisheries 13
2.2.4 Department of Dairy Development 13
2.2.5 Department of Irrigation 14
2.2.6 Department of Forest 14
2.2.7 Department of Industries 15
2.2.8 Department of Handloom and Textiles 16
2.2.9 Department of Motor Vehicles 16
2.2.10 Department of Tourism 17
2.2.11 Department of Rural Development 17
2.2.12 Panchayat Directorate 18
2.2.13 Corporations and Municipalities 18
2.2.14 Public Works Department 19
2.2.15 Department of Urban Affairs 19
2.2.16 Department of Town Planning 19
2.2.17 Department of Health and Family Welfare 20
2.2.18 Directorate of Public Instruction 21

2.2.19 Department of Collegiate Education 22
2.2.20 Department of Technical Education 23
2.2.21 Colleges of Engineering 23
2.2.22 Office of Labour Commissioner 23
2.2.23 Department of Social Welfare 24
2.2.24 Department of Scheduled Caste Development 25
2.2.25 Department of Scheduled Tribe Development 25
2.2.26 Crimes Records Bureau 26
2.2.27 Department of Civil Supplies 26
2.2.28 Registrar of Cooperative Societies 26
2.2.29 Department of Commercial Taxes 27
2.2.30 Western Ghats Cell of the Planning & Economic Affairs Department 27
2.2.31 Central Plan Monitoring Unit (CPMU) in the Department of Planning and Economic Affairs 27
2.2.32 Kerala Land Use Board 28
2.3 Current Status of the Statistical System 28
2.3.1 The Environment for Statistics in the State 28
2.3.2 Adequacy of Legislation 29
2.3.3 Coordination Mechanisms among Producers of Statistics 29
2.3.4 Mechanism of Consultation between Producers and Users 29
2.3.5 Institutional Integrity, Professional Ethics and Transparency 29
2.3.6 Statistical Cadre 30
2.3.7 Application of Information and Communication Technology 30
2.3.8 Physical Infrastructure 30
2.3.9 Statistical Infrastructure 31
2.4 SWOT Analysis 31
2.4.1 Strengths 31
2.4.2 Weaknesses 31
2.4.3 Opportunities 32
2.4.4 Threats 32
Chapter 3 - Statistical Activities in Identified Subject Areas 33 - 75

3.1 State Domestic Product (SDP) Estimates 33
3.2 Capital Formation and Savings 34
3.3 District Domestic Products (DDP) 35
3.4 Estimates of the Contribution of Local Bodies 35
3.5 Data on Major Fiscal Variables 35
3.6 Annual Survey of Industries (ASI) 35
3.7 Index of Industrial Production 36
3.8 Crop Area and Production Statistics 37
3.9 Wholesale Price Index Numbers 40
3.10 Consumer Price Index Numbers 42
3.11 Health, Morbidity, Mortality and Family Welfare Statistics 45
3.12 Education and Literacy Statistics 47
3.13 Labour and Employment Statistics 48
3.14 Housing Statistics 50
3.15 Statistics of Birth and Death and Population 53
3.16 Electricity Production and Distribution Statistics 55
3.17 Environment and Forest Statistics 56
3.17.1 Water Supply and Sanitation Statistics 60
3.18 Participation in National Sample Surveys 63
3.19 Transport Statistics 64
3.20 Statistics for Local Level Planning 65
3.21 Gender Statistics 67
3.22 Unorganized Sector Statistics 68
3.23 Poverty Statistics 69
3.24 Services Sector Statistics 70
3.25 Banking Statistics 71
3.26 Human Development Statistics 71
3.27 Statistics of Non-Resident Keralites (NRKs) 72
3.27.1 Definitional Issues 74
3.27.2 Issues of Units of Survey 75
Chapter 4 - The Vision, Strategic Goals and Strategies 76 – 90
4.1 The Vision 76

4.2 Strategic Goals 76
4.3 General Strategies and Action Plans 76
4.3.1 Sustained Improvement of Official Statistics 76
4.3.2 Up-Scaling Data Dissemination System 77
4.3.3 Computer and Communication Technology Integration 77
4.3.4 Creating Positive Public Image of Official Statistics 78
4.3.5 Engendering Official Statistics 79
4.3.6 Statistical Capacity Building 79
4.3.7 Statistical Product Enhancement 80
4.4 Strategies and Action Plans with respect to Identified Key Areas 80
4.4.1 State Domestic Product Estimates 81
4.4.2 Capital Formation and Savings 81
4.4.3 District Domestic Product 82
4.4.4 Estimates of the Contribution of Local Bodies 82
4.4.5 Data on Major Fiscal Variable 82
4.4.6 Annual Survey of Industries 82
4.4.7 Index of Industrial Production 82
4.4.8 Crop Area and Production Estimates 82
4.4.9 Wholesale Price Index Numbers 83
4.4.10 Retail Price and Consumer Price Index Numbers 84
4.4.11 Health, Morbidity, Mortality and family Welfare Statistics
84
4.4.12 Education and Literacy Statistics 85
4.4.13 Labour and Employment Statistics 85
4.4.14 Housing Statistics 86
4.4.15 Statistics of Birth and Death and Population 86
4.4.16 Electricity Production and Distribution Statistics 86
4.4.17 Environment and Forest Statistics 87
4.4.18 Participation in the National Sample Surveys 87
4.4.19 Transport Statistics 87
4.4.20 Statistics of Local Level Planning 88
4.4.21 Gender Statistics 89
4.4.22 Unorganised Sector Statistics 89
4.4.23 Poverty Statistics 89
4.4.24 Services Sector Surveys 89
4.4.25 Banking Statistics 89
4.4.26 Human Development Statistics 90
4.4.27 Statistics of Non-Resident Keralites 90
Chapter 5 - The Implementation Plan 91 – 119
5.1 State Statistical Commission 91
5.2 Technical Advisory Committee and Expert Committees 93
5.2.1 Agricultural Statistics 93
5.2.2 Prices and Prices indices 94
5.2.3 Compilation of State Accounts 94
5.3 User Consultations 95
5.4 Strengthening of Statistical Co-ordination 95
5.5 Integration of Man Power Planning with Designing and Planning of Surveys
96
5.6 Creating Physical Infrastructure 96
5.7 Data Dissemination Policy 96
5.8 Setting up of Data Warehouse 97
5.9 Computer and Communication Technology Integration 97
5.10 Creating Positive Public Image in Official Statistics 99
5.11 Engendering Official Statistics 99
5.12 Cadre Structure and Personnel Management 100
5.13 Intensive Training and Training Institute 101
5.14 Restructuring and Empowering of DES 103
5.15 Creation of Statistical Frames 104
5.16 Improving the Estimates of State Domestic Product 105
5.17 Estimation of Capital Formation and Savings 106
5.18 Estimation of District Domestic Product (DDP) 106
5.19 Estimation of Contribution of Local Bodies 107
5.20 Annual Survey of Industries 107
5.21 Index of Industrial Production 107
5.22 Crop Area and Production Estimates 107
5.23 Compilation of Wholesale Price Index Numbers 107
5.24 Retail Price and Consumer Price Index Numbers 108
5.25 Health, Morbidity, Mortality and Family Welfare Statistics 108
5.26 Education and Literacy Statistics 109
5.27 Labour and Employment Statistics 109
5.28 Housing Statistics 109
5.29 Statistics of Birth and Death and Population 110
5.30 Electricity Production and Distribution Statistics 110
5.31 Improvement of Forest Statistics 110
5.32 Participation in the National Sample Surveys 113
5.33 Transport Statistics 113
5.34 Statistics of Local Level Planning 114
5.35 Gender Statistics 115
5.36 Unorganised Sector Statistics 116
5.37 Poverty Statistics 116
5.38 Services Sector Surveys 116
5.39 Human Development Statistics 116
5.40 Statistics of Non-Resident Keralites 116
5.41 Summary of Funds Requirements 116
Chapter 6 - Monitoring, Reporting and Evaluation 120-122
6.1 Introduction 120
6.2 Outputs and Outcomes: 120
6.2.1 Outputs 120
6.2.2 Outcomes 121
6.3 Reporting 121
6.4 Evaluation 122
6.5 Field Verification 122
Annex-I - Area and Cost of Construction of Different Offices 123
Annex-II - ICT Infrastructure Requirements 124-149
Appendix – I 150-151
Appendix – II 152-154
Appendix – III 155-158
i
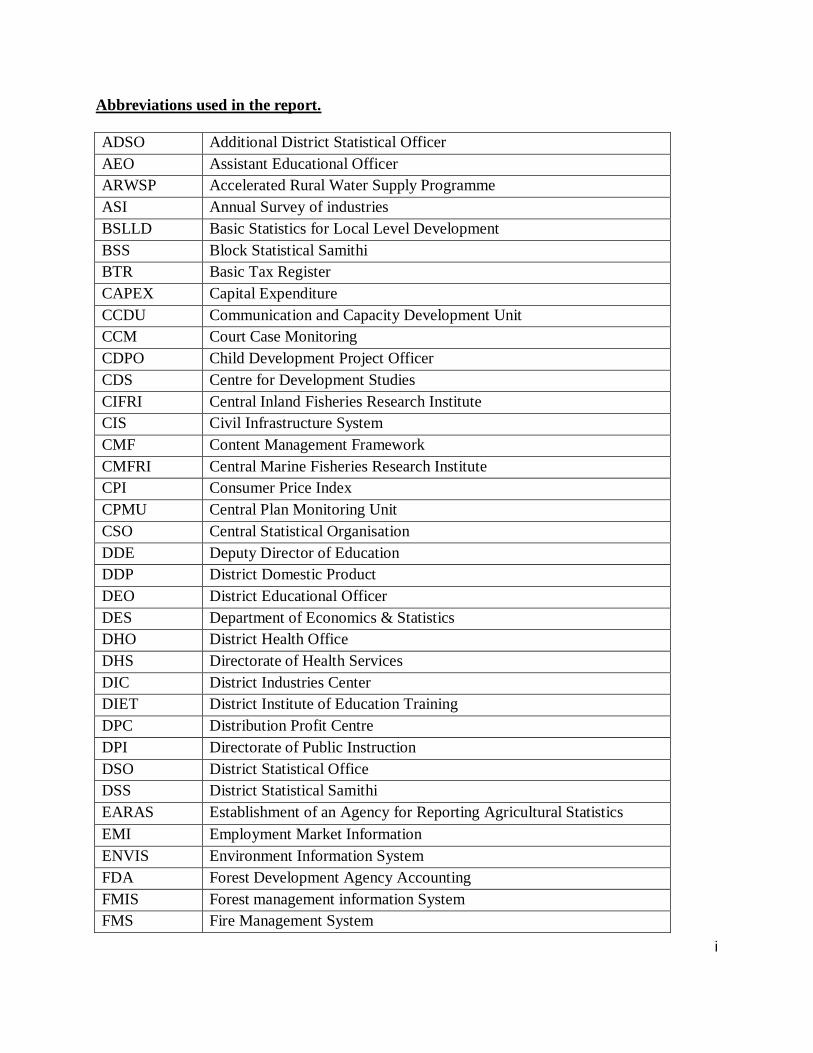
Abbreviations used in the report. ADSO Additional District Statistical Officer AEO Assistant Educational Officer ARWSP Accelerated Rural Water Supply Programme ASI Annual Survey of industries BSLLD Basic Statistics for Local Level Development BSS Block Statistical Samithi BTR Basic Tax Register CAPEX Capital Expenditure CCDU Communication and Capacity Development Unit CCM Court Case Monitoring CDPO Child Development Project Officer CDS Centre for Development Studies CIFRI Central Inland Fisheries Research Institute CIS Civil Infrastructure System CMF Content Management Framework CMFRI Central Marine Fisheries Research Institute CPI Consumer Price Index CPMU Central Plan Monitoring Unit CSO Central Statistical Organisation DDE Deputy Director of Education DDP District Domestic Product DEO District Educational Officer DES Department of Economics & Statistics DHO District Health Office DHS Directorate of Health Services DIC District Industries Center DIET District Institute of Education Training DPC Distribution Profit Centre DPI Directorate of Public Instruction DSO District Statistical Office DSS District Statistical Samithi EARAS Establishment of an Agency for Reporting Agricultural Statistics EMI Employment Market Information ENVIS Environment Information System FDA Forest Development Agency Accounting FMIS Forest management information System FMS Fire Management System

ii
FOSS Free and open source software GDDP Gross District Domestic Product GEI Gender Equality Index GFCF Gross Fixed Capital Formation GIFT Gulati Institute of Finance and Taxation GPC Generation Profit Centre GPS Global Positioning System GSDP Gross State Domestic Product HDI Human Development Index HMIS Health Management Information System HPI Human Poverty Index ICDS Integrated Child Development Scheme ICT Information, Communication Technology IDRB Irrigation Design and Research Board IDSP Integrated Disease Surveillance Programme IIP Index of Industrial Production IKM Information Kerala Mission IMG Institute of Management in Government IRM Industrial Raw Material ISS Integrated Sample Surveys ISSP India Statistical Strengthening Project IWMP Integrated Watershed Management Programme KER Kerala Education Rules KESSS Kerala Economics and Statistics Subordinate/State Service KSCSTE Kerala State Council for Science, Technology and Environment KSEB Kerala State Electricity Board KSIDC Kerala State Industrial Development Corporation KSSC Kerala State Statistical Commission KSSS Kerala Subordinate/State Statistical Service KLSSSP Kerala State Strategic Statistical Plan KSWAN Kerala State Wide Area Network LoP Letter of Participation LSGD Local Self Government Department MAS Monthly Accounts System MCCD Medical Certification of Cause of Death MCTS Mother and Child Tracking System MGNREGS Mahatma Gandhi National Rural Employment Guarantee Scheme MIS Management Information System

iii
MMS Migration Monitoring Study MPLAD Member of Parliament Local Area Development MPR Monthly Progress Report NABARD National Bank for Agricultural and Rural Development NAIS National Agricultural Insurance Scheme NCERT National Council of Educational Research and Training NCEUS National Commission for Enterprises in the Unorganised Sector NDDP Net District Domestic Product NFS Natural Forest Management System NHDR National Human Development Report NIC National Informatics Centre NLEP National Leprosy Eradication Programme NORKA Non Resident Keralites Affairs NPCB National Programme for Control of Blindness NRHM National Rural Health Mission NSC National Statistical Commission NSDP Net State Domestic Product NSSO National Sample Survey Organisation NSSP National Strategic Statistical Plan NTFP Non-Timber Forest Produces NVBDCP National Vector Born Diseases Control Programme OPEX Operational Expenditure PCCF Principal Chief Conservator of Forest PDA Personal Digital Assistant PFM Participatory Forest Management PHC Primary Health Centre PIC Project Implementation Cell PIO Person of Indian Origin PIS Personnel Information System PMGSY Pradhan Mantri Gram Sadak Yojana PMS Plantation Management System PMT Project Management Team PPC People’s Plan Campaign PRS Progress Report System PSS Panchayat Statistical Samithi PWD Public Works Department RAW Research & Analysis Wing RBI Reserve Bank of India

iv
RCH Reproductive Child health RDD Rural Development Department RFS Rural Frame Survey RIDF Rural Infrastructure Development Fund RIS Road Information System RMIS Rationalisation of Minor Irrigation Schemes RNTCP Revised National TB Control Programme RPM Research Project System SASA State Agricultural Statistics Authority, State Academy on Statistical
Administration (Proposed Training Institute of the department) SDC State Data Centre SDCMC State Disease Control Monitoring Cell SDP State Domestic Product, Statistics for Decentralized Planning SDRT Survey Design, Research and Training SFNM Social Forestry and Nursery Management SGDP State Gross Domestic Product SHLSC State High Level Steering Committee SIEMAT State Institute of Education Management & Training SLBC State Level Bankers` Committee SMS Sales Management System SPARK Salary and Payroll Administrative Repository for Kerala SSPHD strengthening State Plans for Human Development SSS State Statistical System SSSP State Strategic Statistical Plan STP Stores, Tools and Plants TAC Technical Advisory Committee TPC Transmission Profit Centre TSO Taluk Statistical Office UFS Urban Frame Survey UNSNA United Nations System of National Accounts WHO World Health Organization WPI Whole Sale Price Indices

v
Glossary of terms used in the report. BSS Block
Statistical Samithi
A committee proposed at the block level for coordinating the statistical activities and catering to the statistical needs at the block panchayat level. The Chairman of the BSS will be the Block Panchayat president and the convener will be the extension officer P&M. All the standing committee chairmen and the Taluk Statistical Officer of the respective taluk will be the members.
BTR Basic Tax Register
Basic Tax Register (BTR) is used to record the data on land mainly comprise of textural data which is the record of land details kept in the Revenue Department.
CAPEX Capital Expenditure
Money spent to acquire or upgrade physical assets such as buildings and machinery.
CCM Court Case Monitoring
The system collects and monitors all the matters connected with the court cases in the forest department.
CIS Civil Infrastructure System
Civil infrastructure system creates and manage database for Roads, Bridges, Buildings, Water Storage Structures maintained by the Forest Department.
CMF Content Management Framework
A content management framework (CMF) is an application programming interface for creating a customized content management system (CMS).
CPMU Central Plan Monitoring Unit
A Central Statistical Unit at the State Government secretariat for monitoring the progress of centrally sponsored and state sponsored project/schemes implemented through various line departments.
DDP/SDP State/District Domestic Product
DDP/SDP is a measure in monetory terms of the volume of all goods and services produced by an economy of a District/State during a given period of time, accounted without duplication.

vi
DIET District Institute of Education Training
DIETs are a third-district level-tier to the support system with a mission to provide academic and resource support at the grass-roots level for the success of the various strategies and programmes being undertaken in the areas of elementary and adult education, with special reference to Elementary Education, Universalisation of Primary/Elementary Education and Adult Education
DPC Distribution Profit Centre
It is a unit under the KSEB distributing electric supply to various categories of consumers in Kerala. DPCs are mainly engaged in the operation and maintenance of distribution lines effecting new service connections, redressal of various complaints of the consumers, collection of energy charges from the consumers etc.
DSS District Statistical Samithi
A committee proposed at the district level for coordinating the statistical activities and catering to the statistical needs at the district level. The Chairman of the DSS will be the District Panchayat president and the vice chairman is the District Collector. Joint Director of Statistics (Proposed at the district level) will be the convener. The Chairmen of the standing committees will be the members and the District heads of the line departments will be the ex-officio members.
EMI Employment Market Information
EMI is used to generate awareness and appreciation of the realities of employment market
ENVIS Environment Information System
It is a Plan Scheme for environmental information collection, collation, storage, retrieval and dissemination to policy planners, decision makers, scientists and environmentalists, researchers, academicians and other stakeholders.
FDA Forest Development Agency Accounting
All details regarding accounts of Forest Development Agency like Estimate details, Receipt Voucher, Adjustment Voucher, Journal Voucher, etc., are being managed.
vii
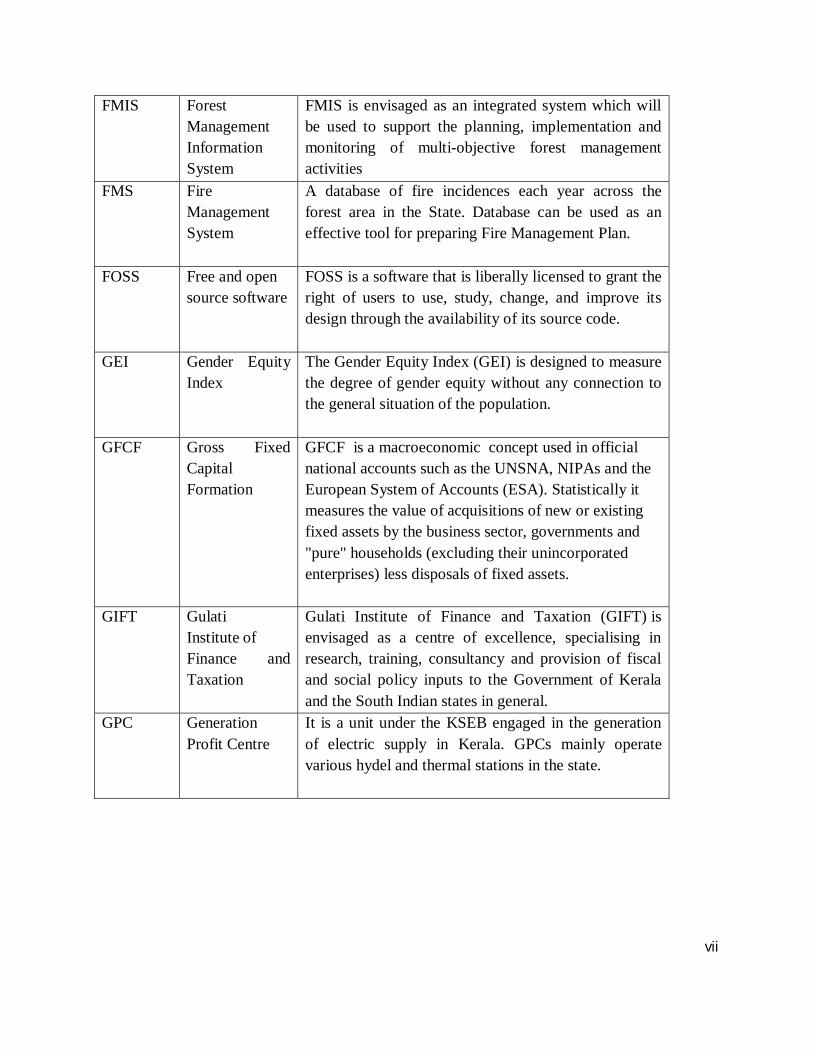
FMIS Forest Management Information System
FMIS is envisaged as an integrated system which will be used to support the planning, implementation and monitoring of multi-objective forest management activities
FMS Fire Management System
A database of fire incidences each year across the forest area in the State. Database can be used as an effective tool for preparing Fire Management Plan.
FOSS Free and open source software
FOSS is a software that is liberally licensed to grant the right of users to use, study, change, and improve its design through the availability of its source code.
GEI Gender Equity Index
The Gender Equity Index (GEI) is designed to measure the degree of gender equity without any connection to the general situation of the population.
GFCF Gross Fixed Capital Formation
GFCF is a macroeconomic concept used in official national accounts such as the UNSNA, NIPAs and the European System of Accounts (ESA). Statistically it measures the value of acquisitions of new or existing fixed assets by the business sector, governments and "pure" households (excluding their unincorporated enterprises) less disposals of fixed assets.
GIFT Gulati Institute of Finance and Taxation
Gulati Institute of Finance and Taxation (GIFT) is envisaged as a centre of excellence, specialising in research, training, consultancy and provision of fiscal and social policy inputs to the Government of Kerala and the South Indian states in general.
GPC Generation Profit Centre
It is a unit under the KSEB engaged in the generation of electric supply in Kerala. GPCs mainly operate various hydel and thermal stations in the state.

viii
GPS Global Positioning System
The Global Positioning System (GPS) is a space-based Global Navigation Satellite System (GNSS) that provides location and time information in all weather and at all times and anywhere on or near the Earth when and where there is an unobstructed line of sight to four or more GPS satellites.
GSDP / GDDP
Gross State / District Domestic Product
GSDP / GDDP is measure in monetory terms of the volume of all goods and services produced by the economy of a State / District during a given period of time, accounted without duplication.
HDI Human Development Index
The Human Development Index (HDI) is a composite statistic used to rank countries by level of "human development" and separate "very high human development", "high human development", "medium human development", and "low human development" countries
HLSC Highlevel Steering Committee
An apex committee at the State level under the Chairmanship odf the Chief Secretary with the senior officials and a representative of MoSPI constituted for the proper implementation of the India Statistical Strengthening Project. It is the State decision making body in respect of the project.
HMIS Health Management Information System
HMIS is web based data capturing system used to generate key indicators for local level use and Integration of health related information across programmes
HPI Human Poverty Index
The Human Poverty Index is an indication of the standard of living in a country, developed by the United Nations (UN)
IKM Information Kerala Mission
Information Kerala Mission (IKM), the flagship e-governance project of the Government of kerala, is an attempt to strengthen local self-governance through ICT (Information Communication Technologies) applications. It envisages computerising and networking the 1215 local self government institutions in Kerala.

ix
IMG Institute of Management in Government
Institute of Management in Government (IMG) is the apex training institute of the Government of Kerala with the objective of developing managerial skills, organisational abilities, leadership qualities and decision making skills among different categories of employees of Government, Private and Public sector.
IRM Industrial Raw Material
All details pertaining to Industrial raw material Supply & Non Wood Forest Produce (NWFP) Collection (item wise) is accounted in this module.
ISS Integrated Sample Surveys
The main objective of the scheme is to estimate the production of milk, egg, wool and meat, State-wise, and cost of production per unit of milk and egg in some selected districts in the States/UTs for evaluation of reasonable remunerative prices to the producers.
MAS Monthly Accounts System
Software that takes care of all the accounts related matters which are being sent to the office of the Accountant General.
MCCD Medical Certification of Cause of Death
Medical Certification of Cause of Death (MCCD) is a scheme introduced by the Office of Registrar General of India to generate a reliable data on cause-specific mortality in the country on a regular basis under Civil Registration System. The distribution of death by different causes and various other characteristics are derived through MCCD.
MCTS Mother and Child Tracking System
Mother and Child Tracking system (MCH) is name based pregnant mother and child tracking system. It is a management tool to reduce MMR/IMR/TFR and track the health service delivery at the individual level.
MIS Management Information System
A management information system (MIS) is a system that provides information needed to manage organizations effectively.
NORKA Non Resident Keralites Affairs
Department of Non-resident Keralites' Affairs (NORKA) to redress the grievances of Non-resident Keralites

x
NSDP / NDDP
Net State / District Domestic Product
NSDP / NDDP is a measure obtained after deducting the consumption of fixed capital from GSDP/GDDP. The CFC measures the replacement value of the part of the capital stock which has been used up in the production progress during the year.
NTFP Non Timber Forest Produces
Non timber forest products (NTFP) are considered as any commodity obtained from the forest that does not necessitate harvesting trees.
OPEX Operational Expenditure
OPEX is an ongoing cost for running a product, business, or system
PDA Personal Digital Assistant
A PDA is a mobile device that functions as a personal information manager.
PFM Participatory Forest Management
All details regarding Vana Samrakshana Samithy (VSS), their Annual Plan of Operation (APO), and their monthly work progress are accounted in this Module.
PHC Primary Health Centre
The PHC is the basic structural and functional unit of the public health services in developing countries.
PIC Project Implementation Cell
A cell (Core Team) constituted at the Directorate of Economics & Statistics to facilitate the Project Management Team and for the successful completion of the project.
PIS Personnel Information System
Organize service particulars of all the employees of the Forest Department digitally so that information is available at fingertips.
PMS Plantation Management System
Create a database of the Plantations with details like area, location, GPS points, planting & maintenance details.
PMT Project Management Team
A committee of experts and senior officials with the secretary, Planning & Economic Affairs Department as Chairman and Director of Economics & Statistics as convener for the successful preparation and effective implementation of the State Strategic Statistical Plan.

xi
PPC People’s Plan Campaign
People's Plan Campaign, held in 1996 in Kerala State, was a remarkable experiment in decentralisation of powers to local governments with focus on local planning. In the beginning of the ninth plan, the Government of Kerala took a bold decision to devolve 35% of the state development budget down from a centralized bureaucracy to local governments where local people could determine and implement their own development priorities under the People’s Plan Campaign
PRS Progress Report System
Create database so as to get a complete picture on the progress of works under each Office.
PSS Panchayat Statistical Samithi
A committee proposed at the grama panchayt level for coordinating the statistical activities and catering to the statistical needs at the grama panchayt level. The Chairman of the PSS will be the Grama Panchayat president. Statistical Investigator (proposed to be created/deployed) will be the convener. The Chairmen of the standing committees will be the members and the PSS.
RAW Research & Analysis Wing
A wing proposed at the Directorate tro conduct various studies and communicate the policy relevance to the policy makers from time to time and bring out a policy brief when the new data is available for effective policy making and interventions.
RCH Reproductive Child Health
The Reproductive and Child Health Programme was launched in October 1997 incorporating new approach to population and development issues, as exposed in the International Conference on Population and Development held at Cairo in 1994. The programme integrated and strengthened the services/interventions under the Child Survival and Safe Motherhood Programme and Family Planning Services and added to the basket of services, new areas on Reproductive Tract/Sexually Transmitted infections (RTI/STI).

xii
RPMS Research Project Management System
Details regarding Research Projects, Seed Collection, Permanent Preservation Plots, etc., are taken care of by this module.
SASA State Agricultural Statistics Authority,
An authority designated for the collection, compilation and dissemination of the agricultural statistics at the State level.
SFNM Social Forestry and Nursery Management
Details regarding Social Forestry Projects, Extension Activities, Raising of Nurseries, Plantation & Treatment areas are taken care of by this module
SIEMAT State Institute of Education Management & Training
SIEMAT is a State level autonomous institution. The prime objective of the institute is to impart training and conduct researches in the areas of educational planning and management. It also aims to establish educational networking with institutes at the national and international level.
SMS Sales Management System
Right from marking and felling of trees to generation of the Sale Bill for the bidder is managed by the Software.
SPARK Salary and Payroll Administrative Repository for Kerala
SPARK is an Integrated Personnel, Payroll and Accounts information system ,which is Web based application implemented for all the employees in the State of Kerala. The system has been developed with a view to cater to the Administration, Payroll and other Accounts activities of Government Establishments.
SSPHD strengthening State Plans for Human Development
The Project "Strengthening State Plans for Human Development" has been designed to assist state governments in following up to their respective State Human Development Reports (SHDRs).
STP Stores, Tools and Plants
All entries which are being made in STP register, and their transactions are captured in the Software.
TPC Transmission Profit Centre
It is a unit under the KSEB engaged in market and transact energy received from different sources

xiii
Executive summary
The Government of India has launched the India Statistical Strengthening Project
(ISSP) for strengthening the Statistical system in the country as a follow up measure of
the National Statistical Commission (NSC) chaired by Dr.C.Rangarajan. This project is a
Centrally Sponsored Scheme whereby the Government of India shall be giving grants to
State Governments for carrying out the necessary reforms and strengthening of the State
Statistical System (SSS), which would include not only the Directorate of Economics and
Statistics but also the line departments which are involved in the process of statistical
data collection.
The National Strategic Statistical Plan (NSSP) provides the base country situation
and defines the progress that can be made in a country, based on the evaluation of the
country’s national statistical system, identification of gaps and the assessment of
absorption capacity and sets out a medium term strategy for creating the necessary
capacity to produce comprehensive, good quality and relevant economic and social data
for policy and decision making.
The State’s specific Strategic Plan was prepared on the lines of NSSP. The State
Strategic Statistical Plan (SSSP) is expected to provide a state with a strategy for
strengthening statistical capacity across the entire State Statistical System (SSS).
The Government of Kerala have signed the letter of participation (LoP) on 7th May
2008 for making the project successful and delivering the desired outcomes. The State
Government have complied with the clauses agreed upon in the LoP, constituted the High

xiv
Level Steering Committee (HLSC) under the chairmanship of the Chief Secretary,
Project Management Team (PMT), Core Team, Specialised Teams and appointed two
Consultants for the successful preparation of SSSP. The SSSP was finalized through
wider Consultations with all the stakeholders including service organisations. The SSSP
thus finalized was approved by the PMT in the meeting held on 28.02.2011 and finally
approved by the HLSC in the meeting held on 31.03.2011.
This report has 6 chapters. The chapter-1 gives a brief introduction of the ISSP
and the process by which the SSSP has been prepared. The chapter-2 covers the statistical
system of Kerala, its vertical and lateral structures with functions. Further, the current
status of the statistical system, its strength, weakness, opportunities and threats have been
briefly described in the chapter.
The twenty key statistical activities under the project and the seven emerging
statistical activities identified by the State Government have been described and analysed
meticulously in the 3rd chapter. The weaknesses of the statistical system described in this
chapter have been aptly addressed with a clear vision, strategic goals and strategies in the
next chapter. Based on the strategic goals set out in the chapter-4, an implementation plan
has been prepared and given as chapter-5. The fund requirement for the implementation
of the plan during the next five years is estimated at Rs. 5271.83 lakh of which an amount
of Rs.334.65 lakh will be met by the State Government.
The report also contains Summary of findings and recommendations, list
abbreviations, glossary of terms used, annexures and appendices.

xv
SUMMARY OF FINDINGS AND RECOMMENDATIONS
I. Improving coordination management of statistical activities in the State
1) Constitute Kerala State Statistical Commission (KSSC) to lay down statistical standards and to ensure effective co-ordination of statistical activities in the state.
2) Constitute of Technical Advisory Committee (TAC) at State Level to function as a support structure for KSSC.
3) Constitute of Expert committees in the subject areas, viz, Agricultural Statistics, Prices and Price Indies and compilation of state accounts.
4) Introduce a system of regular user consultations to assess emerging data needs and deficiencies in the existing data sets
5) The reporting mechanisms of each of the line department shall be examined by the TAC and suggest measures for compiling reliable and credible statistics. The recommendation of the TAC shall be implemented by the concerned department under the technical supervision of the DES.
6) In the case of surveys and census initiated by various Departments / Offices of the State Government, consultations with the DES should be made compulsory and technical details of each such activity need to be finalized by the working groups specifically set up for the same.
7) Launch well planned and effective advocacy campaigns targeting policy makers, planners, data producers including those within the DES, data users and civil society institutions.
8) Create public awareness about statistical operations and importance of their co-operation and data sharing, through Documentary Films, TV / Newspaper Ads. etc.:
9) Re-orient and reform the statistical activities in line with the ‘Fundamental Principles of Official Statistics’ laid down by the UN Statistical Commission.
10) Make adequate legislation for the smooth collection of data from data providers.
II. Human Resource Development
11) To make manpower planning as a main constituent of Survey Design and Field Operations.
12) Establish a cadre structure in the department without tilting the present staff structure and subject to the modification of the existing special rules. Establish computerised personnel management system in the Department.
13) Define the functional responsibilities of each of the posts in the Department and identify training required for persons occupying those posts. Assess the training needs of each of
xvi
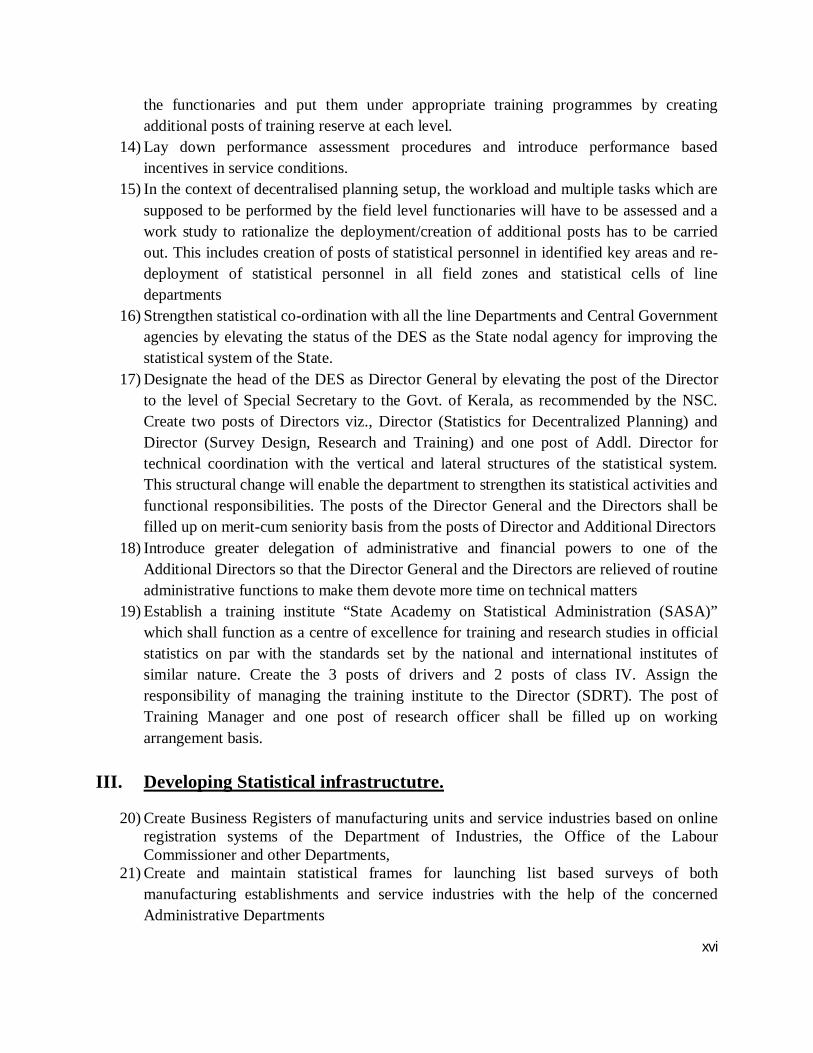
the functionaries and put them under appropriate training programmes by creating additional posts of training reserve at each level.
14) Lay down performance assessment procedures and introduce performance based incentives in service conditions.
15) In the context of decentralised planning setup, the workload and multiple tasks which are supposed to be performed by the field level functionaries will have to be assessed and a work study to rationalize the deployment/creation of additional posts has to be carried out. This includes creation of posts of statistical personnel in identified key areas and re-deployment of statistical personnel in all field zones and statistical cells of line departments
16) Strengthen statistical co-ordination with all the line Departments and Central Government agencies by elevating the status of the DES as the State nodal agency for improving the statistical system of the State.
17) Designate the head of the DES as Director General by elevating the post of the Director to the level of Special Secretary to the Govt. of Kerala, as recommended by the NSC. Create two posts of Directors viz., Director (Statistics for Decentralized Planning) and Director (Survey Design, Research and Training) and one post of Addl. Director for technical coordination with the vertical and lateral structures of the statistical system. This structural change will enable the department to strengthen its statistical activities and functional responsibilities. The posts of the Director General and the Directors shall be filled up on merit-cum seniority basis from the posts of Director and Additional Directors
18) Introduce greater delegation of administrative and financial powers to one of the Additional Directors so that the Director General and the Directors are relieved of routine administrative functions to make them devote more time on technical matters
19) Establish a training institute “State Academy on Statistical Administration (SASA)” which shall function as a centre of excellence for training and research studies in official statistics on par with the standards set by the national and international institutes of similar nature. Create the 3 posts of drivers and 2 posts of class IV. Assign the responsibility of managing the training institute to the Director (SDRT). The post of Training Manager and one post of research officer shall be filled up on working arrangement basis.
III. Developing Statistical infrastructutre.
20) Create Business Registers of manufacturing units and service industries based on online registration systems of the Department of Industries, the Office of the Labour Commissioner and other Departments,
21) Create and maintain statistical frames for launching list based surveys of both manufacturing establishments and service industries with the help of the concerned Administrative Departments

xvii
22) Constitute a Committee of Experts to examine the lists available from various sources with reference to its coverage, data elements, mechanisms of updation and its periodicity and to identify the ideal partner Department for the creation and maintenance of the Business Register. Since the detailed specifications and activities involved are to be worked out by the Expert Committee, exact costing of the project is not possible at this stage. However, the cost of these surveys is proposed to be met out of the funds provided by the 13th Finance Commission.
IV. Physical Infrastructure including IT
23) Create / upgrade physical infrastructure in the district and Taluk offices including the construction of own buildings for 28 Taluk offices housed in private buildings and transportation facility at the Taluk level for effective supervision and monitoring of field work. Upgrade the existing printing press at the Directorate with latest technological change.
24) Setup a data warehouse at the Directorate and host a web portal at the State Data Centre (SDC) which shall be accessed by the users and the beneficiaries through the Kerala State Wide Area Network (KSWAN) as the network backbone. Establish web enabled online data sharing between the DES and each of the line departments.
25) Upgrade the ICT facilities at the headquarters, district offices and the taluk offices and impart training to the existing employees for their upgradation of computer skills
V. Improving Statistical operations especially those supporting the cause of improvement in the quality and dissemination of Statistical data
26) Consistency and Completeness check of the quality of the data collected under various departments have to be ensured.
27) Establish a Research & Analysis Wing (RAW) to conduct various studies and communicate the policy relevance to the policy makers from time to time; and bring out a policy brief when the new data is available for effective policy making and interventions.
28) Evolve a data dissemination policy on par with the policy formulated by the government of India.
29) Considering the existing deficiencies and growing demands for the data in the relevant sector, it is felt that the cells in the line departments of Agriculture, Forest, Transport, Tourism, Rural Development, Panchayat, PWD (Roads & Bridges), PWD (LSGD), Health, Housing Comissionerate, may be strengthened.
(i) State Domestic product Estimates

xviii
30) Expedite the tabulation of state sample data relating to various socio-economic surveys, particularly those relating to employment- unemployment, unorganised manufacturing and unorganised services and use them for the estimation of SDP,
31) Various data sources available for the computation of SDP and revise the methodologies, if found necessary may be examined by a subject specific expert committee and by the Technical Advisory Committee.
32) A Research study may be undertaken to examine the feasibility of adopting the framework of SDP Calculation based on Income accruing method as against Income originating method as there are several conceptual issues involved in this matter.
33) Conduct Studies for the revision of rates and ratios for improving the reliability and credibility of state income estimates.
(ii) Estimates of capital formation and savings 34) Review the current methodology for the estimation of capital formation and savings in
the public sector and private sector by the Expert Committee on State Income and the Technical Advisory Committee and suggest measures for improvement.
(iii)Estimates of District Domestic Product 35) Conduct pilot studies using the small area estimation technique for obtaining district-wise
estimates of production of major sectors for improving the DDP estimates. (iv) Estimates of the contribution of Local Bodies
36) A good share of the State Plan Budget is transferred to the local bodies for regional development. Local bodies in Kerala, thus contribute significantly to value addition, capital formation and employment generation. However, accounting and book keeping systems of local bodies at present are generally do not permit consolidation of income and expenditures by source and purpose to facilitate estimation of contribution of local bodies to State Income and Capital Formation. The computerisation of accounting system of Panchayats is essentially the strategy for obtaining the estimates of the contribution of local bodies in a realistic manner. It will also facilitate in the computation of Capital Formation in the public sector by including the capital formation of local bodies. The action plan for the estimation of contribution of local bodies to the State Income and other variables has been included under the key statistical activity ‘Statistics for of Local Area Planning’.
(v) Data on Major Fiscal Variables 37) A fool proof mechanism exists for the compilation of fiscal data in the Finance
Department of the State. Data on receipts and expenditures of the State Government are available on yearly basis without much delay. This system has to be continued effectively.
(vi) Annual Survey of Industries 38) As regards ASI, continue with the present system of obtaining the data sets from the CSO
and using the same for generating state related tables. However, DES may start collecting

xix
data on production, employment and capital investment from industrial establishments as soon as the list of establishments becomes available.
(vii) Index of Industrial Production 39) The DES has to quickly finalise the methodology for the compilation of the Index of
Industrial Production in consultation with the CSO including the list of products, sample of establishments and computation methods for changing over the base year to 2004-05 and compiling the Index with the help of the Industries Department for data collection
(viii) Crop area and production statistics 40) Try out the use of alternate frames for the collection of agricultural statistics in five
Panchayats on a sample basis as a pilot study and implementation of the new methodology in all the Investigator Zones. The pilot study shall cover hilly area, coastal area, midland area, industrial area and tribal area to assess its replicability, particularly with reference to crop area estimation. The Malappattam model can be made use of for the purpose. This may be examined by the subject specific expert committee and the Technical Advisory Committee.
(ix) Wholesale Price Index 41) Compile wholesale price index numbers for agricultural and industrial products by
revising the methodology as per the recommendations of the Expert Committee to be constituted for the purpose.
(x) Consumer Price Index 42) A new series of Consumer Price Index Numbers for Rural and Urban Population may be
taken up. While the staff available for collecting a variety of prices could be used for the regular price collection work, additional strengthening may be required for the market survey.
43) Take steps to stop the collection of prices which are collected for completing the administrative formalities of individual Departments, as these prices have no relevance in macro-economic analysis.
44) Retail prices of essential commodities being collected need to be properly analysed by using econometric models and time series models to infer both the causes and components of price variations.
(xi) Health, morbidity, Mortality and Family welfare statistics 45) The basic issues relating to health statistics relate to non-coverage of private institutions
in the reporting mechanism and disintegrated multiple reporting systems. The Directorate of Health Services may seek the Government approval for introducing compulsory reporting of health statistics by all the private hospitals by using the provisions of Collection of Statistics Act, 2008 and take further steps for capturing the data through web-enabled on-line filing. The Directorate also needs to design the data input formats by integrating all the data requirements under various schemes and strengthen the on-line reporting systems. It would involve system integration and augmentation.
46) Identify the grey areas in respect of data on social security, old age and palliative care and integrate into the proposed reporting system.
xx
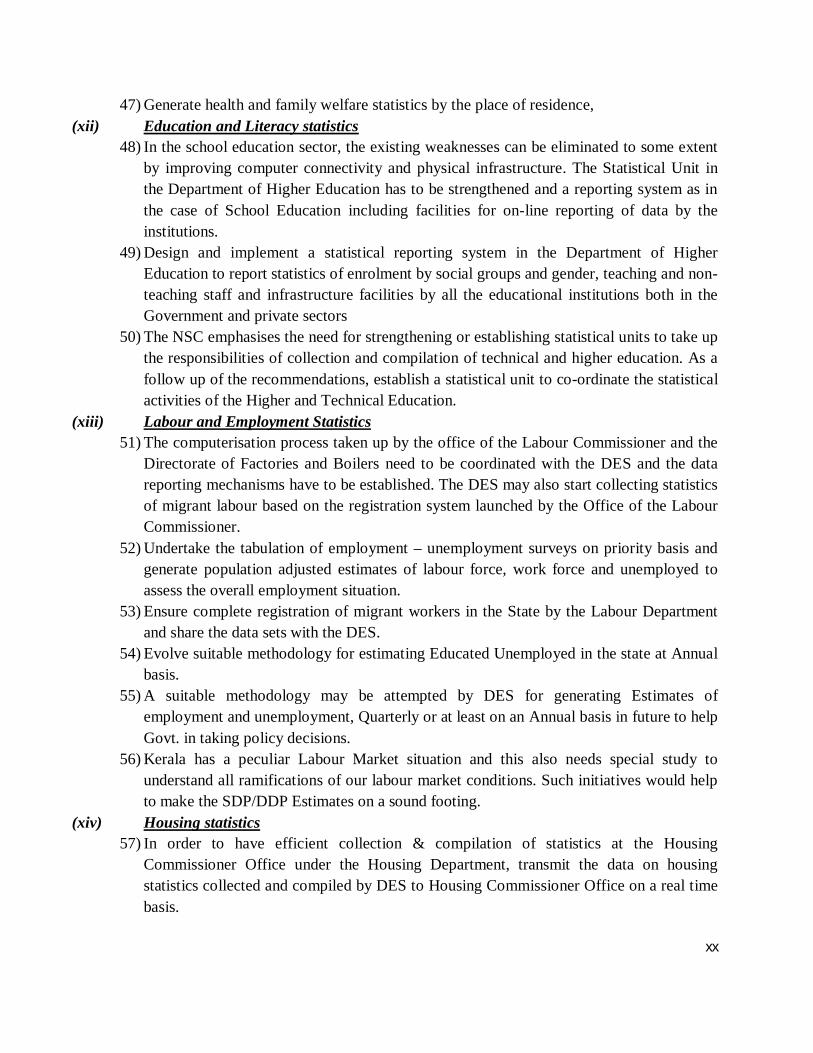
47) Generate health and family welfare statistics by the place of residence, (xii) Education and Literacy statistics
48) In the school education sector, the existing weaknesses can be eliminated to some extent by improving computer connectivity and physical infrastructure. The Statistical Unit in the Department of Higher Education has to be strengthened and a reporting system as in the case of School Education including facilities for on-line reporting of data by the institutions.
49) Design and implement a statistical reporting system in the Department of Higher Education to report statistics of enrolment by social groups and gender, teaching and non-teaching staff and infrastructure facilities by all the educational institutions both in the Government and private sectors
50) The NSC emphasises the need for strengthening or establishing statistical units to take up the responsibilities of collection and compilation of technical and higher education. As a follow up of the recommendations, establish a statistical unit to co-ordinate the statistical activities of the Higher and Technical Education.
(xiii) Labour and Employment Statistics 51) The computerisation process taken up by the office of the Labour Commissioner and the
Directorate of Factories and Boilers need to be coordinated with the DES and the data reporting mechanisms have to be established. The DES may also start collecting statistics of migrant labour based on the registration system launched by the Office of the Labour Commissioner.
52) Undertake the tabulation of employment – unemployment surveys on priority basis and generate population adjusted estimates of labour force, work force and unemployed to assess the overall employment situation.
53) Ensure complete registration of migrant workers in the State by the Labour Department and share the data sets with the DES.
54) Evolve suitable methodology for estimating Educated Unemployed in the state at Annual basis.
55) A suitable methodology may be attempted by DES for generating Estimates of employment and unemployment, Quarterly or at least on an Annual basis in future to help Govt. in taking policy decisions.
56) Kerala has a peculiar Labour Market situation and this also needs special study to understand all ramifications of our labour market conditions. Such initiatives would help to make the SDP/DDP Estimates on a sound footing.
(xiv) Housing statistics 57) In order to have efficient collection & compilation of statistics at the Housing
Commissioner Office under the Housing Department, transmit the data on housing statistics collected and compiled by DES to Housing Commissioner Office on a real time basis.

xxi
58) Though the level of housing activity is considered to be a good indicator of the economic situation in any region, there is hardly any reporting of housing activities and investments on a regular basis. It is therefore, necessary to make reporting of cost of construction and major repairs mandatory both at the time of seeking approval from the local bodies and at the time of issue of completion certificates. The local bodies need to computerise such applications and certificates issued and transmit the details online to District Offices Economics and Statistics
59) Conduct a detailed spatial survey for ascertaining the qualitative and quantitative shortage in housing in the state.
60) The Housing Wing of the PWD has to ensure complete coverage of all Government constructions under various schemes
(xv) Birth and Death Registration statistics and Population 61) The registration authorities may be provided with scanning machines for scanning of
photos of couples so that registration of marriages can be computerised and marriage certificates can be issued on-line. The quality check of birth and death registration records also needs to be introduced on a sample basis. The issue of medical certification of causes of death may be pursued with the health officers being paid by the DES.
(xvi) Electricity Production and Distribution statistics. 62) Constitute a coordination Committee and hold periodic meetings to strengthen reporting
mechanism relating to electricity production and distribution statistics in the State. 63) The statistics of electricity production and distribution are available from the KSEB
though the DES has been collecting these statistics from the Central Electricity Authority with considerable time lag. The DES needs to establish better coordination with the KSEB and seek the relevant statistics at periodical intervals. The DES also needs a web-based data sharing mechanism as soon as the total computerisation programme of KSEB is completed
(xvii) Environment and Forestry statistics 64) The major elements in strengthening of forest statistics relate to migration of the existing
FMIS to FOSS, improving the data capturing mechanism from the field by using PDAs, replacement of unserviceable computers and introduction of citizen centric on-line services. For this purpose, the existing ICT infrastructure in the forest department needs to be strengthened.
65) A mechanism of web based monitoring of water supply schemes and sanitation schemes of the Government of India through the web portal of Dept. of Drinking Water Supply and Sanitation has been in place. The database regarding Water Supply and Sanitation available with the Kerala Water Authority and Suchitwa Mission can be shared with the Dept of Economics and Statistics. The Kerala Water Authority has a web portal www.kwa.kerala.gov.in and Suchitwa Mission has www.sanitation.kerala.gov.in. These portals may be linked to the Department’s website for data sharing
(xviii) Participation in surveys of the NSSO

xxii
66) The DES has to make an action plan to clear the back log of tabulation of data sets pertaining to 61st Round to 66th Round surveys. There are 13 survey schedules relating to 6 rounds of survey which are yet to be tabulated. Arrangements have to be made for the completion of tabulation and report preparation of the above schedules in the next six months, with additional manpower hired/rearranged.
67) Undertake the tasks of pooling the Central and State sample data and deriving district level estimates on a trial basis and if successful, it may be repeated for all the rounds.
(xix) Transport Statistics 68) DES has to establish an effective co-ordination mechanism with the Department of Motor
Vehicles to share the data sets likely to become available through the e-filing system being introduced by the latter. The Road Wing of the PWD also has to be persuaded through the Government to establish the Road Information System as envisaged under the World Bank assisted project.
(xx) Statistics for Local Area Planning 69) Constitute a Co-ordination Committee under the Chairmanship of the Secretary, LSGD
with the Heads of the Departments of Rural Development, Economics and Statistics, IKM as members. The other members of the Committee may include representatives of Planning Board, Directors of the departments of Health Services, Social Welfare, Agriculture, Animal Husbandry and Education. Two external experts may also be included in the Committee.
70) The DES may prepare a working paper containing details of data requirements, formats in which data are required, the sources from which the data can be extracted and current availability of the data. The IKM may prepare a working paper indicating the details of computerisation activities undertaken, current projects, the requirements of a holistic computerisation program, current availability of hardware and software and the requirement of process engineering. The above working papers may be presented before the Coordination Committee and assess how far the statistical requirements indicated by the DES can be collected as per the existing level of computerisation, and evolve a plan of action for the collection of those data sets by utilising the services of the existing personnel both of the DES and the IKM. Also evolve a time frame for total computerisation of all the activities of local bodies along with requirements of Government support and budget requirements.
71) Organise District level workshops of local bodies and present the action plan including the data collection formats. Modify the action plans and data collection formats on the basis of the discussions in the meetings.
72) Implement the total computerisation plan in five Panchayats on a pilot basis and extend the same to all Panchayats after incorporating the modifications if any. Provide the necessary hardware, software and training to the statistical staff in local bodies for achieving total computerisation.
xxiii
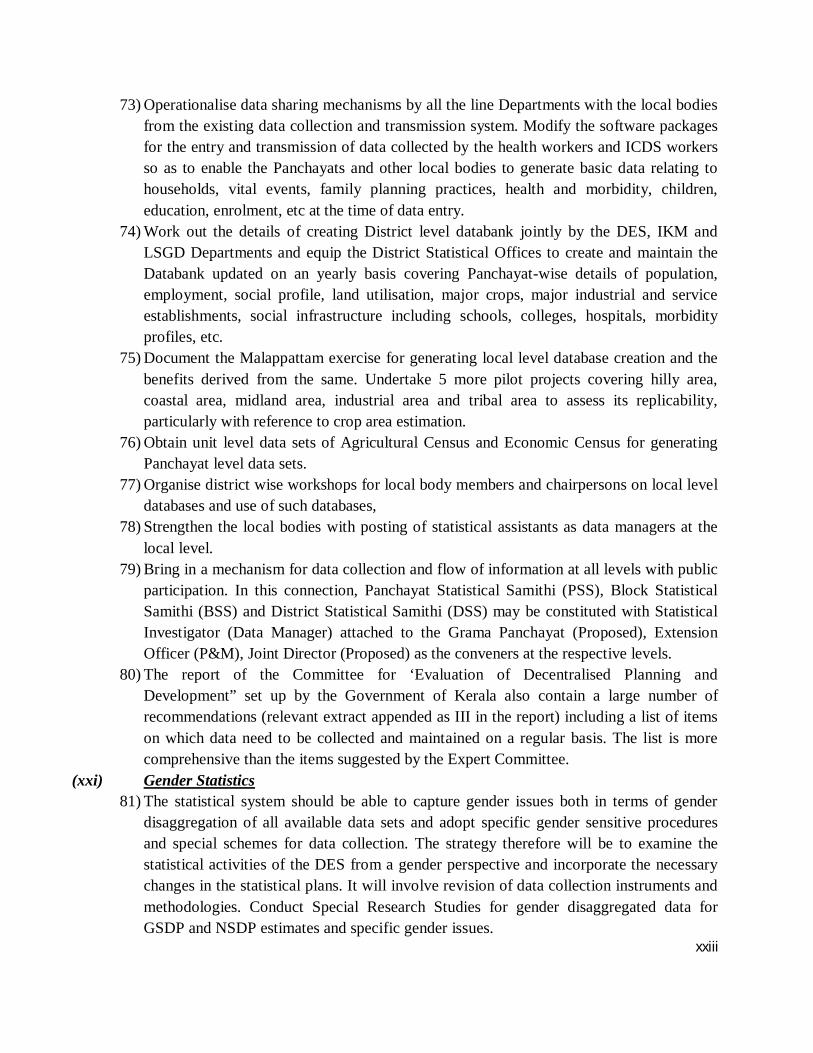
73) Operationalise data sharing mechanisms by all the line Departments with the local bodies from the existing data collection and transmission system. Modify the software packages for the entry and transmission of data collected by the health workers and ICDS workers so as to enable the Panchayats and other local bodies to generate basic data relating to households, vital events, family planning practices, health and morbidity, children, education, enrolment, etc at the time of data entry.
74) Work out the details of creating District level databank jointly by the DES, IKM and LSGD Departments and equip the District Statistical Offices to create and maintain the Databank updated on an yearly basis covering Panchayat-wise details of population, employment, social profile, land utilisation, major crops, major industrial and service establishments, social infrastructure including schools, colleges, hospitals, morbidity profiles, etc.
75) Document the Malappattam exercise for generating local level database creation and the benefits derived from the same. Undertake 5 more pilot projects covering hilly area, coastal area, midland area, industrial area and tribal area to assess its replicability, particularly with reference to crop area estimation.
76) Obtain unit level data sets of Agricultural Census and Economic Census for generating Panchayat level data sets.
77) Organise district wise workshops for local body members and chairpersons on local level databases and use of such databases,
78) Strengthen the local bodies with posting of statistical assistants as data managers at the local level.
79) Bring in a mechanism for data collection and flow of information at all levels with public participation. In this connection, Panchayat Statistical Samithi (PSS), Block Statistical Samithi (BSS) and District Statistical Samithi (DSS) may be constituted with Statistical Investigator (Data Manager) attached to the Grama Panchayat (Proposed), Extension Officer (P&M), Joint Director (Proposed) as the conveners at the respective levels.
80) The report of the Committee for ‘Evaluation of Decentralised Planning and Development” set up by the Government of Kerala also contain a large number of recommendations (relevant extract appended as III in the report) including a list of items on which data need to be collected and maintained on a regular basis. The list is more comprehensive than the items suggested by the Expert Committee.
(xxi) Gender Statistics 81) The statistical system should be able to capture gender issues both in terms of gender
disaggregation of all available data sets and adopt specific gender sensitive procedures and special schemes for data collection. The strategy therefore will be to examine the statistical activities of the DES from a gender perspective and incorporate the necessary changes in the statistical plans. It will involve revision of data collection instruments and methodologies. Conduct Special Research Studies for gender disaggregated data for GSDP and NSDP estimates and specific gender issues.
xxiv
82) Conduct of Time Use Survey to understand the time utilisation pattern of men and women in Kerala in biological, social, economic and recreational activities and to assess the burden of women in domestic and care activities. Also conduct a survey to assess the intra-household variations in consumption, educational and economic attainments in different categories of households.
(xxii) Human Development Statistics 83) Strengthen local level statistics and computation of District Income Estimates for
preparing sub-state level human development reports. (xxiii) Banking Statistics
84) National level banking statistics publications contain mainly the aggregates. These data sets are also not properly linked with the five year plans. State level data are also not linked with the state level economic indicators like SGDP and State Plans. SLBC reports are prepared on the basis of district credit plans and Panchayat level data sets are not available. While the targets of credit disbursements are reflected in the SLBC reports, achievements at the local level are not indicated in any of the reports
85) There is a well established system for reporting banking statistics laid down by the Reserve Bank of India. The local bodies may, however, seek data from lead banks and co-operative banks within their geographical region to facilitate preparation of development plans. The lead bank in each district may include data on credit disbursements also along with the data on targets
(xxiv) Unorganised sector statistics 86) Undertake studies on unorganised sector similar to those conducted by the National
Commission for Enterprises in the Unorganised Sector (NCEUS) with the help of the data sets already available relating to unorganised manufacturing and services sector industries and employment-unemployment surveys.
(xxv) Poverty Statistics 87) Commission a study to develop a methodology for the estimation of district level poverty
based on data sets available from various sources including different rounds of National Sample Surveys and National Family Health Surveys.
(xxvi) Services Sector Statistics 88) Collect the balance sheets of large establishments in Kerala for the compilation of value
addition by the organised sector service industries. The DES may seek the services and training of CSO for the purpose.
(xxvii) Non Resident Keralites Statistics 89) Conduct periodical surveys once in five years for the compilation of statistics of Non-
Resident Keralites based on the methodology finalized by the Technical Advisory Committee.

xxv
VI. Monitoring and evaluation
90) Monthly Progress Report (MPR) in prescribed format shall be collected from implementing units to watch the progress of implementation of KLSSSP action plan. The Project Implementation Cell (PIC) shall report the progress of all activities of the project to the Director of Economics and Statistics, Secretary Planning & Economic Affairs Department and CSO on or before 10th of succeeding month. This should be reviewed in the monthly review meetings chaired by the Secretary, Planning & Economic Affairs Department. The quarterly progress report should be placed before the PMT and the half yearly report before the State High Level Steering Committee for review and proper implementation of KLSSSP. The Action Taken Reports collected monthly from all line departments shall be reviewed by DES and reported to the Secretary Planning & Economic Affairs. Detailed annual report of KLSSSP shall be prepared and presented to the State High Level Steering Committee. The periodical reports shall be furnished to the Government of India as prescribed by them. All the progress reports and the annual report would be disseminated through the DES website.
91) Two evaluation studies shall be undertaken on the implementation of KLSSSP; one midterm evaluation during third quarter of 2012-13 and another during 2014-15. The mid term evaluation study shall focus on the effectiveness of strategies in achieving the set goals and in detecting shortfalls and constraints in implementation of the project. It would list success stories and failures based on the results of performance indicators and recommend measures to achieve the desired output and outcomes of the project during the remaining period. The end evaluation would assess status of State Statistical System and identify the actions further needed for its development. These evaluation study reports shall be placed before the State High Level Steering Committee for guidance, review and corrective actions by the concerned departments.
VII. The Implementation cost 92) The total cost for implementing the KLSSSP is Rs 5271.83 lakh only. An amount of Rs.
4937.18 lakh has to be provided by the Government of India including the World Bank loan and Rs.334.65 lakh has to be met by the State Government. The year wise financial commitments by the Central and State governments are given below.
Year 2011-12 2012-13 2013-14 2014-15 2015-16 Total GOI 1561.87 885.84 918.98 1003.27 567.22 4937.18 State 60.00 65.00 65.00 60.00 84.65 334.65 Total 1621.87 950.84 983.98 1063.27 651.87 5271.83
**********

1
Chapter 1 Introduction
1.1 The Rationale There is an increasing realisation among countries that focusing on desired
outcomes and impacts is the only way to ensure that scarce resources are used effectively and efficiently for economic and social development. Availability of good statistics in time and at the required disaggregate levels is a pre-requisite for the design and implementation of such development plans as the process involves establishing baselines, identifying upfront performance targets and indicators and monitoring the progress during implementation and on completion. It is, thus, important that the statistical system of each state is reformed so as to provide reliable and comprehensive statistics on economic, social and environmental aspects on a timely basis. It has become all the more important in India in the context of changing economic and social policies, increasing environmental concerns, technology growth and introduction of the third layer of government in the political system. Good statistics also constitute an indispensable element in the information system of a democratic society and the basic input for evidence based decision making.
The recommendation of Rangarajan Commission in the year 2001 that the
national level statistics on important socio-economic variables need to be generated as an aggregate of state level statistics led to the focus of reformation of statistical system to the States. The strengthening of state statistical system was thus included as the main component of India Statistical Strengthening Project (ISSP) initiated by the Central Government with the assistance of the World Bank. It has been conceived in a manner in which the states are given full freedom to design and implement their own strategic plans for strengthening of the state statistical system, keeping in mind the requirement of providing consistent and comparable statistics across a range of key areas and also a common set of activities that every state Government should aim to attain during a specified time period. The objective is to bring all the states to atleast a minimum level of capability in statistical matters within a state determined strategy.
The preparation of the State Strategic Statistical Plan (SSSP) is expected
to provide the state with a strategy for strengthening the statistical capacity across the entire state statistical system. Its preparation will also provide an opportunity for all stake holders to assess the current status of statistics, to review data needs, to educe a vision for the state statistical system (SSS) to achieve in the next five years and to set out strategies for realizing the vision. The Plan should also set out a viable, technically sound and user oriented work programme, including inter-alia budget lines and performance indicators for achieving the desired improvements in the state statistical system.

2
1.2 Formation of Department of Economics & Statistics The Statistics Department of the State had its origin in the launching of the
post war reconstruction scheme of “Improvement of Agricultural Statistics” under the Department of Research of erstwhile Travancore University in the year 1949. In 1951, after the integration of Travancore and Cochin States, the Government constituted the Board of Statistics with the Director of Research as Chairman and the Secretary to the Government in the Department of Food and Agriculture and the Professor of Statistics as members. There was also a Secretary for the Board of Statistics. The Professor of Statistics was responsible for giving advice to the Board on all technical matters. The Board of Statistics was re-organised as the Department of Statistics in 1954 and the head of the Department was designated as the Director of Statistics. The Professor of Statistics in the University of Travancore was appointed as the Director.
District Statistical Offices (DSOs) were established in four districts of the
erstwhile Travancore-Cochin State in the year 1956. A Bureau of Economic Studies was set-up in December, 1958 by the State Government for research studies on different sectors of Kerala economy and to render advice to the Government on economic issues. In 1963, the Bureau of Economics and Statistics was formed by amalgamating the Bureau of Economic Studies and the Department of Statistics.
In 1967, the State Planning Board was set up with the Director of Bureau
of Economics and Statistics as the Member Secretary of the Board. The name of the Bureau of Economics and Statistics was changed to Department of Economics and Statistics in 1980.
1.3 Functions of Department of Economics & Statistics The Department of Economics and Statistics (DES) has been directly
responsible for a number of statistical activities ever since its formation. These included (i) the computation of State Income Estimates, (ii) Estimation of capital formation, (iii) Collection of price statistics of different items and computation of various price indices including Whole Sale Price Indices (WPI) of Agricultural Commodities and Consumer Price Index Numbers (CPI) for Agricultural and Industrial workers, (iv) Computation of Index of Industrial Production, and (v) Compilation of statistics of vital events reported under the Civil Registration System. The DES has been participating in the socio-economic surveys being undertaken by the National Sample Survey Organisation (NSSO) on various subjects of national importance so as to generate data sets relating to the State for a realistic understanding of state specific issues. The DES has also been declared as the State Agricultural Statistics Authority (SASA) and is responsible for the collection of agricultural statistics including estimates of area and crop yield under the scheme ‘Establishment of an Agency for Reporting Agricultural Statistics (EARAS)’. In addition, the DES has been participating in various statistical activities taken up by the Central Government like Economic Census,

3
Agricultural Census, Live Stock Census, etc. and also undertaking different adhoc surveys and evaluation studies for itself. Some of the adhoc surveys undertaken by the Department include (a) Survey of Non-Resident Keralites, (b) Survey of Activity Status of Persons in the Live Register of Employment Exchanges (c) Survey of Aged Persons (d) Survey of Computer Institutions and (e) Family Budget Surveys. The Department has also been experimenting with the collection of local level statistics to facilitate local level planning.
The Department has been providing technical support and statistical
personnel to 40 Departments of the Government to undertake statistical activities in the relevant areas. It facilitated statistical co-ordination and securing statistics relating to different subject areas like health, education, industries, labour, tourism, etc.
The Department has been declared as the nodal agency for all statistical
matters in the State including inter-alia co-ordination of statistical activities of various line Departments vide G.O. (P) No: 16/9/Plg dated 23rd April, 2009. This has been done with the objective of generating quality data in different policy areas for objective planning and policy formulation. The DES has been specifically made responsible for the following activities as per the notification:
(i) Co-ordination of statistical activities of various line Departments/
Organisations of the State; (ii) Maintenance/ generation of data required in different policy sectors and
suggesting measures to improve the quality and coverage of data series in the State;
(iii) Taking measures to avoid duplication in collection and compilation of data;
(iv) Adoption of accepted standards in collection, classification, processing and dissemination of data, both within DES and the line Ministries/Departments;
(v) Identification of gaps in the availability of statistics in different sectors and suggesting suitable measures for improving the coverage;
(vi) Developing/ advising sampling designs and methodologies for collection of data by various line Ministries/ Departments of State;
(vii) Scrutinising and examining all statistical schemes relating to all other Departments/ Organizations of the state; and
(viii) Auditing the statistics generated by line Ministries/ Departments before released/ disseminated and suggesting measures for improving quality/ coverage of data collected
Though the DES has been enabled through the notification for reforming the entire statistical system of the State, it has not been possible to make any significant progress so far due to the absence of a well defined strategy, an
4
effective action programme and technical knowledge. The preparation of the SSSP and its implementation is thus a critical step to enable the DES to perform its functions as Statistics Authority of the State.
1.4 India Statistical Strengthening Project (ISSP) The Ministry of Statistics and programme implementation (MOS & PI) of
the Government of India took up “Tier II of the India Statistical Strengthening Project” with the assistance of World Bank with the primary focus on strengthening the statistical capacity of the States and Union Territories in conformance with the “National Strategic Statistical Plan (NSSP)” which set out a national vision, strategic policy framework and work programme for creating the necessary capacity to produce comprehensive good quality and relevant economic and social data for policy formulation and decision making. The ISSP recognizes that the time is both opportune and appropriate for the national statistical system to have a bold vision for critically important path breaking and impact creating institutional and policy reforms. Towards this end, it is envisaged that the operationalization of the national vision for India in terms of its statistical systems and organizations should essentially build upon the principles and practices mentioned below, keeping in view the necessity for ensuring the neutrality, objectivity and timeliness of official statistics.
(i) A significant shift in approach from ‘outlays-centered’ to ‘outputs and outcome-oriented’ approach,
(ii) Data/information to be no longer treated just as a raw material, instead, to be viewed as a precious resource and hence, calls for timely processing, value addition and user friendly dissemination without compromising neutrality and objectivity,
(iii) Statistical Organizations would develop sustainable methods to exploit more of administrative statistics to reduce reliance on new sample surveys and also enhance the scope and coverage of existing surveys to meet demands,
(iv) Critically review the statistical activities and statistical products to identify and eliminate avoidable redundancies and duplications and redirect the resources thus released towards new activities,
(v) Effectively address the problem of respondent burden and more user friendly data collection instruments in data collection processes,
(vi) Statistics produced and disseminated must be, as far as possible, policy relevant and administrator-friendly, in particular and user-friendly, in general while maintaining their professional integrity, reliability and timeliness;
(vii) Statistical organizations are to improve their levels of visibility through effective interactions with stake holders;

5
(viii) The statistical organizations would need to critically pay attention to the issues relating to inadequate IT hardware and software and IT skills, IT absorption, including Networking and Connectivity;
(ix) Develop effective mechanisms for consultation with stake-holders in statistical organizations. The project is primarily aimed at supporting the implementation of the
vision of the Indian Statistical System to provide within its decentralized structure; reliable, timely and credible economic and social statistics to assist decision making within and outside the Government, stimulate research and promote informed debate relating to conditions affecting people’s life. The project also aims to facilitate the process of enhancing the role of the State DESs to provide for effective coordination of statistical activities within the States as also to assist the line Departments and data producing agencies to improve the quality and coverage of data being collected and promote their use at the state, district and local levels of administration. In the context of the ISSP, twenty key statistical activities have also been identified and national minimum standards have been defined. These activities are:
1 State Domestic Product Estimates
2 Estimate of Capital Formation and Savings
3 Estimates of District Domestic Product
4 Estimate s of the Contribution of Local Bodies
5 Data on Major Fiscal Variables 6 Annual Survey of Industries 7 Index of Industrial Production
8 Crop Area and Production Statistics
9 Wholesale Price Index 10 Consumer Price Index
11 Health, Morbidity, Mortality and Family Welfare Statistics
12 Education and Literacy Statistics
12.A Statistics on educational institutions.
12.B School enrolment data
13 Labour and Employment Statistics 13.A Labour Statistics 13.B Employment Statistics
6
Besides this, the state government have identified the following key emerging
Statistical Activities
(i) Gender statistics
(ii) Human Development Statistics
(iii) Banking Statistics
(iv) Unorganized sector statistics
(v) Poverty statistics
(vi) Service sector statistics
(vii) Non Resident Keralites (NRK) Statistics
1.5 State Strategic Statistical Plan (SSSP)
The value of good statistics in development planning and policy formulation has been well recognized by the Government of Kerala and as such it decided to take advantage of the opportunity provided through the ISSP for
14 Housing Statistics
15 Birth and Death Registration Statistics and Population
16 Electricity Production and Distribution Statistics
17 Environment and Forestry Statistics 17.A Forestry Statistics
17.B Water Supply & Sanitation Statistics
18 Participation in Surveys of the National Sample Survey Organization.
19 Transport Statistics
19.A Motor Vehicles Registration Statistics
19.B Road Statistics
19.C Traffic Accident Statistics
19.D Passenger Traffic Statistics
20 Statistics for Local Area Planning
7
reforming the State Statistical System. The State thus signed the Letter of Participation (LoP) in May 2008, and designated the Department of Economics and Statistics as the nodal agency in the State for the India Statistical Strengthening Project (ISSP) in June 2008. In April 2009, the Department was also declared as the nodal agency for all statistical matters in the State including inter-alia coordination of statistical activities of various line Departments. A State High Level Steering Committee (HLSC) under the Chairmanship of the Chief Secretary was constituted in May 2009 for ensuring proper implementation of the India Statistical Strengthening Project. The other members of the Committee included the Principal Secretaries of Finance and Local Self Government Departments, Secretaries of Planning & Economic Affairs and Information Technology Departments, the Director of Institute of Management in Government (IMG), the Director of Agriculture Department, the Chief of Social Service Division in the Planning Board and a representative of Ministry of Statistics and Programme Implementation of Government of India. The Director, Department of Economics and Statistics is the Convener of the Committee. In addition, a Project Management Team (PMT) was constituted in December 2009 for the successful preparation and effective implementation of a State Strategic Statistical Plan. It was reconstituted in July 2010 with the Secretary, Planning and Economic Affairs Department as the Chairman. The PMT included a few external experts and academicians apart from the Principal Secretary, IT and the Secretary, Finance (Expenditure) Department. The Line Departments were asked by the Chief Secretary to nominate Nodal Officers to facilitate the preparation of the SSSP by providing all the details of the existing system and measures to bridge the present data gaps. A Core Team under the leadership of a Deputy Director was set up in the Department in August 2010 to facilitate the Project Management Team for the successful completion of the project. Further four Specialised Teams (Expert Groups) were constituted in September, 2010, under the leadership of 3 Additional Directors and one Joint Director, to assist the Director of Economics & Statistics The preparation of SSSP started with the appointment of two consultants on October 1, 2010 to assist the Department of Economics & Statistics. A Road Map for the preparation of the SSSP was prepared with the assistance of the consultants and it was approved by the SHLSC in its meeting held on October 5, 2010. The Committee also decided to include 7 emerging areas, viz Gender Statistics, Human Development Statistics, Banking Statistics, Unorganised Sector Statistics, Poverty Statistics, Service Sector Statistics and Statistics of Non-Resident Keralites as recommended by the PMT along with the twenty key activities specified by the Central Government. Two consultative workshops were held on 9th September 2010 and 2-3 November 2011 covering all the twenty key statistical activities and three out of seven emerging key statistical activities with active participation of all the stakeholders, the line Departments and experts to assess the status of statistical activities in various subject areas and to get suggestions for bridging the data gaps. The consultants along with the officers of the Department visited as many as

8
35 Line Departments and had discussions with the nodal officers regarding statistical activities in their respective Departments. Besides, the Consultants and the Senior Officials of the department had made discussions with the Principal Secretary, LSGD Secretary, NORKA, Principal Chief Conservator of Forests, Chief Engineer of PWD (Roads & Bridges), LSGD, Director of Social Welfare, Director of Collegiate Education, Officials and elected representatives of local bodies and other stakeholders including the experts in the field and retired Senior Officials of the department. The consultants had detailed discussions with the Specialized Teams on specific statistical issues. Discussions were also held with outside experts and former Directors of the Department of Economics and Statistics by the consultants.
Based on the conclusions and recommendations in the workshops and assessment of the statistical system in the State, a draft State Strategic Statistical Plan for the State was prepared by the consultants and it was reviewed by the PMT in the meeting held on 27th December, 2010. As decided in the meeting, the draft report was placed in the website of the DES for wider discussions and comments. It was revised by the consultants on the basis of the suggestions given by the PMT and made available to the Department on 31st December, 2011. It was also placed in the website. A series of meetings with representatives of service organisations and officials of the Department at various levels were conducted during the 1st week of January, 2011. A large number of comments/suggestions were received from different quarters. All of them were processed and discussed again in the Department internally. The consolidated comments/suggestions which could be considered were given to the consultants for the modification of the report, wherever required. The SSSP is thus finalised through wider consultations with all the stake holders including service organisations.

9
Chapter 2 Statistical System of Kerala
2.1 The System The State Official Statistical System is an integral part of the National
Statistical System and is largely guided by the latter. As in the case of National Statistical System, the Kerala Statistical System is also highly decentralized. Each Department is responsible for statistics relating to their specific subject areas while the co-ordination role rests with the DES. It is also required to provide technical advice on statistical activities to other Departments of the State. Further, the DES coordinates with the Central Statistical Organization (CSO) and the National Sample Survey Organization (NSSO) in the Central Government on all matters relating to State Statistical System. Institutional and technical capacity of the DES is, however, constraint as compared to the CSO and NSSO. The main features of the State statistical system are also similar to the National Statistical System as listed below: (i) The major component of official statistics is the data gathered as a bi-
product of administrative system. It may also include periodical returns submitted by the establishments as per various regulations of the Government or voluntarily. The other sources of official statistics include sample surveys and censuses.
(ii) It is laterally and vertically decentralized. (iii) Data collection, scrutiny, processing and preparation of results are carried
out by the DES for some of the sectors. (iv) Sample surveys are undertaken to meet the data gaps in different sectors
including agriculture. The results are, however, not available at lower administrative levels like Panchayat and Municipalities
2.2 The Structure and Functions of DES The DES has a three tier vertical structure and a lateral structure with the
line Departments of the different subject areas. At the top of the vertical structure is the headquarters of the DES headed by the Director. The second tier consists of 14 District Offices of Economics and Statistics, each headed by a Deputy Director. The third tier of the DES consists of 61 Taluk statistical Offices, each under the charge of a Taluk Statistical Officer. The organizational structure of the DES is given in Figure – 1.
The head of the DES is the Director, who is assisted by three Additional
Directors. The Directorate of Economics and Statistics has a three tier structure viz., Division, Unit and Section. Divisions are headed by the Additional Directors/Senior Administrative Officer, units are headed by Joint Directors/Deputy Directors/Administrative Assistants and sections headed by Assistant Directors/Regional Statistical Officers/Research Officers/Staistical

10
Officers. There is also an Administration Division headed by an Administrative Officer directly under the control of the Director. The three Additional Directors share the different activities of the DES except administration which is largely with the Director.
Figure – 1 Apart from its coordination role, the DES is directly responsible for the
computation of macro economic variables like State Income, District Domestic Product, Capital Formation, Wholesale Price Indices and Consumer Price Indices. It also collects a variety of prices including the prices of essential commodities on a regular basis for monitoring the market prices. DES is the State Agricultural Statistics Authority responsible for the collection of statistics relating land utilisation, area under different crops and yield rates to estimate production. It also undertakes cost of cultivation studies of different crops. DES is also responsible for collection and maintenance of vital statistics under the Civil Registration System. It participates in the socio-economic surveys taken up by the National Sample Survey Organisation (NSSO) every year for obtaining information on important socio-economic variables including consumption expenditure, employment, debt and investment, characteristics of unorganised manufacturing industries and service enterprises, etc. The compilation of Index of Industrial Production (IIP) is also being done by the DES apart from participating in Economic Census, Agricultural Census, etc.
At the district level, the Deputy Director is assisted by a District Statistical
Officer, two Additional District Statistical Officers (ADSO) each in 12 districts and one each in Pathanamthitta and Wayanad districts and one or two Research Officers. While one of the ADSOs looks after the agricultural statistics scheme of
Line Departments
DES
Headquarters
Line Departments
District Offices (14)
Taluk Statistical Offices (61)

11
‘Establishment of an Agency for Reporting Agricultural Statistics’, the other looks after the Schemes of Civil Registration and Sample Registration. The work relating to collection of prices and conduct of national sample surveys and adhoc surveys are being looked after by the Research Officers. The District Statistical Officer deals mainly with administrative functions. The total staff strength of the district office varies from 19 to 32.
The field functionaries performing the survey work under the Agricultural
Statistics Scheme including Cost of Cultivation Studies are placed in the Taluk Statistical Office. The staff strength of these offices varies from 7 to 40.
The lateral structure of the DES consists of statistical units of varying sizes in a large number of Government Departments. The existing statistical units, their sizes and functions are described in the following paragraphs.
2.2.1 Department of Agriculture The Department of Agriculture has a large contingent of 45 statistical staff
under the control of a Deputy Director. Among them, 21 persons are working at the headquarters and the rest are in the District Offices. The officers and staff at the headquarters are, however, divided between different sections in the Directorate. As many as 12 persons including the Deputy Director are working in the Monitoring and Evaluation Unit which is responsible for conducting evaluation studies and preparation of Annual Administration Report of the Department. Four persons including an Assistant Director are posted in the SW Section which compiles weekly weather watch report and weekly agricultural scenario reports based on the data collected from District Offices. The Section also prepares monthly progress report of all the plan schemes. The remaining 5 persons are placed in five other sections performing various functions. These include collection of vegetable prices from Chalai market at Thiruvananthapuram, wholesale price of 35 essential commodities on specific dates, district-wise price and sale of plant protection chemicals, monthly progress report of nine parasite breeding stations, quarterly data on pesticide poisoning cases from medical institutions, details of fertilizers distributed in the districts, monthly progress report on rehabilitation programme on draught affected pepper, etc. The statistical personnel are largely involved in the compilation of secondary data progress reports and programme statistics to highlight the achievements of the Department. Though it is an important function of the Department, there is no statistical quality control or defined methodological guidelines. These need to be introduced through appropriate re-employment of staff and training. There are also time delays in the compilation of various statistics and the newly formed districts of Pathanamthitta and Kasaragode do not have statistical persons. The number of persons posted in the Districts of Thrissur, Palakkad and Malappuram is also considered to be inadequate. It is, therefore, proposed to create statistical units in the newly formed districts and strengthen the statistical unit in the districts of Thrissur, Palakkad and Malappuram.

12
2.2.2 Animal Husbandry There are 62 statistical personnel under the control of a Joint Director in
the Department of Animal Husbandry. There are also 26 enumerators and 3 field officers of the Animal Husbandry Departments at the districts who undertake the field surveys. There are two statistical wings viz; Official Statistical Wing and Sample Survey Wing. In the Official Statistics Wing has six persons including a Joint Director and a Research Officer at the Head Quarters. In addition there are 8 Statistical Assistants Grade-I, 10 Statistical Assistants Grade-II, and 3 Junior Statistical Inspectors at the Districts. These personnel are responsible for the collection of details of slaughter houses, details of import and export of eggs and livestock products, market intelligence and price data of live stock products, cattle feed, egg etc, and estimation of meat production in the State.
In the Survey Wing, there are 11 persons including two Research Officers at the Head Quarters. Six Junior Statistical Inspectors and 14 Data Entry Operators are posted in the District Offices. The Sample Survey Wing is responsible for coordinating the conduct or ‘Integrated Sample Surveys (ISS)’ for the estimation of production of major livestock products viz, milk, egg, and meat in each season and for the year. The survey methodology and guidelines are given by the Department of Animal Husbandry of the Government of India. The statistical frame used is, however, the Panchayat Wards as it existed in 2003 as the earlier Live Stock Census was conducted in that year although a fresh census was conducted in 2007. Since the ward boundaries have under gone changes after 2003, the identification of survey area and listing becomes difficult.
Though data under the Integrated Sample Survey are collected as per the methodologies and guidelines given by the Department of Animal Husbandry of the Government of India, there are shortages in the field work and tabulation of data. The listing of households in each season is done by the Live stock Inspectors and detailed enquiry is done by the enumerators both belonging to the Animal Husbandry Department. The data collected are sent to the headquarters without any scrutiny or checking. The listing schedule data are summarised at the headquarters manually and the summaries are entered into computer by using Excel Sheets which are used for estimation. As a result there is no mechanism for ensuring quality of data and is difficult to produce the tabulated as per the time schedules specified by the Central Government. The Department with the assistance of National Informatics Centre (NIC) has just completed the development of a software for data entry and the same is under field test. The tabulation software is also under development and it is expected to be completed within the next four months. It is also proposed to utilise the services of the Data Entry Operators posted at the districts for data entry. The Department of Animal Husbandry need to assist in developing a data scrutiny programme and establish a quality check mechanism by the statistical staff of the Department and its implementation. A major requirement of the Department is continuous periodical training of Livestock Inspectors in statistical activities and the statistical staff in the domain knowledge. It should become a part of the training programme of the

13
DES. It should also lay down field inspection and sample check procedures and targets for different functionaries in consultation with the Department of Animal Husbandry.
2.2.3 Department of Fisheries The Statistics Unit in the Fisheries Directorate has 3 senior officials
including two Deputy Directors, 11 intermediary officials and 3 Statistical Assistants. The functions of the Unit include:
(i) Estimating the production of inland fisheries
(ii) Collecting landing prices and value of production of marine fish on a monthly basis.
(iii) Collection of data on fingerlings produced and distributed, etc. The methodology for the estimation of marine fish was developed by the Central
Marine Fisheries Research Institute (CMFRI) and that for inland fisheries is developed by the Central Inland Fisheries Research Institute. As per the methodology, 27 landing sites in nine maritime districts are selected for the collection of data on landings and prices on a sample of two days each in a month Data on each of the selected days are required to be collected by physical observation on most of the time. The Inspectors of Fisheries are expected to collect the data from the landing sites. However, the data collection work suffered due to non-availability of Inspectors of Fisheries.
In the case of inland fisheries, the estimation is expected to be made as per the methodology developed by the Central Inland Fisheries Research Institute (CIFRI). As per the methodology 9 clusters of 5 ponds each are selected in four districts for the collection of monthly catch data. The list of ponds prepared through a census of ponds in 2000 has now been revised through a fresh census and the same is proposed to be used for the sample selection. As of now this survey work is also in default. The Department is now preparing to re-start the survey work. There is no mechanism for field check or supervision. DES has to help the statistical staff in the Fisheries Department to design a sample check mechanism for improving the quality of data collected and impart comprehensive training to all the persons involved in data collection and tabulation.
2.2.4 Department of Dairy Development There are two Statistical Assistants posted in the Department of Dairy Development to undertake the following functions:
(i) Preparation of district-wise monthly report of physical and financial achievements,
(ii) Preparation of progress reports on Plan activities, (iii) Preparation of Departmental Bulletin,

14
(iv) District-wise consolidation of monthly/yearly reports on collection and distribution of milk, and
(v) Consolidation of progress on dairy extension services. The Unit is primarily involved in the collection of programme statistics
and there is no statistical procedure or quality check mechanism. The data sets thus primarily used for the internal use of the Department.
2.2.5 Department of Irrigation The Department of Irrigation has Major Irrigation and Minor Irrigation
Divisions apart from the Irrigation Design and Research Board (IDRB). The statistical persons in the Major Irrigation Division and IDRB are responsible for investigation and preparation of project reports for major and medium irrigation projects in the State. The Statistical Wing in the Department consists of eleven staff members including two Deputy Directors one Assistant Director and 8 Investigators in the IDRB under the Department to design and conduct various studies related to the projects. These include:
(i) Socio-economic survey of the project area, (ii) Benchmarking the cropping patterns of the investigation projects and
assessing the variations in the cropping pattern of the implemented projects,
(iii) Conducting special studies on problems involved in the resettlement of families in the catchment areas of irrigation projects, and
(iv) Post-facto evaluation study on all the completed medium/major irrigation projects.
The statistical cell in the major irrigation division has one Research
Officer and 11 Statistical assistants. The Statistical Cell in the Minor Irrigation Division is responsible for coordinating the census of minor irrigation schemes taken up under the “Rationalisation of Minor Irrigation Schemes (RMIS)” and to build up a comprehensive and reliable database in the minor irrigation sector. The Statistics Unit has nine persons under the control of a Joint Director which collects district-wise data on a quarterly basis from different government agencies covering dug well, shallow tube well, deep tube well, surface flow irrigation and surface lift irrigation schemes, etc apart from coordinating the quinquennial minor irrigation census. The work is done as per the methodologies provided by the Central Government.
2.2.6 Department of Forest The Statistical Unit of Department of Forest consisting of a Deputy
Director and 37 other statistical staff compile statistics of forest area, timber

15
production and minor forest produce along with progress reports on Plan and Non-plan schemes and implementation of Twenty Point programme. The specific items of data being compiled by the Department include:
(i) Classification of forest area by management and legal status, (ii) Area under sericulture,
(iii) Area under plantation by species, (iv) Estimated employment in forest based activities,
(v) Daily wage rates, (vi) Length of forest roads,
(vii) Details of revenue and expenditure, (viii) Production of major and minor forest produce,
(ix) Quantum of sawn and squared timber, (x) Quantity of grass cut,
(xi) Sales of minor forest produce, (xii) Wholesale prices of charcoal and firewood, and
(xiii) Wholesale prices of minor forest produce.
The Range offices of the Forest Department are computerised and the data relating to each of the above aspects are entered into Oracle based database format and are transmitted to higher levels either by way of e-mail or in CD. The system is, however, not fully functional and as such there are delays in the finalisation of annual figures. The present time-lag is about 18 month.
Considering the growing importance in the social forestry sector and there was a statistical cell existed in the department, it is suggested to have a strong statistical cell in the Social Forestry Division of the Forest Department.
2.2.7 Department of Industries There are 14 Deputy Directors 26 other statistical staff working in the
Directorate and District Industries Centres of the Department. The Deputy Directors are posted at the District Industries Centres as Managers (EI) while there is only a Research Officer at the Headquarters. The functions being performed by the statistical staff include:
(i) Management of the Entrepreneur Memorandum (EM) Part-I and Part-II
relating to proposals for starting of small scale industrial units and registration of existing units respectively, and

16
(ii) Collection of production data from selected industrial units for the computation of Index of Industrial Production by the Department of Medium, Small and Micro Enterprises.
The Department has introduced on-line registration of establishments by
individual units and the system is being perfected. On-line submission of returns by the establishments can soon become a reality. The Department, however, does not have any details of medium and large scale industrial units in the State. Statistics of such establishments were earlier maintained by the Kerala State Industrial Development Corporation (KSIDC). However, the data sets are not being updated by the KSIDC since 2003 due to non-recruitment of the statistician in the organisation. KSIDC is also not mandated by the Government to collect and maintain statistics of medium and large industries in the State. This major data gap is likely to continue even after the computerisation and on-line submission of data by industrial units become functional in the Department of Industries unless instructions are issued by the Government to include such establishments also in the system. Further, the anomaly of having a weak statistical set-up at the headquarters needs to be remedied by posting a Joint Director (Statistics) at the headquarters of Industries Department.
2.2.8 Department of Handloom and Textiles
The Department has eight statistical personnel including an Assistant Director. They are involved in (i) collection of data on handloom and power loom sectors, (ii) compiling progress reports relating to various Plan Schemes, and (iii) collection of prices of handloom cloth, etc. The Department has no system of primary data collection on handlooms and power looms. Data on number of establishments/societies by different classifications, number of weavers, production, etc are collected from the District Industries Centres (DICs). There is no mechanism at present to check the reliability and credibility of the data sets and no statistical reports are published. The statistical Cell may take up quality checks on a sample basis and start preparing and publishing statistical reports on the sector.
2.2.9 Department of Motor Vehicles The Statistics Unit in the Office of the Commissioner of Transport
consists of only a Statistical Officer at the level of Additional District Statistical Officer. It compiles statistics of registration of vehicles, permits issued to commercial vehicles, driving licenses issued, taxes collected, etc. Kerala has over 53 lakh registered vehicles. The implementation of various provisions of different legislations regarding motor vehicles and road safety aspects are to be managed by 250 Assistant Motor Vehicle Inspectors distributed among 65 Regional Transport Offices. About 45 RTOs/Sub-RTOs have facilities for on-line transmission of data and the remaining RTOs have to create data in CDs and send to the nearest office with on-line facility for up-loading the data. The Office is proposing to introduce e-filing of quarterly returns of income, expenditure, passenger data, etc. by the transport operators in the State. The Department has to

17
be persuaded to introduce the e-filing system according to a specified time frame and share the data sets with the DES. The statistical setup in the department may be strengthened with the emerging needs.
2.2.10 Department of Tourism Statistics of tourist visits in the State are being compiled by the
Department of Tourism on a regular basis from accommodation establishments. It has also prepared a comprehensive list of accommodation units and facilities have been created for on-line submission of statistical returns by the hotels. Tourist surveys to collect data sets on tourist profiles, travel patterns, satisfaction levels, expenditure patterns, etc. are being commissioned by the Department regularly. The statistical staff in the Department consists of a Research Officer and two Statistical Assistants. The Department is presently having an adhoc arrangement with the field staff of the DES for the collection of occupancy statistics from the hotels which are not submitting the data on-line. This arrangement has to be regularised and statistical staff in the Taluks or in the Blocks need to be made responsible for the collection of data on a regular basis. The Department is presently not having any system of collecting statistics of production/services rendered and value addition from tourism industry establishments. Tourism being one of the major segments of Kerala’s economy, it is important that the contribution of the tourism sector to the SGDP and employment are assessed properly and prepare Tourism Satellite Accounts. The Department of Tourism may be provided assistance for undertaking a tourism establishment survey and preparing Tourism Satellite Account
. Further, it is proposed to create a “Tourism Market Research Division”
like that in the Ministry of Tourism, Government of India by strengthening the existing statistics, and Research wing in the Directorate of Tourism. Since Tourism is the largest revenue generating industry in the State, there is an urgent need to conduct studies in respect of socio-economic impact of tourism in the State and as such it would be better to establish a strong statistical setup at the Directorate of Tourism. The Public Accounts Committee (1998-2000) of the 10th Kerala Legislative Assembly in its 110th report emphasized the need for conducting comprehensive statistical research and studies for creating a positive approach towards tourism sector and also urged the government for strengthening the statistics and research wing of the department of Tourism for the planned development of tourism industry in the state. Moreover the subject committee on tourism of the 11th Kerala legislative assembly has recommended for strengthening the wing for conducting research studies, market surveys and analysis for the development of tourism sector.
2.2.11 Department of Rural Development The Department of Rural development has a total strength of 172
statistical staff. Among them, a Deputy Director, a Research Assistant and four Statistical Assistants are posted at the headquarters and of the remaining 152 are
18
posted at the Community Development Blocks and 14 are posted in 14 DRDAs. The Statistical staff is primarily involved in the compilation of progress reports relating to various rural development schemes. These include: (i) Swarnajayanthi Grama Swarozgar Yojana (SGSY) which is now
restructured as ‘National Rural Livelihood Mission’ (ii) Mahatma Gandhi National Rural Employment Guarantee Scheme
(MGNREGS) (iii) Integrated Watershed Management Programme (IWMP),
(iv) Total Sanitation Campaign (v) NABARD Assisted Rural Infrastructure Development Fund (RIDF)
(vi) Pradhan Mantri Gram Sadak Yojana ( PMGSY) (vii) Twenty Point Programme, etc
Besides the centrally sponsored schemes, RDD is implementing state
schemes. In addition to the regular progress reports, the statistical cell has been generating various types of reports needed by the State Government. Monthly reviews at block, district and state level on the progress reports and the periodical reviews by the Principal Secretary LSGD are being conducted. However a mechanism has to be put in place for ensuring quality of data. Despite having strong contingent of statistical staff, the Department has not been able to collect the required statistics for local level planning. The statistical staff are not involved in the conduct of BPL Surveys or for the compilation of statistics generated by various institutions under the control of the local bodies. Though IKM is assisting the LSGD Department in the computerisation and on-line transmission of the data on various aspects, there is no comprehensive plan or time targets for the local bodies to become fully computerised service and development institutions.
The statistical personnel working in the Blocks are Extension Officers (P&M) in the cadre of Research Assistant whereas that working at the higher level (District level) is either Statistical Assistant Grade-I or Research Assistant. There is no uniformity prevailing at the DRDA (DPAU) level as these posts are being filled up on deputation basis. Therefore it is proposed to create the regular posts in the cadre Assistant Director at DRDAs (Poverty Alleviation Units of the district panchayats.)
2.2.12 Panchayat Directorate The Statistical Cell of Department of Panchayat consists of only one
Junior Statistical Inspector who is primarily responsible for preparing Annual Report of Birth and Death (Rural & Urban) and Annual Administration Report as well as collection of statistics from Panchayats to meet the needs of the headquarters. The statistical cell may be strengthened with adequate staff.
2.2.13 Corporations and Municipalities

19
Statistical staff of the DES is also posted in corporations and Municipalities and the total strength is 44 including 5 Research Assistants and 39 Statistical Assistants-Grade I. There are also 5 Deputy Health Officers from Health Department working in four Corporations and Alappuzha Municipality. They are responsible for sample check of birth and deaths and preparation of medical certification of causes of death. The work relating to medical certification of causes of death has been suffering due to non-availability health officers. The vacancies have now been filled and the work has started progressing.
2.2.14 Public Works Department The Statistical Cell consisting of one Research Officer and four Statistical Assistants in the Public Works Department (Buildings & Local works) is responsible for the compilation of statistics relating to construction of public buildings including public sector housing. These statistics are being collected in the case of constructions by both the Central and State Public Works Deportments as per the directions of the Ministry of Housing and Urban Poverty Alleviation of the Government of India. The data compiled includes details of addition, alterations and repairs apart from the construction of new buildings.
The statistical cells have been functioning in the PWD (Buildings & Local works) and in the PWD (Irrigation & Administration). But we do not have any statistical setup in the PWD (Roads & Bridges), and Local Self Government Department Engineering wing (functioning under Chief Engineer (LSGD). There is a need for creating statistical cells in the PWD Roads and Bridges and PWD (LSGD) which will enable us to fill up the data gaps in the road and transport statistics.
2.2.15 Department of Urban Affairs The three statistical staff posted in the Department of Urban Affairs is
responsible for the collection of building construction statistics of private buildings sanctioned and completed in urban areas covering Municipalities and Corporations. While the data are collected from all the towns with a population of 50,000 or more, such data in the case of smaller towns are collected from only ten percent of them on a sample basis. There is no mechanism at present to collect building data from non-municipal census towns.
2.2.16 Department of Town and Country Planning The Department of Town and Country Planning has a contingent of 37
statistical staff consisting of a Deputy Director, an Assistant Director, two Research Officers and others. Among them 8 persons are posted at the Head Quarters and the remaining 29 persons are posted in districts and Regional Offices of the Department. Conducting socio-economic surveys and studies, collection and analysis of data relating to urban facilities, updation of Town Directories etc are the activities are expected to be performed by the Statistics Unit in the Department. However, the statistical persons are generally not involved in the design and conduct of socio-economic surveys and its tabulation which are expected to be their work. A detailed assessment of the job profile of

20
the statistical personnel in this Department to enhance their activities and performance is warranted.
2.2.17 Department of Health and Family Welfare The Sate Health Information Cell of Department of Health Services
compiles health intelligence data and vital statistics. It has 80 statistical personnel including a Demographer and a Chief Statistician. Health, morbidity, mortality and family welfare statistics are being compiled by the Cell. The basic and source of information on various health indicators an progress of health programmes are the monthly reports from the ANMs, Multipurpose workers, Junior Public Health Nurses and Junior Health Inspectors in the Sub-Centres (SCs) of health care network. In rural areas, the data flow from Sub-Centres through PHCs to District Health Officers concerned. In urban areas, the data flow from hospitals to DHO.
The statistics being reported/ compiled on a regular basis include the following: (i) Indoor and outdoor patients treated for different diseases
(ii) Communicable and non-communicable disease cases (iii) TB and Malaria cases
(iv) Cataract operation cases (v) Active and new cases of leprosy
(vi) Attacks and deaths due to epidemics like dysentery, jaundice, etc (vii) Antenatal and natal care
(viii) Pregnancy outcome (ix) Postnatal care
(x) Maternal death (xi) Immunization
(xii) Vitamin A administration (xiii) Childhood diseases
(xiv) Infant and child death (xv) Contraceptive services
(xvi) Abortions (xvii) Availability of facilities like transport, X-ray machines and cold chain
equipments, etc In addition to the above, progress achieved under various national
programmes relating to Tuberculosis, Malaria, Leprosy, Blindness, Disabilities and Family Welfare and Reproductive Child health (RCH) are being reported and consolidated. The Department is also maintaining institution based data including infrastructure in the government hospitals and health Centres. Data on birth and death are being reported online by place of occurrence and not by place of

21
residence of the individuals. While data on communicable diseases as well as birth and deaths are reported by all the hospitals, the coverage in respect of other data sets is limited to Government health care system.
Statistical persons are working in some of the other institutions relating to medical care. There are two Research Officers in the Kerala State Institute of Health and Family Welfare to teach subjects like Health Economics, Vital Statistics, etc apart from handling feed back sessions, monitoring sessions, evaluation sessions, etc
There are 3 statistical personnel in the Department of Insurance and Medical Services for maintaining the details of insured persons and their family members, diseases of insured persons, and preparation of monthly reports on preventive vaccinations, family welfare activities, etc
There is a Statistical Assistant in the Office of the Drug Controller compiles statistics of Blood Bank Licenses including the cases of renewal, cancellation and suspension and licenses for manufacturing units of medicines relating to Allopathy, Ayurveda and Homeopathy. It also compiles statistics of recognized Medical Institutions and progress reports relating to the activities of Drug Controllers.
There are two statistical personnel posted in the Analyst’s Laboratory at Thiruvananthapuram to assist the lab in the analysis of food and water and preparation of monthly progress reports of various schemes implemented by the lab. Though there are two more such labs at Eranakulam and Kozhikode, there are no statistical personnel in these labs.
A Research Assistant is posted in the office of the Applied Nutrition Programme for organising various surveys like micro-nutrient survey, nutrition anemia survey, etc of the higher secondary students, analysing the data collected from different hospitals on low weight at birth and the data on calcium deficiency.
2.2.18 Directorate of Public Instruction The Directorate of Public Instruction in the Department of General
Education is responsible for collection and compilation of educational statistics. There are 45 statistical personnel headed by a Joint Director for the purpose. There are two types of data sets being collected annually. The first relates to data on enrolment, number of teachers, etc by gender. The reference date for the collection of these data sets is September, 30. The other types of data relate to school finances, buildings, etc. These data sets are collected as on March 31 of every year.
The Directorate of Public Instruction has District Officers in 14 Revenue Districts of the State headed by Deputy Directors of Education (DDEs). Each Revenue District is divided into Educational Districts and further into Educational Sub-Districts. There are 38 Educational Districts and 163 Educational Sub-Districts in the State. District Educational Officer (DEO) heads each District Educational Office and Assistant Educational Officer (AEO) heads each
22
Educational Sub-District Office. The DEO is responsible for the administration of High Schools, Training Schools and other specific types of schools in the Educational District. The AEO is primarily responsible for the administration of all the primary schools within the sub-district.
The primary reporting unit of educational data is the school. Educational data from schools are collected through the DDE offices in respect of schools followed by state syllabus and data from CBSE, ICSE, and Other Institutions which followed syllabus other than state syllabus collected directly in Directorate of Public Instruction. DEO/AEO is responsible for collecting statistical returns from the schools under their control and submitted to DDE. The statistical assistants attached to the DDE office in the district compiling the data sheet and transfer the data to Directorate of Public Instruction. Education Statistics data-collection and compilation is mainly based on the Schedules and Forms supplied by MHRD, Government of India, for the preparation of Selected Education Statistics, and ES series of forms.
Under the Centrally Sponsored Scheme of Sarva Siksha Abhiyan, a monthly reporting system is in operation and data sets are being collected for monitoring.
The National Council of Educational Research and Training (NCERT) undertakes quinquennial surveys of schools to collect data on various aspects including enrolment, drop out, finances, etc.
2.2.19 Department of Collegiate Education The Department has a Research Assistant and a Statistical Assistant to
collect and compile student strength by subject, sex and caste in Government and Government aided colleges. Data on teaching and non-teaching staff are also collected. There are 48 Government and 178 aided colleges and data from them are collected in paper formats. There is no system of transferring data in electronic format. Unaided private colleges are not covered in the reporting of statistical data. There is an urgent need for strengthening the statistics on higher education in the State by establishing the requisite statistical reporting mechanism including the provision of manpower and infrastructure.
In the NSC recommendation, under socio-economic statistics the recommendation No.107 relating to Higher and Technical Education emphasis the need for strengthening or establishing statistical units to take up the responsibilities of collection and compilation of technical and higher education. As a follow up of the recommendations, the Government of India has given instructions to implement the recommendation by the State Government. There is already a proposal sent from the Directorate of Collegiate Education to the State Government for establishing a statistical unit to co-ordinate the statistical activities of the Higher and Technical Education

23
2.2.20 Department of Technical Education The Department of Technical Education has just one Statistical Assistant
who is responsible for collection and compilation of expenditure and revenue statistics of polytechniques, engineering colleges, technical high schools, government commercial institutes, etc.
2.2.21 Colleges of Engineering A Statistical Assistant is posted in each of the Colleges of Engineering at
Thiruvananthapuram and Thrissur to collect data on number of new admissions by sex and community in different branches, details of students passing out every year, details of teaching staff, etc.
2.2.22 Office of Labour Commissioner The Labour Commissioner of the State is responsible for the
implementation of a large number of labour legislations including Minimum Wages Act, 1948, Child Labour Act, Beedi and Cigar (Conditions of Employment) Act, 1966, Contract Labour (Regulation and Abolition) Act, 1970, Equal Remuneration Act, 1976, Maternity Benefit Act, 1961, Industrial Dispute Act, 1947, Motor Transport Workers Act, 1961, Plantations Labour Act,1951, Shops and Establishments Act, etc. Periodical returns under the provisions of each of the above Acts are collected from industrial units, Beedi and Cigar Units and Shops & Establishments for the compilation of various reports required to be submitted to Central and State Government agencies. The data sets being collected under various Acts include:
(i) Details of number of establishments (ii) Number of workers (iii) Irregularities detected and rectified as per Minimum Wages Act (iv) Details of industrial establishments with labour unrest (v) Details of lockouts and strikes (vi) Man days lost due to lockouts and strikes (vii) Number of industrial disputes arisen and settled (viii) Statistics of closure of establishments (ix) Details of lay off, etc.
All the shops and establishments covering a wide spectrum of activities
have to be registered under the Shops and Establishments Act. The registration system is now being computerized and provision for web based data submission by shops and establishments has been incorporated. As and when the system becomes fully operational, the list of all the registered establishments along with other details will become available. It can be used for planning list based establishment surveys. The statistical staff available with the Commissionerate for various statistical activities consists of a Research Officer and three Statistical Assistants. The DES may co-ordinate with the Office of the Labour Commissioner for early establishment of the system and sharing of data.
24
2.2.23 Department of Social Welfare There are 16 Statistical Inspectors working in the Department of Social
Welfare. The functions being performed by them include compilation of monthly progress reports of ICDS scheme, preparation of quarterly report on physical and financial achievement of supplementary nutrition programme and annual consolidation of SC/ST and physically disabled beneficiaries under ICDS programme.
The Department of Social Welfare has an Anganwadi teacher and a helper
for a population of about 200 households in every Panchayat. There are 32230 Anganwadies already working in the State and 1000 more are now being set-up. The Anganwadi workers have to maintain several registers on their day today activities. These include the following:
(i) Survey Register
(ii) Birth Register (iii) Pregnant Women Register
(iv) Lactating Mother Register (v) Mother and Child Care Card
(vi) Immunisation Register Anganwadi workers on an ongoing basis are maintaining details of
population, immunisation of children, birth and death, pregnant women, etc. The Anganwadi workers send regular reports to ICDS Supervisors at the Panchayat level. The data thus received are consolidated and sent to the Child Development Project Officer (CDPO) at the Block level. The data sets are required to be computerised at the CDPO and transmitted on-line to the District Welfare Officer and to the Directorate. The Department of Women and Child Development of the Government has specified formats for the reporting of data sets collected through the Anganwadi workers. These formats include Anganwadi- wise male and female population, number of children of different age groups, number of pregnant and nursing women, reported births and deaths, deaths of women during pregnancy and delivery, details of supplementary nutrition provided, classification of children by nutrition status, details of pre-school education, details of immunisation of children, etc. These data sets form a valuable source of information for local level planning by the Panchayats. The Planning Officer from the DES posted in the Block Office, however, does not have any access to such valuable data.
The computerisation of data sets is, however, not complete in most of the
offices and on-line connectivity through KSWAN is yet to be established. As a result, valuable data sets collected by the Anganwadi workers with considerable labour are not being used and not available to the public. The statistical personnel

25
posted either at the Directorate of Social Welfare or at the Block Panchayats are also not involved in the quality check or utilisation of the data. It is high time that the data are computerised and on-line reporting mechanism is established. The statistical personnel of the Block also need to be involved in providing training and quality check in the data collection and reporting.
2.2.24 Department of Scheduled Caste Development
The Department is implementing various schemes for the social and economic development of persons belonging to Scheduled Caste communities in the State. These include scholarships to Scheduled Caste students, activities aimed at economic development of SC women, financial assistance for agriculture, housing, medical treatment, boarding and tuition fee of students, etc. There are also schemes for coaching of SC students for higher examinations, financial assistance for professional courses, assistance for self employment ventures, establishment of model residential schools for SC students, etc. In order to ensure successful implementation of these schemes, close monitoring is required. The Statistics Unit of the Department consisting of a Research Assistant and two Statistical Assistants are responsible for the collection of data for such monitoring. The activities of the Unit thus include: (i) Collection and maintenance of data on enrolment of SC students from
nursery to doctorate courses, (ii) Compilation of monthly and quarterly progress reports of physical and
financial achievements of various schemes, and (iii) Preparation of Annual Administration Reports.
The paucity of adequate staff and absence of computer and
communication facilities is a major weakness of the present system. DES may equip the unit with three PCs, scanners and printers along with the necessary software packages as part of its efforts to strengthen the Unit.
2.2.25 Department of Scheduled Tribe Development The Department has a number of field offices and projects for the
development of Scheduled Tribes in the State. The Statistical personnel in this Department consisting of a Research Assistant and a Junior Statistical Inspector are collecting statistical data and progress reports from various agencies implementing projects relating to tribal development. These include statistics of tribal population in different areas, details of students in tribal hotels, Model Residential Schools/Ashram Schools, Vocational Training Centres, etc. The data sets collected are used for appropriating funds to district level implementing agencies, assessing the feasibility of development projects, monitoring the progress of development schemes, etc. Non-availability of adequate computing facility is presently a constraint in the compilation and production of reports. DES may provide a PC along with a printer, a scanner and softwares like MS Office, Matlab and MS Project.

26
2.2.26 Crimes Records Bureau The Bureau has a Research Officer and a Statistical Assistant who are
responsible for collection and compilation of crime statistics, statistics of accidental deaths and suicides, cases of atrocities against women, children and members of SC/ST communities, etc. The data are collected from police stations across the State on an annual basis as per the guidelines and formats given by the National Crime Records Bureau. The data collected include the number crimes reported and/or registered as per different sections of Criminal Procedure Code, cases disposed without charge sheeting, number of court cases decided, etc. The data are collected on calendar year basis from police stations through District Police Establishments. The data are aggregated and made available to the National Crime Records Bureau by the middle of February.
2.2.27 Department of Civil Supplies A Statistical Officer posted in this Department compiles statistics of
weekly off-take of food grains through ration shops, average weekly prices of 17 essential commodities obtained from the DES, and monthly prices of salt on a regular basis. The weekly off-take details are collected by the Taluk Statistical Offices and sent to the Department through internet. However, there is a time lag of about five months in the compilation of these statistics.
The allotment of food grains by the Central Government, the lifting, and the quantity distributed by the ration shops are collected by the Statistics Section from the District Supply Offices and consolidated for monitoring the functioning of the PDS system. In addition the daily stock position of rice and wheat in 22 Food Corporation of India godowns in the State is in being obtained from FCI through e-mail.
An important report being collected by the Statistics Cell from the District
Supply Offices is the Monthly Rationing Report giving details of ration cards under different schemes like APL, BPL, AAY and ANPA, the requirement of food grains, the monthly allotment of food grains to 14 districts, the lifting of food grains and kerosene by the districts and the quantity of food grains distributed to the public through ration shops, etc.
2.2.28 Registrar of Cooperative Societies Kerala has a wide network of cooperatives engaged in various promotional
activities such as distribution of credit, marketing, agro processing, consumer activities, public health, education, insurance and infrastructure development. In fact the cooperative movement in Kerala has a solid foundation and impressive track record in terms of financial stability and sound infrastructure. The Statistics Section in the Office of the Registrar of Cooperative Societies (RCS) consists of a Research Officer and five other statistical staff. Their primary responsibility is to consolidate the statistics received from 62 Cooperative Circle Offices. At

27
present, there are 13347 societies under the control of the RCS. The data sets are collected as per the formats provided by the NABARD. The data elements include the number of societies under various categories, loans provided and financial performance of the societies, number of members, etc. The data are collected by the Cooperative Inspectors in the Offices of the Assistant Registrars. The data thus collected are transferred to the Offices of the Joint Registrars. The data are then transferred to the Statistics Section without consolidation. Since there is no separate staff for the collection and transfer of data the data collection work is often delayed and of poor quality. The Statistical Section also does not have the requisite computing facilities to compile the data received from different offices. The Section needs assistance for clearing the back log of data entry work and software support for data validation and tabulation apart from 6 computers and the requisite softwares. The DES may support these activities to the extent of `.3 lakh.
2.2.29 Department of Commercial Taxes The Statistical Cell in the Department of Commercial Taxes consists of 4
persons including a Statistical Officer. The Cell is responsible for the consolidation of tax collection reports received from the District Deputy Commissioners, monthly review of tax collections against targets fixed, analysis of various taxes collected, preparation of reports containing commodity wise tax collections, etc.
2.2.30 Western Ghats Cell of the Planning & Economic Affairs Department There are six statistical personnel including a Joint Director in the Western
Ghats Cell of the Planning & Economic Affairs Department. The Cell is entrusted with the formulation and implementation of integrated development schemes in the Western Ghats area covering all the districts except Alappuzha. An integrated survey of soil and land resources was carried out in the selected water shed areas through soil survey Department to obtain basic information on soil and land use. The water sheds are prioritised on the basis of 5 parameters viz, vegetation, slope, soil depth, infiltration and rain fall. The schemes being implemented under the Western Ghats Development Programs include forestry, fisheries, plantations, research and development, employment generation, infrastructure development and eco-tourism. Evaluation studies are carried out to ascertain the effectiveness of development programmes.
2.2.31 Central Plan Monitoring Unit (CPMU) in the Department of Planning and
Economic Affairs There are eight statistical personnel including a Joint Director in the
CPMU of Department of Planning and Economic Affairs. There is a Research Officer in the Planning and Economic Affairs (F) Department to process data relating to institutional finance. The CPMU is primarily engaged in the collection, compilation and preparation of monthly review notes on the implementation of

28
State Plan Schemes, Centrally Sponsored Schemes, Externally Aided Projects, Flagship Programmes, etc. It is the nodal agency for monitoring of implementation of EAP schemes, Twenty Point Programme, Member of Parliament Local Area Development (MPLAD) scheme, Economic Stimulation Package, etc. The Unit is also engaged in matters relating to inter State Council.
2.2.32 Kerala Land Use Board The Kerala Land Use Board was established in 1975 under the
Department of Planning and Economic Affairs as an agency to assist the State Government to frame policies for optimum land use and natural resource management. The main functions of the Department include (i) collection and collation of data on land resources and land use, (ii) undertake surveys on current land resources and land use, (iii) initiate studies on appropriate land use and related aspects, (iv) recommend appropriate policy frame work, (v) administer and coordinate the implementation of the decisions of the Government related to land use, etc. A Deputy Director of DES and a Statistical Assistant of the Land Use Board are working in this Department to prepare various statistical reports relating to planning and implementation.
2.3 Current Status of the Statistical System The current status of the statistical system in the State with reference to
certain specific aspects has been assessed and the findings are summarised in the following paragraphs:
2.3.1 The Environment for Statistics in the State Kerala has a tradition of using statistical information for policy formulation, planning and monitoring as well as impact assessment ever since the formation of a democratic Government in the State. The establishment of DES itself is an indication of the importance given to statistics. The statistical system of the State enjoys the highest level of patronage even today with Chief Minister as the Minister of Planning and Economic Affairs. Both the Chief Minister and the Food Minister monitors the prices of essential commodities in the State on the basis of prices made available by the DES daily. The Government is committed to making evidence-based decision making and policy formulation. Ever since the starting of economic liberalization process and opening up of the Indian economy in the last decade of the twentieth century brought up several challenges to the statistical system of both the country and the State. The transition from a closed economy dominated by the public sector to a market oriented economy and relaxation of the licensing and control regimes led to the weakening of various statistical reporting systems. On the other hand, it became necessary for the statistical system to facilitate participation of the private sector in the decision making process by providing reliable and high quality data in the context of increased private sector involvement in the economy and social sectors. The process of decentralization of powers of governance initiated through the 73rd and 74th amendments of the Constitution of India brought increasing demand on the
29
statistical system to meet the data needs of the local bodies. There is also rising expectations of the citizens from the statistical system for timely and reliable data on all the important social and economic issues. The State has, however, not been able to formulate any vision or mission for the reforming the statistical system to meet the current data needs and its dissemination.
2.3.2. Adequacy of Legislation The administrative reporting systems in different sectors of the economy are supported by various legislations. For example, the registration of vital events and reporting is done under the Registration of Birth and Death Act 1969 and Rules framed by the Sate in 1971 and 1999. Employment Statistics in the manufacturing sector are reported as per Factories Act 1948 and that in the case of services industries are reported as per Shops and Establishment Act. The Collection of Statistics Act 2008, enacted by the Central Government has not yet become effective as the relevant rules for its implementation are yet to be modified. The Act covers all types of data providers including households, enterprises and establishments. It also empowers the State Governments and local governments in data collection. It is expected that the Rules will be notified by the Central Government within a short period of time so that data collection activities in all spheres of activities can have a legal backing.
2.3.3 Coordination Mechanisms among Producers of Statistics Even though the statistical staff of DES is working in most of the
Departments and institutions, the statistical coordination of the DES with the line Departments is generally weak as the record keeping system is dictated by the administrative requirements of the respective Departments with little consideration for the requirements of statistical system. There is also no system of technical review of statistical activities of different Departments and sharing of outputs. The DES as a technical Department has also not been able to lay down standards and procedures for data collection, tabulation and dissemination of statistics relating to different subject areas. As a result, there are a number of instances of duplication of efforts and wastage of resources.
2.3.4 Mechanism of Consultation between Producers and Users Though the Department of Economics and Statistics publishes the data sets both in printed and electronic forms, there is no formal mechanism of consultation between producers and users of statistics. In fact, the DES does not have even a dissemination policy and user consultation.
2.3.5 Institutional Integrity, Professional Ethics and Transparency The statistical methodologies and procedures being followed by the DES
in various statistical activities are generally consistent with those specified by the national agencies. DES is, however, a Department of the State Government and there is no independent institution or body to ensure technical soundness and

30
independence of the statistical activities. The methodological issues and data problems are also not reviewed and discussed by any independent body of experts. Despite these systemic problems, DES has been following objective principles in the collection and processing of statistical data.
2.3.6 Statistical Cadre Though, there is a common cadre of statistical officers and staff in the
DES and line Departments, the DES has so far not constituted a formal cadre with the attendant service rules, promotional avenues and cadre management mechanism. In fact, the statistical officers and staff in the State are divided into several groups with multiple designations indicative of their mode of appointment, nature of work, etc, even though all of them perform similar statistical functions. There are also under-graduates and no personnel management information system is available in the DES leading to adhoc deployment of staff. The state government employees are generally divided into State Service and Subordinate service and for each department; do have special rules separately for subordinate service and state service. Since NSC recommends that State Government should take steps to create a common statistical cadre and State Statistical Service for manning statistical posts in all departments, there is an urgent need to restructure the existing service as Kerala Economics and Statistics Subordinate/State Service (KESSS) or Kerala Subordinate/State Statistical Service (KSSS). Though the government have introduced Salary and Payroll Administrative Repository for Kerala (SPARK) for all government employees, it would be ideal for the department to have an independent personnel management system
2.3.7 Application of Information and Communication Technology DES has made conscientious efforts to computerise its activities and to
make its staff computer literates. There are computers installed in each of the District offices and some Taluk Offices though email facility is available only at the District Offices. The Department also has its web portal which hosts various statistical reports of the DES. However, the Department has not been able to take full advantage of the ICT, primarily due to lack of a well defined vision and weak manpower resources at the headquarters. There has to be adequate upgradation of ICT infrastructure both at the headquarters and field offices and support of an Expert Group in ICT will be required to equip the DES with the support of ICT for effective and efficient statistical system.
2.3.8 Physical Infrastructure The headquarters of the DES and some of its Field Officers are housed in
Government buildings with basic infrastructure facilities like water, electricity and telephone. However, as many as 27 Taluk Statistical Offices are still functioning in rented buildings with attendant constraints of infrastructure facilities. These offices have to be shifted to Government buildings with proper infrastructure facilities.

31
2.3.9 Statistical Infrastructure The Statistical infrastructure of the DES is presently weak as it does not
maintain any of the statistical frames of geographical units, industrial establishments or institutions. At present, the Department also does not have the requisite infrastructure, expertise or human resources to develop and maintain such frames.
2.4 SWOT Analysis The statistical system of the State has certain inherent strengths and
weaknesses. These are summarised in the following paragraphs:
2.4.1 Strengths
The system is well established over the years
Well recognised as a major support system for development planning
Well spread both geographically and institutionally
Consists of regular and trained work force
Highly qualified Haman Resources.
2.4.2 Weaknesses
Absence of well defined vision and mission
Lack of focus and core activity work programme
Changing priorities, shifting of resources and irrelevant statistical activities
Absence of human resource planning
Weak coordination
Delays in processing of data
Duplication of efforts
Absence of technical advisory services
Lack of periodical reviews
Inadequate ICT applications
Constraints of physical infrastructure
Absence of statistical infrastructure
Functional disabilities
Lack of legislative support

32
2.4.3 Opportunities
Introduction of ICT and online reporting mechanisms in a number of subject areas
Availability of professional services and training institutions in the State
Collection of statistics Act 2008
Designation of DES as the nodal agency for statistical coordination in the State
Increasing awareness about the importance of statistics in development planning, monitoring and impact assessment
Preparation of State Strategic Statistical Plan and availability of resources for its implementation
2.4.4 Threats
Delays in the implementation of SSSP
Lack of public confidence in the Statistical System.

33
Chapter 3 Statistical Activities in Identified Subject Areas
The India Statistical Strengthening Project (ISSP) has been conceived by the Government of India with the main objective of establishing minimum standards in the availability and quality of statistics at least in key subject areas. A list of twenty subject areas has also been identified by the National Statistical Commission (NSC) as key statistical activities. The Government of Kerala identified seven more areas of statistics as important in the context of Kerala and thus included in the list of key statistical activities. The statistics of these sectors are generally derived from existing survey data though some of them may need fresh surveys. The list of all the 27 identified statistical activities is given in the first chapter. A review of statistical activities in the identified subject areas is given in the following paragraphs.
3.1 State Domestic Product (SDP) Estimates
The Department of Economics and Statistics has been computing estimates of State Domestic Product (SDP) since 1955 as per the methodology provided by the Central Statistical Organization (CSO) which is consistent with the United Nations System of National Accounts (UNSNA). The base year for the computation of the SDP has also been shifted periodically as per the practice followed by the CSO. Presently, the base year is 2004-05.
The estimates are based on the concept of income originating within the geographical boundaries of the State. The estimates of Gross State Domestic Product (GSDP) and Net State Domestic Product (NSDP) contributed by each industry group are estimated by using any of the production, income or expenditure approaches depending on data availability. These are aggregated over all the industries to get the GSDP and NSDP.
The DES releases Quick Estimates, Provisional Estimates and Final Estimates of GSDP as per the following release calendar given below:
Estimate Release Date
Quick Estimates Provisional Estimates Final Estimates
31st October of the next year 31st October of second year 30th September of third year
There is no system of releasing advance estimates. However, estimates projected on the basis of past trends are made available if required by the Government.
34
The compilation of GSDP involves the use of data sets available from a large number of sources. Availability of the required data on time and with the desired level of reliability is thus a major factor in the compilation of GSDP. The existing major data gaps/deficiencies are the following:
(i) The rates and ratios being used for estimating the SDP contribution of some of the products and bi-products in the agriculture and live stock sector need updation.
(ii) Estimates of livestock production need improvement in terms of reliability and timeliness.
(iii) Data on species-wise timber extraction, forest revenue and expenditure and production of minor products and social forestry are inadequate.
(iv) The SDP estimates of registered manufacturing sector are solely based on ASI data provided by the CSO (IS Wing) which are available with considerable time lag.
(v) In the case of construction sector, the data sets available are inadequate particularly in the private sector.
(vi) Tabulated results of latest socio-economic surveys with respect to state samples are not available in time.
(vii) Data on transport of passengers by private sector transports, rentals received by commercial vehicles with operator, value of repair and maintenance of road transport equipments, earnings of support services for road transportation, value of storage and warehouse services are inadequate and scanty.
(viii) In general, data sets available on the contribution of various services sector activities are grossly inadequate.
3.2 Capital Formation and Savings
Though estimates of capital formation and savings are essential requirements for taking policy decisions relating to resource mobilization and allocation of resources as well as for assessing the growth potential of the economy, the State has so far been able to estimate the fixed capital formation in the public sector only. The Gross Fixed Capital Formation (GFCF) in the Public Sector by industry of use and type of asset has been completed upto 1997-98. Thus, there is considerable time-lag in the compilation of capital formation and savings even in the public sector. It is primarily due to the following reasons:
(i) There is no mechanism at present, except the Annual survey of Industries
to asses the capital formation and savings in the private sector. (ii) In the public sector, data on capital formation are available in a crude form
and actual additions are not easily available. (iii) The data provided by the organizations engaged in mining, construction
and co-operations are not comprehensive. (iv) Estimates by type of assets are not available for supra-regional and private
sector.

35
3.3 District Domestic Products (DDP) Estimates of both Gross and Net District Domestic Product (GDDP & NDDP) are being worked out for all the districts in Kerala by using available data in each sub-sector. Data sets are available not only for agriculture sector but also from Economic Census, Population Census at district level. The latest estimates available are for the year 2008-09.Timely tabulation of state samples of socio- economic surveys and obtaining district-wise estimates by pooling central and state samples is an immediate necessity for deriving independent estimates of DDP. It is also important that data collection mechanism at the district level is strengthened.
3.4 Estimates of the Contribution of Local Bodies
Kerala is one of the pioneering states in the introduction of decentralised administration and planning. A good share of the State Plan Budget is transferred to the local bodies for regional development. Local bodies in Kerala, thus contribute significantly to value addition, capital formation and employment generation. However, accounting and book keeping systems of local bodies at present are generally do not permit consolidation of income and expenditures by source and purpose to facilitate estimation of contribution of local bodies to State Income and Capital Formation. The income sources for the Panchayats include State Funds, own tax collections and project linked Central Funds. The State Government provides funds under three different categories, namely General Purpose Fund, Plan Fund, Maintenance Grant. Own income includes property tax, licensing fee of shops, etc. Panchayats thus maintain different accounts and expenditures which are not strictly classified by end use.
3.5 Data on Major Fiscal Variables Data on major fiscal variables viz, revenue, expenditure and fiscal balance are available from the Annual Budgets of the State Governments. The DES prepares “Economic- Cum- Purpose Classification of the State Budget”. DES also prepares a Budget in Brief Document to accompany the Detailed Budget Document.
A fool proof mechanism exists for the compilation of fiscal data in the Finance Department of the State. Data on receipts and expenditures of the State Government are available on yearly basis without much delay.
3.6 Annual Survey of Industries (ASI)
The Annual Survey of Industries is the principal source of information to assist and evaluate objectively and realistically the changes in the growth, composition and structure of organized manufacturing sector comprising of activities related to manufacturing and repair services. The ASI covers factories registered under sections 2m(i) and 2m (ii) of the Factories Act 1948, ie those factories employing 10 or more workers using power and those employing 20 or

36
more workers without using power. The survey also covers Beedi and Cigar Manufacturing Establishments registered under Beedi and Cigar Workers (Conditions of Employment) Act, 1966. The data being collected through the survey include ownership particulars, fixed capital, working capital, loan outstanding, employment details, wages and emoluments, social security benefits to employees, details of inputs, products and bi-products, value of outputs, value addition, rent paid, interest paid, depreciation, etc.
Directorate of Economics and Statistics has been participating in the ASI data collection by covering the establishments not surveyed by the National Sample Survey Organization (NSSO) in the sample sector each year. However, the practice has been discontinued since 2007 following a decision taken in the State Level Co-ordination Committee (SLCC) meeting held on 5th November, 2007. Statistics of organized manufacturing industries are thus available only from the survey undertaken by the NSSO and tabulated by the Industrial Statistics Wing of Central Statistical Organization (CSO). Processed data relating to Kerala are made available by the CSO in computer media and the DES prepares its report based on the same.
DES has been able to bring out ‘A Report on Annual Survey of Industries, 2004-05, Kerala’ on the basis of the data sets made available by the CSO. Provisional data sets are also now available for 2006-07 and 2007-08, though the data sets relating to 2005-06 have not yet been received. There is a time lag of over two years in the availability of processed ASI data from CSO.
The data sets available from the CSO are for the entire state of Kerala and district-wise data are not available. The data sets, therefore, cannot be used for the compilation of District Domestic Product.
The DES has to complete tabulation of ASI data collected upto 2007 when it was discontinued and make full use of it for various purposes. One does not have to depend upon CSO even for periods upto which DES surveyed additional samples which then can be used for not only SDP but also for DDP/ HDRs etc. Trends based on these data will help DES in meeting data needs.
3.7 Index of Industrial Production
The DES has been compiling Quarterly and Annual Index of Industrial Production (IIP) based on production data collected on a quarterly basis. The index covered (i) Mining and quarrying (codes 10 to 14 of NIC 2004),
(ii) Registered Manufacturing (codes 15 to 36 of NIC 2004) and (iii) Electricity Generation, Transmission and Distribution (Code 40 of NIC
2004).
37
The data sources for the compilation of the Index are Indian Bureau of Mines in the case of Mining and Quarrying, Central Electricity Authority for Electricity Generation and Transmission and data collected directly by the DES from Manufacturing Industries. IIP is widely being used as a reliable indicator to measure the growth of industrial sector in the absence of detailed data sets from the Annual Survey of Industries. It is thus an important input in the computation of Quick and Provisional estimates of GSDP. The DES computed and published the IIP till the year 2006-07 with base year 1993-94. The CSO, however, wanted to shift the base year to 1999-2000, and the initial steps relating to weighting diagram, choice of products and selection of industrial units were completed and data collection work started. In the mean time, CSO shifted the base year for the estimation of national income to 2004-05 necessitating the shifting of the base year of IIP also to 2004-05. The focus was thus changed to the adoption of new base year and the weighting diagram has been prepared on the basis of ASI 2004-05. The concurrence of the CSO to the weighting diagram and the procedures for the identification of establishments for collecting production data are awaited. In view of the above, Indices of Industrial Production are not available beyond 2006-07 and it has led to a serious data gap in the compilation of GSDP. Department could have continued with the computation of Index based on the existing base year till the index with the updated base year get compiled on a regular basis. Non-availability of production data on time from industrial units has been a major constraint in the compilation of the index and the problem needs to be addressed when the compilation of the new series of IIP get started.
3.8 Crop Area and Production Statistics
The nucleus of the DES came into existence in 1949, essentially for collecting agricultural statistics in the State. Land utilization, as well as area, production and yield rate of various agricultural crops were compiled through Annual Land Utilization Surveys till 1974-75. The estimates from the survey, however, lacked precision due to small sample size and inadequate coverage. In 1975-76, Government of India introduced the scheme of ‘Establishment of an Agency for Reporting Agricultural Statistics (EARAS)’ to collect more reliable estimates of crop production and land utilization. The design of EARAS underwent substantial changes since its introduction in 1975-76. In 1987-88, Cluster Sampling was introduced and in 1994-95 the Investigator Zones were reconstituted. The Investigator Zones were again re-constituted in 2000-01 so as to avoid part Panchayats. As per the present design, each of the 152 Community Development (CD) Blocks and Municipalities with an area of 10 sq.km or more are regarded as strata. Those Municipalities with an area of less than 10 sq.km are merged with the adjoining Block and treated as a single stratum. Each of the strata is further divided into a number of Investigator Zones or sub-strata and these sub-

38
strata have been made co-terminus with the Panchayat. Corporations except Kollam and Thrissur are divided into three Investigator zones each.
For the purpose of area enumeration 100 clusters of plots are chosen randomly in each of the investigator zones. If the Investigator zone consists of more than one Panchayat, the 100 clusters are divided between them in the proportion of area of Panchayat and arranged in the alphabetical order. The number of clusters to be selected in each Panchayat is further divided between wet area and dry area in the proportion of area as revealed from Basic Tax Register (BTR) maintained by the village authorities. The details of survey numbers in wet and dry area are listed separately along with the geographical area of the survey number. The required survey numbers in wet and dry area are then selected circular systematically. The survey numbers thus selected are taken as key plots. A cluster of plots are then formed by clubbing the adjoining survey numbers for which definite guidelines are given. Clusters are usually formed with 5 plots or more so that the total area for enumeration meets the target of 10 acres and above.
The plots for crop cutting experiments are selected after listing the survey numbers growing the relevant crop and by using Simple Random Sampling. Wet land clusters are visited in three seasons to collect land utilisation particulars and details of seasonal crops and dry land clusters are visited twice to collect area under seasonal, annual and perennial crops. Statistics of land utilization as per 13 ways classification and area statistics of seasonal, annual and perennial crops are estimated based on area enumeration. The crops for which area estimates are computed are the following:
Estimates of Area under Crops Seasonal crops Paddy, Pulses, Tapioca, Vegetables, Sweet Potato Tubers,
Groundnut, Ginger, Turmeric, Cotton, Tobacco, Onion, Tur
Annual Crops Sugarcane, Banana, Plantain, Pineapple, Betel leaves Perennial crops Coconut, Arecanut, Cashew, Mango, Jack, Tamarind,
Pepper, Rubber, Tea, Coffee, Cardamom, Cloves, Nutmeg, Cocoa, Papaya and Drumstick
Production of estimates are also worked out for the following crops by combining both area statistics and yield rates estimated on the basis of crop cutting experiments. The crops for which production estimates are prepared include the following:
Production Estimates of Crops Seasonal crops Paddy, Pulses, Tapioca, Sweet Potato, Ginger, Turmeric,
Cotton and Tobacco Annual Crops Sugarcane, Banana, Plantain, Pineapple, Betel leaves Perennial crops Coconut, Arecanut, Cashew, Mango, Jack, Tamarind, Pepper,

39
Rubber, Tea, Coffee, Cardamom, Cloves, Nutmeg, Cocoa, Papaya and Drumstick
The other estimates and data sets prepared and released by the DES in respect of agricultural statistics are the following: (i) Productivity of crops
(ii) Source-wise net area irrigated (iii) Crop-wise gross area under irrigation
(iv) Rainfall distribution in Kerala (v) Average farm wholesale price of important crops in Kerala
(vi) Cost of cultivation of some crops, and (vii) District/ Block level production of major agricultural crops. The reports on agricultural statistics are being released periodically and the dates of release of reports on paddy during the previous agricultural year were as given below:
Sl.N
o:
Report/Data Set Release Date
1 Area statistics of Autumn crop of 2009-10 15thOctober, 2009
2 Area Statistics of Winter crop 2009-10 15th January, 2010
3 Area Statistics of Summer crop 2009-10 31st May, 2010
4 Production statistics of Autumn crop of 2009-10 15th February, 2010
5 Production statistics of Winter crop of 2009-10 30th July, 2010
6 Production statistics of Summer crop of 2009-10 30th September,2010
7 Land utilisation statistics for 2009-10 15th November,2010
There is also a system of sample check of area enumeration work and crop cutting experiments under the Improvement of Crop Statistics Scheme (ICS) by the DES and the NSSO with a view to locate the deficiencies in the system. The sample checks are carried out by the DES and the NSSO on matching sample basis. The mean yield rates of a number of crops are also being estimated by the DES for the purpose of implementation of National Agricultural Insurance Scheme (NAIS). Crop cutting experiments are being conducted for the purpose in the case of paddy, tapioca, banana, plantain, pineapple, ginger and turmeric. The main issues in estimating crop area and yield rate are the following:

40
(i) Massive wetland conversions into dry land taking place in the field are not taken into account in the preparation of frames for sample selection of dry and wet land areas. It makes the estimates biased.
(ii) Absence of proper methodology for the estimation of area and production of minor crops continues to be a problem in the field of agricultural statistics;
(iii) Realistic data on horticulture and floriculture crop are not available; (iv) Inconsistent procedures are being followed for recording of area under
mixed crops; (v) The area estimates of paddy prepared by the DES are significantly
different from those available from the Department of Agriculture though DES estimates are based on a well designed sample survey.
(vi) Though the Department of Agriculture maintains the data relating to agricultural inputs like fertilisers, machinery, etc, crop wise estimates of use of such inputs are not available.
(vii) Shortage of field investigators and additional work burden of existing field personnel badly affect the timeliness and quality of agricultural data collected and generated. The Department has 811 investigators for doing EARAS work of 1026 Investigator zones including Panchayats, Municipalities and Corporations
(viii) The field work is often completed by using temporary Investigators for short periods not exceeding six months. The appointment of provisional investigators from employment exchange should be extended to cover one agriculture year
(ix) The identification of cluster of survey numbers in the field on the basis of litho map is often very difficult for the Investigators as there are no physical boundaries and a large area of 10 acres has to be surveyed.
(x) Since total area of each of the Blocks and Panchayats are not the same, the choice of uniform number of clusters from each Panchayat make the sample sizes disproportionate across the Panchayats and Blocks.
3.9 Wholesale Price Index Numbers
DES compiles Wholesale Price Indices (WPI) of agricultural commodities based on price data relating to seventeen (17) commodities collected under the Market Intelligence Scheme of the Central Ministry of Agriculture. The base year for the index continues to be 1952-53.The seventeen commodities selected for the compilation of the index are grouped into six (6) sub-groups as given below:
Sub-Group Item Food Grains Rice Sugar Molasses Condiments & Spices Pepper, Ginger, Turmeric, Arecanut, Cardamom

41
Fruits & Vegetables Banana, Tapioca, Cashew nut
Oil Seeds Coconut, Groundnut, Sesamum (Gingelly), Lemon grass
Plantation crops Tea, Coffee, Rubber
The centres for the collection of prices of different commodities are selected by taking into account the relative importance of the centre in the production and marketing of respective commodities. The current price of the commodity in each selected centre for the month of computation is taken as the average of the prices reported on each of the Fridays in the month. The price relatives for each centre are then computed by dividing the current average price with base year average price. A simple average of these relatives across different centres is computed as the commodity index for the month. Sub-group indices are then worked out as the weighted average of the commodity indices in that sub-group. The proportion of value of production of different commodities in the sub-group is used as the weight. The overall wholesale price index for the month is the weighted average of the sub-group indices, the weights being the proportion of value of production of the sub-groups.
The prices collected from selected markets are the modal prices during peak marketing period of every day and need not necessarily be primary wholesale prices. Often, the prices reported are secondary or terminal wholesale prices. The items selected for the price collection also do not include all the characteristic agricultural products of Kerala. The time lag in the compilation and release of these indices is about two months.
DES has also been collecting wholesale and retail farm prices of agricultural commodities directly from the farmers since 1954. Wholesale prices are collected from 63 centres covering about 60 items. The prices are collected from two or three households chosen way back in 1954 based on the total production of the selected commodities. These prices are collected on a fortnightly basis and supplied to various agencies like Kerala State Electricity Board, Power Grid, District Collector, etc for the settlement of value of land. The prices are also being used in the estimation of contribution of agricultural sector to the state income. These prices are, however, not being used in the computation of Wholesale Price Indices. It is necessary to have a fresh look at the choice of crops, sample households and the entire methodology to make the prices relevant to the context.
Retail farm prices of agricultural prices are also being collected from 63 centres in respect of 45 items on a monthly basis since 1954. These prices are not being used for computing any statistical indicators, except publishing in the official Gazette of the Government of Kerala. The feasibility of using these prices for the computation of Consumer Price Indices for rural households has to be examined.

42
There is also a system of collecting wholesale prices of industrial products manufactured in the organised and unorganised sectors. These prices are used for the compilation of yearly wholesale price indices of organised and unorganised industries. The indices for the organised sector are compiled with the base year 1975-76 covering about 50 manufactured items. The indices for the unorganised sector are compiled with the base year 1978-79 covering about 35 items. The price data were collected as a part of the production data for the computation of Index of Industrial Production which could not be continued since 2007-08. However, the process could be re-introduced with the computation of new IIP series.
In effect, DES has not been able to compute a proper Whole Sale Price Index covering both agriculture and industry, despite both the wholesale farm prices of agricultural commodities and wholesale prices of industrial products are being collected since 1954.
3.10 Consumer Price Index Numbers
Consumer Price Index (CPI) Numbers for the population segment of industrial and agricultural workers are being compiled by the DES on a monthly basis. The indices are computed for 17 centres, though there are 22 data collection centres. The centres for which indices are computed along with the list of data collection centres are given below:
Sl.No Centre Data Collection Centre
1 Thiruvananthapuram Thiruvananthapuram 2 Kollam Kollam 3 Punalur Punalur 4 Alappuzha Alappuzha 5 Kottayam Kottayam 6 Mundakkayam Mundakkayam 7 Pathanamthitta Pathanamthitta 8 Munnar Munnar 9 Eranakulam Eranakulam, Mattancherry, Eloor 10 Chalakkudy Chalakkudy 11 Thrissur Thrissur – Koratty 12 Palakkad Palakkad 13 Malappuram Malappuram, Manjeri 14 Kozhikode Kozhikode, Mavoor 15 Meppady Meppady 16 Kannur Kannur 17 Kasaragode Kasaragode

43
Prices of over 300 items of consumption of industrial and agricultural workers are collected from retail shops in the price collection centres. The prices of certain items are collected on a monthly basis while the remaining prices are collected on a weekly basis. The indices are computed on a monthly basis.
The relative weights for the computation of these indices are derived from the Family Budget Survey conducted during 1998-99 and thus the base year is also 1998-99. The indices are computed for the item groups (i) Foods, (ii) Fuel & Light, (iii) Housing (iv)Clothing and (v) miscellaneous items and weighted average of these indices is taken as the general index. The indices are computed and released with a time lag of about 1.5 months. Steps are now being taken to change / update the base year by conducting a fresh Family Budget Survey. Apart from the computation of the above statutory index to fix the variable Dearness Allowance (DA) for employees under the Minimum Wages Act, the DES has been collecting several types of price data for a long time now. In addition to the prices being collected for the computation of Consumer Price Index Numbers for Industrial and agricultural workers, weekly prices of 22 items are collected from the centres which are not included in the items for index compilation. These include a few food items, fuels, transport equipments, silver, gold, etc. The prices are collected from 28 shops in 14 district headquarters. The DES also collects retail prices of 50 essential commodities on a daily basis and another 20 items on a weekly basis from shops in all the 14 district headquarters. The prices thus collected are also consolidated, averages worked out and compared with the prices of previous month/ year and sent to the offices of the Chief Minister, Food Minister, Agriculture Minister, Chief Secretary, Agriculture Production Commissioner, Secretary-Food and Civil Supplies and Secretary-Planning. Retail prices of 18 notified species of forest produces are collected on a monthly basis since 1989 from 2 important timber markets each of Kollam, Kottayam, Eranakulam and Kozhikode for the determination of market prices of those items. The estimated market prices are provided to the Principal Chief Conservator of Forest (PCCF) for the determination and notification of selling prices of those commodities. Prices are collected from two centres each from neighbouring states also. These centres are Mangalore, and Bangalore in Karnataka and Chennai and Chenkotta in Tamil Nadu and Hyderabad and Secundrabad in Andhra Pradesh. Though these prices were relevant for the fixation of prices of the above commodities till a few years back, these were found to be of not much use in the present situation. Further, some of the items for which prices are being collected are no more available in the market.
44
Retail prices of more than about 400 items of raw materials for the preparation of Ayurvedic medicines are also being collected by the DES on an annual basis from selected shops at Eranakulam, Kannur and Thiruvananthapuram since 1990. The prices collected are sent to the Principals of three Ayurveda colleges at Thiruvananthapuram, Thrippunithura and Kannur. The data are supposed to be utilised by the Ayurveda Colleges for the settlement of their contracts with the suppliers of those raw materials. Since 1968, the DES is also collecting market prices of dietary and other hospital supplies to help the medical institutions and prisons in the State to settle the contracts for the purchase of those articles. The prices of about 183 items have to be collected on a quarterly basis and for about 64 items on a yearly basis. The data collected are sent to the Health and Prison Departments. Yet another price collection being done by the DES relates to different varieties of waste paper which include, (i) Malayalam newspapers, (ii) English news papers , (iii) weekly/ magazines, (iv) gazette, (v) text books, (vi) note books and (vii) other items. The prices are collected every month from 14 district headquarters. The data are intended for fixing rate for the disposal of waste paper by the Government Offices. No examination has, however, been made so far whether the labour and collection costs involved are justified. The prices of 13 varieties of coir yarn prevailing at 27 coir producing centres are also being collected by the DES since 1955 on a weekly basis. In addition, husk prices are being collected from 30 centres again on a weekly basis since 1955, while coconut shell prices are being collected from 14 centres on a monthly basis since 2003. These prices are sent to different agencies including the Director of Coir Development and Coir Board.
Weekly retail prices of 11 spices are being collected from Kottayam, Idukki, Wayanad and Thrissur by the DES. Wholesale prices of 9 spices are being collected on a weekly basis. These prices are sent to Spices Board and other officials involved in spices trade. Weekly prices of Cocoa are separately being collected from nine centres and sent to the relevant Government Departments.
Wholesale and retail prices of four varieties of salt are being collected
from three centres on a weekly basis and sent to the Salt Commissioner and the Deputy Salt Commissioner, Chennai.
The Wholesale and retail prices of twenty essential food items are
collected from different centres and made available to the Civil Supplies Department on each Wednesday.
The daily wages of different categories of labourers are being collected from twenty villages in the State for the compilation of wage index. The wages of nineteen categories of labourers covering skilled workers like carpenter, blacksmith and mason and unskilled labourers in paddy cultivation and other

45
agricultural activities are collected from selected households. The base year is 1952-53 and weights used are the proportions of agricultural population in the concerned District. The time lag in the compilation and release of indices is two months.
Yet another interesting index being compiled by the DES is the Parity
Index. It is expected to measure the level of prosperity of the farmers and is the ratio of the index of prices received by the farmers and the index of prices paid by the farmers. The indices of prices received are computed on the basis of the farm products consisting of paddy, coconut, cashew nut, arecanut, ginger, pepper, banana, tapioca and sugarcane. Farm wholesale prices of these commodities are collected from the Taluk headquarters of nine districts. The base year is 1952-53 and price data are collected from the farmers.
The index of prices paid by the farmers is computed as the geometric mean of the indices of farm cultivation cost and domestic expenditure. The index of farm cultivation cost is the weighted geometric mean of relatives for (i) wages paid, (ii) manure, (iii) agricultural implements and (iv) livestock and folder. The index of domestic expenditure is computed by taking into account thirty items of food consumption. The base year for the compilation of these indices is 1952-53. The time lag in the computation and release of parity index is about two months. Both the base year and methodology are too old and not capable of conveying any sensible meaning.
3.11 Health, Morbidity, Mortality and Family Welfare Statistics Kerala has a multi-stream health care system. It includes Ayurveda,
Homoeopathy, Naturopathy, Yoga, Sidha and Unani apart from the modern system of medicine. The Departments providing various health care services in Kerala are (i) Department of Health and Family Welfare, (ii) Department of Medical Education, (iii) Department of Indian System of Medicine, (iv) Ayurveda Medical Education Department and (v) Department of Homoeopathy. Statistics of health, morbidity, mortality and family welfare are, however, largely compiled by the Directorate of Health Services (DHS) under the Health and Family Welfare Department. It has a Health Information Cell headed by a Demographer and assisted by a Chief Statistician who is largely responsible for coordinating the collection of vital statistics. Statistical persons are also posted in the Planning Section, Eye Bank Section, Iodine Deficiency Disorders Control Programme, Health Transport Wing, Nutrition and TB Centres at the headquarters of DHS. Statistical personnel are also posted at the districts.
There are separate reporting mechanisms with different periodicity and means of reporting under various schemes being implemented by the Directorate of Health Services and National Rural Health Mission. The DHS has established a Health Management Information System (HMIS) for monthly reporting of family welfare statistics covering (i) anti-natal care, (ii) natal care, (iii) pregnancy outcome, (iv) post-natal care, (v) infant mortality, (vi) maternal death, (vii) immunization, (viii) childhood diseases, (ix) contraceptive services, (x) abortions,

46
(xi) cases of child hood diseases, (xii) health facility services and (xiii) availability of facilities like X-Ray machines, cold chain equipments, transport, etc. In the rural areas, the data are collected by the health workers at the Sub-Centre and entered in the computer at the Primary Health Centre. These computers are the data entry nodes of a web enabled wide area network. In the case of urban areas, the data are entered into the system directly by the hospitals.
The software development for establishing an Online Mother and Child Tracking System (MCTS) is nearing completion. It is being introduced under the National Rural Health Mission (NRHM).
Morbidity data are being collected under various health related programmes including the following:
(i) Revised National TB Control Programme (RNTCP) (ii) National Programme for Control of Blindness (NPCB)
(iii) National Vector Born Diseases Control Programme (NVBDCP) (iv) HIV/ AIDS Control Programme
(v) National Leprosy Eradication Programme (NLEP) (vi) Integrated Disease Surveillance Programme (IDSP)
(vii) H1N1 Daily Reporting (viii) State Disease Control Monitoring Cell (SDCMC) Daily Reporting The existing deficiencies in the health, morbidity, mortality and family welfare statistics are the following: (i) Though, there are individual reporting systems under various programmes
like HMIS, RNTCP, etc, there is no common web based reporting system.
(ii) Software support is not available at present for reporting data on infrastructure and equipments, man power, availability of drugs, etc.
(iii) Non-availability of data from private hospitals (iv) Difficulty in collecting data from urban areas
(v) Difficulty in collecting data on migrant population (vi) Non-availability of infrastructure data even from public institutions
(vii) Duplication in reporting (viii) Slow internet connectivity
(ix) Inadequate training for health and statistics staff (x) In sufficient computers with internet connectivity
(xi) Shortage of reporting registers in periphery (xii) Medical Record Librarian post is not available in all the hospitals

47
(xiii) Implementation of ICD-10 classification is not done completely (xiv) Computerization of medical records libraries in hospitals is partial
(xv) Data on fund flow of hospitals are not available, Data on palliative care institutions, Data on old age issues and from old age institutions, Data on social security including pensions, welfare boards, health insurance etc are not neither fully available nor integrated at a single point.
3.12. Education and Literacy Statistics
There are different departments managing different levels and types of education. The Directorate of Public Instruction (DPI) is responsible for school education from primary to high school level and Directorate of Higher Secondary looks after higher secondary education. Department of Collegiate Education manages collegiate education in arts, science and commerce streams. The Department of Technical Education is responsible for technical education except medical education including modern medicine, Ayurveda and Homoeopathy.
The Statistical Cell of the DPI compiles data on school education on an annual basis. Numerical data on enrolment in different classes by gender and social groups, number of teachers, etc are collected as on September 30 of each year and Income and Expenditure from the schools collected as on March 31 of the year. Similarly teachers’ statistics also collected. The reporting units are schools and data flows through different levels of school administration system to the DPI.
A comprehensive reporting scheme of school education including school
infrastructure has been introduced under the Centrally Sponsored Scheme “Sarva Siksha Abhiyan”. The scheme objective was universalisation of primary education and to enroll all the children in the age group of 6-14 years.
In order to generate demand driven data in the education sector, the State
Institute of Education Management & Training (SIEMAT) and the District Institute of Education Training (DIET) are also collecting project specific data on various aspects of general education.
The National Council of Education Research and Training (NCERT)
under the Ministry of Human Resource Development (GOI) undertakes quinquennial all India Education Surveys to collect habitation level availability of schools, infrastructure facilities in schools, number of teachers and their qualification etc .These surveys constitute another major source of educational statistics.
The DPI has taken up computerization at a minimum level but it is not sufficient to meet the current requirement. A good number of Primary schools do not have computer and internet facility for online data transfer. Similarly data from CBSE and ICSE schools are received in paper format. Data from Vocational High School, Nursing Schools, Craft and Arts, Music schools,
48
Industrial Training Schools etc., is also needed for the preparation of Educational Statistics. Developing an appropriate software packages will make data tabulation process and generating reports easier.
The weakness of the system is the time lag in the collection, compilation
and release of data. The statistical reports to Ministry of HRD, GoI is currently pending since 2006-07 and the Administration Report from 2008-09. As a part of strengthening of statistical system in school education, the following initiatives need to be taken.
(i) Development of a web enabled reporting system (ii) Modification of Kerala Education Rules (KER) to introduce statutory
filing of educational data by schools (iii) Periodical data reporting by higher, technical and medical education
institutions in the State. (iv) Establishing a coordination mechanism at the Government level to ensure
data collection and sharing of data on a uniform basis.
The Department of Collegiate Education has a system of compiling statistics of enrolment by subject, sex and caste in Government and Government aided colleges. However, the data sets are collected and compiled manually with considerable time lag. The Department of Technical Education compiles statistics of revenue and expenditure relating to polytechniques, engineering colleges, technical high schools and government commercial institutes. The number of new admissions by sex and community in different branches of study are being compiled by the Government Engineering Colleges. These data sets also do not include private institutions and are available with considerable time lag. The Department of Collegiate Education has expressed their inability to collect data from private colleges in the absence of a Government order as the Directorate does not have any administrative or technical control over the private institutions.
3.13 Labour and Employment Statistics The sources of data on labour and employment are:
(i) Population Census (ii) Economic Census
(iii) Employment – Unemployment Surveys (iv) Office of the Labour Commissioner
(v) Department of Factories and Boilers and (vi) Directorate of Employment and Self Employment

49
(vii) Migration Surveys Comprehensive data on labour and employment by State, District and Sub-District levels are available once in ten years based on population censuses. While these statistics provide a static picture of level of employment in the economy, details of quality of employment and annual changes in employment situation are not available. The Economic Census provides estimates of employment in all types of enterprises almost once in five years. Economic Census, however, does not cover crop cultivation and wage labour in the household sector. There are also problems of coverage and under reporting in economic census. Employment – Unemployment surveys being undertaken by the National Sample Survey Organization (NSSO) provide estimates of employment at the national and state level. Even district level estimates can be derived by pooling Central and State level estimates. Quinquennial Employment – Unemployment surveys of NSSO are comprehensive and cover various aspects of labour and employment by using various concepts. In particular, labour force participation rates, worker participation rates, unemployment rates, under employment rates, sector wise employment share, availability of social security, informality in employment, etc are available through the surveys. Employment – Unemployment surveys are also undertaken by the NSSO almost on an annual basis except for a few years. These surveys are undertaken along with the surveys relating to other subjects with less number of sample households. These surveys are capable of providing state level estimates of employment. The surveys of unorganized manufacturing and unorganized service sectors of NSSO provide estimates of employment in those sectors. The DES, however, does not have any mechanism to take advantage of these surveys and derive realistic estimates of employment and unemployment on a regular basis. NSSO provides estimates of Employment/ Unemployment based on three concepts,viz Usual Status, Current Weekly Status and Current Daily Status which are very helpful for policy decisions. Statistics relating to employment, labour disputes, man days lost due to labour unrest, minimum wages, etc are being collected by the Office of Labour Commissioner under various Labour Acts. There are weekly, fortnightly, monthly, quarterly, half yearly and annual reports on different aspects of labour situation being prepared by the Office of the Labour Commissioner. The registration of establishments under the “Shops and Establishments Act” is now being computerised and provision for web based data submission has been incorporated. The Directorate of Factories and Boilers collects data on organized sector employment based on Form 21 submitted by the industrial establishments on an annual basis. A copy of the form 21 is received by the DES and details of employment, hours of work, maternity benefits, etc contained in the returns are

50
entered in the computer and aggregated to obtain annual estimates. The returns are, however, not available from a large number of factories and there is considerable time lag in the production of annual aggregates. The list of factories maintained by the Factories and Boilers Department include even closed and non-working units as those are often not de-registered. The Directorate is now in the process of computerizing the registration records and online licensing and e-filing of returns are envisaged under the programme. Once the IT application becomes operational, the data flow and its tabulation can become complete and instantaneous.
The Directorate of Employment and Self-Employment as per the directions of the Director General of Employment and Training in the Union Ministry of Labour and Training collects statistics of employment under its Employment Market Information (EMI) Programme. Under the programme, data on employment are being collected on a quarterly basis from establishments employing 25 workers or more on a statutory basis and those employing 10 to 24 workers on a voluntary basis by each of the Local Employment and Self-Employment Guidance Centres in the State. The data sets available through this source suffers from (i) incomplete list of establishments, (ii) non-response even from establishments compulsorily required to submit employment returns and (iii) delays in processing. Even though the Directorate of employment and training has to handle a very large quantum of data on employment, it is quite surprising to note that it has no statistical mechanism/nor statistical personnel working in that department to collect compile and disseminate the available data in a scientific manner.
The Government has also undertaken a number of Migration Surveys
since 1998-99 to understand various aspects of migrants from Kerala working in different parts of India and foreign countries.
Despite the existence of several sources of data on labour and
employment, the DES has not been able to produce any comprehensive set of statistics on labour and employment situation in Kerala. It is still struggling with different fragments of employment data available from different sources with varying levels of inadequacies and deficiencies. It has also not been able to address the issues of migrant labour in Kerala and out-migrants from Kerala to other states and countries.
3.14 Housing Statistics The housing policy of the Government of Kerala emphasizes the establishment of a Management Information System (MIS) for housing sector so as to create scientific data base on housing and to strengthen monitoring of building activity in the State. The agencies involved in the collection of housing statistics in the State are primarily the following:

51
(i) Housing Cell in the Public Works Department (PWD-Buildings and Local Works)
(ii) Housing Cell in the Department of Urban Affairs (iii) Commissionerate of Housing and
(iv) Department of Economics and Statistics
Data on public sector housing are compiled by the PWD (B &LW) on the basis of sanctions received for construction activities and the progress reports received from the field offices of PWD regarding implementation of approved construction plans.
The Statistics Cell of Department of Urban Affairs is responsible for the
collection of data on private buildings sanctioned and completed in urban areas covering Corporations and Municipalities with a population of 50,000 or more. Such data on smaller towns are collected on a sample basis from ten percent of municipal towns. Non-municipal census towns are not covered by the Department of Urban Affairs though DES covers such towns directly. The data sets from Urban Affairs are not available regularly and completely. The proformae prescribed by the National Buildings Organization include items of data which are not readily available with the Corporations and Municipalities. Thus completion of the proformae in all respects, particularly year wise investment in continuing projects would involve data collection from individual households. The skeleton statistical staff available will not be able to undertake such surveys. The Housing Commissioner is responsible for the co-ordination of various housing schemes and planning and forecasting of funds required for housing in the Government sector. The Commissionerate thus maintains statistics of housing construction undertaken by different agencies like Kerala State Housing Board, Nirmithi Kendra, Commissionerate of Rural Development, Kudumbasree, Matsyafed, Fisheries Directorate, Scheduled Tribe Development Department, Directorate of Handloom, Kerala urban and Rural Development Finance Corporation, Kerala State Handloom Development Corporation, SC/ST Development Corporation, etc. The Commissionerate also undertakes sample surveys of housing sector to project housing demand over the years. However, the statistical staff of the Housing Commissionerate is presently being used by the DES.
Technical Cell of the Housing Department (office of the Housing Commissioner) was established in 1981 to achieve the desired degree of co-ordination among the various housing organizations in the State. Currently this office is assisting Govt in policy formulation, planning and forecasting of funds required for housing in the Government sector, furnishing the housing statistics for Central Govt & State Govt Planning Boards, dissemination of latest information on housing construction technology, rules & regulations etc. Housing Statistics Cell has been formed under Housing Department with budgetary

52
provision for maintaining statistics of house construction activities undertaken by different agencies, both in the public as well as private sectors and also for arranging housing surveys, in order to ascertain the qualitative and quantitative shortage of Houses in the State. Unfortunately Housing Statistics Cell has not been performing the functions for which it had been formed. This office with no statistical staff has been engaged in collecting and compiling secondary data from those agencies in the public sector for assisting the Housing Department and Government. Lack of statistical staff has also affected the data compilation to a great extent.
With the introduction of Decentralisation of Powers Act, 2000 in the state, the functions of Local Self Government in housing have increased by many times. Further a number of Housing schemes are also being implemented through various departments viz, SC development. ST development, Revenue etc. As several schemes are being implemented through LSGIs and concerned departments, the Housing Department is not in a position to offer a actual status of the existing Housing scenario of the State and also the housing demand of the state. The impact of housing on various factors like stimulation of economic activity ( 2"d largest employment sector), quality of life of the poor, health conditions, education, employment opportunities, social justice etc are to be considered while formulating housing policy. It is seen that general studies are viewing housing as simple as any construction activity involving investment in terms of land, money, material and labour. In order to have the public policies in housing yield the desired result, the nature of housing demand for different sections of the society and the mismatch between supply and demand has to be analysed.
It is therefore proposed a detailed spatial survey for ascertaining the qualitative and quantitative shortage in Housing in the State The Housing statistics available from the PWD and Department of Urban Affairs are collected and reported by the DES. In addition, attempts are being made by the DES to collect housing statistics from Gram Panchayats through the District Offices of Economics and Statistics by sending a specific format for compiling housing statistics on the basis of records maintained by the Panchayats. The data sets being obtained from the Panchayats include number of residential and non-residential buildings completed each year along with the details of ownership and type of roof. The reporting system has been introduced in 2001-02. The data are, however, not easily available and there is considerable delays in the compilation and release of data. The prices of building materials and wages of construction workers are also being compiled by the DES from each of the District Headquarters on a quarterly basis for the compilation of a building cost of index with base year 1990-91. The materials included in the price collection are bricks, river sand, granites, timber scantling, timber planks, cement, steel, stone slab, roofing tiles, paints and varnishes, sheet glass, sanitary wares and electrical fittings. Data relating to wage rates in construction activities are collected in respect of mason,

53
carpenter, plumber, wiremen, and unskilled workers. The cost of building indices have been computed till 2007-08 and attempts are now being made to shift the base year from 1990-91 to 2004-05. There are multiple agencies dealing with housing and housing statistics. However, there is hardly any reporting of housing activities and investments on a regular basis even though it is a major indicator on growth of the economy. It has to be made compulsory to report cost of construction at the time of seeking approval for construction and issue of completion certificates. Facilities for online submission of such reports may be provided so that data sets could become available on a real time basis.
3.15 Statistics of Birth and Death and Population Statistics of births and deaths are compiled on the basis of Civil
Registration System introduced under the Registration of Births and Deaths (RBD) Act, 1969. The Act came into force in Kerala on 1st April 1970.It is required under the Act that each vital event should be reported within 21 days from the date of occurrence of the event. This Act also provides for registration of events beyond 21 days on payment of some penalty. In the case of large delays registration can only be done after taking the permission of the District Magistrate.
Director of Panchayats is the Chief Registrar of Births and Deaths in
Kerala. The Additional Director of Economics and Statistics is designated as the ‘Additional Chief Registrar’. At the district level, the Deputy Director of Panchayat, Secretaries of Municipalities and Corporations and Executive Officer of Kannur Cantonment are designated as District Registrars of Births and Deaths. There are 1044 registration units in the State and among them 978 are rural units and the remaining are urban units. The Secretaries of Grama Panchayats, Health Inspectors and Health Officers of Municipalities and Corporations and the Executive Officer of Kannur Cantonment are local Registrars of the concerned registration units. The registration of births under the Civil Registration system is almost 100 percent and that of deaths is about 99.5 percent.
The data reporting forms contain details of birth, death and still birth.
Birth registration form contains information on date of occurrence/registration, usual residence of mother, place of birth, sex and weight of the child, order of birth, type of medical attention at birth, type of delivery and characteristics of the parents including their name, age, religion, educational status, occupation etc. In the case of death, information includes name, sex, age, marital status, religion, occupation, usual residence of the deceased, place of occurrence, date of occurrence/registration, cause of death, whether medically certified or not and kind of medical attention received at the time of death and characteristics of the mother, pregnancy period etc. in the case of still births. These forms have two parts: legal and statistical. The statistical part of the vital events registered in the registration units, are forwarded to the District Offices of Economics and

54
Statistics on a monthly basis for computerisation. After computerisation, the data sets are forwarded to the Directorate in computer media on an annual basis for the preparation of the Annual Vital Statistics Report. The Vital Statistics Division of the DES prepares this report as per the methodology and instructions issued by the Registrar General of India (RGI) from time to time. The report contains district-wise statistics of births, deaths, infant deaths, still births and the related vital rates among other things.
The RBD Act stipulates certification of cause of death by the attending
medical practitioner. However, it is presently implemented only in five centres consisting of Thiruvananthapuram, Kollam, Kochi and Kozhikode Corporations and Alappuzha Muncipality and 153 medical institutions are covered under the scheme. Statistics relating to medically certified deaths are tabulated by using World Health Organization (WHO) Code list of International Classification of Diseases (ICD) – 10. The work is being carried out by the Deputy Health Officers working in the concerned centres. The coded data sets are forwarded to the Department of Economics and Statistics for consolidation and preparation of reports. There are, however, considerable delays in the coding and forwarding of data to DES due to non-availability of qualified Deputy Health Officers,
Information Kerala Mission (IKM) has provided “Sevana” package in all the Grama Panchayats, Municipalities and Corporations for registration of births and deaths and issue of certificates. In addition, IKM has also established birth and death registration kiosks in 61 government hospitals and 289 private hospitals with online connectivity to the respective registration offices. This facility is available in 5 Corporations, 32 Municipalities and 45 Grama Panchayats. The birth and death registration data captured through “Sevana” package can be transferred to IKM nodes and consolidated. The establishment of broad line connectivity by all the Panchayats, Municipalities and Corporation will enable web based data transfer and report generation softwares can be used for aggregation and generation of all the required tables. IKM has already started sharing the data with DES through computer media and by 2011 there will not be any requirement of data entry by the District Offices of Economics and Statistics as all the registration agencies have already been computerised and “Sevana’ services are in operation. The Director of Health Services also compiles birth and death statistics on the basis of data provided by the health workers at the Sub-Centres and Primary Health Centres (PHCs). The data are entered at the PHCs and transferred online to the District Health Offices (DHO) and then to the Directorate of Health Services. Data are also collected by the DHO from hospitals and other health institutions and integrated with the data sets available from PHCs. Birth and Death data are thus compiled by the DHS as a part of Health Information System. The data on births and deaths are presently compiled by all the agencies on the basis of place of occurrence and not on the basis of place of residence of
55
the persons involved in the events. It is despite the fact that registration forms contain information on place of residence of the persons and “Sevana” package has a drop down screen for coding all the local bodies in the State. The package also provides for the registration of marriages which has been made compulsory by the State Government. However, no effort has been made to compile marriage data. An issue relating to Civil Registration System is that quality check on the availability of all the details in the registration forms and data entry is weak. The Sample Registration Scheme (SRS) of Births and Deaths is also being implemented in a sample of villages and Urban Blocks to estimate annual vital rates and to verify the completeness of Civil Registration System. The rural samples are covered by the DES personnel and the census supervisor independently and the urban samples are covered by the Census Department. It is done under the guidance of Directorate of Census Operations.
DES is also having the responsibility of monitoring the scheme of Medical Certification of Causes of Death (MCCD). Under the scheme, medical certificates of death incorporating the cause of death as per ICD-10 classification are collected from public and private hospitals through statutory returns prescribed under the RBD Act 1969.
Normally, births occurring in the hospitals (majority of hospitals are in the urban area) are being reported directly to the concerned Registrars. The place of occurrence of vital events will be recorded as the place where the hospital situates. But the usual place of residence of the mother may differ. This will result in large difference in vital rates computed for rural and urban areas. So, it should be made mandatory to report the actual place of residence of the mother. NSC recommends that regular training shall be imparted to those recording vital events and to build up public awareness through campaigns. Sufficient training from RGI may be imparted to SRS officials periodically for improving the quality and reliability of data generated through the scheme and hence the vital rates. To obtain district and lower level vital rates, the number of sample units under SRS to be increased. The need for producing vital rates at lower level has been emphasized by the NSC and to use the SRS as source of data for longitudinal study of the social dynamics of the country and as a means of validating the CRS data.
3.16 Electricity Production and Distribution Statistics
Statistics of electricity production and distribution are compiled by the Kerala State Electricity Board (KSEB). The Board is divided into Generation Profit Centre (GPC), Transmission Profit Centre (TPC) and Distribution Profit Centre (DPC). The GPC operates and maintains 26 hydroelectric generating stations, 2 thermal power plants and a wind farm. Renovation, Modernisation and updating works of the hydroelectric projects are also being undertaken by the GPC. The TPC manages the construction, operation and maintenance of EHT substations and transmission lines; and the supply of power to EHT consumers. The DPC controls distribution of electricity energy in the state, construction, operation and maintenance of distribution network including 11 KV lines, LT
56
lines, distribution transformers and other allied installations. It monitors energy transactions, revenue realisation, voltage improvement/ system improvement works and master plan works. Statistics for power generation and distribution are compiled by the Distribution Profit Centre on a daily basis and transmitted to the Kerala Electricity Board by email. Details of progress in respect of various electricity projects are reported in proper format by the circles Offices of the DPC on a monthly basis. Statistics of consumption of energy both in quantity and value are also reported to the Financial Adviser of the Board on a monthly basis. These data sets are consolidated on a yearly basis and included in the publication titled “Power System Statistics”. The publication for the year 2008-09 has been released and the time lag is about 18 months. However, summary of data relating to generation, distribution and asset creation are included in the Annual Report of the Board within nine months of the relevant financial year. Though the billing and collection of electricity changes in each sub-station is computerised, there is no inter-linking of systems at present. Thus, data sets generated at the sub-stations cannot be transmitted online. Software is presently being developed for progress reporting and accounting. Similarly a Supply Chain Management System for managing purchases and inventory control is under testing. The Board has also taken a decision to implement “Restructured Accelerated Power Development and Reforms Programme”. The programme envisages total computerization with wide area network covering all the establishments of the Board. The IT agency for the work has been identified and the work is expected to be completed within two years. Though the Board has fairly reliable supply side data, the demand side data availability is weak at present. The number of consumers and their average consumption rates are compiled from the records of substations but the data sets are not available by administrative geographical units of Districts and Panchayats. DES is also not publishing data on Plant-wise service time, tripping, etc. It is proposed to include geographic locations and other important details in the computerised system. The Board is presently involved in the conduct of 18th National Power Supply Survey for the projection of power requirements during 12th Plan and is keen to have collaboration with the DES in the exercise. As the agency responsible for statistical coordination in the State, DES needs to collaborate with the KSEB and have frequent interactions regarding data requirements of the sector. In this regard, establishing a statistical unit at the KSEB may be contemplated.
3.17 Environment and Forest Statistics The two major sources of data on environment and forest are (i) the Kerala
State Council for Science, Technology and Environment (KSCSTE) and (ii) the

57
Forest Department. The Coastal and Environment Division of KSCSTE is the State centre of the Environment Information System (ENVIS) instituted by the Union Ministry of Environment and Forests. The State level Basic Environmental Database of the Centre includes several modules including the following:
(i) Administrative Profile of Kerala like administrative divisions, elevation
above the sea level, tribal settlements, climate, demography, etc (ii) Infrastructure details like housing, medical and health services, transport,
etc (iii) Energy statistics
(iv) Agricultural statistics like land utilization, agricultural production, crop production, fertilizer consumption, pesticide consumption, etc
(v) Ecology data including names of bio-geographical zones, names of national parks, wild life sanctuaries, bird sanctuaries, tiger reserves, elephant reserves, biosphere’s reserves, length of coast line, botanical garden, etc
(vi) Biodiversity details of flora and fauna (vii) Air pollution statistics due to industries, vehicles, etc
(viii) Health statistics including types of diseases and number of cases reported (ix) Details of industries
(x) Details of natural resources including land degradation, waste land, types of wetlands, soil types, etc
(xi) Details of water resources including ground water resources, and (xii) Details of various types of waste, effluent treatment plants and clean
technology particulars. The data sets for ENVIS are collected from various sources and hosted in
the website. The quality of data and timeliness varies with the quality of source data.
The Department of Forest has developed a Kerala Forest Management
Information System (FMIS) containing sixteen specific modules as listed below:
(i) Personnel Information System (PIS)
(ii) Natural Forest Management System (NFS) (iii) Civil Infrastructure System (CIS)
(iv) Stores, Tools and Plants (STP) (v) Plantation Management System (PMS)
(vi) Court Case Monitoring (CCM)

58
(vii) Industrial Raw Material (IRM) (viii) Sales Management System (SMS)
(ix) Progress Report System (PRS) (x) Participatory Forest Management (PFM)
(xi) Fire Management System (FMS) (xii) Research Project System (RPM)
(xiii) Social Forestry and Nursery Management (SFNM) (xiv) Forest Development Agency Accounting (FDA)
(xv) Monthly Accounts System (MAS)
The FMIS has been developed with the assistance of the World Bank to meet the following objectives:
(i) Facilitating the flow of information with KFD units
(ii) Creating an efficient tool for strategic planning (iii) Faster and better decision making in a cost effective manner
(iv) Building up the capacity of Kerala forests & wild life, and (v) Achieving effective utilization of information technology.
The information system has been developed in four phases. In the first phase, the system requirements were studied and design & development was done in the second phase. The system was operationalised in third phase and maintenance or post implementation support was provided by the consultancy agency in the last phase. Data on all aspects of forest and plantation management are included in the system. On the whole, 534 input screens and 736 customised output reports are included in the system. All the Field Offices of the Department consisting of 5 Circle offices, 24 Divisional Offices and 86 Ranges/ Depots have been computerised and sufficient number of computers is available in all the wings of the Headquarters of the Department. As per the IT Policy of the Government of Kerala, the web portal of the Department has been migrated to Content Management Frame Work (CMF) so as to facilitate management of the content by the Department itself without the help of the developers. Despite the availability of different modules for data collection, very few are being used by the sub-offices. The services of the Statistical Assistants in the Department are thus proposed to be drafted for data collection from field Offices.
The 16 modules of database were developed in Oracle 6i using client server architecture. It does not support online transmission of data. The upgradation of Oracle is found to be prohibitively expensive. The migration of modules to FOSS as per the Government Policy has been taken up. The modules of court cases monitoring, offence information and five management modules

59
have been assigned to KELTRON for migration. The remaining modules also need to be migrated to the new software to make the data flow online through the web portal of the Department.
The sale management module of the information system contains data sets on quantity and value of major and minor forest produces consisting of the following:
Major Forest Produces Minor Forest Produces Timber in round logs Sawn and Squared timber Poles (Teak) Fire wood Charcoal Bamboo Reeds Sandal wood
Ayurvedic Herbs Spices Fibre Grass other than fodder Vegetable Oil Seeds Honey Bee Wax Parts of Medicinal Plants
The other data sets available in the system include: (i) Offences booked and charged
(ii) Civil infrastructure including buildings owned by the Department and length of roads under its control
(iii) Stores, tools and plants (iv) Data on fire incidences
(v) Various progress reports (vi) Details regarding Vana Samrakshna Samithy
(vii) Details of social forestry projects and (viii) GIS maps of thematic layers for all territorial and wild life divisions The data gaps still existing in the Forest Management System include the following: (i) Breeding grounds for endangered animals & birds (ii) Details of fire prone areas
(iii) Scientific estimates of human resource requirement for effective protection of forests and wildlife
(iv) Growing stock estimation of natural forests, plantations, bamboo and reeds
(v) Data on soil types

60
(vi) Details of civil migrants into tribal hamlets (vii) Quantity of medicinal plants taken out from forests
(viii) Intensity of cattle grazing in forests (ix) Visitors to eco-tourism centres
(x) Details of health monitoring of wild animals (xi) Stock, quantity removed and value of Non-Timber Forest Produces
(NTFPs) (xii) Data on hydrological, geological and biodiversity parameters
(xiii) Assessment of regeneration of forests (xiv) Weather data – rain, temperature, humidity, etc
(xv) Inventory of plantation – type, investment and revenue generated on each plantation
(xvi) Details of tribal land holdings (xvii) Statistics of VFs and EFLs
(xviii) Labour and employment (xix) Social forestry – availability of public land for planting, and
(xx) Unaccounted removal of NTFPs In order to bridge the data gaps and to make the information system effective and web enabled, the Department proposes to undertake the following steps as a part of the SSSP.
(i) Migration of FMIS modules to FOSS (ii) Replacement of old and out dated computers
(iii) Introducing citizen centric online services including NOC for wood based industries and elephant ownership and transportation permit, etc
(iv) Online GIS to make available GIS data (v) GIS database of VFs, EFLs and plantations
(vi) Mapping forest type and density (vii) Collection of weather data
(viii) Procurement of PDA for onsite data capture (ix) Professional assistance in computerisation and net working
3.17.1 Water Supply and Sanitation Statistics
The first form of protected water supply system in Kerala was started at Ernakulam Town in 1914. Another protected pipe water system of Trivandrum started in
61
the 1930s by the Travancore state. After formation of the present Kerala State, various urban and rural pipe water supply schemes were initiated from the 1st Five Year Plan. Kerala has adopted a Comprehensive State Water Policy in 1992.
Kerala Water Authority was established in 1st April 1984 as an autonomous body
of Government of Kerala by converting the erstwhile Public Health Engineering Department for the development and regulation of water supply and waste water collection and disposal in the State of Kerala. Design, Construction, execution, promotion, operation, maintenance and financing of schemes for the supply of water and for the collection and disposal of the water are the main responsibility of the authority.
Sanitation refers to the provision of facilities and services for the safe disposal of
human urine and faeces. Inadequate sanitation is a major cause of disease world-wide and improving sanitation is known to have a significant beneficial impact on health both in households and across communities. The word 'sanitation' also refers to the maintenance of hygienic conditions, through services such as garbage collection and wastewater disposal. Total Sanitation Campaign is a comprehensive programme to ensure sanitation facilities in rural areas with broader goal to eradicate the practice of open defecation. TSC as a part of reform principles was initiated in 1999 when Central Rural Sanitation Programme was restructured making it demand driven and people centered. It follows a principle of “low to no subsidy” where a nominal subsidy in the form of incentive is given to rural poor households for construction of toilets. The programmes of the Department of Drinking Water Supply and Sanitation under the Ministry of Rural Development, Govt. of India are being implemented through the local bodies by the Suchitwa Mission, an autonomous body under the Local Self Govt. Department of the State Government.
Recognizing the past responses in the sanitation sector and based on the current status and emerging issues in various components of sanitation, an integrated action plan has been drawn up namely ‘Malinya Mukta Keralam Action Plan’ for a comprehensive intervention. The mission has been implementing solid waste management and liquid waste programmes through local bodies. A Communication and Capacity Development Unit(CCDU) has been functioning under the Mission with the objectives to develop state specific information, education and communication strategy and provide capacity development of functionaries at all levels.
The Accelerated Rural Water Supply Programme (ARWSP) was introduced in 1972-73 by the Government of India to assist the States and Union Territories (UTs) to accelerate the pace of coverage of drinking water supply. The entire programme was given a Mission approach with the launch of the Technology Mission on Drinking Water and Related Water Management in 1986. Later in 1999 Department of Drinking Water Supply was formed to give more emphasis on Rural Water Supply programme.
The Bharat Nirman Programme is a step taken towards building up a strong Rural India by strengthening the infrastructure in six areas viz. Housing, Roads, Electrification, Communication(Telephone), Drinking Water and Irrigation, with the help of a plan to be implemented in four years, from 2005-06 to 2008-09. The primary responsibility of providing drinking water facilities in the country rests with State Governments. The efforts of State Governments are supplemented by Government of India by providing financial assistance under the Centrally Sponsored Scheme of Accelerated Rural Water

62
Supply Programme (ARWSP). The drinking water supply schemes are being implemented by Kerala Water Authority.
A mechanism of web based monitoring of water supply schemes and sanitation schemes of the Government of India through the web portal of Dept. of Drinking Water Supply and Sanitation has been in place. The database regarding Water Supply and Sanitation available with the Kerala Water Authority and Suchitwa Mission can be shared with the Dept of Economics and Statistics. The Kerala Water Authority has a web portal www.kwa.kerala.gov.in and Suchitwa Mission has www.sanitation.kerala.gov.in. These portals may be linked to the Department’s website for data sharing. 3.18 Participation in National Sample Surveys
Kerala has been participating in the National Sample Surveys (NSS) from the very beginning with matching samples for supplementing the Central Sample data to derive reliable state specific and sub-state level estimates of various socio-economic variables. Since 62nd Round (July 2005 – June 2006) onwards Kerala started participating with 50% additional samples. The primary objective of enhancing the sample size was to derive sub-state level estimates with more reliability. The survey schedules, concepts, definitions, etc. are provided by the National Sample Survey Organisation (NSSO). Though the State has been participating in the surveys regularly, it could not progress much in the tabulation and publication of results due to a number of reasons. The current status of tabulation is given in Table 3.1. The objective of pooling the central and state sample data and deriving reliable District and Sub-District level estimates has remained elusive till now due to delays in the tabulation of state sample data. It has also not been able to create and maintain a databank of socio-economic characteristics of population of Kerala. Lack of manpower resources, tabulation resources and training are the main reasons for the current status of affairs.
Manpower planning, infrastructure augmentation and training of staff for ensuring timely conduct and tabulation of State sample data were weak for many years. The technical staff available at the headquarters till recently for NSS work consisted of one Assistant Director, one Research Officer, two Scrutiny Officers, one Research Assistant and two Statistical Assistants under an Additional Director. The total field staff for NSS work is 33 Investigators.
Table 3.1: Progress of Tabulation of NSS State Sample Data
Round Subject Status Sample Size
60 Jan 2004 to June 2004
Morbidity and Health Care Consumer Expenditure Employment-Unemployment
Report Published 300
61 July 2004 to
Consumer Expenditure Employment-Unemployment
Data Entry completed 560

63
June 2005
62
July 2005 to June 2006
Unorganized Manufacturing Consumer Expenditure Employment-Unemployment
Report on consumer Expenditure Completed
Others under preparation 564
63
July 2006 to June 2007
Unorganized Services Consumer Expenditure Data Entry Completed 947
64 July 2007 to June 2008
Participation and Expenditure in Education Consumer Expenditure Employment-Unemployment & Migration
Data Entry Completed (Used software developed by DPD of NSSO.)
552
65
July 2008 to June 2009
Domestic Tourism Housing Condition and Urban Slums
Data Entry Started (Used software developed by DPD of NSSO.)
780
66
July 2009 to June 2010
Consumer Expenditure Employment-Unemployment Scrutiny Completed
Data entry started 840
67
July 2010 to June 2011
Unincorporated Non-Agricultural Enterprises Field Work in Progress 960
It cannot be expected that an Investigator will be able to survey more than two samples per month if he follows the procedures of data collection sincerely. Thus 33 Investigators can survey at the most 66 samples per month or 792 samples per year. It assumes that all the Investigators are available through out the year without any holiday or leave. It, however, doesn’t happen and atleast a few Investigators have to be kept as leave and training reserve. Thus, effectively, there can only be 30 Investigators for field survey at any point of time. In that case, the total number of samples which can be surveyed in a year is only 720. The DES has, however, taken up the survey of 960 samples during 67th Round while the actual capacity is only 720 samples. Even otherwise, in the 67th Round the work load is very heavy as the number of sample enterprises to be surveyed in each sample village/urban block is fairly high. In fact, the NSSO itself has resorted to recruitment of additional field staff and supervisors. The DES has to make plans and arrangements for the scrutiny, coding, data entry and validation of data sets in time. DES will able to get the surveys conducted properly, tabulate them in time and undertake pooling only if adequate number of technically qualified persons are inducted into the activity, which is now being attempted.
64
3.19 Transport Statistics
The Department of Motor Vehicles has been collecting statistics of road transport relating to road safety, services and tax collection through its field offices consisting of 4 Zonal Offices, 18 Regional Transport Offices, 42 Sub Regional Transport Offices and 19 Border Check Posts. The Department took up computerization of its operations and a system for online transmission of data. About 45 RTOs and Sub-RTOs have already been provided facilities for online data transmission and the system is presently in the final stages of stabilization. Details of number of vehicles registered, permits issued to passenger and good transport vehicles, driving licenses issued, and tax collections, etc have already been computerised. The Department is also planning to introduce e-filing of quarterly returns of income, expenditure, passenger data, etc by the transport operators in the State. Unstable network connection is the problem being faced by the Department at present. Though the road transport statistics could be improved with the completion of computerisation and on-line filing of returns, the statistics of road infrastructure is likely to continue as a major data gap. The Road Wing of the PWD took up a project to enlist the roads and create a Road Information System of roads with World Bank assistance. Though the initial work under the project has been completed, it has not been followed up and converted into a usable database. It is necessary to establish a Road Maintenance Management System and a supporting Road Information System (RIS). The RIS must contain data relating to:
Unique road identification system, coding or numbering system,
Jurisdiction information
Road register
Road condition for segments
Bridge Register
Bridge condition details
Culvert Register
Culvert condition details
Financial and budget information
Road traffic data
Traffic forecasting
Integration with GIS The Road Wing of the PWD has to take initiatives to establish the RIS

65
3.20 Statistics for Local Level Planning Kerala is one of the pioneering states in decentralised planning as it started
with the enactment of “Kerala Panchayat Act, 1960” in January 1962. In 1966, a land mark decision was taken to devolve 35-40 percent of the Plan funds to local Governments under the Peoples Plan Campaign (PPC). The basic philosophy of the process is that the planning exercise should address the felt needs and aspirations of the local community. The exercise starts from each Panchayat ward with the assistance of Working Groups and the development projects thus identified in each Ward are scrutinised, consolidated and approved by the Panchayat and sent to District Panchayat. The District Planning Centre at the District Panchayat considers all the project proposals received from the Grama Panchayats, Block Panchayats and the District Panchayat consolidates them and provides the final approval. While the process is truly democratic, the identification of projects and the final approval by the DPCs are generally based on personal experiences and/or local perceptions as well as budget availability rather than based on any objective comparative analysis of local conditions, resource assessments and critical development issues due to lack of reliable statistical data base. Though there have been different experiments in the past both by the Central and State Government to develop a system for compiling local level statistics to facilitate local level planning, a regular system is yet to be evolved. The exercises undertaken in Kerala in the recent past include the following: (i) Pilot studies in Kollam and Wayanad districts for collecting “Basic
Statistics for Local Level Development (BSLLD) in formats developed by a High Level Committee set up by the Ministry of Statistics and Programme Implementation in 2002.
(ii) A second pilot study in the same districts to test the revised procedures and formats finalised by the Committee on the basis of the findings of the first pilot study.
(iii) Collection of Panchayat level data by the DES in the year 1996, 2001 and 2006 for all the districts of the State.
(iv) Malappattam Panchayat exercise for local level database creation and formulation of development plans and programmes based on the database.
In the first three exercises listed above, the attempt was largely to compile secondary data from various sources existing at the District, Block and Grama Panchayat levels. Malappattam experiment was quite different and the focus was mainly on primary data collection on variables considered important for identification and prioritisation of projects for the development of the Panchayat. The Panchayat itself was chosen on considerations of size, existence of definite boundaries, and the dedication and keen interest taken by the Panchayat President. The data collection work was undertaken on a mission mode after dividing each ward into well identifiable areas with definite boundaries. In other words, some kind of Rural Frame Survey (RFS) was first conducted and data collection work

66
in each of the areas so formed was assigned to different volunteers. It is understood that about 96 areas were formed and data collection work in each area was assigned to a separate volunteer. The survey covered details of infrastructure, agricultural activities and household particulars. The periodical updation of data collected through such an exercise may involve repetition of the same process again and again. Its replicability in other Panchayats may depend on the ability to simulate the conditions under which the Malappattam exercise was undertaken. In any case, a documentation of benefits derived by Malappattam Panchayat on the basis of the database created by it has to be undertaken for demonstration to other Panchayats. Based on the experiences of the pilot studies conducted in a few States and the recommendations of the sub-groups, the “Committee on Basic Statistics for Local Level Development” made a number of recommendations which included the following:
(i) The Gram Panchayat should consolidate, maintain and own village level data
(ii) The village level information may be collected uniformly by using specified village schedules
(iii) There will be periodic data sets which may be collected once in a year. Some data sets will be dynamic in nature and may be collected every month.
(iv) The District Census Handbook contains almost all basic indicators at village level, which can be used for local level planning. The State Governments have to update the census information on annual basis so that year wise information on all the basic parameters of village is available for local level planning
(v) State Directorates of Economics and Statistics in respective states should play an important role in ensuring statistical quality and standards by providing the necessary guidelines and training to Panchayat staff in the consolidation and maintenance of state level statistics.
The report of the Committee for ‘Evaluation of Decentralised Planning
and Development” set up by the Government of Kerala also contain a large number of recommendations (relevant extract appended as III) including a list of items on which data need to be collected and maintained on a regular basis. The list is more comprehensive than the items suggested by the Expert Committee.
In all the exercises, except the Malappattam experiment, the views and requirements of Panchayats themselves have not been obtained. In other words, the democratic institutions of the Panchayats and Municipalities have not been consulted in identifying their data needs and steps to be taken to collect such data sets.
A large amount of data sets are generated in the Panchayats and the institutions transferred to its control like the primary schools, Sub-Centres and Primary Health Centres, ICDS workers, Village Extension Officers, LSGD Public

67
Works Engineers, etc. In addition, agencies like milk societies, neighbour hood groups (Self Help Groups), lead banks; co-operative banks, etc. also generate data sets on their operations. However, several data sets are not being consolidated and reported. In other cases, the reporting mechanisms are vertical in nature and only to the concerned line Department. As a result, the local level institutions are not in a position to take advantage of the data sets for local level planning. In certain other cases, the data sets are entered in the computers but transmitted as printed documents leading to repeated data entry of the same data. The data sets presently being captured and transmitted on-line are details of births and deaths through ‘Sevana’ package and monitoring of local body planning for government grants and expenditures through ‘Sulekha’ package. The IKM has also developed a number of other packages like ‘Soochika’ – a office management system, ‘Sanchaya’-a revenue management system, ‘Saphalya’-an employment information system, ‘Saankhya,’ ‘Sahata’, and ‘Sugama’- accounts management, revenue collection, receipts, purchase and works administration packages, and ‘Susthira’, ‘Subhadra’,and ‘Sadhuta’- financial management packages including budgeting and audit. IKM helps the Panchayats in the implementation of the packages based on specific project proposals received from the concerned Panchayats. The IKM has also posted Technical Assistants in all the Block Panchayats, Municipalities and Corporations to assist the local bodies in their computerisation efforts.
Although, population census, agricultural census, economic census, etc
cover the entire State, the data generated through these exercises are not available by the jurisdictions of the local bodies.
There are also data gaps of land use, cropped area, maps of rural road net
work, data on mobility of residents, etc. The statistics available for assessment of level of well-being of different regions in a district are also limited. Building the data sets required for local level planning is thus a challenge.
3.21 Gender Statistics Gender is a culturally based concept that defines womanhood and
manhood by social perceptions whereas sex is a biologically based concept that defines male and female by genetic composition. Gender issues generally refer to concerns by society, or particular groups within society, about specific differences in the lives or well being of women and men. Current gender issues cut across a wide range of subjects including poverty, work, education, health, violence, economic resources, rural development, families, migration, decision making and institutional arrangements.
Gender statistics provide data on women and men across a wide range of
topics. They show the different circumstances in which women and men live and how their individual well being has changed over time. These statistics are vital for analysing and addressing gender issues in society and for monitoring the achievements of national and international goals and policies. Integrating a gender

68
perceptive into mainstream statistical activity has benefits for both gender statistics and over all statistical system. Gender statistics are not merely sex disaggregated data. The concept of engendering statistics differs from conventional approach to gender statistics in the following ways:
(i) It is realised that merely disaggregating data by sex is insufficient and
requires thorough review of data collection framework and process from gender perspective
(ii) A systematic and comprehensive approach should be used to identify gender issues and provide data that genuinely addresses women’s needs.
The requirement of an engendered statistical system consists of a number of specific activities as listed below: (i) All statistics on individuals should be collected, collated and presented by
sex disaggregates,
(ii) All variables and characteristics should be presented with sex as a primary and over all classification,
(iii) Specific efforts should be made to identify gender issues and provide data that addresses these issues
(iv) Concepts and definitions formulated for data collection should adequately reflect the diversity of women and men and capture all aspects of their life, and
(v) Data collection methods should be developed by taking into account stereotypes and social and cultural factors that might produce gender issues.
While the State Statistical System, by and large, meets the first two activities listed above, its role in meeting the next three activities has been limited. The DES has to take steps to engender its statistical activities by taking up surveys on specific gender issues including time use surveys, with the help of experts/professional agencies in view of limited resources and expertise available with the DES.
3.22 Unorganized Sector Statistics The significance of household enterprises in the economy of the country
was well recognised in independent India. The sector was, therefore, given importance in the development planning and the concept of self-sufficient villages was given emphasis in various policy prescriptions which led to the emergence of household enterprises through out the country. These enterprises taken together came to be recognised as “unorganised sector” in India. However, there has not been any single definition of unorganised sector and different organizations have been using varying definitions as per their specific requirements. In the international context, the sector is known as “Informal Sector”. The other related

69
concept is “Informal Worker”. The ‘National Commission for Enterprises in the Unorganized Sector (NCEUS)’ set up by the Government of India in September 2004, considered various definitions and provided harmonised definitions consistent with international definitions. These are:
(i) The informal sector consists of all unincorporated private enterprises owned by individuals or households engaged in the sale and production of goods and services operated on a proprietary or partnership basis and with less than ten total workers.
(ii) Informal workers consist of those working in the informal sector or households, excluding regular workers with social security benefits provided by the employers and the workers in the formal sector without any employment and social security benefits provided by the employees.
The NCEUS estimated the volume of employment in the Informal Sector and their contribution to national economy by re-tabulating the unit level data sets of (i) Employment – Unemployment Surveys, (ii) Unorganised manufacturing sector surveys, and (iii) Unorganized services sector surveys of National Sample Survey Organization. All the relevant statistics of informal sector and informal workers were computed from the data sets of these surveys. State wise estimates have been included in the “Report on Definitional and Statistical Issues Relating to Informal Economy” DES has not been able to tabulate the state sample data sets of the recent surveys on the above subjects and thus not in a position to prepare pooled estimates. DES should expedite tabulation of the above survey data sets and commission a study to get district wise estimates of informal sector by pooling Central and State sample data sets if feasible.
3.23 Poverty Statistics The concept of poverty encompasses material, social and political
deprivations of different kinds with varying levels of severerity. The measurement of poverty is, therefore, a complex issue and a number of approaches and methods are being employed for assessing various aspects of poverty. The poverty line approach, deprivation indicators and a combination of both of them are the three basic approaches presently being followed in different countries. In the poverty line approach, the poverty lines can be absolute, relative or subjective. As per this approach, a household is classified as poor, if its income or consumption expenditure is less than a given threshold value or poverty line, which represents the aggregate of all goods and services considered necessary to satisfy the basic needs of the households.
In India, Planning Commission has been estimating state wise poverty ratios separately for rural and urban areas and for both rural and urban areas taken together based on the results of quinquennial consumer expenditure surveys under taken by the National Sample Survey Organization (NSSO). Fixed poverty lines

70
determined on the basis of per capita per day calorie norms of 2400 K calories for rural areas and 2100 K calories for urban areas and adjusted for price charges in each state were used for the computation of absolute poverty ratios till 2004-05. The methodology has now been revised by a Committee set up by the Planning Commission in December 2005. The main changes in the new methodology as compared to the earlier one are the following:
(i) The calorie anchor in determining the poverty line has been avoided
(ii) No discrimination is made between rural and urban populations in determining the poverty lines except for the price variations, and
(iii) A price adjustment procedure predominantly based on the same data set that underlies the poverty estimate is used to adjust price changes
There have been criticism about the new methodology because of certain limitations and therefore, these are to be addressed adequately both by centre and state in future surveys. An exercise being undertaken by the State Governments periodically is the BPL survey. It is primarily an administrative exercise to identify those eligible for receiving assistance under various Government schemes for poverty eradication. Though statistical data are used for the identification of beneficiaries, it is by no means a statistical exercise but an administrative procedure. The poverty estimates of Planning Commission will not provide any insight into the real situation prevailing in different districts of the State. The DES may, therefore, commission a study to evolve a methodology for estimating district wise poverty ratios in a realistic manner based on consumer expenditure surveys.
3.24 Services Sector Statistics
It is a general phenomenon that the contribution of services sector to the national economy has been growing at a faster rate than that of agriculture and manufacturing sectors. The phenomenon has been more dynamic in Kerala and the share of services sector SGDP grew from 50% in 1999-2000 to 54% in 2006-07. However, statistical information on services sector is weak both at the national level and at the Sate level. The sources of data at the national level are annual balance sheets of listed companies in the service sector and periodic surveys being undertaken by the National Sample Survey Organisation (NSSO) on unorganised service sector. In general, lists of services sector establishments are not available, and as such there are no list based surveys like Annual Survey of Industries. The improvement of services sector statistics would, therefore, involve creation and maintenance of lists of services sector establishments, undertaking annual surveys of such establishments and expediting the tabulation of unorganised services sector surveys. It will be possible to create the lists of large establishments in the sector from the data base of the Labour Commissioner as

71
and when the computerisation and on-line registration of service establishments become a reality. The DES can establish a Business Register and mount a survey programme for the collection of minimum set of data like total output, employment and capital formation.
3.25 Banking Statistics
A large number of institutions are engaged in the implementation of credit to farm and non-farm enterprises in the State while the overall regulation of the monetary policy is in the hands of the Reserve Bank of India. Thus banking statistics in the country are compiled by the Reserve Bank of India. The different classes of institutions providing banking services include (i) Commercial banks, (ii) State Financial Corporations, (iii) Regional Rural Banks, (iv) Cooperative Banks, (v) Small Industries Development Bank of India, and (vi ) National Bank for Agricultural and Rural Development (NABARD). In Kerala, there are 46 Commercial Banks and 2 Regional Rural Banks with 4310 branches and 659 branches of 14 District Co-operative Banks. The main sources of banking statistics at the national level include documents published by the Reserve Bank of India (RBI), documents of NABARD, Economic Survey and Basic Statistics relating to Indian Economy published by the Ministry of Finance. At the State level, the sources of data are Economic Review, NABARD documents and SLBC reports. Data relating to Co-operative Banks are being compiled and published by the Registrar of Co-operatives.
National level banking statistics publications contain mainly the
aggregates. These data sets are also not properly linked with the five year plans. State level data are also not linked with the state level economic indicators like SGDP and State Plans. SLBC reports are prepared on the basis of district credit plans and Panchayat level data sets are not available. While the targets of credit disbursements are reflected in the SLBC reports, achievements at the local level are not indicated in any of the reports.
3.26 Human Development Statistics
Human Development is defined as a process of enlarging people’s choices as well as raising their level of well being. Though these choices can be infinite and vary over time and space, the Human Development Reports identify (i) the choice to lead a long and healthy life; (ii) the choice to acquire knowledge and be educated, and (iii) to have access to resources needed for a decent level of living as the most critical and valuable choices. The measurement of these dimensions is made in terms of certain specific indicators which are contextually relevant and reflect the prevailing social values. By using these indicators, a composite index namely Human Development Index (HDI) is computed. The other composite indices are Human Poverty Index (HPI) which captures the state of the deprived in the society and the Gender Equality Index (GEI), which captures the gender dimension of the human development.

72
There can be any number of indicators covering the dimension of longevity, educational attainment and economic attainment and they can be combined into the core composite indices of HDI, HPI, and GEI. The National Human Development Report (NHDR) prepared by the Planning Commission, however, used the following indicators for the construction of the above composite indicators.
Attainment Indicators
Longevity Life expectancy at the age of one and Infant Mortality Rate
Educational Attainment Literacy rate of those aged 7 and above and intensity of formal education
Economic Attainment Per capita real consumption expenditure adjusted for inequality and Worker Population Ratio in the case of Gender Equality Index
While the National Human Development Report of the Planning
Commission provide a methodology for comparing human development outcomes of different States, the same methodology with necessary modifications can be used for preparing human development reports at the State or Sub-state levels to compare the levels of living of smaller geographical areas, if the relevant indicators can be compiled for each of those areas.
The State Planning Board published the first Kerala HDR in the year
2006. A project on strengthening State Plans for Human Development (SSPHD) in Kerala was initiated in 2006 with the support of the Planning Commission and the UNDP and it was completed in 2009. The major objective of the project was to build and strengthen capacity of the State Government Officials to provide human development perspective in State Plan and identify specific policy options for achieving human development goals. Preparation of district and Panchayat human development reports, completion of four research projects on human development related areas and strengthening of statistical system were the key activities undertaken under the project. The thematic reports of Tribal HDR and fisher folk HDR in Kerala were also prepared in this project.
The above exercises brought to the fore the requirements of reliable data
on various human development parameters at the district and lower levels of administration and development planning. The experience gained from these initiatives should be documented and used for future benefit.
3.27. Statistics of Non-Resident Keralites (NRKs) Kerala has the distinction of being a major manpower supplier through out
the globe including a number of Indian cities. They have been making significant
73
contributions to the State by way of remittances and transfers. According to a Migration Monitoring Study (MMS) conducted by the Centre for Development Studies (CDS) in the year 2008, the remittances of overseas Keralites during the year was equivalent to about 31 percent of the Net State Domestic Product (NSDP). It has been increasing over the years as it was equivalent only to 25 percent in 1998. The remittances of overseas Keralites thus continue to be a significant factor even in the greatly improved economic scenario of Kerala.
Though large scale migration of Keralites to other states and to foreign
countries has significant economic effect, it also has a number of social and economic issues. These include (i) social security and welfare of emigrant workers, (ii) exploitation of overseas employers and recruiting agents, (iii) security and social issues of their families staying in Kerala, (iv) rehabilitation of returning emigrants and their social security, (v) repatriation of emigrants on emergent situations, etc. In order to assess the dimensions of such issues, it is necessary to have realistic estimates of number of non-resident Keralites in different countries. It is also necessary to assess their profiles apart from estimating their contributions to the economy of the State for (i) planning welfare schemes for non-resident Keralites and returnees, (ii) developing training programmes and self-employment opportunities for the returnees, (iii) formulating schemes for the social security of themselves and family members, etc. The specific data sets required in this context are the following:
(i) Number of non-resident Keralites in different States/ Countries and their
demographic profiles including age, sex, general and technical qualifications, practical experiences, etc
(ii) Employment and economic status (iii) Number and profiles of returnees including their present economic status
(iv) Details of NRKs in jails of other countries (v) Details of remittances received by their families in Kerala
The sources of data on NRKs are the cards issued by the Norka Roots while arranging overseas employment, registrations with the Non-Resident Keralites Welfare Fund, Indian Embassies in other countries and periodic surveys being undertaken by the CDS. The first survey was conducted in the year 1998 and it was followed by surveys in 2003, 2007 and 2008. These surveys are now known as Migration Monitoring Surveys (MMS) Kerala. These surveys cover basically the overseas migrants. While the data sets available from administrative sources are incomplete, the CDS surveys are essentially academic in nature and have not become a part of official statistics. The DES is now planning to undertake a survey of NRKs. There are, however, certain issues to be settled while undertaking a sample survey for assessing the magnitude, profiles and economic contributions of NRKs. These are listed below:
74
3.27.1. Definitional Issues There has to be a working definition of non-resident Keralites for
undertaking any survey. The two definitions in the Indian context relate to Non-Resident Indians and Persons of Indian Origin (PIO). An Indian citizen who stays abroad for employment/ carrying on business or vacation outside India or stays aboard under circumstances indicating an intention for an uncertain duration of stay abroad is a Non-Resident Indian. It implies he/she will be holding an Indian Passport and has not taken citizenship of other countries.
A “Person of Indian Origin (PIO)” is a citizen of any other country but
whose ancestors were Indian nationals at least four generations away. The definition includes any one:
(i) Who ever held an Indian Passport
(ii) Whose ancestors upto the last four generations were settled in India and did not migrate to Pakistan or Bangladesh
(iii) Whose spouse is a citizen of India or a person of Indian origin In the context of non-resident Keralites, however, there are no such clear definitions. The Non-Resident Keralites Welfare Fund recognises two types of NRKs for registration under the scheme as indicated below: Every Non-Resident Keralite of 18-55 years of age is entitled to register his name as a member of the Fund. A non-resident Keralite (India) above 18 years of age who has left Kerala for employment or otherwise and resides for more than 6 months in a place in India outside Kerala and continues there can register as a member. A non-resident Keralite (abroad) can register his name immediately on obtaining the emigration clearance and before leaving the Sate. Non-Resident Keralites who left Kerala prior to the commencement of the Act and the Welfare scheme implemented under it can register their names to the Fund within a period prescribed by the Scheme. A Non-Resident Keralite (India) who has returned to Kerala leaving his/her employment or residence outside Kerala and resides permanently within Kerala can continue as deemed member to the Fund on continuous payment of contribution to the Fund until the attainment of age 60. The MMS used the term “emigrants” to denote those who have migrated out of India and “out-migrants” to denote those migrated to other States in India. They were identified through the following screening questions to the households selected for the survey:
(i) Has any member of this household, who is now a usual member of this household ever lived outside Kerala for a year or more?

75
(ii) Has any member of this household who is a usual member of this household ever lived outside Kerala for periods of less than one year for the purpose of studies or in search of job?
(iii) Has any person who was a usual resident of this household migrated out of Kerala and is still living outside Kerala?
(iv) Place of residence outside Kerala in all the above cases (within India or outside India)
The above questions are essentially capable of identifying only the first generation migrants as they have to be usual members of the surveyed households at some point of time.
3.27.2. Issues of Units of Survey
The unit of survey is the person from whom the data are collected. In the case of a household survey, the information has to be collected from proxy informants available in the surveyed households in respect of those still staying outside Kerala. The data thus collected need not reflect the real situation. The survey of NRKs directly may not be feasible unless they can be contacted through email or post. It will involve a two stage operation. In the first stage, a list of non-resident migrants has to be prepared through household surveys or otherwise and then undertake a questionnaire survey by post or email. The response rates in post surveys are, however, normally low.

76
Chapter 4 The Vision, Strategic Goals and Strategies
A major weakness of the statistical system of Kerala has been the absence
of a clear vision and the related mission. As a consequence, there has not been any core work programme or activity schedule leading to adhoc decisions on statistical priorities. It is thus important to correct the deficiency with a well defined vision and strategies to achieve the vision.
4.1 The Vision
The vision of the State is to equip the statistical system for timely dissemination of adequate, reliable and credible statistics on economic, social and environmental aspects at all the required levels of disaggregation within its decentralised structure so as to enable objective decision making within and outside the Government, stimulate research and promote informed debate on all aspects affecting the life of people.
4.2 Strategic Goals
The strategy for achieving the above vision is a well designed and multilayered business plan consisting of the following strategic goals (SUCCESS). Sustained improvement of adequacy, relevance, reliability and timeliness
of official statistics Up scaling of data dissemination system
Computer and communication technology integration Creating positive public image of official statistics
Engendering statistical system Statistical capacity building at all levels, and
Statistical product enhancement 4.3 General Strategies and Action Plans
The general strategies and action plans considered essential for meeting the above strategic goals are described below:
4.3.1 Sustained Improvement of Official Statistics
Review of the statistical system in terms of adequacy, relevance, reliability and timeliness and incorporating suitable changes at periodical intervals based on existing and emerging requirements has to become an integral part of the system. The specific strategies in this regard are:

77
Constitute a State Statistical Commission to lay down standards, methodologies, priorities and work programmes,
Set up Technical Advisory Committee as well as subject specific Expert Committees to evolve appropriate methodologies and procedures for specific statistical activities,
Introduce a system of regular user consultations to assess emerging data needs and deficiencies in the existing data sets,
Strengthen statistical co-ordination with all the line Departments and Central Government agencies by elevating the status of the DES as the State nodal agency for improving the statistical system of the State.
Integrate manpower planning as a part of statistical operations planning, and
Create the necessary physical and statistical infrastructure in all the
statistical offices.
Consistency and Completeness check of the quality of the data collected under various departments.
Establish a Research & Analysis Wing (RAW) to conduct various studies and communicate the policy relevance to the policy makers from time to time; and bring out a policy brief when the new data is available for effective policy making and interventions.
4.3.2 Up-Scaling Data Dissemination System The DES is presently not having a Data Dissemination Policy, even though the Central Government has already notified such a policy way back in 1999.The up-scaling of data dissemination system of DES would, therefore, involve the following strategies / actions: Prepare and notify a Data Dissemination Policy in line with the policy of
the Central Government. Establish the necessary infrastructure including a data warehouse for on-
line dissemination of statistical data along with the relevant meta data.
4.3.3 Computer and Communication Technology Integration
Kerala has achieved considerable progress in computerising the activities of a number of Departments and Organisations while some of them are in the process of completing computerisation. It is, therefore, an opportunity for the DES to leverage the ICT technology for strengthening the statistical system .The strategy consists of:
78
Upgrade the computing facilities consisting of both the hard ware and soft ware at the headquarters, District Offices and the Taluk Statistical Offices of the DES,
Provide computers to all the officers and staff of DES, and Establish web enabled on-line data sharing between the DES and each of the
line Departments.
Up-gradation of computer skills by imparting training to the existing employees for efficient computer use.
4.3.4 Creating Positive Public Image of Official Statistics The creation of positive public image of official statistics greatly depends
on a number of factors including the appreciation of its importance as a strategic resource for planning, decision making, monitoring and evaluation as well as public perception about its credibility, reliability and timeliness. The strategies required for improving the public image and utility of official statistics, therefore, are: (i) Launch well planned and effective advocacy campaigns targeting policy
makers, planners, data producers including those within the DES, data users and civil society institutions,
(ii) Create public awareness about statistical operations and importance of their co-operation and data sharing, through Documentary Films, TV / Newspaper Ads. etc.: and
(iii) Re-orient and reform the statistical activities in line with the ‘Fundamental Principles of Official Statistics’ laid down by the UN Statistical Commission as listed below:
Compile and make available on an impartial basis official statistics
that meet the test of practical utility to honour citizen’s entitlement to public information.
Present statistical information according to scientific standards on the sources, methods and procedures of the statistics.
Provide comments on erroneous interpretation and misuse of statistics Choose the sources of official statistics with regard to quality ,
timeliness, costs and the burden on respondents Treat the individual data collected by statistical agencies strictly
confidential and use exclusively for statistical purposes Make public the laws, regulations and measures under which the
statistical systems operates Achieve consistency and efficiency in the statistical system through
co-ordination among statistical agencies

79
Use internationally accepted concepts, classifications and methods in the compilation and processing of statistical data, and
Encourage bilateral and multilateral co-operation in statistics to improve official statistics.
4.3.5 Engendering Official Statistics
The statistical system should be able to capture gender issues both in terms of gender disaggregation of all available data sets and adopt specific gender sensitive procedures and special schemes for data collection. The strategy therefore will be to examine the statistical activities of the DES from a gender perspective and incorporate the necessary changes in the statistical plans. It will involve revision of data collection instruments and methodologies.
4.3.6 Statistical Capacity Building
Statistical capacity building is the key to make the statistical system to deliver what it is expected to perform. It is, however, a complex management task. It involves policy decisions on recruitment, training, performance assessment; performance based incentives and well established personnel management system. There has to be a system of placing the right persons at right jobs. The multiplicity of designations of posts carrying the same pay structures within the Department makes the personnel management system fairly difficult and needs to be rationalised. The Department has functions requiring specialised knowledge of both economics and statistics. But, there is no such classification of posts by functions and posting of persons accordingly. In other words, there is no system of placing the right persons at right jobs and their performance monitoring. It is, thus, necessary to have a total revamp of the personnel management system of the Department, if the DES has to become a useful institution for the Government and the society. The strategies required for introducing any improvement in the statistical system, therefore, include the following:
Define the functional responsibilities of each of the posts in the Department and identify training required for persons occupying those posts,
Introduce cadre structure without tilting the present staff structure. Lay down performance assessment procedures and introduce performance
based incentives in service conditions Assess the training needs of each of the functionaries and put them under
appropriate training programmes by creating additional posts of training reserve at each level,
Establish a training institute for providing induction training as well as in-service training at periodic intervals,
Establish computerised personnel management system in the Department.

80
Assess the job profiles, knowledge and skill requirements and quantum of work of officers and staff of the DES in the Department and line Departments and re-deploy them as per requirements. The additional posts required for taking up new activities may have to be taken up after re-deployment.
4.3.7 Statistical Product Enhancement Statistical product enhancement is required for meeting the challenges of
emerging data needs for planning, monitoring, evaluation including outcome and impact assessment. These can take the shape of new data requirements, additional statistical classifications, new applications and derived statistics, use of scientific analytical tools, reduced time horizon, etc. Some of these include the requirements of local level statistics, gender statistics, poverty statistics, service sector statistics, etc. Such statistical product enhancement requires meticulous planning and deployment of staff which are often difficult to achieve. The strategy, therefore, has to be to empower the DES with adequate manpower and material resources to undertake such enhancements. It is also equally important to strengthen the physical and statistical infrastructure of the DES and all its field offices. In particular, the following strategies/ actions are proposed: Restructure the DES as a Technical Department by elevating the Director of
Economics and Statistics to the level of Special Secretary and designated as Director General as recommended by the National Statistical Commission. The Director General will be the administrative and technical head. The Director General may be left with policy and technical issues so that he is fully available for statistical co-ordination, technical consultation and standard setting.
Create the posts of Director, Survey Design Research & Training (SDRT) and Director, Statistics for Decentralised Planning (SDP). The survey design and field operations can be vested with Director, Survey Design Research & Training (SDRT) in addition to the responsibility of managing the Training Institute and all other technical matters may be vested with Director, Statistics for Decentralised Planning (SDP).
Introduce greater delegation of administrative and financial powers to one of the Additional Directors so that the Director General and the Directors are relieved of routine administrative functions to make them devote more time on technical matters.
The posts of the Director General and the Directors shall be filled up on merit-cum seniority basis from the posts of Director and Additional Directors
Create and maintain statistical frames for conducting list based regular surveys.
4.4 Strategies and Action Plans with respect to Identified Key Areas While the general strategies and action pans are applicable to all sectors of
statistical activities, there are specific strategies and action plans for improving

81
the quality of statistics of each of the identified key areas. These are listed in the following paragraphs:
4.4.1 State Domestic Product Estimates As listed in the earlier chapter, there are several deficiencies in the
estimation of State Domestic Product. In effect, recent data sets are available only for the agricultural sector at present. In order to make the SGDP and SNDP estimates reliable and credible, there has to be regular survey of manufacturing and service establishments, apart from updating the old rates and ratios used for the compilation. The following strategies/ actions are therefore proposed:
(i) Expedite the tabulation of state sample data relating to various socio-economic surveys, particularly those relating to employment- unemployment, unorganised manufacturing and unorganised services and use them for the estimation of SDP,
(ii) Examine the feasibility of pooling the Central and State data sets and derive more reliable estimates at the State level and valid estimates at the district level,
(iii) Create Business Registers of manufacturing units and service industries based on online registration systems of the Department of Industries, the Office of the Labour Commissioner and other Departments,
(iv) Launch list based surveys of both manufacturing establishments and service industries with the help of the concerned Administrative Departments,
(v) Revise rates and ratios used for the compilation of State Income estimates.
(vi) Various data sources available for the computation of SDP and revise the methodologies, if found necessary may be examined by a subject specific expert committee and by the Technical Advisory Committee. The operational details of the above listed strategies need to be finalised by the Technical Advisory Committee.
(vii) A Research study may be undertaken to examine the feasibility of adopting the framework of SDP Calculation based on Income accruing method as against Income originating method as there are several conceptual issues involved in this matter. This may be considered by the above committees.
4.4.2 Capital Formation and Savings
Reliable estimates of capital formation are not available even for the public sector in the State. The situation needs to be changed. It should start compiling estimates of gross capital formation in the public sector based on the analysis of budget documents. The private sector should be added as and when surveys based on business register are launched. The methodologies on this also

82
may be examined by the subject specific expert committee and Technical Advisory Committee.
4.4.3 District Domestic Product This again is a grey area and the strategies and actions listed under 4.4.1
are equally applicable in computing estimates of District Domestic Product. 4.4.4 Estimates of the Contribution of Local Bodies
The computerisation of accounting system of Panchayats is essentially the strategy for obtaining the estimates of the contribution of local bodies in a realistic manner. It will also facilitate in the computation of Capital Formation in the public sector by including the capital formation of local bodies.
4.4.5 Data on Major Fiscal Variable There is already a fool proof system existing for the compilation of data
on major fiscal variables. The system has to be continued effectively. 4.4.6 Annual Survey of Industries The State is not participating in the Annual Survey of Industries and as
such it has to depend on the processed data sets provided by the CSO which are available with considerable time lag. The situation is not likely to change even if the State Government starts participating in the ASI as the data collection and tabulation are likely to take considerable time. The strategy, therefore, is to request the CSO to expedite tabulation and provide the processed data without much loss of time. The DES also need to start list based surveys of manufacturing and service establishments based on business register for collecting minimum set of data.
4.4.7 Index of Industrial Production
The DES needs to take up the compilation of Index of Industrial Production on a priority basis. The services of statistical staff posted in the District Industries Centres need to be utilised for the collection of production data on a regular basis.
4.4.8 Crop Area and Production Estimates
The agricultural statistical system is fraught with several deficiencies as indicated in the previous chapter. There are problems from sampling frames to identification of survey numbers in the field. There are also estimation problems due to defective sampling frame. It is, therefore, necessary to have a fresh look at the entire agricultural statistics scheme. The possible alternatives are the following:
83
(i) Prepare an up-to-date frame of survey numbers of dry and wet lands by
field verification and correct the details contained in the Basic Tax Register. Use the updated frame for sample selection and area enumeration,
(ii) Use the existing frame with out dry and wet land classification and use post stratification technique for the estimation of area under different crops,
(iii) Change the unit of sampling from survey numbers to households. It will have the advantage of easy identification of operational holdings and collection of better data on area under cultivation or counting of number of trees. It will also facilitate easy conduct of crop cutting experiments. It would be, however, necessary to list the operational holdings of each household along with the survey numbers involved to generate the sampling frame. It will also be necessary to tally the total area in the Panchayats with household information and survey number data. It will be an exercise once in about five years and the same households once selected can be retained for surveying each year by adopting panel survey technique. It will have the advantage of measuring changes over time easily, or
(iv) The fourth option would be to examine the feasibility of using remote sensing technology along with ground verification for area enumeration in each season.
Each of the above suggested methods has its advantages and disadvantages. There are also cost implications. The best option, therefore would be to examine the entire agricultural statistics methodology by the subject specific expert committee and by the Technical Advisory Committee and suggest (a) corrections in the existing methods including estimation procedures as a short term measure and (b) evolve a more scientific and practical methodology after pilot testing. It also needs to be ensured that one Investigator is fully available for each of the Investigator Zones.
4.4.9 Wholesale Price Index Numbers
As mentioned in the previous chapter, the DES is not able to compile a proper Wholesale Price Index despite wholesale prices of both the agricultural products and industrial products are being collected for a long period. It is a major weakness of the system which needs to be remedied by starting the computation and publication of Whole Sale Price Index Number of Agricultural and Industrial products with the base year 2009-10.

84
The subject specific expert committee has to examine issues related to prices and index numbers and suggest suitable measures to the Technical Advisory Committee.
4.4.10 Retail Price and Consumer Price Index Numbers
A wide variety of retail price are being collected by the DES. Many of these prices are collected to meet the administrative needs of specific Departments like fixing the purchasing or selling prices of specific items. In one case, it is stated that the DES is still collecting the prices of items which have disappeared from the market. The only Consumer Price Index Number being compiled by the DES is the Consumer Price Index Numbers for Industrial and Agricultural workers. Other indices being computed are (i) Wage indices of skilled and unskilled workers and (ii) Parity indices to measure the level of prosperity of the farmers. Both these indices with old base years have no relevance and simply a ritual without any use. The proposed strategies/ activities in the case of prices are:
(i) Take steps to stop the collection of prices which are collected for
completing the administrative formalities of individual Departments, as these prices have no relevance in macro-economic analysis,
(ii) Take steps to compute Consumer Price Index Numbers separately for Rural and Urban Areas by using weights computed from latest consumer expenditure survey and prices collected from representative markets and outlets selling specific consumer products,
(iii) Retail prices of essential commodities being collected need to be properly analysed by using econometric models and time series models to infer both the causes and components of price variations,
(iv) The subject specific Expert Committee and Technical Advisory Committee has to deal with both the wholesale prices and retail prices and advise the Department on various technical issues relating to prices.
4.4.11 Health, Morbidity, Mortality and family Welfare Statistics
Though the health management information system has been in existence for a long time, there are several components of health statistics which are still weak. It is thus necessary to improve the system by initiating the following steps.
(i) Integrate all the reporting systems into a web-based system with multiple screens,
(ii) Identify the grey areas in respect of data on social security, old age and palliative care and integrate into the proposed reporting system.

85
(iii) Bring the private sector health institutions under the coverage of reporting system in respect of various schemes by using the provisions of Collection of Statistics Act, 2008,
(iv) Generate health and family welfare statistics by the place of residence,
(v) Strengthen the Statistics and Demographic Cell of Directorate of Health Services,
4.4.12 Education and Literacy Statistics
As indicated in the previous chapter, there is a fairly well developed statistical system on school education though there are problems of time lag and inadequate data content. In the case of higher education and technical education including medical education, the statistical system is extremely weak. The strategic actions, therefore, are: (i) Introduce web-enabled data reporting by all the recognised schools in the
State and include data on school infrastructure and facilities in the reporting formats,
(ii) Design and implement a statistical reporting system in the Department of Higher Education to report statistics of enrolment by social groups and gender, teaching and non-teaching staff and infrastructure facilities by all the educational institutions both in the Government and private sectors.
4.4.13 Labour and Employment Statistics
Though various aspects of labour and employment are being captured by the DES from different sources, it has not been able to integrate the data sets and provide a comprehensive picture to facilitate labour force planning. In particular, the size of labour force, work force and the un-employed and under-employed in absolute numbers have to be estimated by using Employment- Unemployment Survey data and projected census population in respective years as the survey estimates are generally under estimates. It requires specialised training and ability to analyse data sets available from different sources. The strategy/ action plan proposed in this regard are: (i) Complete the system of online registration and web enabled reporting of
labour statistics initiated by the Office of the Labour Commissioner as expeditiously as possible. Also make arrangements to share the data sets with the DES,
(ii) The computerisation process of Directorate of Factories and Boilers also needs to be completed and data sharing with DES has to become effective and timely,
(iii) Undertake the tabulation of employment – unemployment surveys on priority basis and generate population adjusted estimates of labour force,

86
work force and unemployed to assess the overall employment situation, and
(iv) Ensure complete registration of migrant workers in the State by the Labour Department and share the data sets with the DES.
(v) Evolve suitable methodology for estimating Educated Unemployed in the state at Annual basis.
(vi) A suitable methodology may be attempted by DES for generating Estimates of employment and unemployment , Quarterly or at least on an Annual basis in future to help Govt. in taking policy decisions.
(vii) Kerala has a peculiar Labour Market situation and this also needs special study to understand all ramifications of our labour market conditions. Such initiatives would help to make the SDP/DDP Estimates on a sound footing.
4.4.14 Housing Statistics
Though the level of housing activity is considered to be a good indicator of the economic situation in any region, there is hardly any reporting of housing activities and investments on a regular basis. It is therefore, necessary to make reporting of cost of construction and major repairs mandatory both at the time of seeking approval from the local bodies and at the time of issue of completion certificates. The local bodies need to computerise such applications and certificates issued and transmit the details online to District Offices Economics and Statistics.
4.4.15 Statistics of Birth and Death and Population There is a computerised system of Birth and Death Registration in the
State and as such the statistics of birth and death are captured directly. The system has been perfected over the years and from current year onwards the Information Kerala Mission (IKM) will be able to generate complete statistics from their “Sevana” package. The DES has to take the help of IKM for capturing data on marriage registrations as registration of marriages has been made mandatory. The DES also has to insist on recording of all the data elements including the place of residence of the persons and introduce quality check on a sample basis. Further, it is required to strengthen medical certification of causes of death by the medical officers and share the data with the DES.
4.4.16 Electricity Production and Distribution Statistics The statistics of electricity production and distribution are available from
the KSEB though the DES has been collecting these statistics from the Central Electricity Authority with considerable time lag. The DES needs to establish better coordination with the KSEB and seek the relevant statistics at periodical

87
intervals. The DES also needs a web-based data sharing mechanism as soon as the total computerisation programme of KSEB is completed.
4.4.17 Environment and Forest Statistics
There is already a well developed environment and forest statistics system though on-line reporting is presently not possible. There are also certain data gaps which need to be bridged. The strategy, therefore, has to be the following: (i) Strengthen data capturing mechanisms and extent the data modules to cover all aspects of forest management,
(ii) Migrate the existing database modules from the existing Oracle base to a package which allows web based on-line reporting
(iii) Replace the existing old and outdated hardware. 4.4.18 Participation in the National Sample Surveys The State Government has not been able to take advantage of state
participation in national sample surveys due to lack of manpower planning, non-deployment of qualified staff and weak infrastructure. The DES has to clear the backlog of tabulation from 61st to 66th Round Survey by making special arrangements including engagement of additional man power with knowledge in survey data tabulation who are experienced in national sample surveys.
The NSS Section in the DES also needs to be strengthened with persons
having suitable qualifications and experience to meet the requirements of electronic data processing. The Cell should also be given the necessary tabulation infrastructure and training of staff.
Pooling of Central and State Data and compilation of district level
estimates also need to be undertaken on completion of backlog of tabulation. 4.4.19 Transport Statistics The computerisation process under implementation in the Department of
Motor Vehicles will facilitate availability of better road transport data though data on road infrastructure will continue to be weak. The DES should establish proper coordination with the Department of Motor Vehicles in designing e-filing formats of quarterly returns of income, expenditure and passenger data and formats of the statistical outputs required. The e-filing system and its tabulation of data obtained through e-filing also need to be expedited by the Department of Motor Vehicles.
The Roads Wing of the PWD may be persuaded to complete the Road
Information System taken up with the assistance of the World Bank. There is a need to strengthen the statistical unit in the motor vehicles department and creation of statistical cells in the PWD (Roads and Bridges) and PWD (LSGD) for addressing the data gaps in the sector.

88
4.4.20 Statistics of Local Level Planning Local bodies are already having the experience of computerisation and
online transmission of data. Still they are not able to generate the data sets required for local planning. The strategy for systematic generation of local level data would consist of the following:
(i) Prepare a holistic computerisation plan for Grama, Bock, and District Panchayats covering all aspects of Panchayat planning, services, resource management and administration. The plan should include the following specific activities/systems:
Income and expenditure of the Panchayats from all sources with proper budget classifications including capital and revenue expenditure classification and end use classification,
Classification and collection of house tax by type of accommodation and its use,
Issue of licenses/permits to industries, shops and establishments and other activities,
Issue of building permits and completion certificates of new constructions and major repairs of existing buildings,
Registration of births, deaths and marriages and tabulation of data both by place of occurrence and place of residence of the households,
Details of various citizen services and the beneficiaries,
Planning, budgeting and expenditure monitoring, Assets and resources of the Panchayats, and
Geographical features and boundaries of the Panchayats. (ii) Strengthen the local bodies with posting of statistical assistants as data
managers at the local level. (iii) Provide the necessary hardware, software and training to the statistical
staff in local bodies for achieving total computerisation, (iv) Modify the software packages for the entry and transmission of data
collected by the health workers and ICDS workers so as to enable the Panchayats and other local bodies to generate basic data relating to households, vital events, family planning practices, health and morbidity, children, education, enrolment, etc at the time of data entry itself,
(v) Document the Malappattam exercise for generating local level database creation and the benefits derived from the same. Undertake 5 more pilot projects covering hilly area, coastal area, midland area, industrial area and tribal area to assess its replicability, particularly with reference to crop area estimation,

89
(vi) Organise district wise workshops for local body members and chairpersons on local level databases and use of such databases,
(vii) Obtain unit level data sets of Agricultural Census and Economic Census for generating Panchayat level data sets.
(viii) Establish a district level data bank covering Panchayat-wise details of population, employment, social profile, land utilisation, major crops, major industrial and service establishments, social infrastructure including schools, colleges, hospitals, morbidity profiles, etc.
(ix) Bring in a mechanism for data collection and flow of information at all levels with public participation. In this connection, Panchayat Statistical Samithi (PSS), Block Statistical Samithi (BSS) and District Statistical Samithi (DSS) may be constituted with Statistical Investigator (Data Manager) attached to the Grama Panchayat (Proposed), Extension Officer (P&M), Joint Director (Proposed) as the conveners at the respective levels.
4.4.21. Gender Statistics In order to generate gender statistics, the DES has to take up special surveys on gender issues and time use surveys apart from providing male and female breakup in all published statistical reports.
4.4.22 Unorganised Sector Statistics Unorganised sector being an important segment of the economy of Kerala,
the DES has to expedite tabulation of unorganised sector surveys and generate data on contribution of informal sector to State economy. The DES needs to analyse data sets available from employment – unemployment surveys to assess the extent of informal employment and conditions of employment.
4.4.23 Poverty Statistics In view of the fact that DES has so far not done any work in this area, it
needs to commission a study for developing a methodology for assessing realistically district level poverty by using the data sets available from different surveys.
4.4.24 Service Sector Statistics Though services sector has been growing fast and its contribution to the State economy has increased significantly, the statistics of the sector is still weak due to absence of a statistical frame and periodical surveys of services sector. The DES needs to utilise the online registration system introduced by the Labour Commissioner and the Economic Census data to create a Business Register and introduce regular sample surveys of the sector. The DES also has to start collecting and analysing the Balance Sheets and Profit and Loss accounts of large services sector establishments in Kerala.
4.4.25 Banking Statistics There is a well established system for reporting banking statistics laid
down by the Reserve Bank of India. The local bodies may, however, seek data

90
from lead banks and co-operative banks within their geographical region to facilitate preparation of development plans. The lead bank in each district may include data on credit disbursements also along with the data on targets.
4.4.26 Human Development Statistics The preparation of State level and Sub-State level Human Development
Reports entail demand on reliable disaggregated statistics by smallest geographical region. It is, therefore, necessary to strengthen the statistical system to make available such data sets. The strategy, therefore, is to expedite tabulation of State sample data of various surveys and take up pooling for generating district level data sets. Moreover, use current sources of data at District/ lower levels from Population Census, Economic Census and Research Reports of Institutions like IIPS Mumbai, SRS (RGI), NIEPA, New Delhi etc for preparation of HDRs at State and district levels. Also establish an effective reporting mechanism for compiling local level statistics. The small area estimation technique also needs to be attempted on a pilot basis.
4.4.27 Statistics of Non-Resident Keralites Since non-resident Keralites constitute a major segment of economic and
social structure of Kerala, it is important to integrate the statistics relating to them into the official statistical system. However, it involves different definitional and procedural issues. The strategy, therefore, is to set up an Expert Group to evolve proper methodologies for periodic surveys of Non-Resident Keralites.

91
Chapter-5 The Implementation Plan
The realization of the strategies and goals listed in the previous chapter depends greatly on having a well structured and effective implementation plan and its meticulous execution. It has to provide a detailed sequence of activities to be completed in specific time periods along with the resource requirements at different stages of implementation. Detailed work plans for each of the strategies indicated in the previous chapter have been worked out and included in this chapter.
5.1. State Statistical Commission
The constitution of a Kerala State Statistical Commission (KSSC) on the lines of the National Statistical Commission is proposed to lay down statistical standards and to ensure effective co-ordination of statistical activities at the State level. The functions of the Kerala State Statistical Commission will be the following:
(i) Identify the areas of core statistics of national and state priority and are of critical importance to the State economy,
(ii) Constitute professional committees or working groups to assist the Commission on various technical issues,
(iii) Evolve state policies and programes consistent with national policies relating to statistical system,
(iv) Evolve standard concepts, definitions, classifications and methodologies in different areas of statistics consistent with international and national practices,
(v) Evolve state strategies for the collection, tabulation, and dissemination of statistics, including release calendar for various data sets produced by the State Statistical System,
(vi) Evolve state strategies for human resource development on official statistics including information and communication technology integration of the statistical system,
(vii) Evolve measures for improving public trust in official statistics,
(viii) Evolve measures for effective co-ordination between different Departments and agencies of the State Government through the Director General.
(ix) Exercise statistical audit over the statistical activities to ensure quality and integrity of statistical products,
92
(x) Recommend to the Government to effectively implement the standards, strategies and other measures evolved by the Commission,
(xi) Advise the State Government on the requirements of legislative measures on statistical matters, and
(xii) Monitor and review the functioning of the State Statistical System and recommend measures to enhance its performance.
The State Statistical Commission may consist of a part-time chairperson and three other members. The Secretary, Planning & Economics Affairs Department will be the Member Secretary of the Commission. The Chairperson has to be an eminent statistician with several years of experience in the official statistical system of the country or the State. Three part-time members, one each from those having expertise in the following fields may be nominated.
(i) Economic statistics and analysis covering the fields of state income, industry, infrastructure, etc:
(ii) Social and environment statistics including labour, poverty, gender analysis and
(iii) Statistical operations like census, sample surveys, data processing, etc.
The Chairperson and members of the Commission will hold their offices for a term of five years. The Chairman may be given a monthly honorarium of `.25,000 and the members may be given a honorarium of `.15,000 each per month. They may also be eligible for a sitting fee of `.1000 for each day of the meeting apart from travel allowance as per their eligibility. The Commission may be set up as per the following schedule
Year Activity to be completed 2010 - 11 Process the recommendation and get the government
decision to set up the Commission 2011 - 12 Identify the Chairperson and members and set up the
Commission.
The expenditure on setting up of the Commission will be as given in Table-5.1:
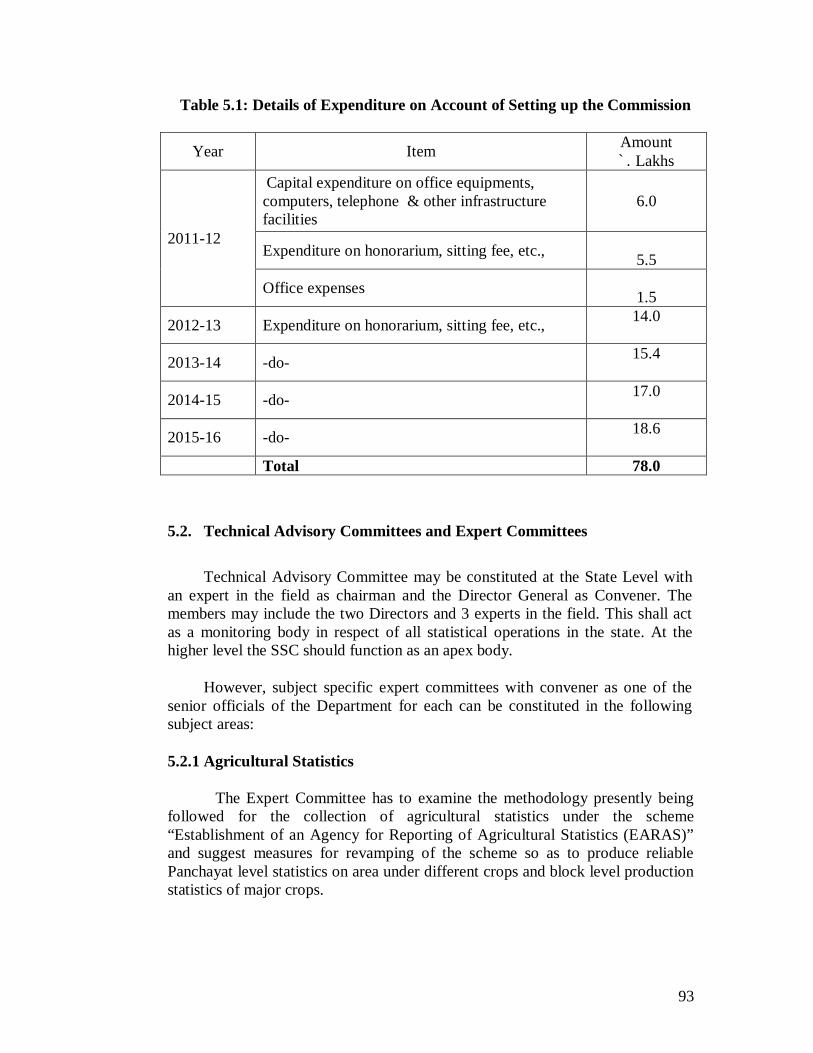
93
Table 5.1: Details of Expenditure on Account of Setting up the Commission
Year Item Amount `. Lakhs
2011-12
Capital expenditure on office equipments, computers, telephone & other infrastructure facilities
6.0
Expenditure on honorarium, sitting fee, etc., 5.5
Office expenses 1.5
2012-13 Expenditure on honorarium, sitting fee, etc., 14.0
2013-14 -do- 15.4
2014-15 -do- 17.0
2015-16 -do- 18.6
Total 78.0
5.2. Technical Advisory Committees and Expert Committees
Technical Advisory Committee may be constituted at the State Level with an expert in the field as chairman and the Director General as Convener. The members may include the two Directors and 3 experts in the field. This shall act as a monitoring body in respect of all statistical operations in the state. At the higher level the SSC should function as an apex body.
However, subject specific expert committees with convener as one of the senior officials of the Department for each can be constituted in the following subject areas:
5.2.1 Agricultural Statistics
The Expert Committee has to examine the methodology presently being followed for the collection of agricultural statistics under the scheme “Establishment of an Agency for Reporting of Agricultural Statistics (EARAS)” and suggest measures for revamping of the scheme so as to produce reliable Panchayat level statistics on area under different crops and block level production statistics of major crops.
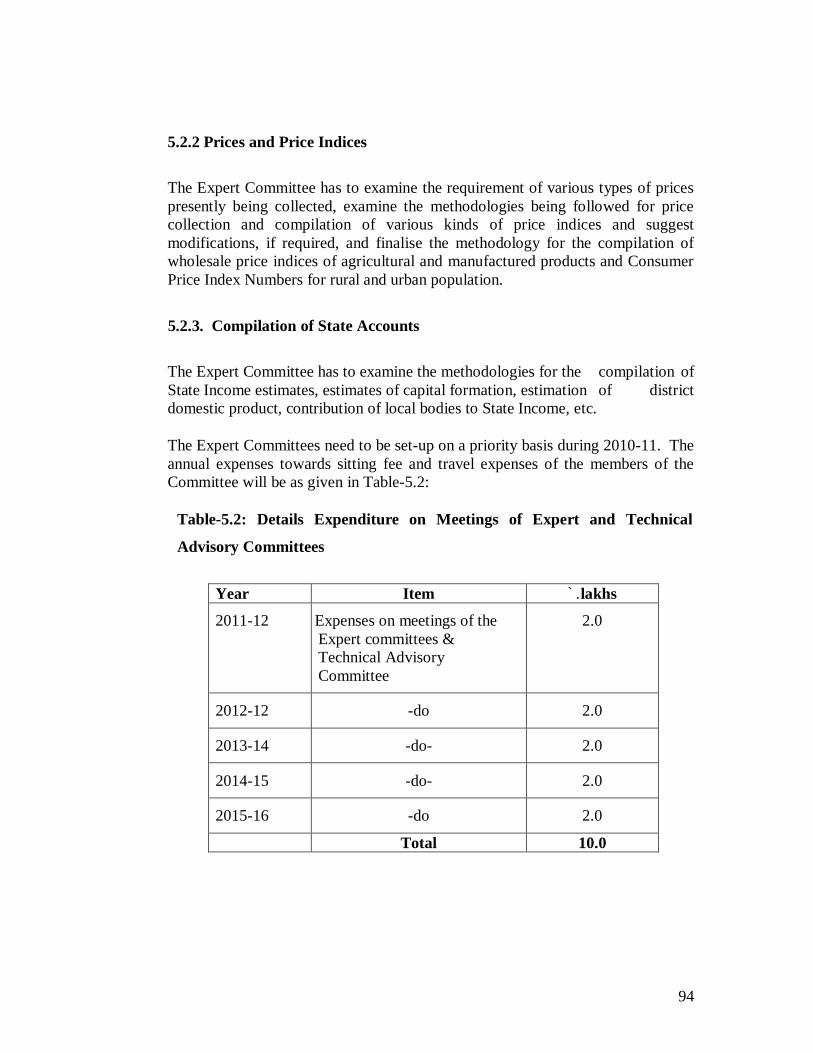
94
5.2.2 Prices and Price Indices
The Expert Committee has to examine the requirement of various types of prices presently being collected, examine the methodologies being followed for price collection and compilation of various kinds of price indices and suggest modifications, if required, and finalise the methodology for the compilation of wholesale price indices of agricultural and manufactured products and Consumer Price Index Numbers for rural and urban population.
5.2.3. Compilation of State Accounts
The Expert Committee has to examine the methodologies for the compilation of State Income estimates, estimates of capital formation, estimation of district domestic product, contribution of local bodies to State Income, etc.
The Expert Committees need to be set-up on a priority basis during 2010-11. The annual expenses towards sitting fee and travel expenses of the members of the Committee will be as given in Table-5.2:
Table-5.2: Details Expenditure on Meetings of Expert and Technical
Advisory Committees
Year Item `.lakhs
2011-12 Expenses on meetings of the Expert committees & Technical Advisory Committee
2.0
2012-12 -do 2.0
2013-14 -do- 2.0
2014-15 -do- 2.0
2015-16 -do 2.0
Total 10.0
95
5.3. User Consultations
The user consultations can take place in the form of workshops and seminars in specific subject areas or on published reports. On an average, two such workshops/seminars maybe planned per year. The annual expenses on these workshops/seminars will be about Rupees One lakh each year from 2011-12.
5.4. Strengthening of Statistical Co-ordination
The different Departments and offices of the Government generate various data sets as a bi-product of their administrative reporting mechanism. These data sets constitute the major component of official statistics. However, such systems often do not produce usable statistics due to various reasons including confidentiality of data reported, deficiencies in the input or output formats used, absence of quality check, etc. It is, therefore, important that designing of input and output formats and reporting mechanisms are finalised in such a way that data sets which are not confidential in nature are generated on a regular basis. The DES has to be, therefore, empowered to undertake the following activities:
(i) The Technical Advisory Committee should examine the reporting mechanisms of each of the Departments, particularly the following, and suggest measures for compiling reliable statistics. The measures thus recommended need to be implemented by the concerned Departments under the technical supervision of the DES. Contents of the input formats,
Classification of the contents as confidential or otherwise, Periodicity of the reports,
Completeness of reporting, Timeliness of reporting,
Provision of quality checks, Processing and aggregation procedures including levels of
aggregation, Statistical relevance of data sets reported, and
Output formats level of disaggregation. (ii) In the case of surveys and censuses initiated by various
Departments/Offices of the State Government, consultations with the DES
96
should be made compulsory and technical details of each such activity need to be finalised by the Working Groups specifically set up for the same.
The implementation of these recommendations is primarily administrative in nature except for the expenses involved in holding the meetings of the Working Groups and finalisation of the reports. A token provision of Rs 2 lakh each per year may be provided for the activity during the next five years.
5.5. Integration of Man Power Planning with Designing and Planning
of Surveys
The DES has been taking adhoc decisions to launch new surveys and other statistical activities without considering availability of statistical personnel and infrastructure facilities. There are a number of such instances including participation in the national sample surveys with 1.5 times matching sample. Such decisions disturb the core activities of the Department and adversely affect quality of statistical outputs. It is, therefore, necessary to make man power planning as a main constituent of survey design and planning. The implementation of this recommendation does not involve any expenditure.
5.6. Creating Physical Infrastructure
The physical infrastructure like chairs, tables, wall racks, etc in most of the 14 District Offices and 61 Taluk Offices of the DES requires to be upgraded so as to ensure minimum working conditions and office environment. It is also proposed to provide transportation facility at the Taluk level for effective supervision and monitoring of field work. The total cost of the furniture and provision of transportation facility in all the offices including the annual maintenance will be `.568.86 lakh. Since the Department has been publishing lot of reports, the present mini printing press will not be sufficient to cater to the increasing demands. Hence an amount of `.20 lakh may be allocated for the upgradation of the existing printing press.
Among the TSOs, 28 are housed in private buildings and some of them even do not have basic facilities like toilets, water supply or telephones. It is, thus, important that all the field offices of the DES are housed in Government buildings with the required infrastructural facilities including telephone and internet. The details of construction work involved and the related cost estimates are at Annex-I. The total construction cost is `.613 lakh. The over all cost of improving physical infrastructure is thus `.1201.86 lakh. 5% of the construction cost will be borne by the State Government.
5.7. Data Dissemination Policy
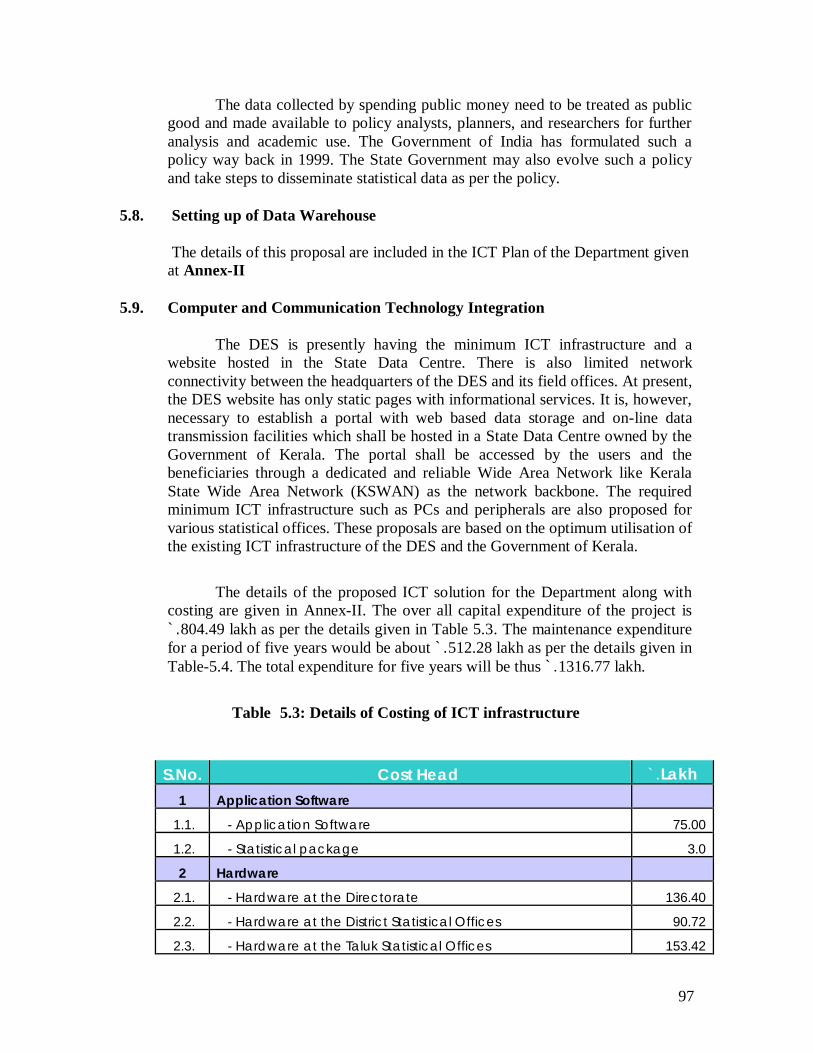
97
The data collected by spending public money need to be treated as public good and made available to policy analysts, planners, and researchers for further analysis and academic use. The Government of India has formulated such a policy way back in 1999. The State Government may also evolve such a policy and take steps to disseminate statistical data as per the policy.
5.8. Setting up of Data Warehouse
The details of this proposal are included in the ICT Plan of the Department given at Annex-II
5.9. Computer and Communication Technology Integration
The DES is presently having the minimum ICT infrastructure and a website hosted in the State Data Centre. There is also limited network connectivity between the headquarters of the DES and its field offices. At present, the DES website has only static pages with informational services. It is, however, necessary to establish a portal with web based data storage and on-line data transmission facilities which shall be hosted in a State Data Centre owned by the Government of Kerala. The portal shall be accessed by the users and the beneficiaries through a dedicated and reliable Wide Area Network like Kerala State Wide Area Network (KSWAN) as the network backbone. The required minimum ICT infrastructure such as PCs and peripherals are also proposed for various statistical offices. These proposals are based on the optimum utilisation of the existing ICT infrastructure of the DES and the Government of Kerala.
The details of the proposed ICT solution for the Department along with costing are given in Annex-II. The over all capital expenditure of the project is `.804.49 lakh as per the details given in Table 5.3. The maintenance expenditure for a period of five years would be about `.512.28 lakh as per the details given in Table-5.4. The total expenditure for five years will be thus `.1316.77 lakh.
Table 5.3: Details of Costing of ICT infrastructure
S.No. Cost Head `.Lakh 1 Application Software
1.1. - Application Software 75.00
1.2. - Statistical package 3.0
2 Hardware
2.1. - Hardware at the Directorate 136.40
2.2. - Hardware at the District Statistical Offices 90.72
2.3. - Hardware at the Taluk Statistical Offices 153.42

98
Table-5.4: Details Revenue Expenditure
S.No. Cost Head OPEX
Y1 Y2 Y3 Y4 Y5 1 Software
- Application Software AMC cost 0.00 0.00 0.00 15.00 15.00
2 Hardware
- Hardware AMC Cost 0.00 0.00 0.00 80.78 80.78
3 Networking
- Networking Equipments AMC cost 0.00 0.00 0.00 11.99 11.99
- Bandwidth cost 30.80 30.80 30.80 30.80 30.80
- Internet connectivity cost 3.90 3.90 3.90 3.90 3.90
4 Manpower
- Manpower cost 10.80 10.80 10.80 10.80 10.80
5 Other Cost
- Other costs (Stationary & Communication) 23.08 23.08 23.08 0.00 0.00
TOTAL 68.58 68.58 68.58 153.27 153.27 Grand Total 512.28
2.4. - Hardware at the Statistical Cells 23.37
3 Network Infrastructure
3.1. - Networking at the Directorate 6.58
3.2. - Networking at the District Statistical Offices 22.12
3.3. - Networking at the Taluk Statistical Offices 81.13
3.4. - Internet connectivity at the Statistical Cells 1.23
4 Site Preparation
4.1. - Site Preparation 104.82
5 Data Digitization 5.1. - Data Digitization 22.71
6 Training & Change Management
6.1. - Training & Change Management 30.00
7 Manpower
7.1. - Consultancy 54.00
TOTAL 804.50
99
5.10. Creating Positive Public Image in Official Statistics
The activities involved in creating positive public image in official statistics include conduct of advocacy campaigns and public meetings as well as mass media publicity apart from improving the credibility of official statistics by following the fundamental principles of official statistics laid down by the UN Statistical Commission. The institutional mechanisms and methodological improvements proposed in this report are aimed at improving the reliability and credibility of official statistics. Advocacy campaigns, public meetings and mass media publicity have to be undertaken before starting any statistical activity and the results of such activities have to be presented after its completion. A lump sum provision of `.5 lakh each per year may be provided for this activity during the next five years.
5.11. Engendering Official Statistics
The steps involved in engendering official statistics are the following:
(i) Examine whether gender disaggregated data are available in respect of each official data series. If not, efforts have to be made for producing statistics with such a classification. GSDP and NSDP estimates are presently not available by gender and hence a clear case for special effort. This exercise can be undertaken as a research study. A budget provision of `.5 lakh may be made for the purpose during 2011-12.
(ii) The specific gender issues like un-wed mothers, widows, single women, woman headed households and resident families of migrated men, intra-household variations in educational, health care and nutritional intake attainments are some of the issues which need special studies to be undertaken by following engendered survey techniques. The DES may undertake two such special surveys during the next five years till 2015-16. It is also considered important to undertake an evaluation study to assess the impact of various social assistance schemes being implemented by the Department of Social Welfare, particularly relating to women and other weaker sections of the society.
Assuming a sample size of about 800 first stage units of urban blocks and Panchayat Wards, and that two samples could be surveyed per month per person, the estimated cost for each survey will be about `.90 lakh. The total cost for all the three surveys and a research study as proposed in (i) above will be `.275 lakh.

100
5.12. Cadre Structure and Personnel Management
The DES is primarily a statistical agency, though economic analysis of data to assist State and Sub-State level planning is also one of its major functions. There are also functions which involve the use of complex statistical techniques like survey design, statistical projections, etc. Such requirements of specific posts are, however, not considered while posting of officers and staff in different posts. It is, therefore recommended that the functions of each post in the DES in terms of its technical content are listed and persons having such technical knowledge are posted to man each position. Efforts may be taken to develop expertise of the officers in the domains of interest. Evolve a training policy according to this.
In general, no distinction is made between those with statistical qualifications and others while making initial recruitments and the system creates imbalances in the availability of officers with statistics and economics qualifications. This has to be changed and initial recruitment to higher posts may be guided by the existing proportions and the actual requirement.
The officers and staff of the DES are categorised over 36 designations. Even persons in the same scale of pay are known by different names depending on their qualification, place of posting, etc. Such multiplicity of designations makes any personnel management system highly complex.
A computerised personnel management system and a procedure of
objective performance assessment and incentives is a basic requirement for ensuring effective resource management and efficient service delivery. The service records of each functionary in the Department needs to be computerised so that the experience, educational qualifications and training requirements of individuals can be easily assessed. This exercise can start immediately.
The Statistical Assistants Gr.I and Gr.II are responsible for field surveys
while the Statistical Inspectors are the first level supervisory staff. Though there are 423 posts of the same grade, 152 of them are Extension Officers in the Rural Development Department and 110 are posted in various other Departments. As a result, the number of first level supervisory staff available for field supervision of survey work is 53 against 181 primary workers in the District Offices and 75 against 926 primary workers in Taluk Offices. While the ratio is 1:3.4 in the case of districts, it is as high as 1:12.3 in the case of Taluk Offices. It varies from 6 persons per supervisor in Changanassery to 22 in Meenachil. The statistical activity in Taluk Offices at present relates to EARAS and Cost of Cultivation Survey. Thus, there is practically no supervision of these activities due to inadequate supervisory staff.
As per GO(MS)No.212/2006/LSGD dated 13.09.2006 , the government have decided to strengthen the District Planning Committees by providing technical secretariat with the District level town planning office, District

101
Statistical Office and District Planning office housed in a single building. The heads of Town Planning Office, District Planning Office are both in the cadre of Joint Director, whereas that of the District Statistical office is in the cadre of Deputy Director. This anomaly should be rectified with the up-gradation of the present post of Deputy Director to the post of Joint Director. The recommendation 10.6.2 of the report if the committee headed by Prof.M.A.Oommen states that “In a paper presented before the committee the Director of Statistics estimates that 1219 persons will be required to fill the statistical posts necessary in the local bodies of the state with an annual commitment of `.13 crore. This cannot be considered prohibitive, especially considering the likely benefits from the improvements in local level planning activities as a result of posting these personnel in the local bodies.” Based on the workload and the multiple tasks which are supposed to be performed by the field level functionaries, it will be useful to carry out a work study to rationalise the deployment / creation of additional posts. The study needs to cover the existing deficiencies in the present staff structure and measures to remove the same. An amount of `.30 lakh may be made for the purpose.
5.13. Intensive Training and Training Institute
There is an urgent need for providing comprehensive training to all the functionaries of the DES including theoretical training. The training will include initial induction training and periodic subject specific training. In effect every officer and staff of the Department should undergo training on various subject modules at least once every year. Though the DES is already having a system of training of officers and staff, the magnitude of training requirement justifies the setting up of a separate training institute in official statistics. It is thus proposed to set up a full fledged training Institute in the name of ‘State Academy on Statistical Administration (SASA)’. It will function as an attached institution of the DES for the advancement of official statistics in Kerala. SASA is expected to function as the centre of excellence for training and research in official statistics including statistics and economics theories. The Institute would engage in developing official statistical methods and procedures and impart training to official statisticians. The Institute aims to promote the development and dissemination of statistical knowledge, and to contribute to the development of statistical systems in Kerala. SASA will provide various training courses from the basics to the advanced levels on statistical knowledge, theories and skills for the personnel of state and local self-governments in the State. The specific functions of the Institute will be the following:
(i) Provide intensive training in official statistics, statistical and economic theories, data processing and related disciplines for the improvement official statistics in the State.
(ii) Promotion of study and dissemination of knowledge of statistics, to develop statistical theory and methods, and their use in research and

102
practical application in official statistics with special reference to problems of planning and development in the State.
(iii) Undertake research in various fields of official statistics and social sciences with a view to incorporate the same in the statistical system of the State.
A major component of the training activity will include improvement of general qualification of under graduates. There are 39 under graduates among 64 Taluk Statistical Officers, 237 out of 443 Research Assistants, 341 out of 843 Statistical Assistants Gr.I and 194 out of the existing 496 Statistical Assistants Gr.II. An analysis of their age profiles indicates that 34 TSOs, 129 Research Assistants, and 15 Statistical Assistants Gr.I will retire in the next 5 years. In other words, 5 TSOs, 108 Research Assistants, 326 Statistical Assistants Gr.I and 194 Statistical Assistants Gr.II need to be given general training in subjects like Economics, Statistics and Mathematics to improve their general capabilities.
The facilities to be created in the Institute shall include atleast four class rooms, two computer training rooms with 15 computer terminals each, a seminar hall with seating capacity of 250 persons in theatre style, two smaller seminar halls with seating capacity of 50 persons each, a library with documentation facilities, faculty rooms, office space, store, reception area, video conference facility, guest rooms, hostel for men and women separately, two staff cars, a mini bus, etc. The training institute will need to have the minimum staff as indicated in Table-5.5.
Table-5.5: Details Staff Required for the Training Institute
The second ,third and fourth positions are proposed to be filled up through working arrangement .The total cost of setting up of the Training Institute will be about `.360 lakh as per the details given in Table-5.6.
Sl. No
Position Number Method of Recruitment
1 Director (SDRT) 1 To be created 2 Training Manager
(DD of DES) 1 Working Arrangement
3 Research Officer 1 Working Arrangement 4 Statistical Assistants 3 Working Arrangement 5 Drivers + Class IV 3+2=5 To be recruited

103
Table 5.6: Details of Expenditure for the Establishment of the
Training Institute
Sl.No Item of Expenditure Cost (Rs Lakh)
1 Land (1 Acre) *
2 Building Construction (10000 Sqft)
@Rs2000 200 **
3 Equipments 25
4 Transport Facility 25
5 Computer labs & video conferencing 30
6 Training Material Preparation 10
7 Office equipment 10
8 Hostel Facility 50
9 Miscellaneous Expenditure 10
TOTAL 360
* As per the clause(vii) of the letter of participation signed by the Chief Secretary on 07/05/2008, “the state government would need to provide if, when and wherever required, the necessary land and /or buildings, manpower and also meet all associated recurring expenditure for implementation of the SSSP and specific provisions of the MoU”. Hence the cost of land is excluded.
** 5% of the cost will be met by the State government
Though the establishment of the training Institute will take a few years, the training of the officers and staff of the Department can not wait till the Institute become functional. The training needs assessment which has already been made by the Department has to be taken up for implementation with the assistance of professional institutions including the Central Statistical Organisation. The establishment of the Institute will also entail associated training expenditure. A sum of `.10 lakh each for the first three years, `.20 lakh for the fourth year and `.30 lakh for the fifth year are therefore provided for training and associated expenses.
5.14. Restructuring and Empowering of DES The administrative and technical head of the DES is the Director.
However, routine administrative work like sanctioning of payment of telephone and electricity bills, personnel matters of officers and staff, passing of pay bills and travel bills, sanctioning advances and recoveries and other activities keep the Director busy all through the day on every working day leaving little time even

104
for over seeing technical matters. In other words, the status of the Director at present is not that of a technical authority in a Technical Department.
In view of the above, it is suggested that the head of the DES may be designated as Director General at the Level of Special Secretary to the Government of Kerala. He may be assisted by a Director, Statistics for Decentralised Planning (SDP) and a Director, Survey Design Research & Training (SDRT). All the routine administrative and financial powers may be delegated to the senior most Additional Director. In addition to the existing posts of Additional Directors, a post of Additional Director may be created for technical coordination with the vertical and lateral structures of the Statistical System. The Director General may be left with policy and technical issues so that he is fully available for statistical co-ordination, technical consultation and standard setting. There is an urgent need to transform the department for enabling the government to take policy decisions with the help of need based surveys and for this the survey design and field operations division has to be setup with sufficient manpower. The survey design and field operations can be vested with Director, Survey Design Research & Training (SDRT) in addition to the responsibility of managing the Training Institute and all other technical matters may be vested with Director, Statistics for Decentralised Planning (SDP). The financial implications of the proposal including the creation of 3 posts of drivers and 2 post of Class IV will be about `.30 lakh per year.
5.15. Creation of Statistical Frames The DES is presently not maintaining any statistical frames. Even the
Urban Frame Survey (UFS) list of blocks in the urban areas of Kerala is not maintained by the DES. Further, it is still struggling to find a frame of manufacturing establishments in the State though the Regional Office of the National Sample Survey Organisation (NSSO) maintain such a frame on the basis of the list obtained from the Chief Inspector of Factories and Boilers. In the case of services sector, the DES is not having any clue about obtaining a list of establishments. In the absence statistical frames, the DES is unable to collect any data from industrial establishments to estimate the contribution of secondary and tertiary sectors to State Income, capital formation and employment generation. This is a major data gap which needs to be bridged as quickly as possible, if the DES has to claim credibility of its statistical outputs. It is, therefore, proposed that the DES takes up the preparation of Business Register and its continuous updation.
The ICT introduction in the Office of the Labour Commissioner, Chief Inspector Factories and Boilers, Commissionerate of Road Transport, Department of Industries and the Department of Tourism has opened up a clear opportunity for the DES to develop a step by step action plan for the preparation and maintenance of a business register and undertake indicator surveys on an annual basis. The address slip canvassed in the latest Economic Survey is the source of data for initiating the first step towards creating a business register.

105
A Committee of Experts may be constituted to examine the lists available from various sources with reference to its coverage, data elements, mechanisms of updation and its periodicity and to identify the ideal partner Department for the creation and maintenance of the Business Register. The Committee may also field test the methodology and develop a proto type business register. The proto type may be then upgraded into a full fledged register.
Since the detailed specifications and activities involved are to be worked out by the Expert Committee, exact costing of the project is not possible at this stage. However, the cost of these surveys is proposed to be met out of the funds provided by the 13th Finance Commission.
5.16 Improving the Estimates of State Domestic Product. The DES has not been able to take advantage of the State participation in
national sample surveys for making reliable estimates of worker population in different sectors and average per-capita income of establishments due to delays in tabulation and pooling. As such, the DES had to depend on estimates of CSO and allocations based on approximate indicators. Proposals for expediting tabulation and pooling of State sample data are given under the heading ‘Participation in the National Sample Surveys’. The creation and maintenance of business register and conduct of list based sample surveys of industrial establishments as mentioned above can improve the reliability and credibility of state income estimates.
The DES has been using certain rates and ratios from CSO or other external sources for the estimation of state income from agriculture and livestock in the absence of direct estimates. The specific rates and ratios are the following:
(i) Rate of unauthorized slaughtering of animals belongs to Cattle, Buffalo, Sheep/Goat, Pig, etc
The ratio of animals slaughtered in the unauthorized slaughter houses is supplied by CSO during the discussions of base year shifting. Number of slaughtered animals in the unorganized sector is thus estimated by applying the ratio to the number of animals slaughtered in the authorized slaughter houses, supplied by Animal Husbandry Department.
(ii) Yield rate of meat from animals
Number of slaughtered animals is provided by the Animal Husbandry Department. The yield rate of meat from Cattle, Buffalo, Sheep/Goat, Pig etc are provided by CSO at the time of base year shifting discussion.
(iii) Production of dung and its uses ie. Quantity of dung used as fuel and as manure.

106
Yield rate is taken from integrated sample survey for the estimation of SDP. The conversion rates of dung for fuel and manure are provided by CSO.
(iv) Rate of fats obtained from animals.
Number of animals and slaughtered animals are taken from Animal Husbandry Department and the mortality rate is taken from Directorate of Marketing Inspection and rates and ratios of fat are obtained from CSO.
(v) Input cost rate in the Forest Sector.
Input costs are computed from State Budget Documents and state uses the national level rate.
(vi) Rate of subsistence fish in the case of inland fish.
Now national level rate is used for subsistence fish.
(vii) Repair and maintenance and inputs in the case of Marine fish, Inland fish, subsistence fish, prawns/shrimps and salting.
National level rates and ratios supplied by CSO in the base year discussion. The revision of the above rates and ratios would involve conduct of type
studies. DES may take up two type studies per year. The average cost of one type study may be about `.20 lakh. The yearly budget requirement will be thus `.40 lakh each for the first two years and `.60 lakh for the third year. The total cost of these studies will be `.140 lakh.
5.17 Estimation of Capital Formation and Savings The current methodology for the estimation of capital formation and
savings in the public sector has to be reviewed by the Expert Committee on State Income and the Technical Advisory Committee and suggest measures for improvement. Capital formation and savings in the private sector can be estimated only after the creation of the business register and introduction of annual surveys.
5.18. Estimation of District Domestic Product (DDP) There is a standard methodology developed by the CSO for the estimation
of District Domestic Product and the DES has also developed a strategy for the use of the same. However, district-wise data availability on various sectors is a major constraint. The implementation of various recommendations for the improvement of State Income estimates will also largely address data issues
107
relating to DDP. The small area estimation technique may also be pilot tested for obtaining district-wise estimates of production of major sectors. A sum or `.20 lakh may be provided for the same.
5.19. Estimation of Contribution of Local Bodies The action plan for the estimation of contribution of local bodies to the
State Income and other variables has been included under the heading ‘Strengthening of Local Level Statistics’.
5.20 Annual Survey of Industries In view of the difficulties in the survey and tabulation of data, state
participation in Annual Survey of Industries is not recommended. The DES may continue with the present system of obtaining data sets from the CSO and using the same for generating state related tables. However, it may start collecting data on production, employment and capital investment from industrial establishments as soon as the list of establishments becomes available.
5.21 Index of Industrial Production The DES has to quickly finalise the methodology for the compilation of
the Index of Industrial Production in consultation with the CSO including the list of products, sample of establishments and computation methods for changing over the base year to 2004-05 and compiling the Index with the help of the Industries Department for data collection. Since the resources already exist for the activity, there is no need of any additional funds.
5.22. Crop Area and Production Estimates The area and production estimates of different crops in Kerala are based
on EARAS scheme. However, the sampling frame used for the selection of samples for EARAS is defective due to large scale conversion of wet land into dry land which is not reflected in the Basic Tax Register (BTR). There are also problems in actual identification of acres of land in each cluster. The use of alternate frames for the collection of agricultural statistics, therefore, needs to be examined by the Expert Committee and the Technical Advisory Committee and it has to be tried out in five Panchayats on a sample basis. The cost of pilot studies in five Panchayats may be about Rs 75 lakh. The initial expenditure for the implementation of the new methodology in all the Investigator Zones is tentatively kept at Rs 5 crores. Once the methodology is established and the sampling frame is prepared, the existing resources can be used for the work.
5.23 Compilation of Wholesale Price Index Numbers

108
The DES should start compiling of wholesale price index numbers for agricultural and industrial products by revising the methodology as per the recommendations of the Expert Committee. Since the resources are already available additional funds are not required.
5.24 Retail Price and Consumer Price Index Numbers The price collection schemes to be dropped as per the strategy may be
identified with the advice of the Expert Committee and the Technical Advisory Committee and stop collection of such prices. The resources saved may be used for augmenting survey activities. A new series of Consumer Price Index Numbers for Rural and Urban Population may be taken up. The steps involved are the following:
(i) Computation of Weighting Diagram Weighting diagram can be derived from the latest Consumer Expenditure
Survey.
(ii) Identification of centres and markets Identify at least 3 urban centres and 3 rural centres as well as the markets
in each district
(iii) Conduct of market surveys Identify the most popular consumption items and their specifications as
well as the shops.
(iv) Start regular price collection and compilation of the indices Start collecting the prices on a monthly basis and compute the indices.
While the staff available for collecting a variety of prices could be used
for the regular price collection work, additional strengthening may be required for the market survey. A sum of `.84 lakh may be provided for the market survey at the rate of Rupees one lakh per centre.
5.25 Health, Morbidity, Mortality and Family Welfare Statistics The basic issues relating to health statistics relate to non-coverage of
private institutions in the reporting mechanism and disintegrated multiple reporting systems. As regards the first issue is concerned, a Government decision directing all the private medical institutions to report the statistics in specified formats specified by the DHS under the Collection of Statistics Act, 2008 and its earnest implementation is the only solution. The list of all the hospitals by location is already available with the IKM as it is necessary for the implementation of RBD Act. The Directorate of Health Services may seek the Government approval for introducing compulsory reporting of health statistics by all the private hospitals and take further steps for capturing the data through web-enabled on-line filing.

109
The Directorate also needs to design the data input formats by integrating all the data requirements under various schemes and strengthen the on-line reporting systems. It would involve system integration and augmentation. Since the DHS has not been able to work out the details of expenditure so far a lump sum provision of `.50 lakh may be provided at this stage.
5.26 Education and Literacy Statistics In the school education sector, there is a fairly good statistical system.
There are certain weaknesses which can be eliminated to some extent by improving computer connectivity and physical infrastructure. The requirement is 45 computers with internet connectivity and some physical infrastructure. The total cost of the proposals will be about `.20 lakh.
In the higher education sector, a proper statistical system is yet to be
introduced. The Statistical Unit in the Department of Higher Education has to be strengthened and a reporting system as in the case of School Education has to be introduced with the Direction of the Government. The DES should provide the reporting formats and tabulation schemes and impart training to the persons involved. The system should include facilities for on-line reporting of data by the institutions. A sum of `.25 lakh may be provided for system design, computer facilities and software development.
5.27 Labour and Employment Statistics The computerisation process taken up by the office of the Labour
Commissioner and the Directorate of Factories and Boilers need to be coordinated with the DES and the data reporting mechanisms have to be established. The DES may hold quarterly coordination meetings to assess progress in computerisation and data reporting. The DES may also start collecting statistics of migrant labour based on the registration system launched by the Office of the Labour Commissioner.
5.28 Housing Statistics The establishment of an effective reporting mechanism on housing
statistics involves the following steps: (i) Making it compulsory by changing the legal provisions or by issuing
administrative orders to provide cost estimates by those seeking approval or completion certificates in the case of new constructions or major repairs, and
(ii) The records relating to activities of the local bodies including applications for building permits and completion certificates have to be computerised for capturing housing statistics on a regular basis. This has also been recommended under strengthening of local level statistics.

110
(iii) The Housing Wing of the PWD has to ensure complete coverage of all Government constructions under various schemes.
(iv) The statistical cell in the housing commissionerate may be strengthened with adequate statistical staff.
(v) In order to have efficient collection & compilation of statistics at the Housing Commissioner Office under the Housing Department, it is suggested to transmit the data on housing statistics collected and compiled by DES to Housing Commissioner Office on a real time basis.
(vi) A detailed spatial survey for ascertaining the qualitative and quantitative shortage in housing in the state may be conducted. The estimated cost of conducting the survey is `. 50 lakh.
5.29 Statistics of Birth and Death and Population The registration authorities may be provided with scanning machines for
scanning of photos of couples so that registration of marriages can be computerised and marriage certificates can be issued on-line. It will facilitate the collection of data on marriages. The quality check of birth and death registration records also needs to be introduced on a sample basis. The issue of medical certification of causes of death may be pursued with the health officers being paid by the DES.
5.30 Electricity Production and Distribution Statistics The DES may constitute a coordination Committee and hold periodic
meetings to strengthen reporting mechanism relating to electricity production and distribution statistics in the State.
5.31 Improvement of Forest Statistics Considering the fact that about one-third area of the State is under forest
and its contribution to both its economy and natural environment is significantly high, availability of reliable forest statistics on time assumes considerable importance. The major elements in strengthening of forest statistics relate to migration of the existing FMIS to FOSS, improving the data capturing mechanism from the field by using PDAs, replacement of unserviceable computers and introduction of citizen centric on-line services. The details are furnished below:
(i) Development of Citizen Centric on-line Services
As per the order of the Supreme Court permission from Central Empowered Committee is required for starting any wood based industrial unit in the country. Central Empowered Committee has constituted State Level Committee for scrutiny of applications and issuance of NOC to the wood based industries. The NOC is issued for a period of five years. At

111
present the entire work flow for the issuance of NOC is being done manually. There is an urgent need of an on-line module which would provide automated processing of issuance of NOC for saw mill owners to start/renew/cancel wood based industries in Kerala. Moreover, the database so generated will provide a real time scenario of the distribution of wood based industries in Kerala state. This will give a frame for collecting statistics on wood based industries in the state. The Department intends to develop one more citizen centric online service for Elephant ownership and Transportation Permit which would enable the Department for the issuance of hassle free ownership and transportation permit and further to make the up-to-date database corresponds to the captive elephants in Kerala.
(ii) Migration of FMIS (Forest Management Information System)
modules to FOSS (Free and Open Source Software)
Various FMIS modules as listed below developed in Oracle 6i (forms) and 9i (database) by M/s RITES India Ltd., were in standalone system and are not having the facility of online data transfer. Upgradation of Oracle to higher version which is having online facility is also exorbitant. Hence, the Department intends to migrate the modules from Oracle to Free and Open Source Software in order to make the applications online. The work of migration of modules such as Offence Information, Court case and Fire Management module has been entrusted to KELTRON. Remaining 13 modules also require to be migrated in order to make available the modules online in all offices through the web-portal of KFD. Once it is done the statistics on management activities in the Department can be generated in no time and which will be much useful for the preparation of yearly Forest Statistics and better management of the department.
Sl.No FMIS Modules 1. Natural Forest Management (NFS) 2 Civil Infrastructure System (CIS) 3 Stores, Tools & Plants (STP) 4 Plantation Management System 5 Offence Information System 6 Court Case Monitoring System 7 Industrial Raw Material (IRM) 8 Sales Management System 9 Progress Report System (PRM)
10 Participatory Forest Management (PFM) 11 Fire Management System 12 Research Project System (RPM) 13 Social Forestry & Nursery Management 14 Forest Development Agency Accounting (FDA 15 Monthly Accounts System (MAS)

112
(iii) PDAs for onsite data capture.
Personal Digital Assistant (PDA) is a hand held device that combines computing, telephone, camera, Internet and networking features. Many PDAs are fitted with Global Positioning System (GPS) receivers to provide real-time navigation and GIS maps also can be integrated with this. Data capturing in various applications will be done both in the field with the help of hand held Personal Digital Assistant (PDA) and in the various offices directly in computers. Capturing the data at source or where it originates is the basic principle behind any information system, as it not only distributes the workload but also saves time. Kerala Forest Department has already developed an application for data capture where it originates and would be designed in such a manner that data migration is possible from data collection devices either to servers in State level Data Center or to the computer in any of the remote offices. Also applications would be designed in such a way, that whatever data is being entered in the PDA would automatically be updated in the existing FMIS application in the department. PDAs combined with GPS, GSM, Camera, etc., are highly productive and efficient equipment which can help the forest guard in capturing and reporting sensitive information on a near real-time basis. The Department proposes for the procurement of 76 numbers of PDAs for disseminating to the field offices for data collection. Department has already developed modules for data collection on forest offences and forest fire statistics using PDA.
(iv) PCs to the Sub- offices
Kerala Forest Department has different sub units such as 13 Circles, 69 Divisions, 169 Ranges and 37 Timber Depots spreading all over Kerala. FMIS modules developed for data capture corresponds to the management activities in the Department have been installed in all the above offices. Moreover, the Department would like to implement common modules developed by NIC for implementation in government Departments. The PCs already available in the sub offices which were procured during 2004 are out dated and the Department intends to replace these outdated PCs. KFD has 288 sub offices. Hence, the provision for the procurement of 288 PCs is included in the proposal. This will ensure error free, reliable and timely data collection using the modules mentioned above.
Table 5.7
Sl. No
Item Qty (No)
Rate (`. lakh)
Amount (`. lakhs)
1 Citizen Centric on-line Services 2 12.5 25.00 2 Migration of FMIS modules to
FOSS 10 3.0 30.00
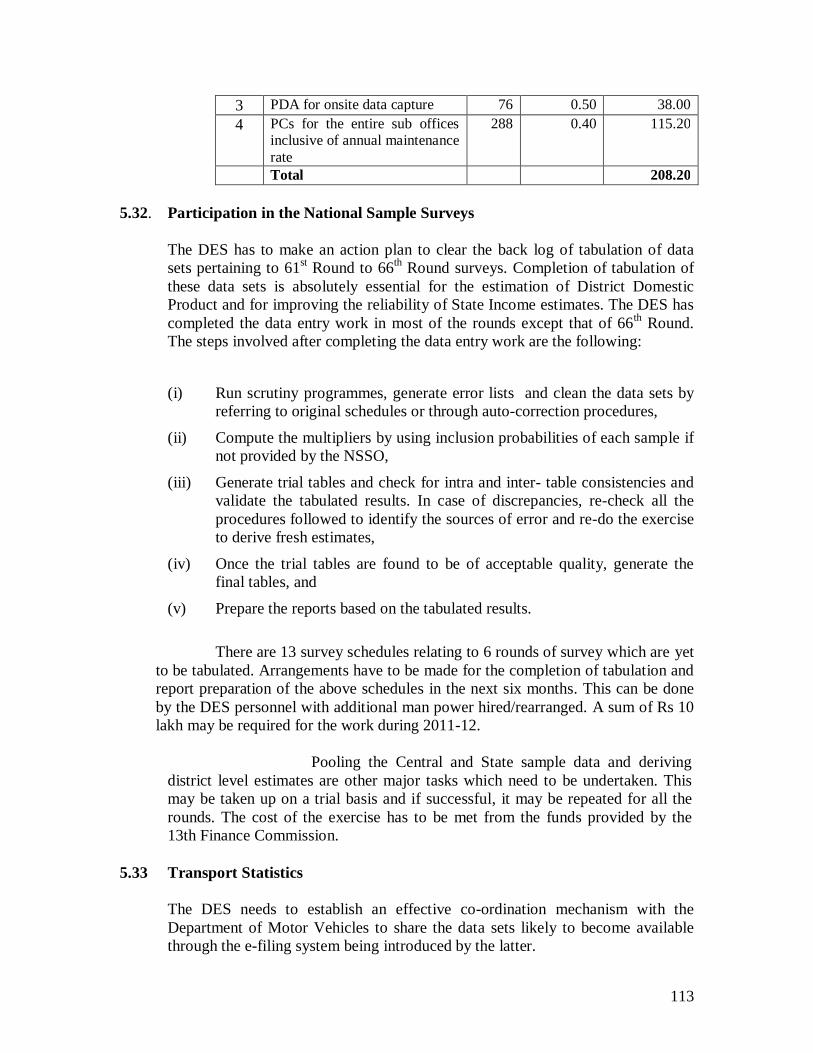
113
3 PDA for onsite data capture 76 0.50 38.00 4 PCs for the entire sub offices
inclusive of annual maintenance rate
288 0.40 115.20
Total 208.20 5.32. Participation in the National Sample Surveys The DES has to make an action plan to clear the back log of tabulation of data
sets pertaining to 61st Round to 66th Round surveys. Completion of tabulation of these data sets is absolutely essential for the estimation of District Domestic Product and for improving the reliability of State Income estimates. The DES has completed the data entry work in most of the rounds except that of 66th Round. The steps involved after completing the data entry work are the following:
(i) Run scrutiny programmes, generate error lists and clean the data sets by referring to original schedules or through auto-correction procedures,
(ii) Compute the multipliers by using inclusion probabilities of each sample if not provided by the NSSO,
(iii) Generate trial tables and check for intra and inter- table consistencies and validate the tabulated results. In case of discrepancies, re-check all the procedures followed to identify the sources of error and re-do the exercise to derive fresh estimates,
(iv) Once the trial tables are found to be of acceptable quality, generate the final tables, and
(v) Prepare the reports based on the tabulated results.
There are 13 survey schedules relating to 6 rounds of survey which are yet to be tabulated. Arrangements have to be made for the completion of tabulation and report preparation of the above schedules in the next six months. This can be done by the DES personnel with additional man power hired/rearranged. A sum of Rs 10 lakh may be required for the work during 2011-12.
Pooling the Central and State sample data and deriving
district level estimates are other major tasks which need to be undertaken. This may be taken up on a trial basis and if successful, it may be repeated for all the rounds. The cost of the exercise has to be met from the funds provided by the 13th Finance Commission.
5.33 Transport Statistics The DES needs to establish an effective co-ordination mechanism with the
Department of Motor Vehicles to share the data sets likely to become available through the e-filing system being introduced by the latter.

114
The Road Wing of the PWD also has to be persuaded through the Government to
establish the Road Information System as envisaged under the World Bank assisted project.
5.34. Statistics of Local Level Planning Information Kerala Mission (IKM) has been working with the local bodies
for the computerisation of various activities and several software packages have been developed by them. The packages thus developed are being implemented as per approved project proposals sent by the Panchayats. There is, however, no holistic computerisation plan taking into account all the activities and functions of local bodies. The local bodies are also neither fully aware of the benefits likely to accrue due to total computerisation nor they are compelled to take up such efforts. However, many of the Panchayats and Corporations have gone ahead with the computerisation of some of their activities and some others have sought the assistance of IKM. While it is a positive development, there are still several issues to be sorted out for bringing up all the local bodies to a minimum a level of computerisation and data generation. Data capturing from the local bodies without computerisation will be a futile exercise as the data will not be easily available on a uniform basis.
There are 152 Extension Officers of the Department of Statistics and 240 Technical Assistants of IKM placed in Block Panchayats. The Extension Officers are assigned the work of compiling progress reports of various schemes while the Technical Assistants are required to provide support for computerisation of various activities. The Panchayat Officials are, however, not yet aware of the role of the Technical Assistants in their functioning. The Extension officers are also not performing strictly any statistical functions. There is also little co-ordination between the DES, IKM and LSGD Department.
The way forward to ensure proper utilisation of manpower resources and generation of reliable statistics of considerable importance would be the following:
(i) Constitute a Co-ordination Committee under the Chairmanship of the Secretary, LSGD with the Heads of the Departments of Rural Development, Economics and Statistics, IKM as members. The other members of the Committee may include representatives of Planning Board, Directors of the departments of Health Services, Social Welfare, Agriculture, Animal Husbandry and Education. Two external experts may also be included in the Committee.
(ii) The DES may prepare a working paper containing details of data requirements, formats in which data are required, the sources from which the data can be extracted and current availability of the data.

115
(iii) The IKM may prepare a working paper indicating the details of computerisation activities undertaken, current projects, the requirements of a holistic computerisation program, current availability of hardware and software and the requirement of process engineering.
(iv) The above working papers may be presented before the Coordination Committee and assess how far the statistical requirements indicated by the DES can be collected as per the existing level of computerisation, and evolve a plan of action for the collection of those data sets by utilising the services of the existing personnel both of the DES and the IKM.
(v) Also evolve a time frame for total computerisation of all the activities of local bodies along with requirements of Government support and budget requirements.
(vi) Organise District level workshops of local bodies and present the action plan including the data collection formats. Modify the action plans and data collection formats on the basis of the discussions in the meetings.
(vii) Strengthen the local level database by replicating the Malappattam model.
(viii) Implement the total computerisation plan in five Panchayats on a pilot basis and extend the same to all Panchayats after incorporating the modifications if any.
(ix) Operationalise data sharing mechanisms by all the line Departments with the local bodies from the existing data collection and transmission system.
(x) Work out the details of creating District level databank jointly by the DES, IKM and LSGD Departments and equip the District Statistical Offices to create and maintain the Databank updated on an yearly basis.
An adhoc allocation of `.2.5 core may be provided at the rate of `.50 lakh per year for strengthening the local level database, the preparation of working papers, holding of workshops, developing and printing of data collection formalities, augmenting the statistical infrastructure of the local bodies and developing data capturing softwares.
5.35 Gender Statistics The DES may commission atleast one Time Use Survey to understand the
time utilisation pattern of men and women in Kerala in biological, social, economic and recreational activities and to assess the burden of women in domestic and care activities. Yet another survey of social significance would be to conduct a survey to assess the intra-household variations in consumption, educational and economic attainments in different categories of households. These two surveys may cost about `. 150 lakh. The DES should also examine whether male and female break ups are available on all statistical publications and if not action should be taken to introduce the same.
116
5.36 Unorganised Sector Statistics The DES may look at the reports of the National Commission for
Enterprises in the Unorganised Sector and undertake similar studies on unorganised sector. The data sets relating to unorganised manufacturing and services sector industries and employment-unemployment surveys may be used for the purpose. A sum of `.50 lakh each may be provided for the purpose for the years 2011-12 and 2014-15.
5.37 Poverty Statistics
The DES may commission a study to develop a methodology for the estimation of district level poverty based on data sets available from various sources including different rounds of National Sample Surveys and National Family Health Surveys. A sum of `.25 lakh may be provided for the purpose.
5.38 Services Sector Statistics While survey of business establishments based on business register is the
long time solution, the DES may start utilising the balance sheets of large establishments in Kerala for the compilation of value addition by the organised sector service industries. The DES may seek the services and training of CSO for the purpose.
5.39 Human Development Statistics
Strengthening of local level statistics and computation of District Income Estimates are essential for preparing sub-state level human development reports.
5.40 Statistics of Non-Resident Keralites The methodology for the compilation of statistics of Non-Resident
Keralites may be finalised with the help of the Technical Advisory Committee and conduct periodical surveys once in five years. The first survey may be conducted in 2011-12 for which funds have already been provided.
5.41 Summary of Funds Requirements
The funds requirement for the implementation of the Plan during the next five years will be `.5271.83 lakh with `.2573.55 Lakh as capital expenditure. The year-wise break of expenditure for various activities is given in Table 5.8.
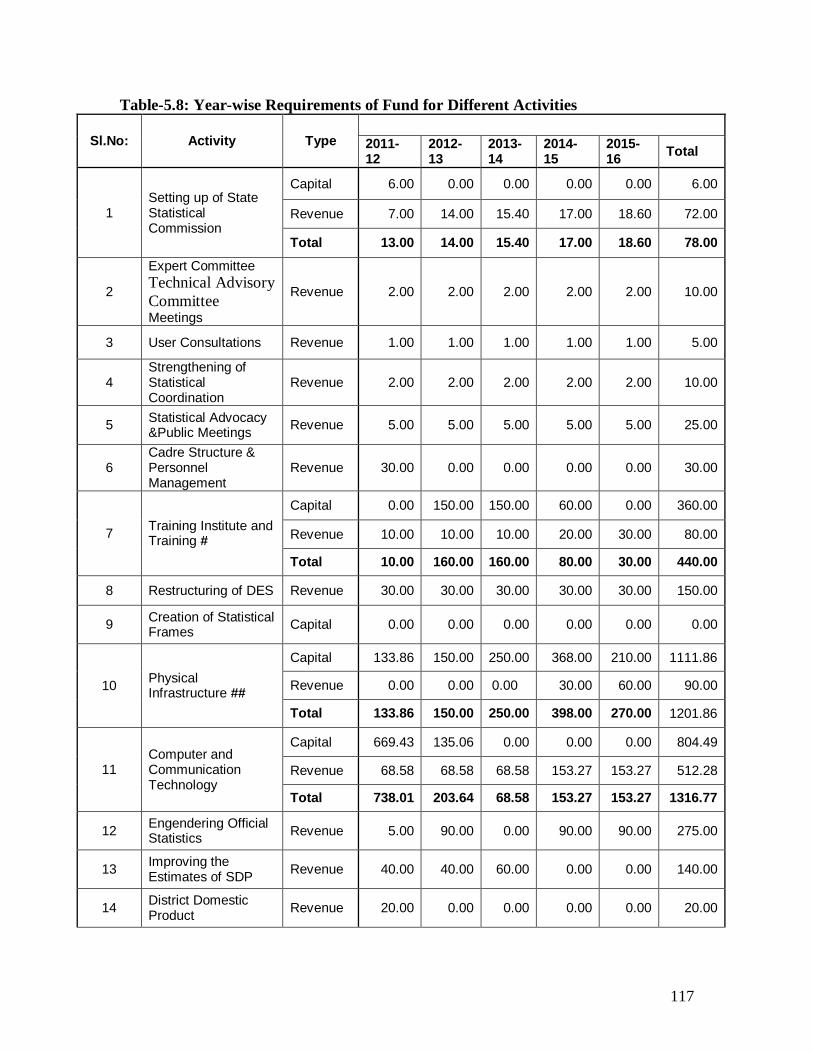
117
Table-5.8: Year-wise Requirements of Fund for Different Activities
Sl.No: Activity Type
2011-12
2012-13
2013-14
2014-15
2015-16 Total
1 Setting up of State Statistical Commission
Capital 6.00 0.00 0.00 0.00 0.00 6.00
Revenue 7.00 14.00 15.40 17.00 18.60 72.00
Total 13.00 14.00 15.40 17.00 18.60 78.00
2
Expert Committee Technical Advisory Committee Meetings
Revenue 2.00 2.00 2.00 2.00 2.00 10.00
3 User Consultations Revenue 1.00 1.00 1.00 1.00 1.00 5.00
4 Strengthening of Statistical Coordination
Revenue 2.00 2.00 2.00 2.00 2.00 10.00
5 Statistical Advocacy &Public Meetings Revenue 5.00 5.00 5.00 5.00 5.00 25.00
6 Cadre Structure & Personnel Management
Revenue 30.00 0.00 0.00 0.00 0.00 30.00
7 Training Institute and Training #
Capital 0.00 150.00 150.00 60.00 0.00 360.00
Revenue 10.00 10.00 10.00 20.00 30.00 80.00
Total 10.00 160.00 160.00 80.00 30.00 440.00
8 Restructuring of DES Revenue 30.00 30.00 30.00 30.00 30.00 150.00
9 Creation of Statistical Frames Capital 0.00 0.00 0.00 0.00 0.00 0.00
10 Physical Infrastructure ##
Capital 133.86 150.00 250.00 368.00 210.00 1111.86
Revenue 0.00 0.00 0.00 30.00 60.00 90.00
Total 133.86 150.00 250.00 398.00 270.00 1201.86
11 Computer and Communication Technology
Capital 669.43 135.06 0.00 0.00 0.00 804.49
Revenue 68.58 68.58 68.58 153.27 153.27 512.28
Total 738.01 203.64 68.58 153.27 153.27 1316.77
12 Engendering Official Statistics Revenue 5.00 90.00 0.00 90.00 90.00 275.00
13 Improving the Estimates of SDP Revenue 40.00 40.00 60.00 0.00 0.00 140.00
14 District Domestic Product Revenue 20.00 0.00 0.00 0.00 0.00 20.00

118
15 Crop Area and Production Estimates Revenue 75.00 75.00 250.00 175.00 0.00 575.00
16 Consumer Price Index Numbers Revenue 84.00 0.00 0.00 0.00 0.00 84.00
17 Health, Morbidity, Mortality & Family Welfare Statistics
Capital 50.00 0.00 0.00 0.00 0.00 50.00
18 Education and Literacy Statistics
Capital 20.00 10.00 0.00 0.00 0.00 30.00
Revenue 0.00 0.00 15.00 0.00 0.00 15.00
Total 20.00 10.00 15.00 0.00 0.00 45.00
19 Housing Statistics Revenue 50.00 0.00 0.00 0.00 0.00 50.00
20 Improvement of Forest Statistics Capital 100.00 108.20 0.00 0.00 0.00 208.20
21 Participation in the National Sample Surveys
Revenue 10.00 0.00 0.00 0.00 0.00 10.00
22 Statistics for Local Level Planning Revenue 50.00 50.00 50.00 50.00 50.00 250.00
23 Gender Statistics Revenue 75.00 0.00 75.00 0.00 0.00 150.00
24 Unorganised Sector Statistics Revenue 50.00 0.00 0.00 50.00 0.00 100.00
25 Poverty Statistics Revenue 25.00 0.00 0.00 0.00 0.00 25.00
26 Registrar of Cooperative Society Capital 3.00 0.00 0.00 0.00 0.00 3.00
27 Evaluation of implementation of KLSSSP
Revenue 0.00 10.00 0.00 10.00 0.00 20.00
Total
Capital 982.29 553.26 400.00 428.00 210.00 2573.55
Revenue 639.58 397.58 583.98 635.27 441.87 2698.28
Total 1621.87 950.84 983.98 1063.27 651.87 5271.83 # The components under this item include building construction, equipments, ICT infrastructure, transport facility, hostel facility and associated training expenses. ## The components under this item include construction cost of 28 Taluk offices, cost of furniture, transportation facility and maintenance cost. The improvement of statistical coordination and ensuring quality standards through setting up the State Statistical Commission and Technical Advisory Committees and revising the methodologies and updating the tabulation of data sets already collected are the activities which need to be taken up as the first step. These activities also do not involve much expenditure. Statistical capacity building, re-organisation of the
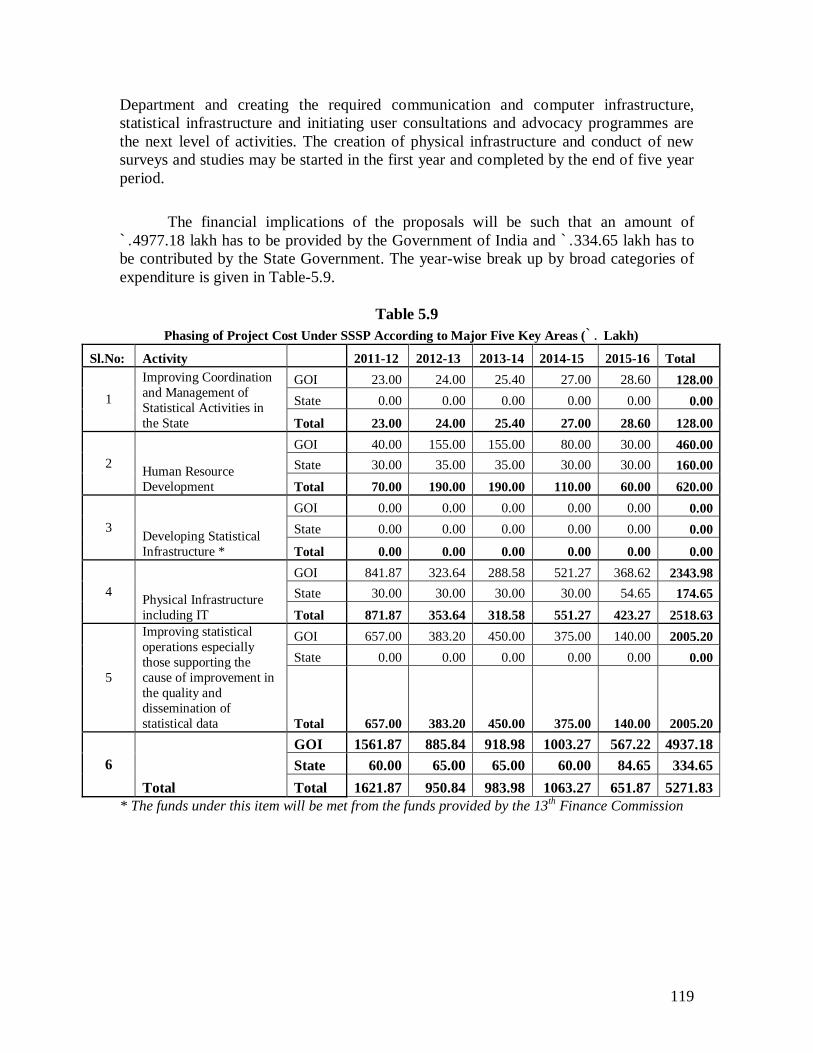
119
Department and creating the required communication and computer infrastructure, statistical infrastructure and initiating user consultations and advocacy programmes are the next level of activities. The creation of physical infrastructure and conduct of new surveys and studies may be started in the first year and completed by the end of five year period.
The financial implications of the proposals will be such that an amount of `.4977.18 lakh has to be provided by the Government of India and `.334.65 lakh has to be contributed by the State Government. The year-wise break up by broad categories of expenditure is given in Table-5.9.
Table 5.9 Phasing of Project Cost Under SSSP According to Major Five Key Areas (`. Lakh)
Sl.No: Activity 2011-12 2012-13 2013-14 2014-15 2015-16 Total
1
Improving Coordination and Management of Statistical Activities in the State
GOI 23.00 24.00 25.40 27.00 28.60 128.00 State 0.00 0.00 0.00 0.00 0.00 0.00
Total 23.00 24.00 25.40 27.00 28.60 128.00
2 Human Resource Development
GOI 40.00 155.00 155.00 80.00 30.00 460.00 State 30.00 35.00 35.00 30.00 30.00 160.00 Total 70.00 190.00 190.00 110.00 60.00 620.00
3 Developing Statistical Infrastructure *
GOI 0.00 0.00 0.00 0.00 0.00 0.00 State 0.00 0.00 0.00 0.00 0.00 0.00
Total 0.00 0.00 0.00 0.00 0.00 0.00
4 Physical Infrastructure including IT
GOI 841.87 323.64 288.58 521.27 368.62 2343.98 State 30.00 30.00 30.00 30.00 54.65 174.65 Total 871.87 353.64 318.58 551.27 423.27 2518.63
5
Improving statistical operations especially those supporting the cause of improvement in the quality and dissemination of statistical data
GOI 657.00 383.20 450.00 375.00 140.00 2005.20 State 0.00 0.00 0.00 0.00 0.00 0.00
Total 657.00 383.20 450.00 375.00 140.00 2005.20
6 Total
GOI 1561.87 885.84 918.98 1003.27 567.22 4937.18 State 60.00 65.00 65.00 60.00 84.65 334.65 Total 1621.87 950.84 983.98 1063.27 651.87 5271.83
* The funds under this item will be met from the funds provided by the 13th Finance Commission

120
Chapter 6 Monitoring, Reporting and Evaluation
6.1 Introduction
The monitoring system of SSSP- Kerala is intended to provide information on the following two major areas
(i) Process/ steps/ actions/ performance/ achievements/ /benchmarks (Format – I)
(ii) Outputs and outcomes ( Format - II)
Monitoring indicators in respect of output and outcomes would contain data on the following key elements of the strengthened state statistical system; (i) Indicators of performance of statistical system as a whole
(ii) Indicators of data availability (iii) Indicators of data quality
(iv) Indicators of data accessibility 6.2 Outputs and Outcomes:
Goals and strategies in respect of various fields of statistical activities are
expected to result in strengthening of statistical system in the state. SSSP - Kerala are expected to produce the following specific results.
6.2.1 Outputs
(i) Setting up of Kerala State Statistical Commission and formation of Technical Advisory Committees for identified statistical areas
(ii) DES to be the statistics authority of the state with effective discharge of the role of nodal statistical agency.
(iii) Effective co-ordination of data producers and users. (iv) Extensive use of ICT in all areas of data management (transmission,
compilation, validation, retrieval and dissemination) (v) Establishment of Kerala Statistical Training & Research Institute (SASA)
(vi) Effective implementation of capacity building programmes to increase the data management skills of statistical manpower in the department

121
(vii) Creation of posts of statistical personnel in identified key areas and re-deployment of statistical personnel in all field zones and statistical cells of line departments.
(viii) Commencement of following statistical exercises
i. Estimates of District Domestic Product. ii. Estimation of contribution of Local bodies.
iii. Generation of basic statistics for local level development iv. Generation of statistics on 7 emerging areas
(ix) Framing of data dissemination policy of the department, timely release of data in print and digital media and operationalization of state data warehouse
(x) Setting up of modernized Taluk Statistical Offices with improved statistical and physical infrastructure
(xi) Commencement of statistical frame creation work in DES
(xii) Effective statistical advocacy programmes and increased public image for DES
6.2.2 Outcomes
(i) DES becoming the statistical service provider ensuring generation of
reliable, timely and credible social and economic statistics for data based decision making and for promoting research
(ii) Statistical system that follows standard methodologies for quality data on time
(iii) Dissemination of data according to a data release calendar. (iv) Publication of analytical reports enabling micro planning and operation
research. (v) Improved local level planning by local self government institutions in the
state. (vi) Data generation on key indicators of social and infrastructural
development. (vii) Analysis of data to monitor outcome indicators of project implementation
6.3 Reporting Monthly Progress Report (MPR) in prescribed format shall be collected
from implementing units to watch the progress of implementation of KLSSSP action plan. The Project Implementation Cell (PIC) shall report the progress of all activities of the project to the Director of Economics and Statistics, Secretary Planning & Economic Affairs Department and CSO on or before 10th of

122
succeeding month. This should be reviewed in the monthly review meetings chaired by the Secretary, Planning & Economic Affairs Department. The quarterly progress report should be placed before the PMT and the half yearly report before the State High Level Steering Committee for review and proper implementation of KLSSSP. The Action Taken Reports collected monthly from all line departments shall be reviewed by DES and reported to the Secretary Planning & Economic Affairs. Detailed annual report of KLSSSP shall be prepared and presented to the State High Level Steering Committee. The periodical reports shall be furnished to the Government of India as prescribed by them. All the progress reports and the annual report would be disseminated through the DES website.
6.4 Evaluation The project will be implemented during five year period from 2011-12 to
2015-16.Two evaluation studies shall be undertaken on the implementation of KLSSSP; one midterm evaluation during third quarter of 2012-13 and another during 2014-15. The mid term evaluation study shall focus on the effectiveness of strategies in achieving the set goals and in detecting shortfalls and constraints in implementation of the project. It would list success stories and failures based on the results of performance indicators and recommend measures to achieve the desired output and outcomes of the project during the remaining period. The end evaluation would assess status of State Statistical System and identify the actions further needed for its development. These evaluation study reports shall be placed before the State High Level Steering Committee for guidance, review and corrective actions by the concerned departments.
6.5 Field Verification The monitoring system has to be supplemented by on-the-ground
observation through periodic field visits to each districts/Taluks which could be used to validate/verify the reporting. The visit should include a forum with all the stakeholders and participants in KLSSSP to obtain direct reactions from all participants especially line departments and other data users.

123
Annex-1
Area and Cost of Construction of Different Offices
Sl No Office Total (Sq ft)
Area Cost (Rs)
1 TSO Hosdurg 1721.14 3442280 2 TSO Sultan Batheri 888.14 1776280 3 TSO Vythiri 1035.14 2070280 4 TSO Ambalappuzha 692.14 1384280 5 TSO Kuttanad 692.14 1384280 6 TSO Karthikappalli 839.14 1678280 7 TSO Thirur 1819.14 3638280 8 TSO Udumbuchola 1035.14 2070280 9 TSO Kottarakkara 1231.14 2462280
10 TSO Kollam 1133.14 2266280 11 TSO Nedumangad 1182.14 2364280
12 TSO Thiruvananthapuram 1084.14 2168280
13 TSO Chirayinkil 1133.14 2266280 14 TSO Chittur 1231.14 2462280 15 TSO Ottappalam 1917.14 3834280 16 TSO Palakkad 1084.14 2168280 17 TSO Alathur 1035.14 2070280 18 TSO Kozhenchery 888.14 1776280 19 TSO Ranni 545.14 1090280 20 TSO Changanacherry 937.14 1874280 21 TSO Kottayam 1182.14 2364280 22 TSO Vaikom 937.14 1874280 23 TSO Koyilandi 1280.14 2560280 24 TSO Kannur 986.14 1972280 25 TSO Thalipparambu 1868.14 3736280 26 TSO Kochi 545.14 1090280 27 TSO Thalappally 1133.14 2266280 28 TSO Kunnathur 594.14 1188280
Total 61299840

124
Annex-II 1. ICT Infrastructure Requirements
An overview of the Current ICT Infrastructure
Presently, the DES has a website which is hosted in the State Data Centre. It also has
minimum ICT infrastructure at the Directorate, District and Taluk levels with limited or
no network connectivity. Even though the Department has highly qualified human
resources in all its cadres, the lack of adequate ICT infrastructure had badly affected the
day-to-day activities of the Department. The details of the ICT infrastructure available
with the DES are given in Appendix II.
Some of he key e-governance activities that are operational with the existing ICT
infrastructure are given below:-
Tabulated results of data colleted through Census/Survey or from secondary
sources are provided to Central and State Government agencies, State Planning
Board, Researchers & other data users.
Monthly Consumer Price Indices of Agricultural and Industrial workers are
published in the website which are used for fixation of wages under Minimum
Wages Act.
Prices of essential commodities colleted are also published daily through website.
The data collected under EARAS scheme are being supplied for implementing
National Insurance Scheme (NIS) for cultivators and also annual reports under
this scheme are published on the website.
The website is being updated daily and data users can access usable information
at their finger tips.
Local level Statistics collected are provided to the Local Bodies for formulating
their plan proposal as a part of decentralized planning.
Soft copies of the published data are provided for the users through Information
centres functioning at Taluk, District and Directorate.

125
Need for ICT
At present, the DES website has only static pages with informational services. As part of
the project, the DES proposes to have a portal with web based data storage and online
data transmission facilities which shall be hosted in a State Data Centre, owned by the
Government of Kerala. The portal shall be accessed by the users and the beneficiaries
through a dedicated and reliable Wide Area Network, by using Kerala State Wide Area
Network (KSWAN) as the network backbone. Minimum level of other ICT infrastructure
such as PCs and peripherals also have been proposed for various offices. The ICT
infrastructure requirements proposed are based on leveraging the optimum utilization of
the existing ICT infrastructure available with the DES and the Government.
Department requires a centralized web-based online system. Under the proposed system,
the data collected through various surveys shall be entered at lower (field/taluk) level and
shall be transmitted to the Data Centre through a robust network, which can be viewed by
the Departmental users based on their access rights. Such a common centralized system
shall also enable each of the Department users to carry out their day-to-day activities
through the system, depending on their roles. The major considerations with respect to
the data flow, while designing such a system are :-
Data collection at field is in printed schedule or through PDA system.
If the data are collected in printed schedule, they shall be pooled in the Taluk for
data entry
The scrutinized schedules shall be digitized by entering data on line through
the web based application.
If the data are collected through PDA system, the data are transmitted to the data
Centre by uploading data to the website.
Based on the type of data and access rights, the data shall be released from Taluk
to District and then Headquarters for processing.
The data shall be verified with respect to the sections and a concurrent note shall
be issued to Computer Division for downloading and processing the data.
The data processing and table generation will be undertaken as per the
requirement of the section.

126
The analytical report will be prepared in the respective sections and uploaded in
the web site for the benefits of the data users.
ICT infrastructure requirements
Proposed ICT solution for DES
A comprehensive, secured and scalable web based solution is being proposed for the
DES. This solution will be an integrated online system, which will be built on using Open
Source Technologies (J2EE) such as JSP, JavaScript, AJAX, and Servlets with backend
MySql /PostGres or any RDBMS. The technical architecture comprises of n-tier
architecture, with each tier segregated to perform specific defined tasks.
The preferred RDBMS is MySql /PostGres which is fast, open-source, robust database
which can integrate seamlessly with a number of programming languages and other web-
based technologies and compatible.
It is proposed that the DES will have a centralized deployment model with the Central
Server Unit being at the Kerala State Data Centre and all other locations being client to it,
connected through Kerala State Wide Area Network (KSWAN) backbone. The indicative
requirements for the servers are given below:-
Server Quantity Type Application Server 2 (Production + Backup)
Intel Based High end System Database Server 2 (Production + Backup) Web Server 2 (Production + Backup)
a. Solution Architecture
The proposed technical solution will be a Web based solution on n-tier architecture, with
each tier segregated to perform various tasks. The following layers/tiers are being
proposed for the development of the application;
Presentation Layer
Service Layer
Business Logic Layer
Data Access Layer
Entity Objects

127
The proposed solution architecture is Flexible; Interoperable, Scalable and Secured. The
features of the solution architecture are explained below:-
The Presentation tier will have the user interfaces, which will be used for gathering
inputs from the end-users. This tier will ensure user friendliness and easy to navigate
during data entry operations which leads to less effort and time. Most of the items will
have selectable data from lists and a very few items will be enterable.
The Service tier will enable data exchange across external stakeholders on open
standards. This tier will have web methods, which will be consumed in a secured manner
by any external application. This ensures seamless data interchange between
heterogeneous systems and external stakeholders.
The Business tier will have Business components pertaining to various modules of the
applications in addition to Business Work flow processes. All business rules will be
embedded in this tier. Whenever there is a change in the business rule, only this tier
needs to be modified and deployed without disturbing the entire solution, which in turn
ensures smooth functioning of existing applications in the solution.
The Data tier will have Data access methods pertaining to various modules of the
application in addition to Data components. All Database objects will be accessed only
through this tier, which ensures enhanced security to the data. This tier is generic to any
backend RDBMS.
In addition to the above tiers, there will be a set of Entity Objects, which acts as
intermediate data containers accessible vertically across all tiers. These entity objects act
as data carriers in and out of different tiers.

128
Jdeveloper/Eclipse SQL/PHP
J2EE Servlets Ireport/Jasper
JSP XML AJAX
Tools & Technologies
IES Database
JDBC Connection Components
Data Access Methods
Database Access Tier
Audit Management System
Management Information System
Data Access Components
Connection Object Datasets
Transaction Object Command Object
Table Adapters
Audit Management SystemManagement Information System
Business Work Flow
Presentation Tier (User Interfaces)
Business Components
External Entities 1
Service Tier
Web Services Service AgentsEntItY
Objects
IES MIS
Integrated Ecostat System Audit Management SystemManagement Information System
Integrated Ecostat System Internal Stakeholders
User
Illustrative Solution Architecture for Integrated Ecostat System
XML based Data exchange
External Entities
External Stakeholders
External Entities 2
Integrated Ecostat System
Integrated Ecostat System
Fig 1 : Illustrative Solution Architecture
129
Deployment Architecture
The proposed solution will be developed and deployed using Open source technologies.
It is proposed to utilize the existing State Data Centre facilities. The Production setup will have a Web/Application server for hosting of the application, a
Directory Services server for Authentication and Authorization of users, an Anti-virus
server for automated updation/distribution of virus definitions and patches to Intranet
clients/servers, a Proxy server for providing Internet access to the Intranet clients/servers
and two Database servers configured in Clustered mode for centralized storage and
access of DES data.
The Backup setup will have a replica of all servers listed under the Production setup. This
database server will be configured in such a way that Data replication (Snapshot) will
happen at defined intervals in a scheduled manner. The entire Backup setup has been
proposed with a view of instant take over in case there is a failure of any server in the
Production setup.
Access to the application will be through hardware firewall configured at the State Data
centre. The database will be accessed only through the Data tier of the proposed
application.
All servers and clients in the DES Office will be on Intranet Zone, configured with
Private IP addresses. Direct access over the Internet to any of the servers will not be
allowed. As a security measure only required and relevant network ports related to the
offered services will be open and all other network ports will be blocked at the hardware
firewall level itself.
All other sub-ordinate offices of DES will connect through the Internet to the centralized
setup through the firewall and access the proposed application. They shall make use of
KSWAN wherever available or can be connected using 2Mbps leased line.
The following diagram provides indicative deployment architecture of the DES portal.

130
Fig 2 : Deployment Architecture

131
Proposed ICT solution components
The following is a summary list of major components of the DES solution.
Sl No. Component Description
1 DES Portal DES solution shall be a browser based common interface made available to its end users through a portal. This portal will be a single window for catering to all the requirements of a DES user.
2 ICT Hardware The necessary ICT hardware shall be procured at the Directorate, District & Taluk statistical offices and Statistical cells of various line departments.
3 WAN
Centralized deployment architecture is being proposed for DES in order to provide access for the required solution components. KSWAN shall be used as the backbone for establishing the connectivity under this project wherein the various offices coming under the DES shall be connected to the nearest KSWAN PoP.
4 Data Centre The State Data Centre facilities provided by the Government of Kerala shall be leveraged for hosting the necessary infrastructure, which shall save additional investment for establishment of a datacenter facility.
The details of each of these solution components are given below:-
DES Portal
The DES Portal has to be developed for updating, processing, report generation and data
transmission. There is a need for a web based DES portal for data entry, validation,
transmission and retrieval of data. For this, web based software shall be developed for all
the 20 core statistical activities. The major functionalities proposed as part of this are:-
Data entry facilities for various departments/users based on their access rights.
Built-in work flow mechanism for day-to-day activities.
Advanced Data Search & Retrieval facilities
Download of reports based on time series data and need based MIS.
User registration/membership/registered user’s management facilities
E-payment/internet banking facilities
Administrative functionalities
Integration with other applications of the State such as SPARK etc.
ICT Hardware
The proposed ICT hardware consists of:-

132
Servers and Storage Devices: - Servers consisting of Database(for data analysis,
storage, data manipulation, archiving and other non-user specific tasks),
Application (for the efficient execution of procedures) and Web Servers and
storage devices which includes SAN storage( for connecting all the storage
resources connected to various servers). These servers and storage device shall be
kept at the State Data Centre.
Computers with necessary accessories:- Computers include both Desktop
computers & multi computing devices (along with accessories such as UPS etc.)
and Laptops for efficient online data transmission. This shall be provided at the
Directorate, District and Taluk offices. It is proposed that Laptops shall be given
to the officials the Director/additional/director level for easy mobility.
Computer Peripherals :- Computer peripherals shall include Printers (Laser jet
printer with/without copier, Dot Matrix) and scanners, which shall be provided at
the Directorate, District and Taluk offices.
PDAs:- Eventhough DES wants to implement the Personal Digital
Assistants(PDAs)against the use of standard paper questionnaires for collecting
data, DES wants to assess the compatibility of the data files(which can impede the
ability to interpret data),a proper back-end database, an appropriate and adequate
back-up protocol and a good ‘fit’ between the technology and the study, it is
proposed to use the PDAs for the surveys related to Daily Price Index. Once this
is found successful, the Department shall roll out the use of PDAs for other
surveys and also to more field offices. The PDAs are proposed to be given at the
Taluk Statistical offices.
The break-up of the hardware along with the budgetary estimates are given in the section budgetary
estimates.
WAN Infrastructure
Government of Kerala has already established Kerala State Wide Area Network
(KSWAN), which will act as a backbone network of data, voice and video
communications throughout the State. The backbone of KSWAN consists of a resilient

133
ring linking three Network Operation Centres (NOCs) and all the District Headquarters
shall be connected to the nearest KSWAN NOC. Currently, there is a bandwidth of 6
Mbps between each district of the NOCs. Also, all the Block Headquarters in each district
are linked to the corresponding District headquarters (vertical connectivity) with 2 Mbps
bandwidth connectivity. Each of the District headquarters and block headquarters have
wireless base stations set up, with a range of 10 Kms. DES offices not in the line-of-sight
of the DHQ and BHQ can also be get connected to KSWAN through dial up, ISDN and
leased lines.
As the KSWAN is made operational, DES has identified the KSWAN as an element of
the core infrastructure for supporting the connectivity requirements of the DES. KSWAN
will connect to all the District Headquarters, Block Headquarters and to the departmental
offices. Under this project, DES shall establish horizontal connectivity for the
State/District/Taluk level offices of DES by connecting them to the nearest
SHQ/DHQ/BHQ PoP of the KSWAN backbone, so that there is a seamless integration
for voice, video and data services. If in any place, KSWAN facility is not available, then
the DES shall establish its own connectivity mechanism by tie-ups with the Service
Providers such as BSNL etc.
Data Centre
The DES shall host the ICT infrastructure in the State Data Centre (SDC) with the State-
of-the Art facilities to host the Servers and the Storage equipments proposed under the
project. The State Data Centre shall provide with the following:-
Secure hosting and Standard technologies;
Guaranteed service levels;
High quality support, operation and monitoring of departments' applications;
Data and Application availability seven days a week twenty-four hours a day;
Centralized network management and operations capability.

134
ICT Training & Manpower requirement
ICT Training
The DES has qualified hands in computer working in various levels. For implementing
the proposed total solution for computerization in the department, advanced training on
data administration is necessary for the persons working in the computer division of
Directorate and the computer units in District and Taluk Offices. Also there is a felt need
for training on data management and awareness about the system implementation in the
DES for the statistical personnel working in various sections in the Directorate and the
offices of Districts, Taluks and line departments. In this regard, the following training is
proposed.
Basic computer training and application training:- The basic computer training
shall include the basics of computer, day-to-day activities management etc. and
the application training shall include the training on the developed application
software. These training are proposed to be given to all the employees of DES.
Training of Trainers:- A selected few employees from the Directorate, District
and Taluk offices shall be given training on the computer and application software
who shall impart training to others.
Advance Computer & Network training:- shall be given to the selected employees
from the Directorate, District and Taluk offices who shall be given advanced
training especially with respect to the areas of system administration &
management, database administration and network administration.
ICT Manpower
Once the proposed ICT infrastructure is implemented in the DES, there is a need to
augment the same with sufficient manpower at the Directorate, District and Taluk levels.
Currently, even though the DES has qualified hands in IT, they are not properly deployed
for managing ICT related activities in the DES. In this context, it is proposed that the
following manpower with experience in IT shall be deputed to the Directorate, District
Offices and Taluk Offices.

135
I. Manpower requirement at the Directorate
Sl No. Name of Post Required No.
Suggested personnel
Qualification in IT other than Basic Qualification
1 IT Coordinator
1
Joint Director Qualification as per special rule with Degree Or Diploma in Computer Applications or 6 months certificate course in computer applications from a recognized institute. (the department has to give opportunity to undergo six months training course to those who do not possess the required qualification prior to their chance for promotion)
2 System Manager/ Database Admin
1
Deputy Director Qualification as per special rule with Degree or Diploma in Computer Applications or 6 months certificate course in computer applications from a recognized institute. (the department has to give opportunity to undergo six months training course to those who do not possess the required qualification prior to their chance for promotion)
3 Programmer/Network Manager 1
Research Officer/Senior Supervisor –MT Unit
Qualification as per special rule with Degree or Diploma in Computer Applications from a recognized institute.
4. Assistant Database Administrator 1
Computer Supervisor
Degree with Statistics as one of the subjects and Degree or Diploma in Computer Applications from a recognized institute.
5. Assistant Programmer 5
Statistical Assistant Gr I/II
Degree with Statistics as one of the subjects and Degree or Diploma in Computer Applications from a recognized institute.
Total 9
II. Manpower requirement at the District offices
Sl No. Name of Post Required No.
Suggested personnel
Qualification in IT
1 Data Manager
1
Research Assistant
Degree with Statistics as one of the subjects and Degree or Diploma in Computer Applications from a recognized institute.

136
The data processing and its management is one of the important job, because the
department has handling large volume of data in related with Censuses/Sample Surveys.
This data flow is daily/weekly/periodically. The data management, System management,
system analysis for software development on various surveys are very important for
successful implementation of computerization in the department. Hence a Database
Administrator and a Network Administrator are essential for the Department. Also, has
also been proposed for managing the day-to-day activities.
During the project implementation stage, the Department shall require the expertise of
two statisticians for the standardization of the data to be entered into the system. The data
standardization shall consist of the following major activities:-
Data verification on the basis of geographical boundaries;
Verification of data published by various agencies;
Estimation for missing data;
Verification of data trend in time series data;
Methodology and concept used in data collection;
Verification of typing error;
Verification of abnormal figures in the existing tables;
Column and row tallying problem in a table of data; and
concurrent verification till the finalisation of time series data
Project Implementation Plan
The tentative project plan for the implementation of the proposed ICT infrastructure is given below:-

137
Sl
No. Activity Months
1 2 3 4 5 6 7 8 9 10 11 12 13 14 15 16 17 18
1
Engagement of consultants, concept analysis, initial study & strategic planning
2
Preparation of System Architecture, RFP by consultants for system Integrator
3
Bid process and selection of system integrator
4 H/w deployment
5 Software development
6 Network implementation
7 User Training
8
Solution Acceptance Testing
9 Pilot Implementation
10 State-wide roll out
11 Programme Management
* The timelines mentioned here are from the date of approval of the plan.
Budgetary Estimates
For the purpose of budgetary estimations, the basic cost heads considered under the ICT
infrastructure are cost for the Hardware, Software, Networking, Workstation set-up, Data
digitization, Training & Consultancy costs. Please note that the figures are on estimated
basis only, actual price may vary to a certain extent. Based on the cost components
explained in the following sections, the estimated Capital Expenditure for the ICT
infrastructure of the Project is summarized in the following table:-

138
Capital Expenditure (CAPEX)
The break-up of the cost components at the Directorate Level, District level and Taluk level are given below.
S.No. Cost Head `. in Lakhs 1 Application Software
1.1. - Application Software 75.00
1.2. - Statistical package 3.00
2 Hardware
2.1. - Hardware at the Directorate 136.40
2.2. - Hardware at the District Statistical Offices 90.72
2.3. - Hardware at the Taluk Statistical Offices 153.42
2.4. - Hardware at the Statistical Cells 23.37
3 Network Infrastructure
3.1. - Networking at the Directorate 6.58
3.2. - Networking at the District Statistical Offices 22.12
3.3. - Networking at the Taluk Statistical Offices 81.13
3.4. - Internet connectivity at the Statistical Cells 1.23
4 Site Preparation
4.1. - Site Preparation 104.82
5 Data Digitization 5.1. - Data Digitization 22.71
6 Training & Change Management
6.1. - Training & Change Management 30.00
7 Manpower
7.1. - Consultancy 54.00
TOTAL 804.5
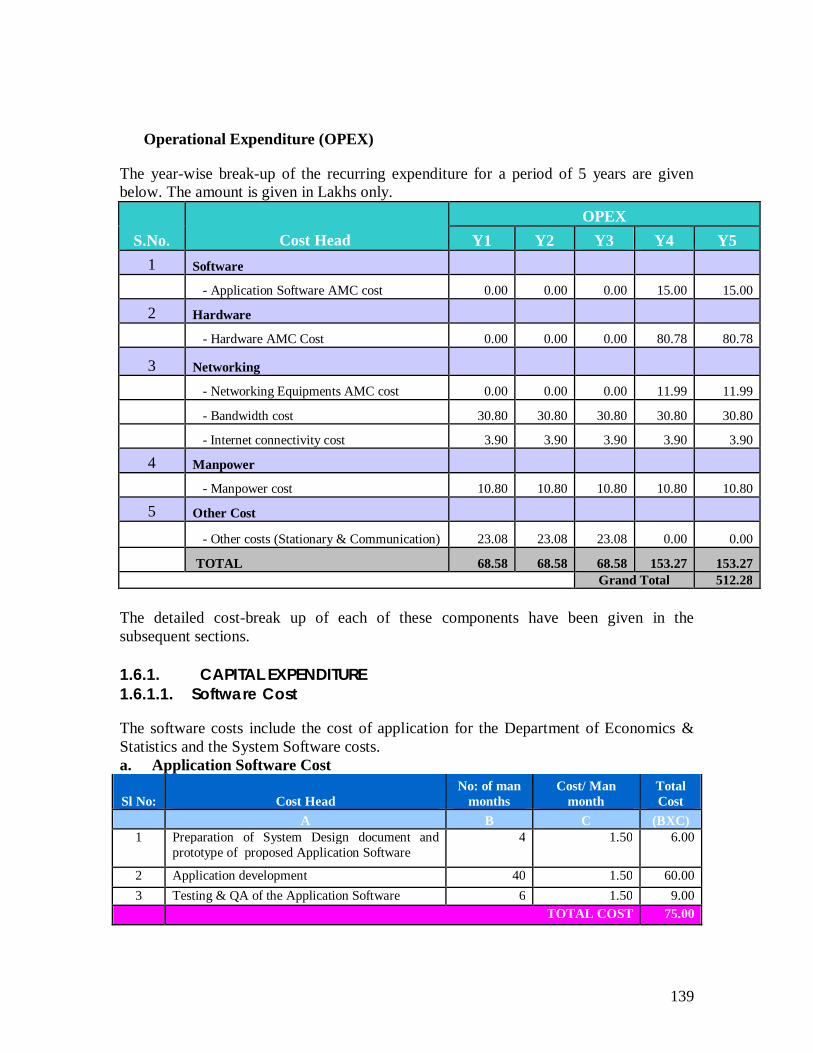
139
Operational Expenditure (OPEX)
The year-wise break-up of the recurring expenditure for a period of 5 years are given below. The amount is given in Lakhs only.
S.No. Cost Head OPEX
Y1 Y2 Y3 Y4 Y5 1 Software
- Application Software AMC cost 0.00 0.00 0.00 15.00 15.00
2 Hardware
- Hardware AMC Cost 0.00 0.00 0.00 80.78 80.78
3 Networking
- Networking Equipments AMC cost 0.00 0.00 0.00 11.99 11.99
- Bandwidth cost 30.80 30.80 30.80 30.80 30.80
- Internet connectivity cost 3.90 3.90 3.90 3.90 3.90
4 Manpower
- Manpower cost 10.80 10.80 10.80 10.80 10.80
5 Other Cost
- Other costs (Stationary & Communication) 23.08 23.08 23.08 0.00 0.00
TOTAL 68.58 68.58 68.58 153.27 153.27 Grand Total 512.28
The detailed cost-break up of each of these components have been given in the subsequent sections. 1.6.1. CAPITAL EXPENDITURE 1.6.1.1. Software Cost
The software costs include the cost of application for the Department of Economics & Statistics and the System Software costs. a. Application Software Cost
Sl No: Cost Head No: of man
months Cost/ Man
month Total Cost
A B C (BXC) 1 Preparation of System Design document and
prototype of proposed Application Software 4 1.50 6.00
2 Application development 40 1.50 60.00 3 Testing & QA of the Application Software 6 1.50 9.00
TOTAL COST 75.00

140
Assumptions:
The software estimation is based on the identifying the major task and tabulating the effort required for completing this task (Refer annexure:1)
The total man days are calculated based on the efforts required. The man day’s effort for preparation of system design document comes to 120 days (approx. 4 man months)
The man day’s effort required for application development of the proposed DES solution comes to 1200 days. (which is approx. 40 man months)
The man day’s effort required for testing & Quality Audit of proposed DES solution and other project related activities comes to 180 days (which is approx. 6 man months)
Effort for Integration of the proposed application software with external applications like spark is also covered in the software development effort tabulation.
Man month rate has be assumed as Rs:1.5 lakhs/month
b. Statistical Package Cost
Sl No: Cost Head No: of
License Cost/ License Total Cost
A B C (BXC) 1 STATA/SPSS (20 user licenses) 20 0.15 3.00
TOTAL COST 3.00 Assumptions:
A suitable statistical package (STATA/SPSS) shall be chosen by the DES for statistical analysis with 20 licenses(one license each for districts and 6 licenses for the Directorate)
Per user license cost has been taken as `.15,000/-
1.6.1.2. Hardware Cost
The cost for hardware infrastructure consists of the hardware infrastructure required at the Directorate level, District level and Taluk office level. Hardware cost related to the ICT infrastructure at the Directorate level is given below:- Sl No: Cost Head No: of Units Unit Cost Total Cost
A B C (BXC) 1 Database Server 2 12.00 24.00 2 Application Server 2 12.00 24.00 3 Web Server 2 5.00 10.00 4 SAN Storage 1 15.00 15.00 5 Desktop computers 120 0.35 42.00 6 Laptop 13 0.40 5.20 7 Laser Printer (A3) colour 1 1.00 1.00 8 Laser Printer(A3) 5 1.00 5.00

141
9 Fax Machine 4 0.05 0.20 10 Centralized UPS 50 KVA with 3 hours back-up 1 10.00 10.00
TOTAL COST 136.40 Assumptions:
DES shall use the existing ICT infrastructure available at the Dpt. and also in the SDC.
The proposed database, application and web servers as well as the SAN storage shall be kept at the State Data Centre. The cost of servers are inclusive of the Operating Systems.
Laptops are proposed for the Director and the Additional Directors.
All the hardware items proposed are inclusive of 3 year warranty.
The hardware cost related to the ICT infrastructure at the District level is given below:-
Sl No: Cost Head
No: of Unit/ District
Total No. of Units Unit Cost
Total Cost
A B C D (CXD) 1 Desktop computers 12 168 0.30 50.40 2 Centralized UPS (5 KVA Online) 1 14 1.50 21.00 3 Laser Printer (Medium) 1 14 1.00 14.00 4 Scanner 1 14 0.08 1.12 5 Fax Machine 1 14 0.05 0.70 6 EPABX 1 14 0.25 3.50
TOTAL COST 90.72 Assumptions:
The existing ICT infrastructure available at the District offices has been considered.
An average of 12 computers has been proposed for the district offices. The cost of computers is inclusive of pre-loaded OS cost.
The hardware costs related to the ICT infrastructure at the Taluk level are given below:-
Sl No: Cost Head
No: of Unit/ Taluk
Total No. of Units
Unit Cost Total Cost
A B C D (CXD) 1 Desktop computers with 6 set of PCI
based shared computing device 1 61 1.15
70.15 2 Desktop computers 1 61 0.35 21.35 3 Centralized UPS (3 KVA Online) 1 61 0.60 36.60 4 PDA - 61 0.20 12.20 5 Laser Printer (Medium) 1 61 0.20 12.20 6 Telephone 1 61 0.015 0.92 7 Mobile phone 1 61 0.035 2.14
TOTAL COST 153.42

142
Assumptions:
The existing ICT infrastructure available at the Taluk offices have been considered.
7 Shared nodes and a desktop computer has been proposed for the Taluk level offices.
PDAs have been given on experimental basis for price collection.
Currently, the Taluk offices does not have telephone facilities which is very essential.
Mobile phones have been proposed for the Taluk level offices for its web integration and sms services for collecting short information quickly.
The hardware costs related to the ICT infrastructure for the Statistical Cells are given below:-
Sl No: Cost Head
No: of Unit/ Dept.
Total No. of Units
Unit Cost Total Cost
A B C D (CXD) 1 Desktop computers 1 41 0.30 12.30 2 1 KVA offline UPS with 60 mts back-up 1 41 0.15 6.15 3 Laser Printer (Medium) 1 41 0.12 4.92
TOTAL COST 23.37 Assumptions:
Very basic ICT infrastructure has been proposed for the statistical cells.
1.6.1.3. Network Connectivity Infrastructure Cost
The Network connectivity related costs related to the ICT infrastructure at the Directorate level are given below:-
Sl No: Cost Head No: of Units Unit Cost Total Cost
A B C (BXC) Network Equipment Cost 1 Router 1 1.00 1.00 2 Switch(24 Ports) 10 0.20 2.00 3 9 U Rack, 24 port patch panel 1 0.08 0.08 Network connectivity Establishment Cost 4 Local Area Network 18 0.15 2.70 5 Leased line (with Back-up link) Cost 1 0.80 0.80
TOTAL COST 6.58 Assumptions:
The switches shall be shared across the sections.

143
Wireless connectivity shall be established through KSWAN as per feasibility. Leased line cost with 2 mbps connectivity with Ethernet/v.35 modem cost is given. ISDN is proposed as the back-up link.
The Network connectivity related costs related to the ICT infrastructure at the District level are given below:-
Sl No: Cost Head
No: of Unit/
District
Total No. of Units
Unit Cost Total Cost A B C D (CXD) Network Equipment Cost 1 Routers 1 14 0.60 8.40 2 Switch(24 Ports) 1 14 0.20 2.80 3 9 U Rack, 24 port patch panel 1 14 0.08 1.12 Network connectivity
Establishment Cost
0.00 4 Local Area Network 1 14 0.20 2.80 5 Leased line (with Back-up link) Cost 1 14 0.50 7.00
TOTAL COST 22.12 Assumptions:
A medium sized router has been proposed for the District offices.
Wireless connectivity shall be established through KSWAN as per feasibility. Leased line cost with 128/256 kbps connectivity with Ethernet/v.35 modem cost is given. ISDN is proposed as the back-up link.
The Network connectivity related costs related to the ICT infrastructure at the Taluk level are given below:-
Sl No: Cost Head
No: of Unit/ Taluk
Total No. of Units
Unit Cost Total Cost A B C D (CXD) Network Equipment Cost 1 Routers 1 61 0.50 30.50 2 Switch(16 Ports) 1 61 0.15 9.15 3 9 U Rack, 24 port patch panel 1 61 0.08 4.88 Network connectivity
Establishment Cost
4 Local Area Network 1 61 0.10 6.10 5 Leased line(with Back-up link) Cost 1 61 0.50 30.50
TOTAL COST 81.13 Assumptions:
A medium sized router has been proposed for the District offices.
Wireless connectivity shall be established through KSWAN as per feasibility. Leased line cost with 128/256 kbps connectivity with Ethernet/v.35 modem cost is given. ISDN is proposed as the back-up link.
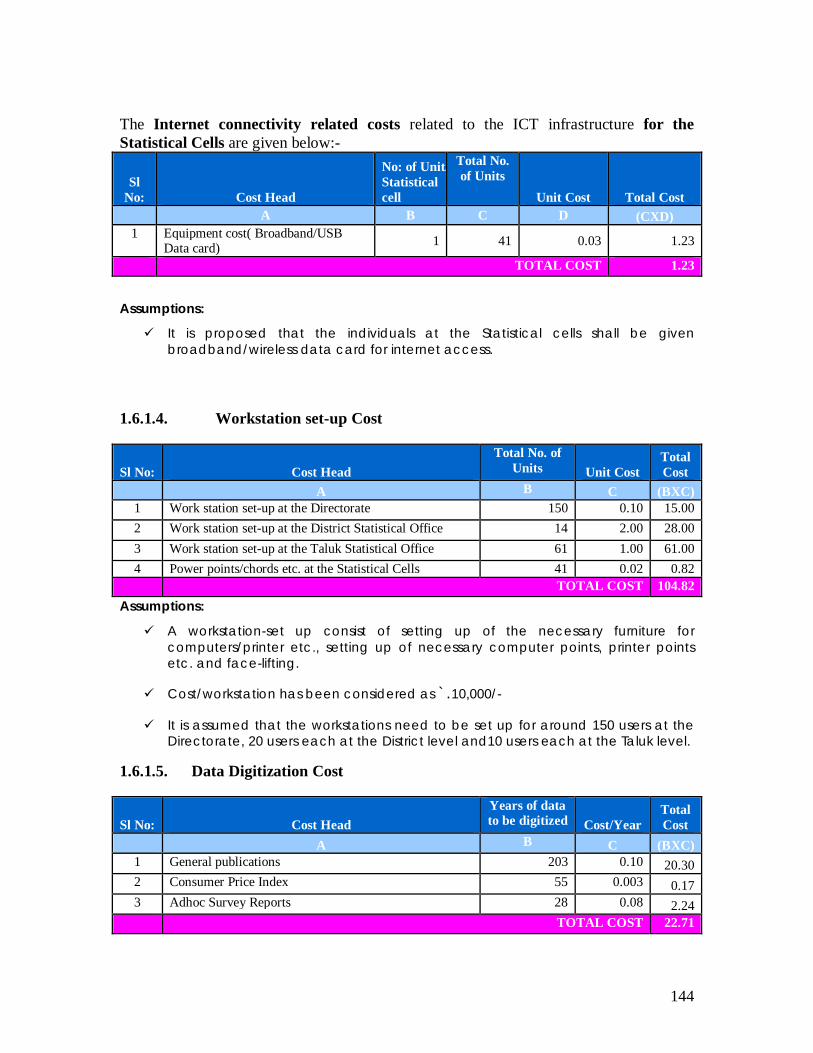
144
The Internet connectivity related costs related to the ICT infrastructure for the Statistical Cells are given below:-
Sl No: Cost Head
No: of Unit/ Statistical cell
Total No. of Units
Unit Cost Total Cost A B C D (CXD) 1 Equipment cost( Broadband/USB
Data card) 1 41 0.03 1.23
TOTAL COST 1.23
Assumptions:
It is proposed that the individuals at the Statistical cells shall be given broadband/wireless data card for internet access.
1.6.1.4. Workstation set-up Cost
Sl No: Cost Head Total No. of
Units Unit Cost Total Cost
A B C (BXC) 1 Work station set-up at the Directorate 150 0.10 15.00 2 Work station set-up at the District Statistical Office 14 2.00 28.00 3 Work station set-up at the Taluk Statistical Office 61 1.00 61.00 4 Power points/chords etc. at the Statistical Cells 41 0.02 0.82
TOTAL COST 104.82 Assumptions:
A workstation-set up consist of setting up of the necessary furniture for computers/printer etc., setting up of necessary computer points, printer points etc. and face-lifting.
Cost/workstation has been considered as `.10,000/-
It is assumed that the workstations need to be set up for around 150 users at the Directorate, 20 users each at the District level and10 users each at the Taluk level.
1.6.1.5. Data Digitization Cost
Sl No: Cost Head Years of data to be digitized Cost/Year
Total Cost
A B C (BXC) 1 General publications 203 0.10 20.30 2 Consumer Price Index 55 0.003 0.17 3 Adhoc Survey Reports 28 0.08 2.24
TOTAL COST 22.71
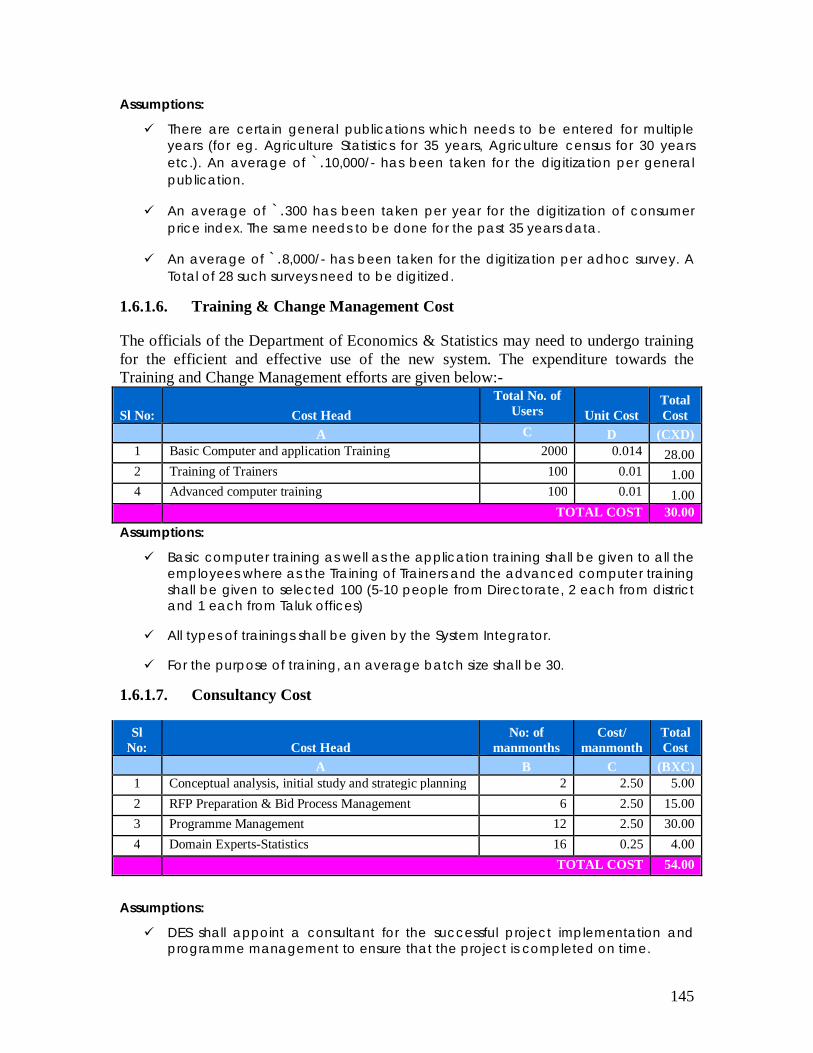
145
Assumptions:
There are certain general publications which needs to be entered for multiple years (for eg. Agriculture Statistics for 35 years, Agriculture census for 30 years etc.). An average of `.10,000/- has been taken for the digitization per general publication.
An average of `.300 has been taken per year for the digitization of consumer price index. The same needs to be done for the past 35 years data.
An average of `.8,000/- has been taken for the digitization per adhoc survey. A Total of 28 such surveys need to be digitized.
1.6.1.6. Training & Change Management Cost
The officials of the Department of Economics & Statistics may need to undergo training for the efficient and effective use of the new system. The expenditure towards the Training and Change Management efforts are given below:-
Sl No: Cost Head Total No. of
Users Unit Cost Total Cost
A C D (CXD) 1 Basic Computer and application Training 2000 0.014 28.00 2 Training of Trainers 100 0.01 1.00 4 Advanced computer training 100 0.01 1.00
TOTAL COST 30.00 Assumptions:
Basic computer training as well as the application training shall be given to all the employees where as the Training of Trainers and the advanced computer training shall be given to selected 100 (5-10 people from Directorate, 2 each from district and 1 each from Taluk offices)
All types of trainings shall be given by the System Integrator.
For the purpose of training, an average batch size shall be 30.
1.6.1.7. Consultancy Cost
Sl No: Cost Head
No: of manmonths
Cost/ manmonth
Total Cost
A B C (BXC) 1 Conceptual analysis, initial study and strategic planning 2 2.50 5.00 2 RFP Preparation & Bid Process Management 6 2.50 15.00 3 Programme Management 12 2.50 30.00 4 Domain Experts-Statistics 16 0.25 4.00
TOTAL COST 54.00
Assumptions:
DES shall appoint a consultant for the successful project implementation and programme management to ensure that the project is completed on time.

146
Consultant shall be responsible for conceptual analysis, initial study & strategic planning, RFP preparation, bid management and programme management during the entire project period.
Consultant shall assist the department to make the project go-live and also for the acceptance testing.
It is proposed that 2 man-month efforts shall be required for study & strategic planning, 6 man-month efforts for RFP preparation & entire bid process management and 1 consultant for a period of 12 months for the programme management.
The services of 2 domain experts for a period of 8 months are proposed for the standardization of the data.
1.6.2. OPERATIONAL EXPENDITURE (For a period of 5 years) It is assumed that all the hardware, software and the networking equipments proposed at
all levels shall be supplied with three year free onsite warranty. The important
components for the recurring cost for a period of 5 years are given below:-
Operating Expenditure for Application Software
Sl No: Cost Head CAPEX
AMC Cost for 4th Year
AMC Cost for 5th Year
A B BX20% BX20% 1 Application Software 75.00 15.00 15.00
TOTAL COST 15.00 15.00 Assumptions
The application development cost given is inclusive of 3 year warranty.
Operational Expenses/Annual Maintenance Charges (AMC) of the software has been taken as 20%of the Total Application development Cost.
Hardware Cost
Sl No: Cost Head CAPEX AMC Cost for
4th Year AMC Cost for
5th Year A B BX20% BX20% 1 Hardware for Directorate of Economics& Statistics 136.40 27.28 27.28
2 Hardware for District Statistical Offices 90.72 18.14 18.14
3 Hardware for Taluk Statistical Offices 153.42 30.68 30.68 3 Hardware for Statistical Cells 23.37 4.67 4.67
TOTAL COST 80.78 80.78

147
Assumptions All the hardware shall be of 3 year comprehensive product warranty, Hence no
maintenance costs for an initial period of 3 years.
The cost given for the hardware is the AMC cost for all the hardware equipments for a period of 2 years Post-Warranty period.
AMC of the hardware has been taken as 20%of the Total Capital Expenditure.
Operating Expenditure for Networking Infrastructure
The expenditure towards the Operation & Maintenance costs for the Networking infrastructure is given below:-
Networking Equipments recurring cost
Sl No: Cost Head CAPEX AMC for 4th Year
AMC for 5th Year
A B BX20% BX20% 1 Networking for Directorate of Economics Statistics 3.08 0.62 0.62 2 Networking for District Statistical Offices 12.32 2.46 2.46 3 Networking for Taluk Statistical Offices 44.53 8.91 8.91
TOTAL COST 11.99 11.99 Assumptions
All the networking equipments shall be of 3 year comprehensive product warranty, Hence no maintenance costs for an initial period of 3 years.
The cost given for the networking equipments is the AMC cost for all the networking equipments for a period of 2 years Post-Warranty period.
AMC of the n/w equipments has been taken as 20%of the Total Capital Expenditure.
Network Connectivity Bandwidth Cost
Sl No: Cost Head
No: of
lines Avg.
Cost/line
Bandwidth Cost
Year 1 Year 2 Year 3 Year 4 Year 5 A B C (BXC) (BXC) (BXC) (BXC) (BXC) 1 Bandwidth recurring costs for
the Directorate 1 0.80 0.80 0.80 0.80 0.80 0.80
2 Bandwidth recurring costs for the District offices 14 0.40 5.60 5.60 5.60 5.60 5.60
3 Bandwidth recurring costs for the Taluk offices 61 0.40 24.40 24.40 24.40 24.40 24.40
TOTAL COST 30.80 30.80 30.80 30.80 30.80

148
Assumptions
The bandwidth cost for the directorate is for 2 Mbps whereas for other offices the same shall be for 128/256 kbps.
Internet connectivity recurring cost
Sl No: Cost Head
No: of
lines Avg. Cost/
connection/ month
Internet recurring Cost
Year 1 Year 2 Year 3 Year 4 Year 5 A B C (BXC) (BXC) (BXC) (BXC) (BXC) 1 Internet connectivity
costs forStatistical cells 41 0.008 3.9 3.9 3.9 3.9 3.9
TOTAL COST 3.9 3.9 3.9 3.9 3.9 Assumptions
The cost shall include the recurring cost proposed for the broadband/wireless data card at the Statistical Cells.
The cost is given as `.800/- per /month.
Professional (Manpower) Cost
Sl No: Cost Head
No: of People
Cost/ Manmonth
Cost Year
1 Year
2 Year
3 Year
4 Year
5 A B C (BXC) (BXC) (BXC) (BXC) (BXC) 1 Database Administrator 1 0.50 6.00 6.00 6.00 6.00 6.00 3 Network Administrator 1 0.40 4.80 4.80 4.80 4.80 4.80
TOTAL COST 10.80 10.80 10.80 10.80 10.80 Assumptions
There shall be a need of a Database Admin and a Network Admin for a period of 5 years to operate the proposed ICT infrastructure as these roles require special expertise and cannot be met by the department personnel.
Other Cost
Sl No: Cost Head
No: of units
Avg. Cost/item
Cost
Year 1 Year 2 Year 3 A B C (BXC) (BXC) (BXC) 1 Stationary expenses at the
Directorate level 1 0.10 1.20 1.20 1.20
2 Stationary expenses at the District level
14 0.03 5.04 5.04 5.04
3 Stationary expenses at the Taluk level
61 0.02 14.64 14.64 14.64
4 Communication expenses 61 0.003 2.20 2.20 2.20 TOTAL COST 23.08 23.08 23.08
149
Assumptions
Other costs include the Stationary costs as well as the Communication expenses.
Stationary costs include the costs for printer cartridges, toners, paper etc. where as the communications expenses include the mobile phone as we as the landline phone charges for a period of 3 years.
Stationary expenses has been taken as `. 10,000/- for Directorate/month, whereas around `.3,000/-/District office/month and around `.2,000/-/Taluk office/month.
It is proposed that the officials at the Taluk level shall take a BSNL connection with `.175/- per month with unlimited calls within the user group and an amount of `.125/-/month/taluk office has been taken for meeting the expenses towards the landline bills.

150
Appendix-1
Software Development Effort Estimation
Study, Design, Development and Implement a software for Department of Economics & Statistics - Effort Estimation
S.No. Modules/Tasks Effort in
Man Days A. System Study Initial system study
1
Understand the high level requirements of the complete project in terms of; -Stakeholders - Functional requirements -Available hardware / network infrastructure -Centralized infrastructure -Hardware requirement for application -Department of Economics & Statistics database - Integration with other application 5
Departmental Analysis 2 Detailed study on the functionalities
10
3 Study business processes and workflow details
4 Collate details on standard reports and requirements of other adhoc reports
5 Available hardware & network equipments details 6 Availability of network bandwidth details
Collation and Documentation 7 Collation of all gathered information 10 8 Integration of various requirements for effective data exchange 15
9 Determine the different information dissemination channels and document the same 10
10 Collect sample input forms and output reports and design input screen and output report layouts 5
11 Collate and document the hardware, network and bandwidth requirements at each of the offices 10
12 Prepare a detailed SRS document 40 13 Submit SRS document for approval & sign-off 15
Total of (A) in Man Days 120 B. Design & Development General Tasks
14 Design Web pages 60 15 Design schema for the DES solution 90 16 Design Technical architecture (Solution, Deployment & Network) 120 17 G2G, G2C & G2B Services – Dissemination of information 30
Masters 18 Master Data entry forms 100 19 Department-wise Data entry forms 70 20 Employee’s data entry (add/modify/delete) 50

151
Administration Module 21 User Management 90 22 Role Management 90
Other Modules 23 Time-series data download table creation 70 24 Registration/membership creation/e-payment/user management 70
Reports
25 Centralised Management Information System 90
26 Summary reports on samples tested (Weekly/Monthly/Yearly, zone/ state/ district-wise summary) 60
27 Time series data 60 Integration details
28 Facility to link with Spark system 120 29 Feasibility to link with other software 30
Total of (B) in Man Days 1200 C. Other Project Related Tasks
30 Project Management 25 31 QA 5 32 System Testing 60 33 Training 10 34 Implementation 70 35 Documentation 10
Total of (C) in Man Days 180 Total of (A, B & C) in Man Days 1500 Total Man Months 50
Application Development Costing Amount (INR)
Study, Design, Development, Implementation & Training (MM rate @ `. 1,50,000/-) 75,00,000
Total Project Cost 75,00,000

152
Appendix-II The details of the existing ICT infrastructure in Department of Economics &
Statistics along with the basic technical specifications
(a).IT facilities at the Directorate
Sl
No
Name of
section
Computer
(Nos.)
Laser
Printer
No. of
DMP Internet
1. Director’s Cabin
2 1 yes
2. Addl. Directors
3 3 yes
3. JDs 3 2 yes
4. AO 1 1 yes
5. State Income 5 1 yes
6. Vital Stat. 3 2 yes
7. EARAS 7 1 yes
8. Prices 3 2 1 yes
9. NSS 1 yes
10. S&D 2 1 yes
11. Evaluation 1 1 yes
12. Publication 2 1 1 yes
13 Planning 2 yes
14 Information Centre
3 1 yes
15 Fair copy 5 1 2 -
16. Budget 2 1 yes
17. Accounts 4 1 yes
18. Establishment 3 1 yes
19. Training 2 1 yes
20. Computer Division
2 Servers, 7 PCs., 18 Thinclient 3
1 DMP, I Line
Printer yes

153
(b) Existing software Sl No. Item Version/Remarks
1. MS Windows Windows 98, Windows 2000, Windows XP
2. WS Windows Server Windows 2000, Windows 2008 3. Windows NT Windows NT 4.0
4. M S Office M S Office 97, MS Office 2000, MS Office 2003, MS Office 2007
4. SPSS SPSS 13.0 5. Tulika Malayalam 6. Anti Virus Norton 2005, Kaspersky
7. SPECS (Application S/W for various schemes being implemented by the Department)
Developed in DB2+Power Builder by NIC
(c) The IT infrastructure at District Offices
Sl No.
Name of District Computer Laser Printer
DMP Internet
1 Thiruvananthapuram 5 1 1 yes
2 Kollam 5 1 1 yes
3 Pathanamthitta 4 1 1 yes
4 Alappuzha 4 1 1 yes
5 Kottayam 4 1 1 yes
6 Idukki 4 1 1 yes
7 Ernakulam 5 1 1 yes
8 Thrissur 5 1 1 yes
9 Palakkad 4 1 1 yes
10 Malappuram 4 1 1 yes
11 Kozhikode 5 1 1 yes
12 Wyanad 4 1 1 yes
13 Kannur 4 1 1 yes
14 Kasargod 4 1 1 yes
The Computer unit at districts is functioning under LAN environment.
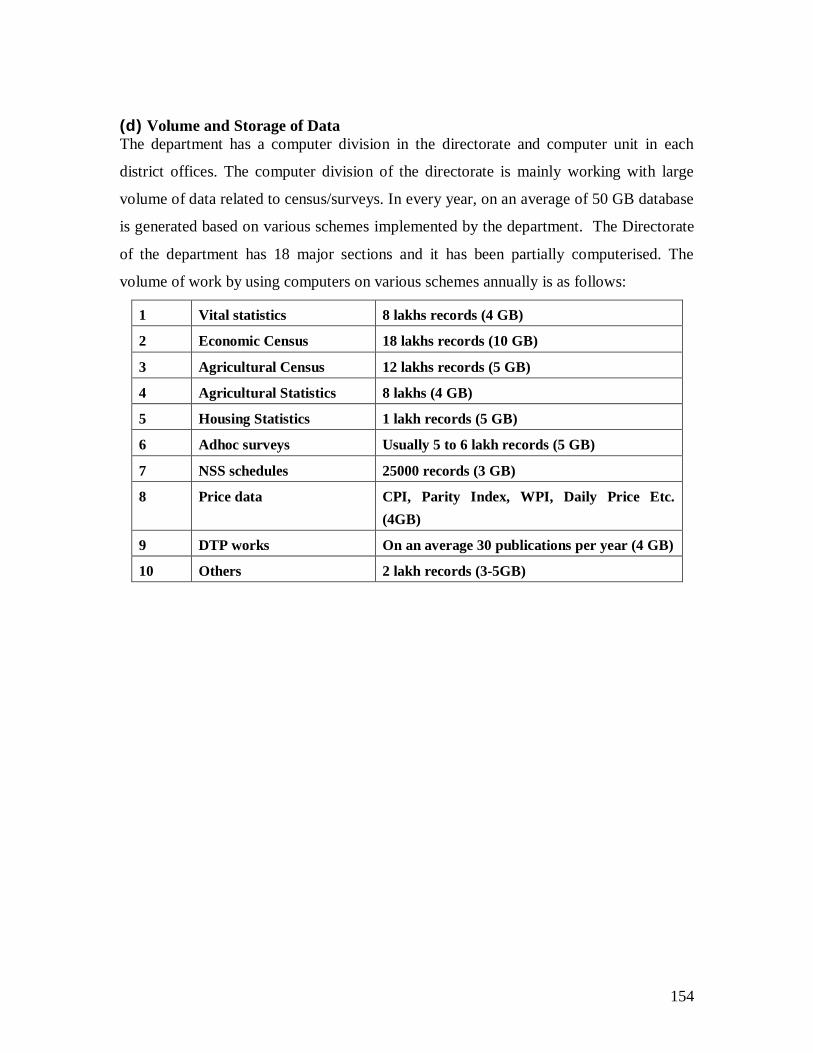
154
(d) Volume and Storage of Data The department has a computer division in the directorate and computer unit in each
district offices. The computer division of the directorate is mainly working with large
volume of data related to census/surveys. In every year, on an average of 50 GB database
is generated based on various schemes implemented by the department. The Directorate
of the department has 18 major sections and it has been partially computerised. The
volume of work by using computers on various schemes annually is as follows:
1 Vital statistics 8 lakhs records (4 GB)
2 Economic Census 18 lakhs records (10 GB)
3 Agricultural Census 12 lakhs records (5 GB)
4 Agricultural Statistics 8 lakhs (4 GB)
5 Housing Statistics 1 lakh records (5 GB)
6 Adhoc surveys Usually 5 to 6 lakh records (5 GB)
7 NSS schedules 25000 records (3 GB)
8 Price data CPI, Parity Index, WPI, Daily Price Etc. (4GB)
9 DTP works On an average 30 publications per year (4 GB)
10 Others 2 lakh records (3-5GB)
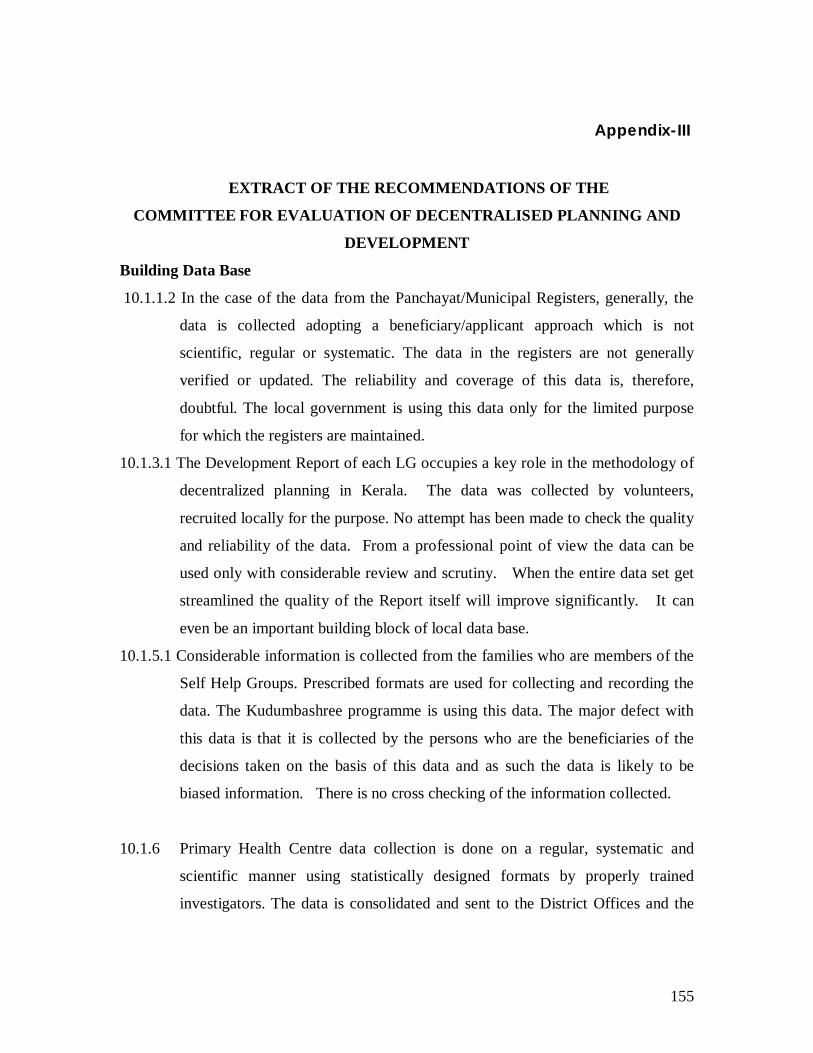
155
Appendix-III
EXTRACT OF THE RECOMMENDATIONS OF THE
COMMITTEE FOR EVALUATION OF DECENTRALISED PLANNING AND
DEVELOPMENT
Building Data Base
10.1.1.2 In the case of the data from the Panchayat/Municipal Registers, generally, the
data is collected adopting a beneficiary/applicant approach which is not
scientific, regular or systematic. The data in the registers are not generally
verified or updated. The reliability and coverage of this data is, therefore,
doubtful. The local government is using this data only for the limited purpose
for which the registers are maintained.
10.1.3.1 The Development Report of each LG occupies a key role in the methodology of
decentralized planning in Kerala. The data was collected by volunteers,
recruited locally for the purpose. No attempt has been made to check the quality
and reliability of the data. From a professional point of view the data can be
used only with considerable review and scrutiny. When the entire data set get
streamlined the quality of the Report itself will improve significantly. It can
even be an important building block of local data base.
10.1.5.1 Considerable information is collected from the families who are members of the
Self Help Groups. Prescribed formats are used for collecting and recording the
data. The Kudumbashree programme is using this data. The major defect with
this data is that it is collected by the persons who are the beneficiaries of the
decisions taken on the basis of this data and as such the data is likely to be
biased information. There is no cross checking of the information collected.
10.1.6 Primary Health Centre data collection is done on a regular, systematic and
scientific manner using statistically designed formats by properly trained
investigators. The data is consolidated and sent to the District Offices and the

156
State Directorates. We are of the view that the quality, reliability, coverage etc.
of the above data are reasonably good.
10.2.1 In the Krishi Bhavan data collection is done mainly by local enquiry. No house
to house visits are undertaken. Though the pre-designed questionnaires are
supplied by the District Agricultural Office, no training is imparted to the
persons collecting the data. There is no system of verifying or updating the data.
The data from this source has to be made more reliable by suitably modifying
the data collection system.
The SC/ST Development Departments with the help of the panchayat level
SC/ST Promoters/Activists collect socio-economic data on SCs and STs of
colonies and settlements. The coverage of the survey is limited to colonies /
settlements of SCs/STs. The data collected are seldom consolidated and hence,
not available for the panchayat for use in planning. It may be noted that for
local area planning and poverty alleviation programmes the data can be of great
use. Local schools keep a lot of information on students. Enrolment of students
according to age, sex and social status, enrolment number of students, and
dropouts according to class, class wise pass, number of teachers and other
employees according to sex and social group and data on income, expenditure
and assets of the school. The data is reliable. The data for the panchayat has to
be obtained from the schools and consolidated.
10.3.1.3 Most of the above mentioned data are secondary data. The system, periodicity,
reliability etc. depend on how the providers of the data collected the same. The
panchayats have used only a part of the data for purposes of planning. But it
appears that the data after verification and updating can be used with advantage
for planning at the panchayat level. The question of creating a data warehouse
or Local Planning Data Bank must engage the attention of the government as a
priority item.
10.3.1.4 District Office of the Fisheries Department, using the services of Fisheries
Extension Officers, has collected panchayat-wise data on water resources and

157
fisheries and published the data in a book entitled ‘District Plan Fish Book’.
We understand that data were collected by well qualified Fisheries Extension
Officers in a systematic and scientific manner. The data are reliable.
10.4.1.6 The system for data collection in the economic census is scientific and
systematic. Pre-designed format for data collection is used. Proper training is
imparted to the investigators by the Department of Economics and Statistics.
There is complete coverage of the enterprises and the data is reliable. The data
can be tabulated for the panchayats and made available for local use.
10.4.1.8 The Statistical Wing of the Directorate of Public Instruction conduct educational
survey. It was done in a systematic and scientific manner. Proper training was
imparted to the investigators.
All schools are covered. The data is reliable. We recommended that it should be
tabulated panchayat-wise and made available for local planning.
10.5.2 The Information Kerala Mission (IKM), seeks to strengthen local governance
through ICT (Information, Communication, Technologies) applications. All
future data building exercise should be done in consultation with this Institute.
10.5.3.1 The local bodies will have to use a wide range of statistics to understand and
analyse the present level of exploitation of the resources of the area, assess the
possibilities of their further use with a view to increasing production, improving
infrastructure and essential service facilities and increasing the employment of
the workers thereby increasing income and reducing poverty. The most essential
data required in this context is information about all the households within the
jurisdiction of the local body.
10.5.3.2 The Thanalur panchayat did a very comprehensive survey which we recommend
for adoption by other panchayats with whatever modifications each Gram
Panchayat may deem fit. As far as the coastal panchayats are concerned the
guidelines and scheme given in Working Paper 12 published by KILA may be
used for purposes of modifications. All these should be part of the Samoohya of
IKM.

158
10.6.2 In a paper presented before the committee the Director of Statistics estimates
that 1219 persons will be required to fill the statistical posts necessary in the
local bodies of the state with an annual commitment of `. 13 crore. This cannot
be considered Prohibitive, especially considering the likely benefits from the
improvements in local level planning activities as a result of posting these
personnel in the local bodies.
10.6.5 As of now there is no functional relationship between the Department of
Statistics and the IKM. This must be strengthened in the future on a regular
basis.
********************************