KEPLER’S WINE BARREL PROBLEM IN A DYNAMIC GEOMETRY …
13
KEPLER’S WINE BARREL PROBLEM IN A DYNAMIC GEOMETRY ENVIRONMENT Bat-Sheva SHECHTER Israel National Center for Mathematics Education - "Kesher Ham” Department of education in technology and science Technion – Israel Institute of Technology HAIFA, 32000, ISRAEL [email protected] ABSTRACT The story of Kepler’s Wine Barrel Problem seem to be worthwhile for mathematical research. Formulating the problem with the aid of Dynamic Geometry Software provides it with an additional dimension, that of visualization. Once we build a construction utilizing Dynamic Geometry Software, the exploration of the problem is accessible to variant levels of students, even those who are not familiar with calculus tools. The analysis of the construction, posing the problems to explore and being engaged in its investigation, requires skills of decision-making, conjecturing, reasoning, and problem solving. In this paper there is a description of mathematical research conducted by the author. As an instructor in an advanced course in a program aimed to qualify in-service teachers as teachers'-educators, It seem to be important to be involved in mathematical research. Hence, I decided to expose the teachers to the problem and let them share my enthusiasm of the mathematical research in a Dynamic Geometry Environment. The message was to call them to experience in mathematical research as an important tool for becoming a teachers’ educator. KEYWORDS: dynamic geometry software, geometry, maximum, volume, problem posing, history, connected mathematics, teacher.
Transcript of KEPLER’S WINE BARREL PROBLEM IN A DYNAMIC GEOMETRY …

KEPLER’S WINE BARREL PROBLEM IN A DYNAMIC GEOMETRY
ENVIRONMENT
Bat-Sheva SHECHTER
Israel National Center for Mathematics Education - "Kesher Ham” Department of education in technology and science
Technion – Israel Institute of Technology HAIFA, 32000, ISRAEL
ABSTRACT The story of Kepler’s Wine Barrel Problem seem to be worthwhile for mathematical research.
Formulating the problem with the aid of Dynamic Geometry Software provides it with an additional dimension, that of visualization. Once we build a construction utilizing Dynamic Geometry Software, the exploration of the problem is accessible to variant levels of students, even those who are not familiar with calculus tools. The analysis of the construction, posing the problems to explore and being engaged in its investigation, requires skills of decision-making, conjecturing, reasoning, and problem solving.
In this paper there is a description of mathematical research conducted by the author. As an instructor in an advanced course in a program aimed to qualify in-service teachers as teachers'-educators, It seem to be important to be involved in mathematical research. Hence, I decided to expose the teachers to the problem and let them share my enthusiasm of the mathematical research in a Dynamic Geometry Environment. The message was to call them to experience in mathematical research as an important tool for becoming a teachers’ educator.
KEYWORDS: dynamic geometry software, geometry, maximum, volume, problem posing, history,
connected mathematics, teacher.

1. Introduction Attending a workshop for mathematic teachers at the Haifa Technion, I was exposed to
Kepler’s wine barrel problem and its history background. As Kepler noted in his book New Solid Geometry of Wine Barrels (in Tickomirov (1990)) he
was inspired by an event in his life that occurred in the fall of 1613,: In December of last year...I brought home a new wife at a time when Austria, having
brought in a bumper crop of noble grapes, distributed its riches...The shore in Linz was heaped with wine barrels that sold at a reasonable price.
...That is why a number of barrels were brought to my house and placed in a row, and four days later the salesman came and measured all the tubes, without distinction, without paying attention to the shape, without any thought or computation. Namely the copper point of a ruler was pushed through the filling hole of a barrel, across the heel of each of the wooden disks which we refer to simply as bottoms, and as soon as the length to the point at the top of one board disk was the same as the length to the point at the bottom of the other, the salesman stated the number of amphoras contained in the barrel after merely noting the number on the ruler at the spot where the length in question ended. I was astonished…
The key result in the book New solid geometry of wine barrels is Theorem V [Part Two]: Among all cylinders with the same diagonal, the largest and most capacious is that in which
the ratio of the base diameter to the height is 2 . Figure 1 presents a cylindrical wine barrel lying on its side. The barrel entry is in the middle
point of its side (E); λ is the distance between the entry and the bottom heel (EH).
The problem seem to me as an interesting one and worthwhile for introducing to students. Since it demands a lot of mathematical knowledge it is not appropriate to all students. Looking for approaches to adjust for students in various levels, I tried to model the problem with the aid of a Dynamic Geometer Software (DGS)1. The computer educational software available today can shed light on the problem by presenting it in graphical form and therefore help the students visualize it better.
The following chapters (2-4), provide a description of the problem, its representation in DGS and suggestions of their investigation. In chapter 2 the problem is formulated in the plane, then in chapter 3 refers to the barrel assuming it is cylindrical and then chapter 4 there is an approach to describe the barrel as composed of two truncated cones having a common base. Chapter 5 provides a didactical analysis of the potential of teaching and learning Kepler’s Wine Barrel Problem with the aid of DGS. Suggested tasks for teachers in a workshop appear in chapter 6.
1The Geometry Inventor(1994). (Logal Ed.),Software and Systems Ltd was used to this purpose. Of course any other Dynamic Geometry Software can do as well.
λ
Figure 1
E
H

2. Kepler's planimetric problem in a dynamic geometry environment Formulating the problem Lets start with the plane version of Kepler's problem – the planimetric problem that fits the
cylinder section: Among all rectangles (ADBE) with the same diagonal (λ), find the rectangle of maximal area
(Fig.2). For a given λ, the locus of vertices D is a circle with AB = λ as its diameter (Fig.3). Kepler's planimetric problem is then formulated as: to inscribe in a given circle a rectangle of
maximal area. Construction of the problem with the aid of DGS
It is clear that a rectangle inscribed in a given circle is well defined by the ratio between its
sides: ABDBt = . Therefore, the rectangle area is a function of the ratio t. utilizing the DGS
construction tools, it is possible to build all the rectangles inscribed in a given circle and then to build the graph of the area as a function of t, with the help of the software measure tools.
Description of the construction 1. Build a segment AB. 2. Find the midpoint C of the segment AB. 3. Build a circle with C as its center and with radius CA. 4. Place a point D on the circle.
The triangle DAB is half the rectangle DBEA (Fig.2). We can use the measure tools to display the following measures on the screen:
!" AB=λ
!"ABDBt =
!" S = DB.DA the rectangle area.
2r
B D
A
Figure 2
λλ
E
Figure 3

The Geometry Inventor also includes an option to build a function graph by defining the variables of a function. We define the area S as a function of the variable t. Then, by dragging the vertex D along the circle, we create all possible triangles. For each one the appropriate measures appear on the screen, the graph is derived as shown in Figure 4 and the answer is revealed: the maximum value of the area is obtained on the graph for t = 1. The rectangle of maximum area inscribed in a given circle is a square.
3. Solution of Kepler’s wine barrel problem with the tools of geometry inventor: the case of a cylindrical barrel In addressing the Wine Barrel problem, we first assume that the barrel is a cylinder and that the
length of the segment connecting the barrel entry with its bottom is given (Fig. 2). This segment is the diagonal of half the cylinder.
The volume V of the cylinder is calculated as:
DBADDBADHrV ⋅⋅=⋅
=⋅= 2
22
22
2πππ
We can use the software measure tools to compute the value V of the volume and the value t of the ratio between the height of the barrel and its bottom diameter. Using the approximation 22/7 for π we get V=11/7*DA*DA*DB. As in the planimetric example, as the vertex D is drugged along the circle the corresponding values of t and V , for each rectangle created, appear on the screen and a graph of V as a function of t is plotted (Fig. 5).
Figure 4 Figure 4

The student is therefore able to find the graph maximum point by simply dragging the vertex D
until it reaches the peak on the graph. Figure 6 shows how easy it is to change the value of λ (which is AB) and get different graphs. The students might be surprised to learn that the maximum value of the volume V is always reached for the same value of t=1.42. This result fits the value
2 that is obtained when the function V(t) is investigated with calculus tools (Shacham & Smukler(2000)).
Figure 5
Figure 6

4. Solution of Kepler’s wine barrel problem with the tools of geometry inventor: the case of a barrel composed of two truncated cones Formulating the problem The section of a barrel, which is composed of two truncated cones having a common base, is a
hexagon divided into two trapezoids by one of its diagonals as shown in Fig. 7: To investigate the problem, it is important to formulate it in the language of the geometry
construction, that is, to decide which measurements are given and which are variable. As in the case of a cylindrical barrel, λ denotes the length of half-barrel diagonal and t is the
ratio between the height of the barrel and the diameter of its bottom. But, now there is an additional parameter influencing the barrel volume: the ratio between the diameter of the common base of the cones and the diameter of the barrel bottom. If we look at this section of the barrel we see that this ratio is between the lengths of the trapezoid bases. Lets designate it as b.
First, we shall look at all barrels with the same values of λ and b and ask how the value of t influences the barrel volume V. We can concentrate on one of the two trapezoids, and ask the following question:
A truncated cone is generated by an equilateral trapezoid rotating about its central symmetry axis. Among all equilateral trapezoids having the same diagonal λ and the same ratio b between its bases, which trapezoid generates the truncated cone of the largest volume?
Again, the DGS and its tools will be used to solve the problem. A suitable construction is needed for this purpose.
Analysis of the construction Let say the trapezoid is AHBG (Fig.8) and the given diagonal is AB = λ.
Figure 7
λ
Figure 8
A
B
H
D G E
C
Looking at the altitude AD from A to the trapezoid base GB, we see that the locus of points D the heels of the altitude, is a circle with AB as a diameter. BD equals to the trapezoid midline, so if we extend BD beyond the point D (DE=DB), then BE equals the sum of the bases: BE = AH + BG and therefore EG=AH. Consequently, the point G divides BE in the relation
bAHGB
GEGB == .
Description of the construction 1. Build a segment AB . 2. Build a circle with AB as its diameter. 3. Place a point D on the circle. 4. Extend BD beyond D to E, so that DE = BD. 5. Place a point G on the segment BE 6. Draw a parallel line from A to BG. 7. Copy the segment GE on the parallel line starting at A, so that AH=GE.
AHGB is the trapezoid.
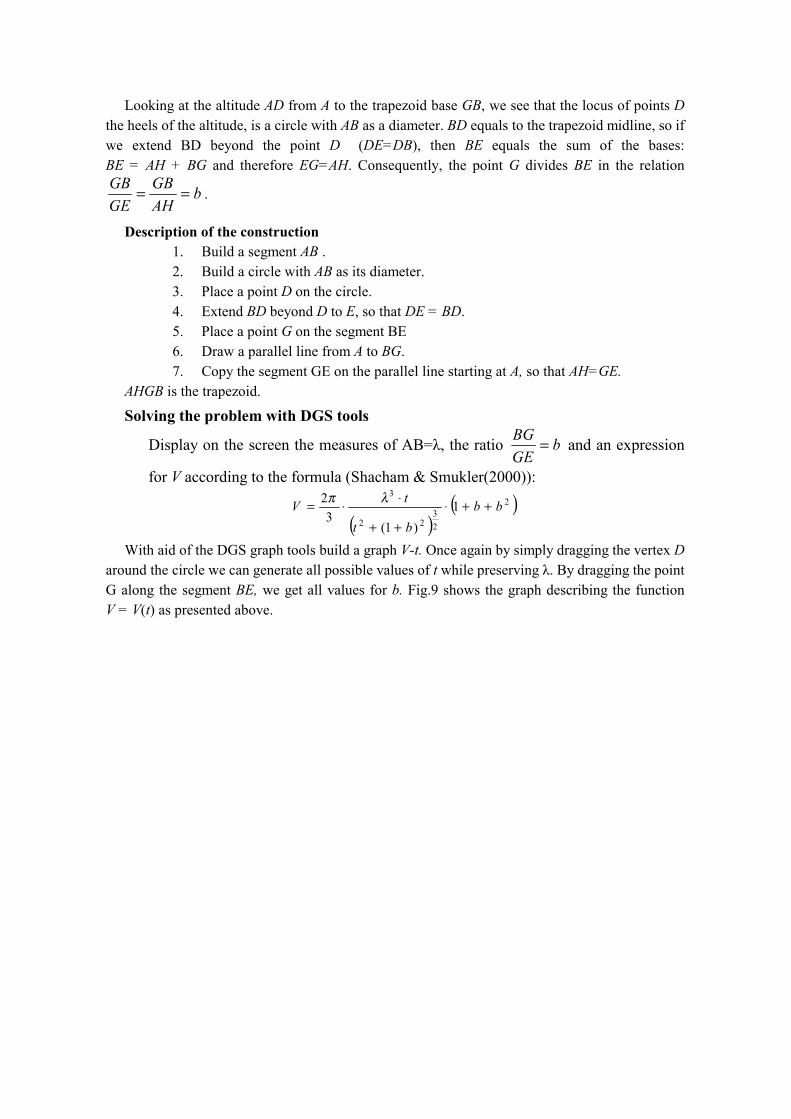
Solving the problem with DGS tools
Display on the screen the measures of AB=λ, the ratio bGEBG = and an expression
for V according to the formula (Shacham & Smukler(2000)):
( )( )2
23
22
31
)1(3
2 bbbt
tV ++⋅++
⋅⋅= λπ
With aid of the DGS graph tools build a graph V-t. Once again by simply dragging the vertex D around the circle we can generate all possible values of t while preserving λ. By dragging the point G along the segment BE, we get all values for b. Fig.9 shows the graph describing the function V = V(t) as presented above.

From the graph it is easy to find the maximum value of the volume corresponding to chosen values of λ and b. In the example shown in Fig. 9, we see that in case λ = AB = 7 and b = 5, the maximum value is reached for t = 4.25.
According to computations with the calculus tools ((Shacham & Smukler (2000)), the
maximum value for the barrel volume is obtained for 22
1 ⋅+= bt . By substituting b = 5 we get
t = 3. 2 or t = 4.24, which is very close to the value obtained from the graph.
Verification of the Graphical Solution Once we have built a solution for given values of λ and b, it is easy to use the same
construction and solve the problem for any values of λ and b; we need only change the givens. Table 1 below, describes results of constructions for different values of b and λ.
The value of t of the barrel with the largest volume as derived from the graph for each value of
b, appears in the third column of table 1. The exact value of t, is 2
2)1( b+, appear in the right
column of the table. We can see that the two values are relatively close. λ b Vmax t (experimental)
t = 2
2)1( b+
10 2.01 627.43 2.11 2.12 3 5 18.71 4.22 4.24
10 5 695.29 4.24 4.24 10.02 9.98 743.67 7.76 7.76
15 5 2344.97 4.25 4.24 10 50.74 791.17 36.39 36.58 20 5 5550.4 4.25 4.24
Figure 9
Table 1
5. Investigating by problem posing: what if…? Brown and Walter (1990) provide a wide variety of situations implementing the strategy of
“what if and what if not?” questions and their importance in mathematics in general and in mathematics education in particular. The next step is to pose questions about the model.
For example: What if the parameters change? 1.How does the maximal volume change when the parameter b is increased from b=1
to infinity? 2. How does the maximal volume change when the parameter λ increases?
It is very easy to investigate with these questions with the aid of the construction in the geometry software environment.
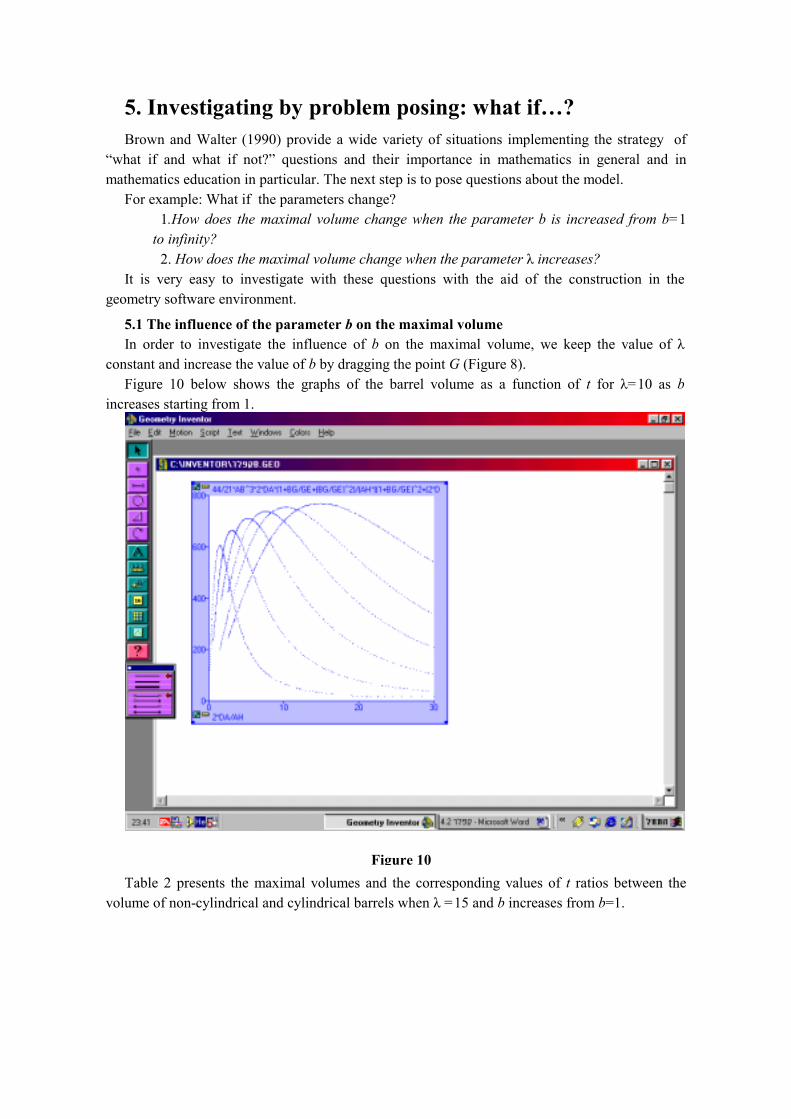
5.1 The influence of the parameter b on the maximal volume In order to investigate the influence of b on the maximal volume, we keep the value of λ
constant and increase the value of b by dragging the point G (Figure 8). Figure 10 below shows the graphs of the barrel volume as a function of t for λ=10 as b
increases starting from 1.
Table 2 presents the maximal volumes and the corresponding values of t ratios between the
volume of non-cylindrical and cylindrical barrels when λ =15 and b increases from b=1.
Figure 10

b t Vmax (b) Vmax(b) / Vmax(1) 1 1.41 2044.07 1
1.1 1.49 2044.98 1.0004 1.5 1.77 2069.55 1.0124
2.01 2.12 2118.63 1.0365 3.02 2.84 2213.9 1.0830
5 4.24 2344.97 1.1472 10.12 7.88 2500.38 1.2232 26.01 19.12 2626.10 1.2847 52.33 37.77 2673.10 1.3077
110.09 78.36 2698.90 1.3203 226.64 161.11 2711.29 1.3264 279.68 198.25 2713.54 1.3275
In case b=1, the barrel is cylindrical and so its maximal volume equals 2044.07. From Figure
10, as well as from Table 2, one can see that the barrel volume approximates the cylinder volume when b is close to 1. From the right column in table 2, we learn that as the values of b increase, the barrel maximal volume also increases. However, this increase is limited and the ratios between the different maximal volumes to the cylinder volumes of cylinders for the same value of λ tends to converge to 1.32. This result matches the result 4/3 obtained by analytic investigation ((Shacham & Smukler(2000)).
5.2 The influence of the parameter λ on the maximal volume Let us keep the value of b constant and just change the value of λ. Figure 11 shows the graphs
of the barrel volume V as a function of t for b=5 and for values of λ= AB from 5 to 12. From these we see, that the maximal barrel volume increases as a result of the growth of λ, with no limit.
Figure 11
Table 2

The results shown in Table 3, lead to the conclusion that the growth of the maximal barrel
volume is proportional to λ 3.
Λ Vmax t Vmax / λ 3 3 18.66 4.33 18.66/33=0.691 8 355.69 4.26 355.69/83=0.694 10 695.29 4.24 695.29/103=0.695 15 2326.06 4.75 2326.06/153=0.689 20 5494.42 4.83 5494.42/203=0.689
Another conclusion of the investigations presented in Table 3 is that the values of t providing
the maximal volume of the barrel are not influenced by the values of λ.
6. Achieving educational goals We can concentrate now, in some important educational principles as follows: motivation;
problem posing; visualization; reasoning; connected mathematics; mathematics for all students. In the next sessions there is a description of them as well as an analysis of their place in the suggested approach to Kepler’s Problem.
6.1 Motivation The NCTM. Standards recommend using worthwhile mathematical tasks to introduce
important mathematical ideas and to engage and challenge students intellectually: Well-chosen tasks can stimulate students' curiosity and help them develop an interest in mathematics.
Another recommendation is to utilize electronic technologies such as DGS, as useful tools for imposing worthwhile problems (NCTM (2000)
Posing the historical background of Kepler’s wine problem is a worthwhile activity that can motivate the students. The use of the DGS allows students to solve the problem without being distracted by complex computations. The students can focus on decision-making, reflection, reasoning, and problem solving.
6.2 Problem posing One important educational goal is to let students pose new questions using the strategy of
“what if and what if not?”. Students should then be encouraged to pose questions, then to investigate their own conjectures. (as in chapter 4).
6.3 Visualization In the activities described above, we used DGS, in order to furnish visual images of the
mathematical ideas’ rules and concepts. The graphical tools of DGS enable visualizing connections between various parameters.
Purdy(2000) talks about the advantages of DGS as an aid in visualizing maxima in volume problems. In our example the students also benefit from the graph which is built with the aid of the software.
6.4 Reasoning NCTM standards(2000) call for investigating mathematical conjectures and developing and
evaluating mathematical arguments and proofs. As Bruckheimer and Arcavi (2001) write on the
Table 3

potential of DGS to promote links between empirical and deductive reasoning. They show how DGS can support the development of a proof by using empirical evidence as the source for insight and inspiration for a deductive argument while they build the proof of Morley’s theorem. For many students the proof cannot be understood in another way.
In order to build the construction with the aid of DGS, students must first analyze and understand Kepler’s Problem. This demands logical and geometric considerations and thus students are involved in reasoning.
6.5 Connected Mathematics Paul Goldberg(1996), calls in his project “Connected Geometry”, for a curriculum that helps
students engage in meaningful mathematical activities which will offer them a chance to understand and appreciate the relationships between variables; unifying themes within mathematics. Furthermore such activities should help them and to connect their previous experiences to mathematics and develop and use mathematical habits of mind. He describes the benefits of teaching connected mathematics as helping students to become experimenters, describers, tinkerers, inventors, visualizers, conjecturers, and guessers.
The Kepler’s Wine Barrel Problem may be seen as a typical example of connected mathematics. As follows:
(i) Building the algebraic model of the problem, i.e. expressing the barrel volume V as a function of t, requires understanding the relations between variables and building the proper function.
(ii) Building the geometric model of the problem and representing it with the aid of DGS, requires an understanding of geometry and analyzing – the kind of ruler – compass construction. This subject is not included in Israel’s curriculum.
(iii) creating the appropriate graph of the function enables one to investigate how its shape as defined by the parameters, influences the barrel maximal volume.
Thus there are connections within mathematics like: function and graphs; geometry; technology and calculus, as well as to every-day life and to the historical background.
6.6 Mathematics for all students. Solving Kepler’s wine problem with the DGS, enables teachers to adapt the task to different
students. The more able students can be exposed to a advanced task such as analyzing the geometry construction and translating it to use the software, while less able students can lean upon these results, build the graph of the function, watch it on the screen and read the solution from the graph. Students who are easily distracted may focus more intently on computer tasks, while those who have organizational difficulties may benefit from the constraints imposed by computer environment. Therefore students who have trouble with basic procedures in basic mathematical concepts can still develop and demonstrate an understanding of mathematics, which in turn can eventually help them learn the basics.
7. Suggested Activities for Teachers As an instructor in an advanced course in a program aimed to qualify in-service teachers as
teachers'-educators, I find it important to be involved in mathematical research. Hence, I decided to expose the teachers to the problem and let them share my enthusiasm of the mathematical research in a Dynamic Geometry Environment. The message was to call them to experience in mathematical research as an important tool for becoming a teachers’ educator.

After the teachers were exposed to the tasks that were modified to them (see example in the appendix), they were asked to develop, each of them, a mathematical project. They chose problem from the curriculum and started a mathematical exploration. They are in an on-going process so it is pre mature to have any conclusions.
Appendix Activity 2 Among all cylinders with the same measure of the diagonal (λ) of half the cylinder, find the
cylinder of maximal volume (Fig.12).
1. Analyze the construction 2. Present the problem utilizing DGS. 3. Describe the construction. 4. Plot a graph of V (the volume of the cylinder) as a function of t – the ratio
between its sides. 5. Answer the question above using the obtained graph. 6. Verify your solution with other mathematical tools.
ACKNOWLEDGEMENT: I would like to thank Dr. Alla Shmukler for her support and
invaluable suggestions remarks on the early draft of this manuscript. REFERENCES - Brown S. I. &Walter m. I.(1990) The Art of Problem posing, Lawrence Erlbaum associates
Publishers - Bruckheimer M. & Arcavi A.( 2001), A Herrick Among Mathematicians or Dynamic
Geometry as an Aid to Proof, International Journal of Computers for Mathematical Learning, 6, pp. 113-126
- Goldberg P.(1996), Connected Geometry, Everyday Learning Corporation, Chicago, Illinois, U.S.A.
- Purdy C.D.(2000), Using the Geometer’s Sketchpad to Visualize Maximum-Volume Problems, Mathematics Teacher 93(3).
- Sacham Z. & Shmukler A.(2000), Secret of the Austrian Barrel, Paper presented in the annual conference, (in Hebrew)
- Tikhomirov V.M.(1990), Stories about Maxima and Minima, Translated from the Russian by Abe Shenitzer, Amer. Soc. And Math. Assos. Of America.
- www.nctm.org (the official site of the NCTM).
B
Figure 12
F
D
A
E
λ 2r λ
G